Administración masiva de fármacos para el paludismo
Referencias
References to studies included in this review
References to studies excluded from this review
Additional references
Characteristics of studies
Characteristics of included studies [ordered by study ID]
Ir a:
| Methods | Dates of study: 1957‐1959 Location of study: Nigeria Malaria endemicity (prevalence): Intervention group 1 (Arugungu ‐ June 1958): 28% in children 1‐10 years; 29% in children 0‐15 years [Moderate]. Intervention group 1 (Gulmare and Koei ‐ October 1957): 64% in children 1‐10 years; 58.3% in children 0‐15 years [High]. Transmission season: June to October Malaria species: P. falciparum, P. malariae Vector species: A. gambiae, A. funestus Study design: Uncontrolled before‐and‐after study Evaluation design: Cross‐sectional surveys | |
| Participants | Age groups included: All ages Sample size Intervention group 1 (mean): 10,000 Intervention group 2 (mean): 1300 | |
| Interventions | Intervention group 1 (Arugungu): MDA to all persons with chloroquine 600 mg and pyrimethamine 25 mg given monthly from June to October 1958. Coverage not specified. Co‐intervention with IRS. Intervention group 2 (Gulmare and Koei): MDA to all persons with chloroquine 600 mg and pyrimethamine 25 mg given every six months (November 1957, May 1958, November 1958 and March 1959). Coverage not specified. Co‐intervention with IRS. | |
| Outcomes | Parasitaemia prevalence Gametocytaemia prevalence No adverse event surveillance conducted Adverse events reported: "There were substantial difficulties with toddlers taking chloroquine and a number of them vomited that drug." | |
| Notes | MDA added to IRS programme. The outcomes for intervention groups 1 and 2 were assessed in a sub‐sample of the treated population. A third intervention group received only pyrimethamine 25 mg but was not included in the meta‐analysis due to reports of rapid development of resistance. | |
| Risk of bias | ||
| Bias | Authors' judgement | Support for judgement |
| Random sequence generation (selection bias) | High risk | No comparison group |
| Allocation concealment (selection bias) | High risk | No comparison group |
| Baseline imbalance (selection bias) | High risk | No comparison group |
| Contamination protection | High risk | No comparison group |
| Blinding of participants and personnel (performance bias) | High risk | No comparison group |
| Blinding of outcome assessment (detection bias) | High risk | No comparison group |
| Incomplete outcome data (attrition bias) | Low risk | The highest number of confirmed absentees reported by the investigators in September 1958 in Argungu was only 625 (6%). |
| Selective reporting (reporting bias) | High risk | The number of children examined varied greatly between surveys without any explanation and a very small number of children were examined in Arugungu. |
| Other bias | High risk | Anecdotes of ill effects began to circulate and there was evidence of 'palming' of tablets. |
| Methods | Dates of study: 1960‐1961 Location of study: Cameroon Malaria endemicity (prevalence): Intervention group 1: 20% in children 2‐9 years [Moderate]; 13% in all ages. Intervention group 2: 76% in children 2‐9 years; 65% in all ages [High]. Transmission season: May to June, November to December Malaria species: P. falciparum, P. malariae Vector species: A. gambiae, A. funestus Study design: Uncontrolled before‐and‐after study Evaluation design: Cross‐sectional surveys | |
| Participants | Age groups included: Ages > 3 months Sample size Intervention group 1 (mean): 22,500 Intervention group 2 (mean): 7000 | |
| Interventions | Intervention group 1 (Secteur Sud): MDA administered to all persons aged > 3 months with chloroquine 600 mg and pyrimethamine 50 mg once for two rounds in July and November 1960. Coverage 76‐92%. Co‐intervention with IRS using DDT. Intervention group 2 (Secteur Nord): MDA administered to all persons aged > 3 months with chloroquine 600 mg and pyrimethamine 50 mg once for one round in November 1960. Coverage approximately 100%. Co‐intervention with IRS using DDT. | |
| Outcomes | Parasitaemia prevalence No adverse event surveillance conducted No adverse events reported | |
| Notes | Data presented in Table XV was used in the meta‐analysis. Parasitaemia prevalence results only presented for children > 3 months to 9 years of age; meta‐analysis includes only first round data. Only 13 mixed infections of P. falciparum and P. malariae were found. The remaining were P. falciparum infections only. | |
| Risk of bias | ||
| Bias | Authors' judgement | Support for judgement |
| Random sequence generation (selection bias) | High risk | No comparison group |
| Allocation concealment (selection bias) | High risk | No comparison group |
| Baseline imbalance (selection bias) | High risk | No comparison group |
| Contamination protection | High risk | No comparison group |
| Blinding of participants and personnel (performance bias) | High risk | No comparison group |
| Blinding of outcome assessment (detection bias) | High risk | No comparison group |
| Incomplete outcome data (attrition bias) | Unclear risk | Insufficient reporting of attrition/exclusions to permit judgement. No reasons for missing data provided. |
| Selective reporting (reporting bias) | Unclear risk | Insufficient information to permit judgement |
| Other bias | Low risk | No other bias detected |
| Methods | Dates of study: 1965‐1968 Location of study: Panama Malaria endemicity (prevalence): 17.4% in all ages [Moderate] Transmission season: Rainy season late May to late December Malaria species: P. falciparum, P. vivax Vector species: Not specified Study design: Uncontrolled before‐and‐after study Evaluation design: Cross‐sectional surveys | |
| Participants | Age groups included: Ages > 6 months Sample size Intervention group 1 mean (range): 1709 (1548 ‐ 1908) | |
| Interventions | Intervention group 1 (Valle del Rio Sambu): MDA to all persons aged > 6 months with pyrimethamine 50 mg (cycles 1‐25)/ 75 mg (cycles 26‐49) and primaquine 40 mg given every 2 weeks for 2 years from August 1966 to April 1968. Coverage 61‐87%. No co‐interventions. | |
| Outcomes | Parasitaemia prevalence No adverse event surveillance conducted Adverse events reported: The acceptance of drugs by the population was excellent. Complaints of nausea and headache were reported, but no other serious side effects were described. None of the people who complained of headaches or nausea refused to take the medicine in subsequent cycles. The number of people who refused to take the medicine was < 1% of the population covered by the programme. | |
| Notes | No post‐intervention data | |
| Risk of bias | ||
| Bias | Authors' judgement | Support for judgement |
| Random sequence generation (selection bias) | High risk | No comparison group |
| Allocation concealment (selection bias) | High risk | No comparison group |
| Baseline imbalance (selection bias) | High risk | No comparison group |
| Contamination protection | High risk | No comparison group |
| Blinding of participants and personnel (performance bias) | High risk | No comparison group |
| Blinding of outcome assessment (detection bias) | High risk | No comparison group |
| Incomplete outcome data (attrition bias) | Low risk | Coupon system used to track patients; all persons included in the surveys. |
| Selective reporting (reporting bias) | Low risk | All intended outcomes reported |
| Other bias | Low risk | No other bias detected |
| Methods | Dates of study: 2002‐2007 Location of study: Venezuela Malaria endemicity (incidence): 22/1000 monthly incidence in all ages Transmission season: November Malaria species: P. vivax Vector species: Not specified Study design: Uncontrolled before‐and‐after study Evaluation design: Passive surveillance | |
| Participants | Age groups included: Ages > 6 months; non‐pregnant Sample size Intervention group 1: 25,722 | |
| Interventions | Intervention group 1 (6 municipalities in Estado Sucre): MDA to all non‐pregnant persons aged >6 months with chloroquine 25 mg/kg administered over 3 days and primaquine 3.5 mg/kg administered over 7 days in November 2002. Coverage 77% (of census)/ 86% (of included). No co‐intervention specified. | |
| Outcomes | Parasitaemia incidence No adverse event surveillance conducted No adverse events reported | |
| Notes | MDA done in setting of an outbreak | |
| Risk of bias | ||
| Bias | Authors' judgement | Support for judgement |
| Random sequence generation (selection bias) | High risk | No comparison group |
| Allocation concealment (selection bias) | High risk | No comparison group |
| Baseline imbalance (selection bias) | High risk | No comparison group |
| Contamination protection | High risk | No comparison group |
| Blinding of participants and personnel (performance bias) | High risk | No comparison group |
| Blinding of outcome assessment (detection bias) | High risk | No comparison group |
| Incomplete outcome data (attrition bias) | Low risk | Passive surveillance of large municipalities after one round of treatment |
| Selective reporting (reporting bias) | Low risk | No evidence of selective reporting |
| Other bias | Low risk | No other bias detected |
| Methods | Dates of study: 1959‐1960 Location of study: Uganda Malaria endemicity (prevalence): 34% in children 2‐9 years; 17% in all ages [Moderate] Transmission season: Rainy season April to May, August to November Malaria species: P. falciparum, P. malariae Vector species: A. gambiae, A. funestus Study design: Uncontrolled before‐and‐after study Evaluation design: Cross‐sectional surveys | |
| Participants | Age groups included: All ages Sample size Intervention group 1 mean (range): 30,384 (10,303 ‐ 59,605) | |
| Interventions | Intervention group 1 (North Kigezi): MDA administered to all persons with chloroquine 600 mg and pyrimethamine 50 mg every three months for four rounds at the time of IRS application from May 1959 to May 1960. Coverage 80%. Co‐intervention with IRS. | |
| Outcomes | Parasitaemia prevalence Gametocytaemia prevalence No adverse event surveillance conducted No adverse events reported | |
| Notes | Outcomes assessed in a sub‐sample of the treated population. | |
| Risk of bias | ||
| Bias | Authors' judgement | Support for judgement |
| Random sequence generation (selection bias) | High risk | No comparison group |
| Allocation concealment (selection bias) | High risk | No comparison group |
| Baseline imbalance (selection bias) | High risk | No comparison group |
| Contamination protection | High risk | No comparison group |
| Blinding of participants and personnel (performance bias) | High risk | No comparison group |
| Blinding of outcome assessment (detection bias) | High risk | No comparison group |
| Incomplete outcome data (attrition bias) | Low risk | Cooperation of the local inhabitants was remarkably good and not a single dwelling was left unsprayed |
| Selective reporting (reporting bias) | Low risk | Increased number of samples from hyperendemic areas in the post‐intervention survey |
| Other bias | Low risk | No other bias detected |
| Methods | Dates of study: 1960 Location of study: Uganda Malaria endemicity (prevalence): 23% in children 2‐9 years; 21% in all ages [Moderate] Transmission season: Rainy season April to May, August to November Malaria species: P. falciparum, P. malariae Vector species: A. gambiae Study design: Uncontrolled before‐and‐after study Evaluation design: Cross‐sectional surveys | |
| Participants | Age groups included: Ages > 3 months Sample size Intervention group 1 (mean): 16,000 | |
| Interventions | Intervention group 1 (Lake Bunyonyi): MDA to all persons aged > 3 months with chloroquine 600 mg and pyrimethamine 50 mg once per round for two rounds (April to May 1960 and September to October 1960). Coverage approximately 50% in the first round. Co‐intervention with IRS. | |
| Outcomes | Parasitaemia prevalence No adverse event surveillance conducted No adverse events reported | |
| Notes | Outcomes assessed in a sub‐sample of the treated population. A. funestus disappeared after one year of spraying and no new malaria cases were noted two years later. | |
| Risk of bias | ||
| Bias | Authors' judgement | Support for judgement |
| Random sequence generation (selection bias) | High risk | No comparison group |
| Allocation concealment (selection bias) | High risk | No comparison group |
| Baseline imbalance (selection bias) | High risk | No comparison group |
| Contamination protection | High risk | No comparison group |
| Blinding of participants and personnel (performance bias) | High risk | No comparison group |
| Blinding of outcome assessment (detection bias) | High risk | No comparison group |
| Incomplete outcome data (attrition bias) | Unclear risk | Insufficient detail, but the total number surveyed differs greatly between surveys |
| Selective reporting (reporting bias) | Low risk | All relevant outcomes were measured |
| Other bias | High risk | Only about half of the population was given MDA during the first round |
| Methods | Dates of study: 1960‐1961 Location of study: Burkina Faso Malaria endemicity (prevalence): Comparison group 1: 56.1% in children 0‐10 years [High] Transmission season: June to December Malaria species: P. falciparum, P. ovale, P. malariae Vector species: A. gambiae, A. funestus, A. nili Study design: Non‐randomized controlled study Evaluation design: Cross‐sectional surveys | |
| Participants | Age group included: All ages Sample size Intervention group 1 (mean): 1890 Intervention group 2 (mean): 2560 Intervention group 3 (mean): 5400 Intervention group 4 (mean): 3490 Comparison group 1 (mean): Not described Comparison group 2 (mean): Not described | |
| Interventions | Intervention group 1: MDA to all persons with a single dose of either chloroquine‐primaquine (600 mg/15 mg) or amodiaquine‐primaquine (600 mg/15 mg) every 28 days from June to December 1960. Coverage 75.2 to 91.2%. No co‐interventions. Intervention group 2: MDA to all persons with a single dose of either chloroquine‐primaquine (600 mg/15 mg) or amodiaquine‐primaquine (600 mg/15 mg) every 14 days from June to December 1960. Coverage 84.1 to 96.5%. No co‐interventions. Intervention group 3: MDA to all persons with a single dose of either chloroquine‐primaquine (600 mg/15 mg) or amodiaquine‐primaquine (600 mg/15 mg) every 28 days from June to December 1960. Coverage 80.9 to 91.8%. Co‐intervention with IRS using DDT annually. Intervention group 4: MDA to all persons with a single dose of either chloroquine‐primaquine (600 mg/15 mg) or amodiaquine‐primaquine (600 mg/15 mg) every 14 days from June to December 1960. Coverage 82.1 to 93.8%. Co‐intervention with IRS using DDT annually. Comparison group 1: Control villages. No co‐interventions. Comparison group 2: Villages sprayed with IRS using DDT annually. No other co‐interventions. | |
| Outcomes | Parasitaemia prevalence Gametocytaemia prevalence No adverse event surveillance conducted No adverse events reported | |
| Notes | Outcomes assessed in a sub‐sample of the treated population (children 0‐10 years). Baseline data from June 1960 survey. Ninety percent of cases are P. falciparum infections; P. ovale is rare and P. malariae is very rare. | |
| Risk of bias | ||
| Bias | Authors' judgement | Support for judgement |
| Random sequence generation (selection bias) | High risk | Assignment to MDA was not randomized although drug assignment was randomized |
| Allocation concealment (selection bias) | High risk | Non‐randomized controlled study |
| Baseline imbalance (selection bias) | High risk | Baseline parasitaemia estimates are not balanced between the intervention groups and the comparison groups. Also, there was large variability in endemicity between comparison group 1 villages. |
| Contamination protection | Unclear risk | Insufficient information to permit judgement |
| Blinding of participants and personnel (performance bias) | Unclear risk | Participants and personnel aware of treatment, but unclear if this impacted outcomes |
| Blinding of outcome assessment (detection bias) | Unclear risk | Not blinded, but unclear if this impacted outcomes |
| Incomplete outcome data (attrition bias) | Low risk | Adults included in MDA, but not in the evaluation. Only children 0‐10 years of age were examined in the malaria surveys before, during and after MDA. |
| Selective reporting (reporting bias) | Low risk | All pre‐specified outcomes of interest are reported |
| Other bias | Unclear risk | Atypical seasonal changes experienced in 1959‐1960, but it is unclear if these changes impacted outcomes. |
| Methods | Dates of study: 1956‐1957 Location of study: Venezuela Malaria endemicity (incidence): 0.4/1000 baseline monthly incidence Transmission season: May to November Malaria species: P. vivax Vector species: A. aquasalis, A. nuneztovari Study design: Uncontrolled before‐and‐after study Evaluation design: Active and passive surveillance | |
| Participants | Age groups included: Ages > 1 month Sample size Intervention group 1 (mean): 111,995 | |
| Interventions | Intervention group 1: Eastern Venezuela (174 localities, 3084 houses, 16,416 persons) and Western Venezuela (735 localities, 17,638 houses, 95,579 persons): MDA to all persons aged > 1 month with pyrimethamine 50 mg per week for 24 weeks from July 1957 to December 1957. Coverage not specified. Co‐intervention with IRS. | |
| Outcomes | Parasitaemia incidence No adverse event surveillance conducted No adverse events reported | |
| Notes | MDA added to IRS program | |
| Risk of bias | ||
| Bias | Authors' judgement | Support for judgement |
| Random sequence generation (selection bias) | High risk | No comparison group |
| Allocation concealment (selection bias) | High risk | No comparison group |
| Baseline imbalance (selection bias) | High risk | No comparison group |
| Contamination protection | High risk | No comparison group |
| Blinding of participants and personnel (performance bias) | High risk | No comparison group |
| Blinding of outcome assessment (detection bias) | High risk | No comparison group |
| Incomplete outcome data (attrition bias) | Low risk | All houses numbered. Envelope system for drug dispensers and slide collectors. Cooperation of the people was excellent. Active search for all infections and passive search at all medical dispensaries in the area. |
| Selective reporting (reporting bias) | Low risk | Most persons received more than 19 treatments; however, the actual figures are not reported due to "lack of mechanical tabulation of the data". The number of persons with relapses who had less than 19 treatments demonstrated similar trends to those who received 19 or more treatments. |
| Other bias | Low risk | No other bias detected |
| Methods | Dates of study: 1981‐1982 Location of study: Nicaragua Malaria endemicity (incidence): 0.4/1000 baseline monthly incidence Transmission season: November to March Malaria species: P. falciparum, P. vivax Vector species: A. albimanus Study design: Uncontrolled before‐and‐after study Evaluation design: Passive surveillance | |
| Participants | Age groups included: Ages > 1 year Sample size Intervention group 1 (mean): 2,300,000 | |
| Interventions | Intervention group 1: MDA administered to all persons aged > 1 year with chloroquine 1500 mg and primaquine 45 mg over three days given once to the entire population of Nicaragua in November 1981. Coverage 70‐80%. Co‐intervention with larviciding using large scale application of temephos to peridomiciliary breeding sites targeting Aedes aegypti, but likely to have an effect on anophelines. | |
| Outcomes | Parasitaemia incidence No adverse event surveillance conducted Adverse events reported: Common side effects included dizziness, nausea, vomiting and diarrhoea. Occasional cases of psychomotor disturbance, temporary psychological abnormalities and haemolysis. | |
| Notes | Data used in the meta‐analysis was extrapolated from graphs presented in the text; baseline MDA estimates were determined using monthly surveillance data from 1974‐1981. | |
| Risk of bias | ||
| Bias | Authors' judgement | Support for judgement |
| Random sequence generation (selection bias) | High risk | No comparison group |
| Allocation concealment (selection bias) | High risk | No comparison group |
| Baseline imbalance (selection bias) | High risk | No comparison group |
| Contamination protection | High risk | No comparison group |
| Blinding of participants and personnel (performance bias) | High risk | No comparison group |
| Blinding of outcome assessment (detection bias) | High risk | No comparison group |
| Incomplete outcome data (attrition bias) | Low risk | Single treatment episode after conducting a census, door‐to‐door education and promotion of community participation. |
| Selective reporting (reporting bias) | Low risk | National passive surveillance |
| Other bias | Low risk | No other bias detected |
| Methods | Dates of study: 1952 Location of study: Morocco Malaria endemicity (prevalence): 41.5% in all ages (baseline) [High] Transmission season: June to October Malaria species: P. falciparum, P. vivax Vector species: Not specified Study design: Uncontrolled before‐and‐after study Evaluation design: Cross‐sectional surveys | |
| Participants | Age groups included: All ages Sample size: Intervention group 1 (mean): 3000 | |
| Interventions | Intervention group 1: MDA administered to all persons with amodiaquine 600 mg given once in the summer of 1952. Coverage not specified. No co‐interventions. | |
| Outcomes | Parasitaemia prevalence No adverse event surveillance conducted No adverse events reported | |
| Notes | ||
| Risk of bias | ||
| Bias | Authors' judgement | Support for judgement |
| Random sequence generation (selection bias) | High risk | No comparison group |
| Allocation concealment (selection bias) | High risk | No comparison group |
| Baseline imbalance (selection bias) | High risk | No comparison group |
| Contamination protection | High risk | No comparison group |
| Blinding of participants and personnel (performance bias) | High risk | No comparison group |
| Blinding of outcome assessment (detection bias) | High risk | No comparison group |
| Incomplete outcome data (attrition bias) | Unclear risk | Insufficient information to permit judgement |
| Selective reporting (reporting bias) | Unclear risk | Insufficient information to permit judgement |
| Other bias | Low risk | No other bias detected |
| Methods | Dates of study: 1984‐1985 Location of study: Malaysia Malaria endemicity (prevalence): Intervention group 1 (December 1984 baseline survey): 46.3% in children 0‐8 years [High]; Intervention group 2 (December 1984 baseline survey): 55.6% in children 0‐8 years [High] Transmission season: Perennial Malaria species: P. falciparum, P. malariae, P. vivax Vector species: A. balabacensis Study design: Uncontrolled before‐and‐after study Evaluation design: Cross‐sectional surveys and active surveillance | |
| Participants | Age groups included: All ages Sample size Intervention group 1 (mean): 754 Intervention group 2 (mean): 148 | |
| Interventions | Intervention group 1: MDA administered to all persons (139 households in five villages) with sulfadoxine‐pyrimethamine (1500 mg/75 mg) and primaquine 30 mg once in December 1984 to January 1985. Coverage 87%. Co‐intervention with permethrin‐impregnated bed nets to all households. Intervention group 2: MDA administered to all persons (nine households in one village) with sulfadoxine‐pyrimethamine (1500 mg/75 mg) and primaquine 30 mg once in December 1984 to January 1985. Coverage 76%. No co‐interventions. | |
| Outcomes | Parasitaemia prevalence Parasitaemia incidence Gametocytaemia prevalence No adverse event surveillance conducted No adverse events reported | |
| Notes | Though the entire population was treated, thick and thin blood films were collected during eight surveys on a population of 286 children aged 0‐8 years. Only data for these children were reported and therefore used in the meta‐analysis. Furthermore, because the study design included a comparison group that received MDA, the intervention and comparison groups will be treated as two intervention groups and each intervention group will be analyzed in the meta‐analysis as a separate uncontrolled before‐and‐after study. Lastly, due to insufficient information to extract incidence data, parasitaemia incidence was not included as an outcome in the meta‐analysis. | |
| Risk of bias | ||
| Bias | Authors' judgement | Support for judgement |
| Random sequence generation (selection bias) | High risk | No comparison group |
| Allocation concealment (selection bias) | High risk | No comparison group |
| Baseline imbalance (selection bias) | High risk | No comparison group |
| Contamination protection | High risk | No comparison group |
| Blinding of participants and personnel (performance bias) | High risk | No comparison group |
| Blinding of outcome assessment (detection bias) | High risk | No comparison group |
| Incomplete outcome data (attrition bias) | High risk | Though the entire population was treated, thick and thin blood films were collected during eight surveys on a population of 286 children aged 0‐8 years. Only 29.7% of children were present at every one of the eight sessions. |
| Selective reporting (reporting bias) | High risk | The study report fails to include results on P. vivax infections that would be expected to have been reported for such a study. The study methods indicate that thick blood films will be classified as "positive or negative for asexual and/or sexual parasites of either P. falciparum, P. vivax, P. malariae, or mixed infections". Only parasitological findings for P. falciparum are described and presented in detail. |
| Other bias | Low risk | With the exception of two study villages, which are both intervention group 1 sites, the study villages are "well separated and demarcated". Therefore, it is unlikely that contamination between sites occurred. All villages also received the same treatment dose and schedule. However, it should be noted that in the meta‐analysis, the two interventions were analyzed as two separate uncontrolled before‐and‐after studies. |
| Methods | Dates of study: 1953 Location of study: Morocco Malaria endemicity (prevalence): 14.3%, children only (August 1953 baseline survey) [Moderate] Transmission season: July to November Malaria species: P. falciparum, P. malariae, P. vivax Vector species: Not specified Study design: Uncontrolled before‐and‐after study Evaluation design: Cross‐sectional surveys | |
| Participants | Age groups included: All ages Sample size Intervention group 1 (mean): 9999 | |
| Interventions | Intervention group 1: MDA administered to all persons with pyrimethamine 100 mg once in June 1953 to September 1953. Coverage not specified. Co‐intervention with IRS prior to MDA. | |
| Outcomes | Parasitaemia prevalence Gametocytaemia prevalence No adverse event surveillance conducted No adverse events reported | |
| Notes | Only results from the 147 children examined were included in the meta‐analysis. | |
| Risk of bias | ||
| Bias | Authors' judgement | Support for judgement |
| Random sequence generation (selection bias) | High risk | No comparison group |
| Allocation concealment (selection bias) | High risk | No comparison group |
| Baseline imbalance (selection bias) | High risk | No comparison group |
| Contamination protection | High risk | No comparison group |
| Blinding of participants and personnel (performance bias) | High risk | No comparison group |
| Blinding of outcome assessment (detection bias) | High risk | No comparison group |
| Incomplete outcome data (attrition bias) | High risk | While adults were included in MDA, only a subset of children were included in the evaluation. |
| Selective reporting (reporting bias) | Unclear risk | Insufficient information to permit judgement |
| Other bias | High risk | No data on coverage of intervention |
| Methods | Dates of study: 1952‐1953 Location of study: Kenya Malaria endemicity (prevalence): 34.8% (baseline survey in a random sample of adults and infants); 32.6% (baseline survey in school children) [Moderate] Transmission season: January to March, May to August Malaria species: P. falciparum, P. malariae Vector species: A. gambiae, A. funestus Study design: Uncontrolled before‐and‐after study Evaluation design: Cross‐sectional surveys | |
| Participants | Age groups included: All ages Sample size Intervention group 1 (mean): 3721 (including 297 school children) | |
| Interventions | Intervention group 1: MDA administered to all persons in Makueni with pyrimethamine 100 mg once for three rounds in September 1952, March 1953 and September 1953. Coverage not specified. No co‐interventions. | |
| Outcomes | Parasitaemia prevalence No adverse event surveillance conducted No adverse events reported | |
| Notes | Following the first MDA round, blood smears were taken from random samples of the adult and infant (< 5 years) population and from all school children for a year. Due to the high degree of resistance that developed following two MDA rounds, parasitaemia prevalence results in the meta‐analysis reflect only first round MDA results for infants and adults. | |
| Risk of bias | ||
| Bias | Authors' judgement | Support for judgement |
| Random sequence generation (selection bias) | High risk | No comparison group |
| Allocation concealment (selection bias) | High risk | No comparison group |
| Baseline imbalance (selection bias) | High risk | No comparison group |
| Contamination protection | High risk | No comparison group |
| Blinding of participants and personnel (performance bias) | High risk | No comparison group |
| Blinding of outcome assessment (detection bias) | High risk | No comparison group |
| Incomplete outcome data (attrition bias) | Low risk | Individual data kept of all school children and of all subjects with malaria attending the dispensary |
| Selective reporting (reporting bias) | Low risk | Blood smears collected from random samples of adults and infants and of all school children monthly for a year following the first MDA round. All pre‐specified outcomes have been reported. |
| Other bias | High risk | Complicated by resistance |
| Methods | Dates of study: 1952‐1953 Location of study: Kenya Malaria endemicity (prevalence): Intervention group 1 (September 1952): 60% in school‐age children; Comparison group 1 (September 1953): 34% in school‐age children [Moderate] Transmission season: January to March, May to August Malaria species: P. falciparum, P. malariae, P. vivax Vector species: A. gambiae, A. funestus Study design: Non‐randomized controlled study Evaluation design: Cross‐sectional surveys | |
| Participants | Age groups included: All ages; school‐age children Sample size Intervention group 1 (range): 3721‐4500 Comparison group 1: Not specified | |
| Interventions | Intervention group 1: MDA administered to all school children in Makueni with pyrimethamine 100 mg for three rounds in September 1952, March 1953 and September 1953. Coverage not specified. No co‐interventions. Comparison group 1: School children in Okia used as a comparison arm. No co‐interventions. | |
| Outcomes | Parasitaemia prevalence Gametocytaemia prevalence No adverse event surveillance conducted No adverse events reported | |
| Notes | Outcome data for the intervention group is a subset of the Jones 1954 KEN study. The meta‐analysis only included first‐round results. Gametocytaemia prevalence data is forP. falciparum only. | |
| Risk of bias | ||
| Bias | Authors' judgement | Support for judgement |
| Random sequence generation (selection bias) | High risk | Non‐randomized controlled study |
| Allocation concealment (selection bias) | High risk | Non‐randomized controlled study |
| Baseline imbalance (selection bias) | High risk | Baseline parasitaemia estimates are not balanced between the intervention group and the comparison group. |
| Contamination protection | Unclear risk | Although the comparison group site was 13 miles from the intervention group site, there is no indication whether the control group was adequately protected against contamination. It is quite possible that the control group received the intervention. |
| Blinding of participants and personnel (performance bias) | Unclear risk | Participants and personnel aware of treatment, but unclear if this impacted outcomes |
| Blinding of outcome assessment (detection bias) | Unclear risk | Not blinded, but unclear if this impacted outcomes |
| Incomplete outcome data (attrition bias) | Low risk | Individual data kept of all school‐age children and of all subjects with malaria attending the dispensary. No antimalarials were sold in local shops. At the end of the 12th month of evaluation, 221 children remained out of the original 297 children. |
| Selective reporting (reporting bias) | Low risk | Blood smears from random samples and all school‐age children. Over the course of the study, the school population rose by 178 children. To avoid confusion, the investigators excluded these additional children from the figures used to compile prevalence and only reported data from the original 297 children. |
| Other bias | High risk | Complicated by drug resistance |
| Methods | Dates of study: 1991‐1999 Location of study: Vanuatu Malaria endemicity (prevalence): Intervention group 1 (January ‐ September 1991): 15.7% in all ages; Comparison group 1 (May 1990): 28.8% in all ages [Moderate]. Transmission season: December to April Malaria species:P. falciparum, P. vivax Vector species: A. farauti Study design: Non‐randomized controlled study Evaluation design: Cross‐sectional surveys | |
| Participants | Age groups included: All ages Sample size Intervention group 1 (mean): 718 Comparison group 1 (mean): 19,289 | |
| Interventions | Intervention group 1: MDA administered to all persons in Aneityum weekly for nine weeks with chloroquine 600 mg and sulfadoxine‐pyrimethamine 1500 mg/75 mg and primaquine 45 mg once a week in weeks 1, 5, and 9; chloroquine 300 mg and primaquine 45 mg once a week in weeks 2, 3, 4, 6, 7, and 8 in September 1991 to November 1991. Coverage 79 to 92%. Co‐intervention with larvivorous fish in several identified breeding sites and universal coverage with insecticide treated bed nets (about 0.94 nets per villager). Comparison group 1: Persons living in Malakula Island. Co‐intervention with bed nets (approximately 20% coverage). | |
| Outcomes | Parasitaemia prevalence No adverse event surveillance conducted Adverse events reported: Some villagers reported vomiting after taking the tablets. | |
| Notes | Another village on Futana island was included in the study for comparison; however, because no parasitaemia was detected in the two surveys on Futuna, it was excluded from the meta‐analysis. The meta‐analysis only included data from Aneityum for the months of January and September 1991 (before MDA) and March 1998 (post‐MDA). | |
| Risk of bias | ||
| Bias | Authors' judgement | Support for judgement |
| Random sequence generation (selection bias) | High risk | Non‐randomized controlled study |
| Allocation concealment (selection bias) | High risk | Non‐randomized controlled study |
| Baseline imbalance (selection bias) | Low risk | According to investigators, "the parasite rates were initially similar on Aneityum and Malakula islands and in general, decreased with age". |
| Contamination protection | Low risk | The comparison group was a village from Malakula, an adjacent island; therefore, it is unlikely that the comparison group received the intervention. |
| Blinding of participants and personnel (performance bias) | Unclear risk | Not blinded, but unclear if this impacted outcomes |
| Blinding of outcome assessment (detection bias) | Unclear risk | Not blinded, but unclear if this impacted outcomes |
| Incomplete outcome data (attrition bias) | Low risk | Only 7.9% of doses unable to be administered and only 3.8% doses were not properly reported and could not be confirmed. The overall calculated compliance rate of the remaining doses was 88.3%. |
| Selective reporting (reporting bias) | High risk | Of the 13 surveys, two covered only school children whereas the other 11 surveys covered the entire population of Aneityum. |
| Other bias | Low risk | No other bias detected |
| Methods | Dates of study: 1930 Location of study: Palestine (known as British Mandate Palestine at the time of the study's publication) Malaria endemicity (prevalence): 35% in all ages; 67% in children 2‐10 years [High] Transmission season: October to December Malaria species:P. falciparum, P. malariae, P. vivax Vector species: A. elutus Study design: Uncontrolled before‐and‐after study Evaluation design: Cross‐sectional surveys and active surveillance | |
| Participants | Age groups included: All ages Sample size Intervention group 1 mean (range): 953 (899‐993) | |
| Interventions | Intervention group 1: MDA administered to all persons in five selected villages with plasmochine 30 mg plus quinine 900 mg twice daily for five days every three weeks for three rounds between September and November 1930. Coverage 78.8%. No co‐interventions. | |
| Outcomes | Parasitaemia prevalence Gametocytaemia prevalence Adverse event surveillance conducted (active during the course of the treatment) Adverse events reported: No ill results were noted during the entire course of treatment. | |
| Notes | Noted that repeated treatments tended to increase resistance. | |
| Risk of bias | ||
| Bias | Authors' judgement | Support for judgement |
| Random sequence generation (selection bias) | High risk | No comparison group |
| Allocation concealment (selection bias) | High risk | No comparison group |
| Baseline imbalance (selection bias) | High risk | No comparison group |
| Contamination protection | High risk | No comparison group |
| Blinding of participants and personnel (performance bias) | High risk | No comparison group |
| Blinding of outcome assessment (detection bias) | High risk | No comparison group |
| Incomplete outcome data (attrition bias) | High risk | There was a large drop in the number of villages surveyed from baseline to post‐survey without any explanation. |
| Selective reporting (reporting bias) | High risk | Five villages were treated but only select villages reported outcome data. |
| Other bias | Low risk | No other bias detected |
| Methods | Dates of study: 1981 Location of study: India Malaria endemicity (incidence): 4/1000 baseline monthly incidence Transmission season; April to August Malaria species: P. falciparum, P. vivax Vector species: Not specified Study design: Uncontrolled before‐and‐after study Evaluation design: Passive surveillance | |
| Participants | Age groups included: All ages Sample size Intervention group 1 (mean): 51,325 | |
| Interventions | Intervention group 1: MDA administered to all persons with chloroquine 600 mg (plus primaquine 45 mg in falciparum areas only) for one round in March to May 1981 in four primary health centres and two rounds in February to March 1981 and June to September 1981 in four other primary health centres. Coverage 85%. Co‐intervention with IRS. | |
| Outcomes | Parasitaemia incidence No adverse event surveillance conducted No adverse events reported | |
| Notes | ||
| Risk of bias | ||
| Bias | Authors' judgement | Support for judgement |
| Random sequence generation (selection bias) | High risk | No comparison group |
| Allocation concealment (selection bias) | High risk | No comparison group |
| Baseline imbalance (selection bias) | High risk | No comparison group |
| Contamination protection | High risk | No comparison group |
| Blinding of participants and personnel (performance bias) | High risk | No comparison group |
| Blinding of outcome assessment (detection bias) | High risk | No comparison group |
| Incomplete outcome data (attrition bias) | Low risk | Only 1 or 2 rounds of treatment with 85% coverage |
| Selective reporting (reporting bias) | Unclear risk | No mention of the thoroughness of passive surveillance |
| Other bias | High risk | A likely increase inP. falciparum due to labour movement into treated area |
| Methods | Dates of study: 1955 Location of study: Taiwan Malaria endemicity (prevalence): 4.12% in all ages (May 1955 survey); 2.93% in all ages (November 1955) [Low] Transmission season: Not described Malaria species: P. falciparum, P. malariae, P. vivax Vector species: A. maculatus, A. minimus, A. sinensis Study design: Uncontrolled before‐and‐after study Evaluation design: Cross‐sectional surveys and passive surveillance | |
| Participants | Age groups included: All ages, except infants Sample size Intervention group 1 mean (range): 1520 (1502‐1537) | |
| Interventions | Intervention group 1: MDA administered to all persons, except infants, in Lanyu with a single dose of chloroquine (12 mg/kg) in November 1955. Coverage not specified. Co‐intervention with IRS using DDT. | |
| Outcomes | Parasitaemia prevalence No adverse event surveillance conducted No adverse events reported | |
| Notes | Post‐MDA (> 12 months) estimated using survey data from April‐May 1957 and April 1960 | |
| Risk of bias | ||
| Bias | Authors' judgement | Support for judgement |
| Random sequence generation (selection bias) | High risk | No comparison group |
| Allocation concealment (selection bias) | High risk | No comparison group |
| Baseline imbalance (selection bias) | High risk | No comparison group |
| Contamination protection | High risk | No comparison group |
| Blinding of participants and personnel (performance bias) | High risk | No comparison group |
| Blinding of outcome assessment (detection bias) | High risk | No comparison group |
| Incomplete outcome data (attrition bias) | Unclear risk | Insufficient reporting of attrition/exclusions to permit judgement |
| Selective reporting (reporting bias) | Low risk | The first three malariometric baseline surveys reported consisted of only a portion of the entire population on the island. Subsequent surveys examined all inhabitants. While these disproportionate samples could result in a certain bias when compared to the remaining surveys that comprised the entire population, the investigators weighted the first three surveys according to the natural distribution of the population. |
| Other bias | Low risk | No other bias detected |
| Methods | Dates of study: 1958‐1959 Location of study: Papua New Guinea Malaria endemicity (prevalence): 46‐80% in children 2‐11 years; 46% in all ages before spraying [High]; During spraying 13‐21% in children 2‐11 years; 12% in all ages [Moderate] Transmission season: Not described Malaria species: P. falciparum, P. malariae, P. vivax Vector species: A. punctulatus, A. farauti, A. koliensis Study design: Uncontrolled before‐and‐after study Evaluation design: Cross‐sectional surveys | |
| Participants | Age groups included: All ages Sample size Intervention group 1 (mean): 2500 | |
| Interventions | Intervention group 1 (Sentani): MDA administered to all persons in sprayed areas with chloroquine 450 mg plus pyrimethamine 50 mg at weekly intervals for five rounds in 1958 and for one round in 1959. Two villages with high absolute parasite rates received an additional round of treatment in 1959. In addition, during all rounds, positives received chloroquine for an additional three successive days, completing a full course (1350 mg base for adults). Coverage 90%. Co‐intervention with IRS. | |
| Outcomes | Parasite prevalence No adverse event surveillance conducted No adverse events reported | |
| Notes | Baseline data from 1958 survey | |
| Risk of bias | ||
| Bias | Authors' judgement | Support for judgement |
| Random sequence generation (selection bias) | High risk | No comparison group |
| Allocation concealment (selection bias) | High risk | No comparison group |
| Baseline imbalance (selection bias) | High risk | No comparison group |
| Contamination protection | High risk | No comparison group |
| Blinding of participants and personnel (performance bias) | High risk | No comparison group |
| Blinding of outcome assessment (detection bias) | High risk | No comparison group |
| Incomplete outcome data (attrition bias) | Low risk | 90% coverage, but no further description |
| Selective reporting (reporting bias) | Unclear risk | Selection for inclusion in surveys not described |
| Other bias | Low risk | No other bias detected |
| Methods | Dates of study: 1970‐1975 Location of study: Nigeria Malaria endemicity (prevalence): 46% in all ages [High] Transmission season: April to October Malaria species: P. falciparum, P. malariae, P. ovale Vector species: A. gambiae, A. funestus Study design: Non‐randomized controlled study Evaluation design: Cross‐sectional surveys and active surveillance | |
| Participants | Age groups included: All ages, but infants not included in MDA until their first malaria episode. Sample size Intervention group 1 (mean): 14,129 Intervention group 2 (mean): 1810 Comparison group 1 (mean): 32,828 Comparison group 2 (mean): ND | |
| Interventions | Intervention group 1 (Low frequency MDA+IRS group): MDA administered to all ages, except for infants who have not had their first malaria episode, with sulfalene‐pyrimethamine 500 mg/25 mg every 10 weeks from April 1972 to October 1973. Coverage 85%. Co‐intervention with IRS using propoxur 3‐4 rounds per year. Intervention group 2 (High frequency MDA+IRS group): MDA administered to all ages, except for infants who have not had their first malaria episode, with sulfalene‐pyrimethamine 500 mg/25 mg every two weeks during the wet season and every 10 weeks during the dry season from April 1972 to October 1973. Coverage 85%. Co‐intervention with IRS using propoxur 3‐4 rounds per year. Comparison group 1: IRS using propoxur 3‐4 rounds per year. Comparison group 2: No interventions. | |
| Outcomes | Parasitaemia prevalence Gametocytaemia prevalence Mortality No adverse event surveillance conducted No adverse events reported | |
| Notes | ||
| Risk of bias | ||
| Bias | Authors' judgement | Support for judgement |
| Random sequence generation (selection bias) | High risk | Non‐randomized controlled study |
| Allocation concealment (selection bias) | High risk | Non‐randomized controlled study |
| Baseline imbalance (selection bias) | Low risk | Similiar malaria characteristics between groups |
| Contamination protection | Low risk | It was desirable to allocate contiguous areas to the same treatment and also to reduce the effect of migrations by having similarly treated buffer zones around the evaluation villages. |
| Blinding of participants and personnel (performance bias) | Unclear risk | Not mentioned but unclear if this impacted outcomes |
| Blinding of outcome assessment (detection bias) | Low risk | Independent reexamination of slides |
| Incomplete outcome data (attrition bias) | Low risk | Operation aimed for total coverage |
| Selective reporting (reporting bias) | Low risk | The surveys covered the total de facto population of selected village clusters and all possible outcomes measured and reported. |
| Other bias | Low risk | No other bias detected |
| Methods | Dates of study: 1966‐1968 Location of study: Nigeria Malaria endemicity (prevalence): Comparison group 1: 28.9% in all ages [Moderate] Transmission season: May to September Malaria species: P. falciparum Vector species: A. gambiae, A. funestus Study design: Non‐randomized controlled study (no post‐intervention measurements) Evaluation design: Cross‐sectional surveys | |
| Participants | Age groups included: Ages > 3 months Sample size Intervention 1 mean (range): 52,000 (52,060 to 53,897) Comparison 1 mean: 11,500 | |
| Interventions | Intervention group 1: MDA administered to all persons aged > 3 months with chloroquine 450 mg and pyrimethamine 45 mg every 60 days for 11 rounds from November 1966 to August 1968. Coverage 78 to 92%. Co‐intervention with IRS. Comparison group 1: Co‐intervention with IRS only. Coverage not described. | |
| Outcomes | Parasitaemia prevalence Gametocytaemia prevalence Active adverse event surveillance conducted Adverse events reported: Direct observation of 5003 treatments during MDA rounds 9 and 10 revealed 2% vomiting immediately after taking the drug. When a subset of the population was asked about vomiting, 9% reported this symptom. | |
| Notes | Data collected during rounds 2 to 11 are summarized as during MDA results. This is problematic as the initial decline and later rise of cases during the two years of drug administration is aggregated. Evaluation conducted in a subset of treated population. | |
| Risk of bias | ||
| Bias | Authors' judgement | Support for judgement |
| Random sequence generation (selection bias) | High risk | Non‐randomized controlled study |
| Allocation concealment (selection bias) | High risk | Non‐randomized controlled study |
| Baseline imbalance (selection bias) | High risk | The comparison area was not comparable to the intervention area in terms of entomologic or parasitological parameters. |
| Contamination protection | Low risk | Treated large peripheral zone, but evaluation done in central zone only |
| Blinding of participants and personnel (performance bias) | Unclear risk | Not blinded, but unclear if this impacted outcomes |
| Blinding of outcome assessment (detection bias) | Unclear risk | Not mentioned, but unclear if this impacted outcomes |
| Incomplete outcome data (attrition bias) | Low risk | Recorded census and population movement without large loss to follow‐up |
| Selective reporting (reporting bias) | Low risk | Random sampling of clusters of 200 people for the parasitological surveys |
| Other bias | Low risk | No other bias detected |
| Methods | Dates of study: 1972 Location of study: Solomon Islands (known as British Solomon Islands at the time of the study's publication) Malaria endemicity (prevalence): 27.8% all ages (May 1972 survey) [Moderate] Transmission season: Rainy season December to April Malaria species: P. falciparum, P. vivax Vector species:A. farauti Study design: Uncontrolled before‐and‐after study Evaluation design: Cross‐sectional surveys, passive surveillance and active surveillance | |
| Participants | Age groups included: All ages Sample size Intervention group 1 (mean): Not specified | |
| Interventions | Intervention group 1 (Nggela archipelago): MDA administered to all persons with chloroquine 600 mg and pyrimethamine 50 mg monthly for four months from July to October 1972. Coverage 90%. Co‐intervention with IRS. | |
| Outcomes | Parasitaemia prevalence (includes both passive and active case detection for the period during and after the intervention) Parasitaemia incidence (population size not given) No adverse event surveillance conducted No adverse events reported | |
| Notes | ||
| Risk of bias | ||
| Bias | Authors' judgement | Support for judgement |
| Random sequence generation (selection bias) | High risk | No comparison group |
| Allocation concealment (selection bias) | High risk | No comparison group |
| Baseline imbalance (selection bias) | High risk | No comparison group |
| Contamination protection | High risk | No comparison group |
| Blinding of participants and personnel (performance bias) | High risk | No comparison group |
| Blinding of outcome assessment (detection bias) | High risk | No comparison group |
| Incomplete outcome data (attrition bias) | Unclear risk | Insufficient reporting of attrition/exclusions to permit judgement |
| Selective reporting (reporting bias) | High risk | Only 50% of children 2‐9 years old included in the pre‐MDA and post‐MDA household surveys |
| Other bias | High risk | Baseline surveillance did not include active case detection |
| Methods | Dates of study: 1972‐1973 Location of study: Solomon Islands (known as British Solomon Islands at the time of the study's publication) Malaria endemicity (incidence): 15/1000 baseline monthly incidence Transmission season: Rainy season December to April Malaria species: P. vivax, P. malariae Vector species: A. farauti Study design: Uncontrolled before‐and‐after study Evaluation design: Passive surveillance | |
| Participants | Age groups included: All ages Sample size Intervention group 1 (mean): 1200 | |
| Interventions | Intervention group 1 (Wagina and Shortland): MDA administered to all persons with chloroquine 1500 mg and primaquine 75 mg over five days every three months for three rounds from October 1972 to March 1973. Coverage 90%. No co‐interventions. | |
| Outcomes | Parasitaemia incidence No adverse event surveillance conducted No adverse events reported | |
| Notes | ||
| Risk of bias | ||
| Bias | Authors' judgement | Support for judgement |
| Random sequence generation (selection bias) | High risk | No comparison group |
| Allocation concealment (selection bias) | High risk | No comparison group |
| Baseline imbalance (selection bias) | High risk | No comparison group |
| Contamination protection | High risk | No comparison group |
| Blinding of participants and personnel (performance bias) | High risk | No comparison group |
| Blinding of outcome assessment (detection bias) | High risk | No comparison group |
| Incomplete outcome data (attrition bias) | Unclear risk | Insufficient information to permit judgement |
| Selective reporting (reporting bias) | Unclear risk | Insufficient information to permit judgement |
| Other bias | Low risk | No other bias detected |
| Methods | Dates of study: 1958‐1959 Location of study: Burkina Faso Malaria endemicity (prevalence): Intervention group 1 (March‐May 1958 baseline survey): 15.3% in children 0‐9 years [Moderate]; Intervention group 2 (March to May 1958 baseline survey): 56.0% in children 0‐9 years [High] Transmission season: June to October Malaria species: P. falciparum, P. malariae Vector species: A. gambiae, A. funestus Study design: Uncontrolled before‐and‐after study Evaluation design: Cross‐sectional surveys | |
| Participants | Age groups included: All ages Sample size Intervention group 1 (mean): 5000 Intervention group 2 (mean): 3000 | |
| Interventions | Intervention group 1 (Zone A): MDA administered to all persons with pyrimethamine 50 mg every two weeks for eight rounds in June to September 1958. Coverage 82‐91%. Co‐intervention with IRS using DDT. Intervention group 2 (Zone B): MDA administered to all persons with pyrimethamine 50 mg every two weeks for eight rounds in June to September 1958. Coverage 82‐91%. No co‐interventions. | |
| Outcomes | Parasitaemia prevalence Gametocytaemia prevalence No adverse event surveillance conducted No adverse events reported | |
| Notes | Outcomes assessed in sub‐sample of treated population (0‐9 years). Data presented in Table 1 was used in the meta‐analysis. | |
| Risk of bias | ||
| Bias | Authors' judgement | Support for judgement |
| Random sequence generation (selection bias) | High risk | No comparison group |
| Allocation concealment (selection bias) | High risk | No comparison group |
| Baseline imbalance (selection bias) | High risk | No comparison group |
| Contamination protection | High risk | No comparison group |
| Blinding of participants and personnel (performance bias) | High risk | No comparison group |
| Blinding of outcome assessment (detection bias) | High risk | No comparison group |
| Incomplete outcome data (attrition bias) | High risk | In Zone B, pyrimethamine distribution stopped on September 20th and resumed in October, so the study was unable to follow the entire evolution of resistance that apparently began during the fourth month of distribution. Also, the method of selection of children 2‐9 years is unclear. They took monthly blood samples in all children 0‐23 months, but due to the large sample size selected only a proportion of children 2‐9 years to examine. |
| Selective reporting (reporting bias) | Unclear risk | Insufficient information to permit judgement |
| Other bias | High risk | Complicated by resistance in the fourth month of MDA |
| Methods | Dates of study: 1953‐1954 Location of study: Kenya Malaria endemicity (prevalence): 28% in 1953 [Moderate] and 22% in 1954 [Moderate] in all ages in Tiriki Transmission season: May to July Malaria species:P. falciparum, P. malariae Vector species: A. gambiae, A. funestus Study design: Non‐randomized controlled study Evaluation design: Cross‐sectional surveys | |
| Participants | Age groups included: All ages Sample size Intervention group 1 (mean): 101,000 Intervention group 2 (mean): 99,000 Comparison group 1 (mean): Not specified Comparison group 2 (mean): Not specified | |
| Interventions | Intervention group 1 (Nandi District 1953): MDA administered to all persons with pyrimethamine 50 mg once in May 1953. Coverage 95%. No co‐intervention. Intervention group 2 (Nandi District 1954): MDA administered to all persons with pyrimethamine 50 mg once in May 1954. Coverage 95%. No co‐intervention. Comparison group 1 (Tiriki control area 1953): No interventions Comparison group 2 (Tiriki control area 1954): No interventions | |
| Outcomes | Parasitaemia prevalence No adverse event surveillance conducted No adverse events reported | |
| Notes | Intended to control epidemics. In the methods, it states: "one hundred thick blood films were taken in treated and untreated areas from persons in each of the age groups 0‐10 years, 11‐20 years, and 21 years and older". Therefore, we assumed that the number of total patients examined was 300 for both intervention and comparison groups to determine the number of cases identified in our calculations for parasitaemia prevalence. Outcomes were assessed in a sub‐sample of the treated population. | |
| Risk of bias | ||
| Bias | Authors' judgement | Support for judgement |
| Random sequence generation (selection bias) | High risk | Non‐randomized controlled study |
| Allocation concealment (selection bias) | High risk | Non‐randomized controlled study |
| Baseline imbalance (selection bias) | High risk | Higher baseline parasitaemia in the control area |
| Contamination protection | Low risk | Not described but trial area was very large |
| Blinding of participants and personnel (performance bias) | Unclear risk | Not blinded but unclear if this impacted outcomes |
| Blinding of outcome assessment (detection bias) | Unclear risk | Not mentioned but unclear if this impacted outcomes |
| Incomplete outcome data (attrition bias) | Low risk | All inhabitants living in the selected area received treatment |
| Selective reporting (reporting bias) | Unclear risk | Unclear who or how many were included in the malaria surveys |
| Other bias | Low risk | No other bias detected |
| Methods | Dates of study: 1960‐1961 Location of study: Burkina Faso Malaria endemicity (prevalence): Comparison group 1 (baseline survey): 59.4% in children 2‐9 years [High] Transmission season: August to September Malaria species: P. falciparum, P. vivax Vector species: Not described Study design: Non‐randomized controlled study (no pre‐intervention measurements) Evaluation design: Cross‐sectional surveys | |
| Participants | Age groups included: All ages Sample size Intervention group 1 (mean): 2500 Intervention group 2 (mean): 3535 Comparison group 1 (mean): Not specified | |
| Interventions | Intervention group 1: MDA administered to all persons with a combination of 600 mg base chloroquine or amodiaquine and 15 mg base primaquine every 14 days in June to December 1960 for 15 rounds. No co‐intervention. Coverage 90%. Intervention group 2: MDA administered to all persons with 600 mg base amodiaquine and 15 mg base primaquine every 14 days in June to December 1960 for eight rounds. Coverage not specified. Co‐intervention with IRS using DDT once a year in May 1960. Comparison group 1: Control zone free of any intervention (house spraying or treatment). Coverage not specified. | |
| Outcomes | Parasitaemia prevalence Gametocytaemia prevalence No adverse event surveillance conducted No adverse events reported | |
| Notes | Data on children 0‐9 years were reported; however, data could only be abstracted for 2‐9 years to draw appropriate comparisons. In addition, data for during MDA for the intervention groups were estimated using only October 1960 survey data; during MDA data for the comparison group was only provided for October 1960. Intervention sample size is based on the 2500 inhabitants of the three villages surveyed; half were randomized to receive amodiaquine and primaquine while the other half received chloroquine and primaquine. A third intervention group was treated with a combination of 600 mg base chloroquine or amodiaquine and 15 mg base primaquine every 14 days in June to December 1960; however, due to lack of detailed data presented, this group was not included in the meta‐analysis. | |
| Risk of bias | ||
| Bias | Authors' judgement | Support for judgement |
| Random sequence generation (selection bias) | High risk | Non‐randomized controlled study |
| Allocation concealment (selection bias) | High risk | Non‐randomized controlled study |
| Baseline imbalance (selection bias) | Low risk | Patient outcomes were measured prior to the intervention. According to investigators, no important differences were present across study groups. |
| Contamination protection | Unclear risk | Insufficient information to permit judgement |
| Blinding of participants and personnel (performance bias) | Unclear risk | Insufficient information to permit judgement |
| Blinding of outcome assessment (detection bias) | Unclear risk | Insufficient information to permit judgement |
| Incomplete outcome data (attrition bias) | High risk | Adults were treated during MDA, but were not included in the evaluation. |
| Selective reporting (reporting bias) | High risk | A monthly distribution schedule was also administered in the study; however due to the poor quality data, minimal results were described. |
| Other bias | Unclear risk | Insufficient information to permit judgement |
| Methods | Dates of study: 2008 Location of study: Tanzania Malaria endemicity (prevalence): 0% in all ages [Low] Transmission season: March to May, October to November Malaria species: P. falciparum Vector species: Not described Study design: Cluster‐randomized trial Unit of randomization: Geographical clusters of households Adjusted analyses for clustering: Yes Adjustment method: Generalized estimating equations ICC: Not described Numbers of clusters: 16 Number of people: 3457 Average cluster size: 216 Evaluation design: Cross‐sectional surveys, passive surveillance and active surveillance in children | |
| Participants | Age groups included: Ages > 1 year, but individuals who had received a full dose of ACT in the two weeks before the intervention were excluded. Sample size Intervention group 1 (mean): 1110 Comparison group 1 (mean): 2347 | |
| Interventions | Intervention group 1: MDA administered to all persons in eight clusters in four villages in Lower Moshi with sulphadoxine‐pyrimethamine (25 mg + 1.25 mg/kg as a single dose on the first day) plus artesunate (4 mg/kg/day for three days) plus primaquine (0.75 mg/kg as a single dose on the third day). Pregnant women received sulphadoxine‐pyrimethamine (25 mg + 1.25 mg/kg 25 mg + 1.25 mg/kg as a single dose on the first day) plus amodiaquine (10 mg/kg once daily for three days). Anaemic individuals received sulphadoxine‐pyrimethamine (25 mg + 1.25 mg/kg 25 mg + 1.25 mg/kg as a single dose on the first day) plus artesunate (4 mg/kg/day for three days). Coverage 93%. Co‐intervention with background bed net use (25.1% to 36.1%) and a single treatment campaign for trachoma with azithromycin was undertaken by a non‐governmental organisation. Comparison group 1: Placebo administered to all persons in eight clusters once daily over three days. Coverage not described. Co‐intervention with background bed net use (25.1% to 36.1%) and a single treatment campaign for trachoma with azithromycin was undertaken by a non‐governmental organisation. | |
| Outcomes | Parasitaemia prevalence Gametocytaemia prevalence Active adverse event surveillance with haemoglobin monitoring conducted in a subset of the population Adverse events reported: One individual was diagnosed with a severe skin reaction in the week following MDA. Upon review, it was determined that the event was drug related. A second individual presented with skin hyperpigmentation on the face, which was determined unrelated to drug treatment. Both individuals were treated with steroids and monitored until symptoms disappeared. In those given primaquine, moderate anaemia (Hb level of <8 g/dL) was observed in 40% (6/15 individuals) of the G6PD A‐, 11.1% (3/27 individuals) of the G6PD A, and 4.5% (18/399 individuals) of the G6PD B individuals; one case of severe anaemia (Hb level of <5 g/dL) was observed. | |
| Notes | The prevalence outcomes were assessed in a sub‐sample of the treated population. | |
| Risk of bias | ||
| Bias | Authors' judgement | Support for judgement |
| Random sequence generation (selection bias) | Low risk | Randomized using computer generated randomization tables |
| Allocation concealment (selection bias) | Low risk | Not described, but low risk with the randomization of a small number of clusters presumably by the investigator |
| Baseline imbalance (selection bias) | Low risk | Baseline demographic and malaria characteristics were similar |
| Contamination protection | Low risk | Households that were located between clusters (ie within 1 km distance from the boundary of intervention and/or control clusters) were considered as buffer zones. Members of these households received the intervention in order to minimize contamination. |
| Blinding of participants and personnel (performance bias) | Low risk | Placebo was used in the comparison arm |
| Blinding of outcome assessment (detection bias) | Low risk | The measurement of outcomes for intervention and comparison arms were identical. |
| Incomplete outcome data (attrition bias) | Low risk | High coverage of intervention and population movement monitored |
| Selective reporting (reporting bias) | Low risk | For each cross‐sectional survey, individuals were randomly selected from computer‐generated random tables. All planned outcome measures were reported. |
| Other bias | Low risk | No other bias detected |
| Methods | Dates of study: 1935 Location of study: India Malaria endemicity (incidence): 156 cases/1000 baseline monthly incidence in all age groups Transmission season: March to August Malaria species: P. vivax Vector species: A. culicifacies Study design: Uncontrolled before‐and‐after study Evaluation design: Passive surveillance | |
| Participants | Age groups included: All ages Sample size Intervention group 1 (mean): 5650 | |
| Interventions | Intervention group 1 (Mill Area): MDA administered to all persons with atebrin intramuscular 300 mg daily for 2 days and plasmochin simplex 60 mg daily for three days once in May to June 1935. Coverage 100%. Co‐intervention with oiling for larval control after MDA. | |
| Outcomes | Parasitaemia incidence Passive event surveillance conducted Adverse events reported: Haemoglobinuria occurred in 4 cases (2 severe and died; 2 mild); three of the cases were from the same household and all were taking treatment for syphilis. Fatal cases known to have syphilis and unlikely to be associated with atebrin; although potentially associated with plasmochin. Abcesses reported in 49 small children and weak adults. "Giddiness" reported with atebrin. | |
| Notes | Baseline monthly incidence was estimated using survey data from May 1934 to April 1935 prior to MDA. Data used in the meta‐analysis was extrapolated from graphs presented in the text. | |
| Risk of bias | ||
| Bias | Authors' judgement | Support for judgement |
| Random sequence generation (selection bias) | High risk | No comparison group |
| Allocation concealment (selection bias) | High risk | No comparison group |
| Baseline imbalance (selection bias) | High risk | No comparison group |
| Contamination protection | High risk | No comparison group |
| Blinding of participants and personnel (performance bias) | High risk | No comparison group |
| Blinding of outcome assessment (detection bias) | High risk | No comparison group |
| Incomplete outcome data (attrition bias) | Low risk | Every person in the Mill Area was treated; extensive propaganda was carried out to bring every fever case to the doctor. |
| Selective reporting (reporting bias) | Low risk | Passive surveillance data for the entire population was reported |
| Other bias | Low risk | No other bias detected |
| Methods | Dates of study: 1952‐1953 Location of study: India Malaria endemicity (prevalence): 22% in all ages [Moderate] Transmission season: September to November Malaria species: P. falciparum Vector species: Not described Study design: Non‐randomized controlled study Evaluation design: Cross‐sectional surveys and active surveillance | |
| Participants | Age groups included: All ages Sample size Intervention group 1 (mean): 125 Comparison group 1 (mean): 55 Comparison group 2 (mean): 121 | |
| Interventions | Intervention group 1: MDA administered to all persons with amodiaquine 600 mg every two weeks for ten weeks starting in September 1952. Coverage not specified. No co‐interventions. Comparison group 1 (comparison groups 1 and 2 combined): Neighboring control area. No co‐interventions. | |
| Outcomes | Parasitaemia prevalence No adverse event surveillance conducted No adverse events reported | |
| Notes | ||
| Risk of bias | ||
| Bias | Authors' judgement | Support for judgement |
| Random sequence generation (selection bias) | High risk | Non‐randomized controlled study |
| Allocation concealment (selection bias) | High risk | Non‐randomized controlled study; selection of villages were made after initial survey. Communication facilities were taken into place to decide on the intervention. |
| Baseline imbalance (selection bias) | High risk | Baseline malaria characteristics were similar to comparison group 2 but not to comparison group 1. |
| Contamination protection | High risk | Incidence of malaria was so high that every week large numbers of labourers were being repatriated to their own villages. |
| Blinding of participants and personnel (performance bias) | Unclear risk | Not blinded, but unclear if this impacted outcomes |
| Blinding of outcome assessment (detection bias) | Unclear risk | Not blinded, but unclear if this impacted outcomes |
| Incomplete outcome data (attrition bias) | High risk | No description of intervention coverage |
| Selective reporting (reporting bias) | Low risk | Entire population surveyed |
| Other bias | Low risk | No other bias detected |
| Methods | Dates of study: 2003‐2006 Location of study: Cambodia Malaria endemicity (prevalence): 55.8% in children < 16 years; 52.3% in all ages [High] Transmission season: Not described Malaria species: P. falciparum, P. malariae, P. vivax Vector species: Not described Study design: Uncontrolled before‐and‐after study Evaluation design: Cross‐sectional surveys | |
| Participants | Age groups included: All ages Sample size Intervention group 1 (mean): 3653 Intervention group 2 (mean): 2387 | |
| Interventions | Intervention group 1 (Kampong Speu, 17 villages, single round): MDA administered to all ages with artesunate 125 mg daily for two days, piperaquine 750 mg daily for two days and primaquine 9 mg every 10 days for six months starting in December 2003. Coverage not specified. No co‐interventions. Intervention group 2 (Kampot, nine villages, two rounds on days 0 and 42): MDA administered to all ages with artesunate 125 mg daily for two days and piperaquine 750 mg daily for two days given on days 0 and 42 and primaquine 9 mg every 10 days for six months starting in December 2003 . Coverage not specified. No co‐interventions. | |
| Outcomes | Parasitaemia prevalence Gametocytaemia prevalence Passive event surveillance conducted Adverse events reported: No adverse reactions reported to village malaria volunteers. | |
| Notes | Kampot data was not included in meta‐analysis as the denominator of children for the outcome data was not provided. The outcomes were assessed in a sub‐sample of the treated population. | |
| Risk of bias | ||
| Bias | Authors' judgement | Support for judgement |
| Random sequence generation (selection bias) | High risk | No comparison group |
| Allocation concealment (selection bias) | High risk | No comparison group |
| Baseline imbalance (selection bias) | High risk | No comparison group |
| Contamination protection | High risk | No comparison group |
| Blinding of participants and personnel (performance bias) | High risk | No comparison group |
| Blinding of outcome assessment (detection bias) | High risk | No comparison group |
| Incomplete outcome data (attrition bias) | High risk | One village missing data from one year |
| Selective reporting (reporting bias) | High risk | Monitoring was different for the different villages. Some villages had missing data. |
| Other bias | Low risk | No other bias detected |
| Methods | Dates of study: 1960 Location of study: Papua New Guinea Malaria endemicity (prevalence): 38.6% in children 2‐9 years (1959 survey); 18% in all ages (1959 and 1960 surveys) [Moderate] Transmission season: Not described Malaria species:P. falciparum, P. malariae, P. vivax Vector species: A. farauti Study design: Uncontrolled before‐and‐after study Evaluation design: Cross‐sectional surveys | |
| Participants | Age groups included: All ages Sample size Intervention group 1 (mean): 1250 | |
| Interventions | Intervention group 1: MDA administered to all persons with chloroquine (450 mg) once every four weeks for 11 rounds. Coverage 97.2% (range 93.1% to 100%). Co‐intervention with mass treatment of filariasis with diethylcarbamazine. | |
| Outcomes | Parasitaemia prevalence Gametocytaemia prevalence No adverse event surveillance conducted No adverse events reported | |
| Notes | Before MDA estimates include data from June 1959 and January 1960 surveys (Tables I and II). For intervention group 1, outcome estimates come from Table V. | |
| Risk of bias | ||
| Bias | Authors' judgement | Support for judgement |
| Random sequence generation (selection bias) | High risk | No comparison group |
| Allocation concealment (selection bias) | High risk | No comparison group |
| Baseline imbalance (selection bias) | High risk | No comparison group |
| Contamination protection | High risk | No comparison group |
| Blinding of participants and personnel (performance bias) | High risk | No comparison group |
| Blinding of outcome assessment (detection bias) | High risk | No comparison group |
| Incomplete outcome data (attrition bias) | High risk | Nine positives were not included in the 0‐1 month post‐MDA survey; they were not present during the last distribution. |
| Selective reporting (reporting bias) | Low risk | All pre‐specified outcomes of interest have been reported |
| Other bias | Unclear risk | Visitors to the village were also treated with the group to which they were most closely related. Persons who stayed only a few days were not treated. However, it is unclear whether this introduced bias. |
| Methods | Dates of study: 1999 Location of study: Gambia Malaria endemicity: 42.9% in children ≤ 5 years [High]; describes 17‐19% in all ages but this data was not from this study. Transmission season: June to December Malaria species: P. falciparum Vector species: Not described Study design: Cluster‐randomized trial Unit of randomization: Villages Adjusted analyses for clustering: Yes Adjustment method: Poisson regression model adjusting for population size ICC: Not described Number of clusters: 18 villages Number of people: 3655 Average cluster size: 203 Feature: Matched villages Evaluation design: Cross‐sectional surveys, active surveillance and passive surveillance | |
| Participants | Age groups included: Ages > 6 months old; non‐pregnant A total of 16,442 people, of which 14,017 people (85%) where treated (placebo or MDA) including the buffer zone Sample size (of number evaluated) Intervention group 1 (mean): 1969 Comparison group 1 (mean): 1686 | |
| Interventions | Intervention group 1: MDA administered to all non‐pregnant persons aged > 6 months with sulfadoxine‐pyrimethamine 1500 mg/75 mg and artesunate 200 mg once in June 1999. Coverage 89% in total population (90.8% in evaluated group). No co‐interventions. Comparison group 1: Placebo administered to all non‐pregnant persons aged > 6 months once in June 1999. Coverage 89% in total population (89.6% in evaluated group). No co‐interventions. | |
| Outcomes | Parasitaemia prevalence Parasitaemia incidence Gametocytaemia prevalence Anaemia prevalence (defined as hematocrit < 33%) Mortality Passive and active adverse event surveillance conducted Adverse events reported (passive surveillance system): 1 episode of pruritus Adverse events reported (active surveillance system): 25 of 75 individuals remembered one or more complaints within 2 days of taking the drug including dizziness (13), fever (6), diarrhoea (5), vomiting (5) and itching (4). | |
| Notes | Incidence, gametocyte prevalence, anaemia prevalence and mortality reported for children only | |
| Risk of bias | ||
| Bias | Authors' judgement | Support for judgement |
| Random sequence generation (selection bias) | Low risk | While the study is a cluster‐randomized, double blind, placebo‐controlled trial, the method of randomization is not described. Author correspondence revealed that randomization was computer generated. |
| Allocation concealment (selection bias) | Low risk | Drugs allocated to each of the 18 study villages were delivered to the study site in identical containers. One nurse was aware of the identity of the drugs, administered the drugs in the study villages and then left the study area. |
| Baseline imbalance (selection bias) | Low risk | Intervention and control villages did not differ appreciably in the demographic of malaria transmission characteristics. |
| Contamination protection | Low risk | All inhabitants of the non‐randomized controlled villages in the study area were treated, to minimize possible dilution of the effect of the intervention. |
| Blinding of participants and personnel (performance bias) | Low risk | Cluster‐randomized, double blind, placebo‐controlled trial; neither study personnel nor the study population were aware of which villages received placebo. |
| Blinding of outcome assessment (detection bias) | Low risk | Cluster‐randomized, double blind, placebo‐controlled trial |
| Incomplete outcome data (attrition bias) | Low risk | All children in the surveillance villages were visited weekly; all 18 study villages that were randomized were analyzed. |
| Selective reporting (reporting bias) | Low risk | All primary and secondary endpoints reported |
| Other bias | Low risk | No other bias detected |
Characteristics of excluded studies [ordered by study ID]
Ir a:
| Study | Reason for exclusion |
| Inadequate treatment dose | |
| Inadequate treatment dose | |
| Treatment not administered to entire population; intermittent preventive treatment for children (IPTc) study | |
| Treatment not administered to entire population; intermittent preventive treatment for children (IPTc) study | |
| Inadequate treatment dose; knowledge, attitudes, and prevention component of an individually randomized study | |
| Inadequate treatment dose; individually randomized study | |
| Inadequate treatment dose | |
| Inadequate treatment dose | |
| Inadequate treatment dose | |
| Inadequate treatment dose; individually randomized study | |
| Inadequate treatment dose; individually randomized study | |
| Individually randomized study; study participants did not remain in endemic area | |
| Inadequate treatment dose; testing conducted prior to treatment; insufficient information on drug administration | |
| Inadequate treatment dose | |
| Study participants did not remain in endemic area | |
| Individually randomized study | |
| Insufficient information on drug administration | |
| Inadequate treatment dose | |
| Inadequate treatment dose | |
| Individually randomized study | |
| Insufficient information on drug administration | |
| Testing conducted prior to treatment | |
| Inadequate treatment dose | |
| Insufficient information on drug administration | |
| Insufficient information on outcomes reported | |
| Individually randomized study | |
| Insufficient information on outcomes reported | |
| Individually randomized study | |
| Individually randomized study | |
| Inadequate treatment dose | |
| Insufficient information on drug administration | |
| Inadequate treatment dose | |
| Insufficient information on outcomes reported | |
| Insufficient information on drug administration; insufficient information on outcomes reported (no outcome of interest reported) | |
| Inadequate treatment dose | |
| Inadequate treatment dose | |
| Inadequate treatment dose | |
| Insufficient information on drug administration | |
| Individually randomized study; testing conducted prior to treatment | |
| Inadequate treatment dose | |
| Inadequate treatment dose | |
| Inadequate treatment dose | |
| Insufficient information on outcomes reported; treatment not administered to entire population | |
| Individually randomized study | |
| Treatment not administered to entire population; intermittent preventive treatment for children (IPTc) study | |
| Mixed curative and prophylactic dosing | |
| Testing conducted prior to treatment | |
| Treatment not administered to entire population; intermittent preventive treatment for children (IPTc) study | |
| Insufficient information on drug administration | |
| Insufficient information on outcomes reported | |
| Insufficient information on outcomes reported | |
| Inadequate treatment dose | |
| Inadequate treatment dose | |
| Insufficient information on drug administration; insufficient information on outcomes reported (no outcome of interest reported) | |
| Individually randomized study | |
| Insufficient information on drug administration; insufficient information on outcomes reported | |
| Inadequate treatment dose | |
| Inadequate treatment dose; individually randomized study | |
| Inadequate treatment dose | |
| Inadequate treatment dose; individually randomized study | |
| Insufficient information on drug administration | |
| Inadequate treatment dose | |
| Treatment not administered to entire population; intermittent preventive treatment in children (IPTc) study | |
| Individually randomized study; testing conducted prior to treatment | |
| Individually randomized study | |
| Inadeqaute treatment dose | |
| Individually randomized study; testing conducted prior to treatment | |
| Inadequate treatment dose | |
| Inadequate treatment dose | |
| Study participants did not remain in endemic area | |
| Insufficient information on outcomes reported | |
| Inadequate treatment dose | |
| Inadequate treatment dose | |
| Insufficient information on drug administration | |
| Inadequate treatment dose | |
| Inadequate treatment dose | |
| Inadequate treatment dose | |
| Insufficient information on outcomes reported | |
| Inadequate treatment dose | |
| Insufficient information on drug administration; insufficient information on outcomes of interest | |
| Inadequate treatment dose | |
| Mixed curative and prophylactic dosing | |
| Inadequate treatment dose; individually randomized study | |
| Inadequate treatment dose | |
| Individually randomized study | |
| Mixed curative and prophylactic dosing | |
| Insufficient information on outcomes reported (no outcome of interest reported) | |
| Treatment not administered to entire population (children only) | |
| Post‐only outcomes reported | |
| Inadequate treatment dose | |
| Inadequate treatment dose | |
| Insufficient information on drug administration; insufficient information on outcomes reported. | |
| Inadequate treatment dose | |
| Inadequate treatment dose | |
| Inadequate treatment dose | |
| Testing conducted prior to treatment | |
| Individually randomized study | |
| Individually randomized study | |
| Insufficient information on outcomes reported; comparison of delivery strategies; treatment not administered to entire population (both arms included intermittent preventive treatment in children (IPTc)) | |
| Inadequate treatment dose | |
| Inadequate treatment dose | |
| Testing conducted prior to treatment | |
| Inadequate treatment dose | |
| Insufficient information on drug administration | |
| Mixed curative and prophylactic dosing | |
| Individually randomized study | |
| Mixed curative and prophylactic dosing | |
| Mixed curative and prophylactic dosing | |
| Inadequate treatment dose | |
| Inadequate treatment dose | |
| Individually randomized study | |
| Inadequate treatment dose; insufficient information on outcomes reported | |
| Insufficient information on drug administration | |
| Insufficient information on drug administration | |
| Inadequate treatment dose | |
| Inadequate treatment dose | |
| Individually randomized study; testing conducted prior to treatment | |
| Testing conducted prior to treatment | |
| Insufficient information on drug administration; insufficient information on outcomes reported | |
| Inadequate treatment dose | |
| Inadequate treatment dose; treatment not administered to entire population (eg intermittent preventive treatment for children (IPTc)) | |
| Inadequate treatment dose | |
| Inadequate treatment dose; individually randomized study; treatment not administered to entire population | |
| Inadequate treatment dose | |
| Insufficient information on drug administration; insufficient information on outcomes of interest | |
| Individually randomized study; testing conducted prior to treatment | |
| Individually randomized study | |
| Insufficient information on outcomes reported | |
| Inadequate treatment dose; insufficient information on outcomes of interest | |
| Individually randomized study; insufficient information on outcomes reported | |
| Inadequate treatment dose | |
| Inadequate treatment dose | |
| Insufficient information on outcomes reported | |
| Individually randomized study | |
| Inadequate treatment dose | |
| Inadequate treatment dose | |
| Inadequate treatment dose | |
| Inadequate treatment dose | |
| Inadequate treatment dose | |
| Inadequate treatment dose | |
| Insufficient information on outcomes reported | |
| Inadequate treatment dose | |
| Inadequate treatment dose | |
| Inadequate treatment dose | |
| Inadequate treatment dose | |
| Inadequate treatment dose | |
| Testing conducted prior to treatment | |
| Testing conducted prior to treatment | |
| Individually randomized study | |
| Mixed curative and prophylactic dosing | |
| Individually randomized study; testing conducted prior to treatment | |
| Inadequate treatment dose | |
| Inadequate treatment dose | |
| Insufficient information on outcomes reported | |
| Inadequate treatment dose | |
| Inadequate treatment dose | |
| Inadequate treatment dose | |
| Individually randomized study; treatment not administered to entire population (eg intermittent preventive treatment for children (IPTc)) | |
| Inadequate treatment dose | |
| Insufficient information on drug administration | |
| Inadequate treatment dose; insufficient information on outcomes reported | |
| Individually randomized study | |
| Inadequate treatment dose; individually randomized study; testing conducted prior to treatment | |
| Individually randomized study; study participants did not remain in endemic area | |
| Inadequate treatment dose; study participants did not remain in endemic area | |
| Study participants did not remain in endemic area | |
| Testing conducted prior to treatment | |
| Insufficient information on outcomes reported | |
| Insufficient information on drug administration; insufficient information on outcomes reported | |
| Individually randomized study | |
| Insufficient information on drug administration | |
| Inadequate treatment dose | |
| Inadequate treatment dose | |
| Testing conducted prior to treatment | |
| Inadequate treatment dose | |
| Treatment not administered to entire population; intermittent preventive treatment for children (IPTc) study | |
| Treatment not administered to entire population; intermittent preventive treatment for children (IPTc) study | |
| Insufficient information on outcomes reported | |
| Insufficient information on drug administration | |
| Insufficient information on drug administration | |
| Inadequate treatment dose | |
| Inadequate treatment dose | |
| Individually randomized study | |
| Testing conducted prior to treatment | |
| Mixed curative and prophylactic dosing | |
| Insufficient information on drug administration | |
| Individually randomized; mixed curative and prophylactic dosing | |
| Inadequate treatment dose | |
| Mixed curative and prophylactic dosing | |
| Insufficient information on outcomes reported | |
| Inadequate treatment dose | |
| Insufficient information on outcomes reported |
Data and analyses
| Outcome or subgroup title | No. of studies | No. of participants | Statistical method | Effect size |
| 1 Parasitaemia Prevalence: Cluster‐randomized trials Show forest plot | 1 | Risk Ratio (M‐H, Random, 95% CI) | Subtotals only | |
| Analysis 1.1  Comparison 1 MDA versus no MDA in areas of low endemicity (Stratified by study design), Outcome 1 Parasitaemia Prevalence: Cluster‐randomized trials. | ||||
| 1.1 At baseline | 1 | 496 | Risk Ratio (M‐H, Random, 95% CI) | 0.0 [0.0, 0.0] |
| 1.2 <1 month post MDA | 1 | 484 | Risk Ratio (M‐H, Random, 95% CI) | 0.0 [0.0, 0.0] |
| 1.3 1‐3 months post MDA | 1 | 794 | Risk Ratio (M‐H, Random, 95% CI) | 0.0 [0.0, 0.0] |
| 1.4 4‐6 months post MDA | 1 | 660 | Risk Ratio (M‐H, Random, 95% CI) | 0.0 [0.0, 0.0] |
| 2 Parasitaemia Prevalence: Uncontrolled before‐and‐after studies Show forest plot | 1 | Risk Ratio (M‐H, Random, 95% CI) | Subtotals only | |
| Analysis 1.2  Comparison 1 MDA versus no MDA in areas of low endemicity (Stratified by study design), Outcome 2 Parasitaemia Prevalence: Uncontrolled before‐and‐after studies. | ||||
| 2.1 <1 month post MDA | 1 | 3039 | Risk Ratio (M‐H, Random, 95% CI) | 0.27 [0.14, 0.50] |
| 2.2 >12 months post MDA | 1 | 3509 | Risk Ratio (M‐H, Random, 95% CI) | 0.02 [0.00, 0.12] |
| 3 Gametocytaemia Prevalence: Cluster randomized trials Show forest plot | 1 | Risk Ratio (M‐H, Random, 95% CI) | Subtotals only | |
| Analysis 1.3  Comparison 1 MDA versus no MDA in areas of low endemicity (Stratified by study design), Outcome 3 Gametocytaemia Prevalence: Cluster randomized trials. | ||||
| 3.1 At baseline | 1 | 496 | Risk Ratio (M‐H, Random, 95% CI) | 0.0 [0.0, 0.0] |
| 3.2 < 1 month post MDA | 1 | 484 | Risk Ratio (M‐H, Random, 95% CI) | 0.0 [0.0, 0.0] |
| 3.3 1‐3 months post MDA | 1 | 794 | Risk Ratio (M‐H, Random, 95% CI) | 0.0 [0.0, 0.0] |
| 3.4 4‐6 months post MDA | 1 | 660 | Risk Ratio (M‐H, Random, 95% CI) | 0.0 [0.0, 0.0] |
| Outcome or subgroup title | No. of studies | No. of participants | Statistical method | Effect size |
| 1 Parasitaemia Prevalence: Non‐randomized controlled studies Show forest plot | 4 | Risk Ratio (M‐H, Random, 95% CI) | Subtotals only | |
| Analysis 2.1 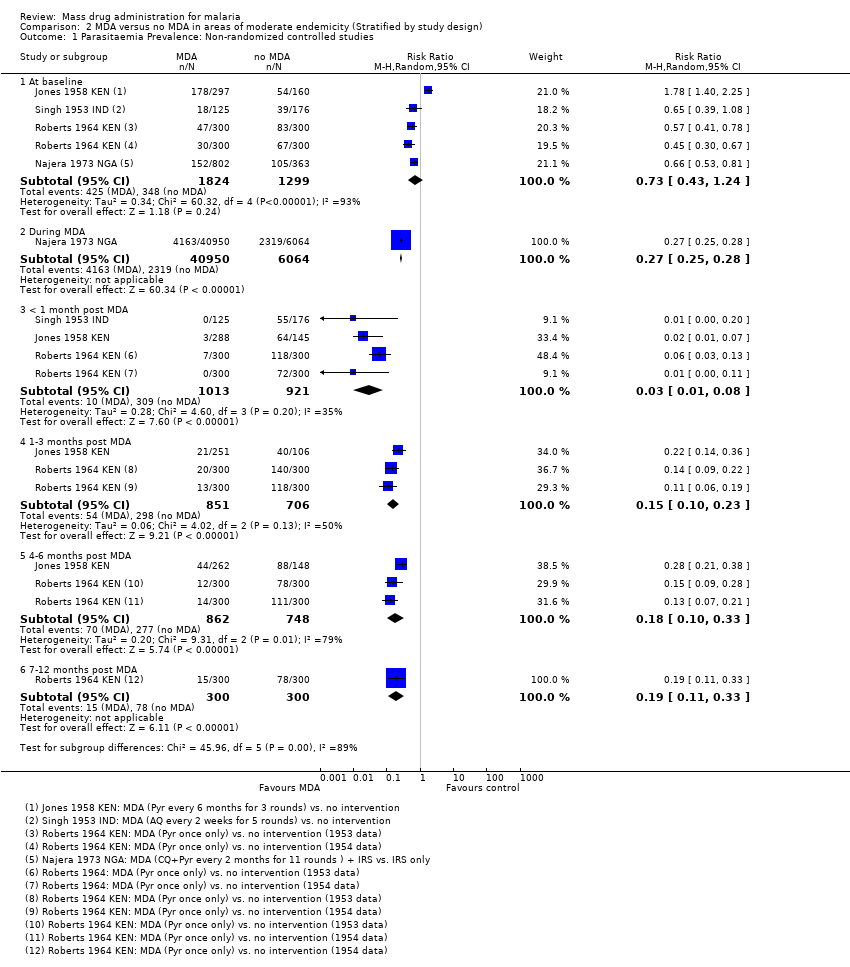 Comparison 2 MDA versus no MDA in areas of moderate endemicity (Stratified by study design), Outcome 1 Parasitaemia Prevalence: Non‐randomized controlled studies. | ||||
| 1.1 At baseline | 4 | 3123 | Risk Ratio (M‐H, Random, 95% CI) | 0.73 [0.43, 1.24] |
| 1.2 During MDA | 1 | 47014 | Risk Ratio (M‐H, Random, 95% CI) | 0.27 [0.25, 0.28] |
| 1.3 < 1 month post MDA | 3 | 1934 | Risk Ratio (M‐H, Random, 95% CI) | 0.03 [0.01, 0.08] |
| 1.4 1‐3 months post MDA | 2 | 1557 | Risk Ratio (M‐H, Random, 95% CI) | 0.15 [0.10, 0.23] |
| 1.5 4‐6 months post MDA | 2 | 1610 | Risk Ratio (M‐H, Random, 95% CI) | 0.18 [0.10, 0.33] |
| 1.6 7‐12 months post MDA | 1 | 600 | Risk Ratio (M‐H, Random, 95% CI) | 0.19 [0.11, 0.33] |
| 2 Parasitaemia Prevalence: Uncontrolled before‐and‐after studies Show forest plot | 7 | Risk Ratio (M‐H, Random, 95% CI) | Subtotals only | |
| Analysis 2.2 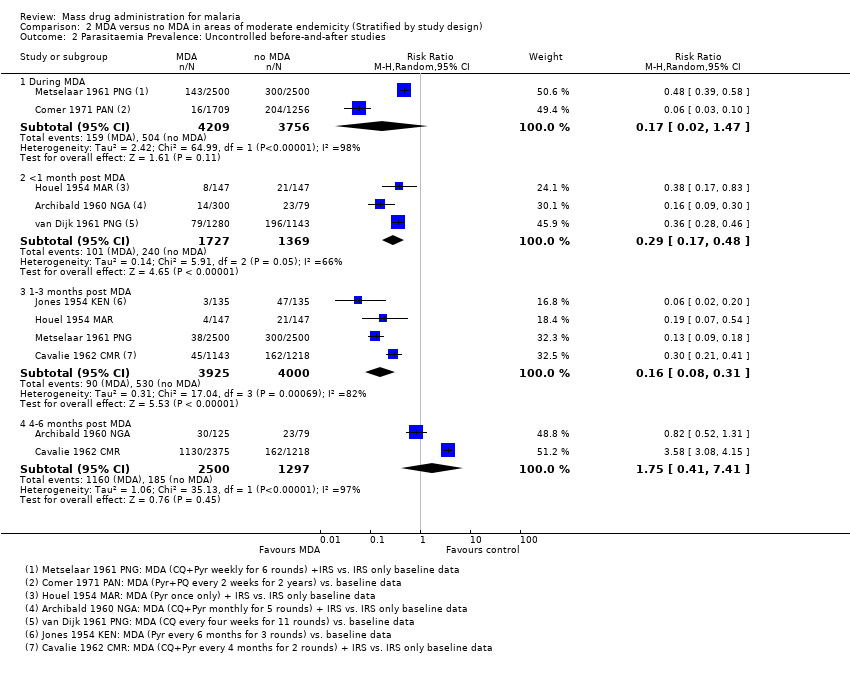 Comparison 2 MDA versus no MDA in areas of moderate endemicity (Stratified by study design), Outcome 2 Parasitaemia Prevalence: Uncontrolled before‐and‐after studies. | ||||
| 2.1 During MDA | 2 | 7965 | Risk Ratio (M‐H, Random, 95% CI) | 0.17 [0.02, 1.47] |
| 2.2 <1 month post MDA | 3 | 3096 | Risk Ratio (M‐H, Random, 95% CI) | 0.29 [0.17, 0.48] |
| 2.3 1‐3 months post MDA | 4 | 7925 | Risk Ratio (M‐H, Random, 95% CI) | 0.16 [0.08, 0.31] |
| 2.4 4‐6 months post MDA | 2 | 3797 | Risk Ratio (M‐H, Random, 95% CI) | 1.75 [0.41, 7.41] |
| 3 Gametocytaemia Prevalence: Non‐randomized controlled studies Show forest plot | 2 | Risk Ratio (M‐H, Random, 95% CI) | Subtotals only | |
| Analysis 2.3 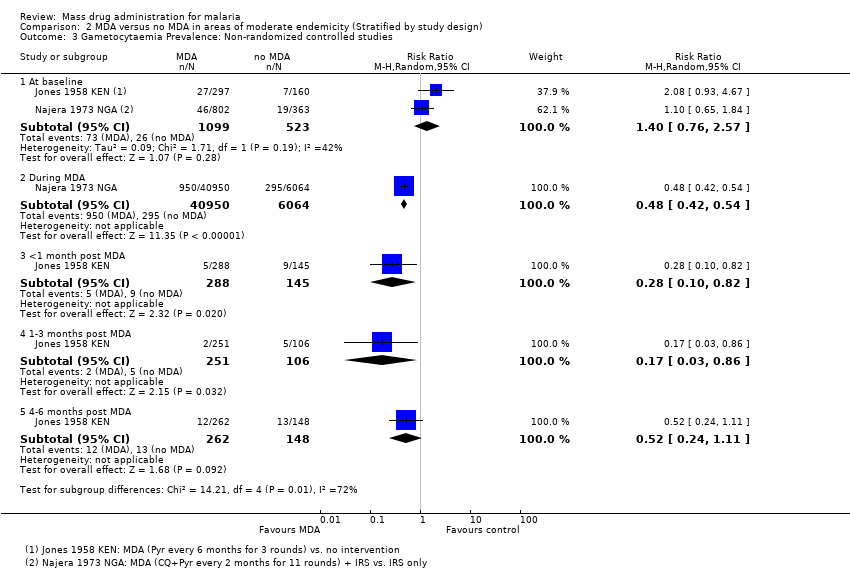 Comparison 2 MDA versus no MDA in areas of moderate endemicity (Stratified by study design), Outcome 3 Gametocytaemia Prevalence: Non‐randomized controlled studies. | ||||
| 3.1 At baseline | 2 | 1622 | Risk Ratio (M‐H, Random, 95% CI) | 1.40 [0.76, 2.57] |
| 3.2 During MDA | 1 | 47014 | Risk Ratio (M‐H, Random, 95% CI) | 0.48 [0.42, 0.54] |
| 3.3 <1 month post MDA | 1 | 433 | Risk Ratio (M‐H, Random, 95% CI) | 0.28 [0.10, 0.82] |
| 3.4 1‐3 months post MDA | 1 | 357 | Risk Ratio (M‐H, Random, 95% CI) | 0.17 [0.03, 0.86] |
| 3.5 4‐6 months post MDA | 1 | 410 | Risk Ratio (M‐H, Random, 95% CI) | 0.52 [0.24, 1.11] |
| 4 Gametocytaemia Prevalence: Uncontrolled before‐and‐after studies Show forest plot | 3 | Risk Ratio (M‐H, Random, 95% CI) | Subtotals only | |
| Analysis 2.4 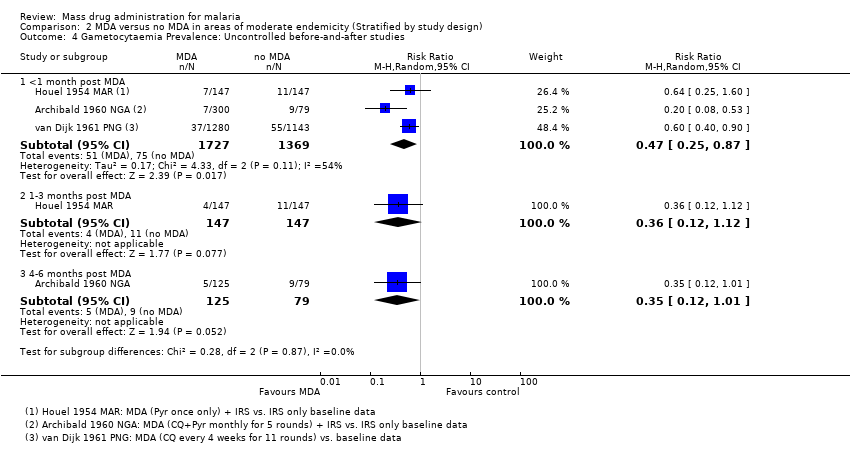 Comparison 2 MDA versus no MDA in areas of moderate endemicity (Stratified by study design), Outcome 4 Gametocytaemia Prevalence: Uncontrolled before‐and‐after studies. | ||||
| 4.1 <1 month post MDA | 3 | 3096 | Risk Ratio (M‐H, Random, 95% CI) | 0.47 [0.25, 0.87] |
| 4.2 1‐3 months post MDA | 1 | 294 | Risk Ratio (M‐H, Random, 95% CI) | 0.36 [0.12, 1.12] |
| 4.3 4‐6 months post MDA | 1 | 204 | Risk Ratio (M‐H, Random, 95% CI) | 0.35 [0.12, 1.01] |
| Outcome or subgroup title | No. of studies | No. of participants | Statistical method | Effect size |
| 1 Parasitaemia Prevalence: Cluster‐randomized trials Show forest plot | 1 | Risk Ratio (M‐H, Random, 95% CI) | Subtotals only | |
| Analysis 3.1 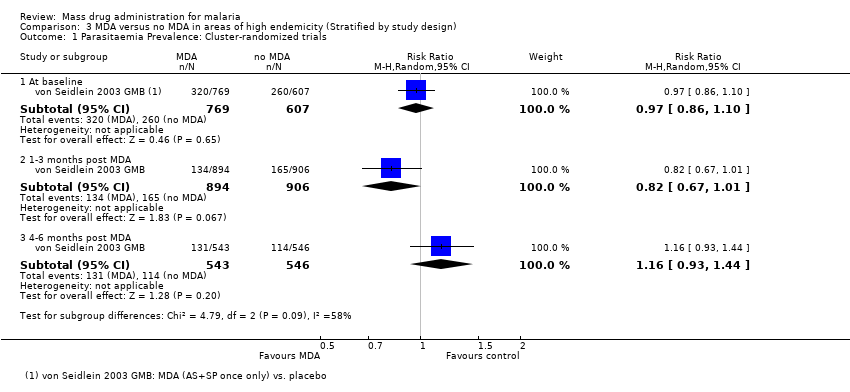 Comparison 3 MDA versus no MDA in areas of high endemicity (Stratified by study design), Outcome 1 Parasitaemia Prevalence: Cluster‐randomized trials. | ||||
| 1.1 At baseline | 1 | 1376 | Risk Ratio (M‐H, Random, 95% CI) | 0.97 [0.86, 1.10] |
| 1.2 1‐3 months post MDA | 1 | 1800 | Risk Ratio (M‐H, Random, 95% CI) | 0.82 [0.67, 1.01] |
| 1.3 4‐6 months post MDA | 1 | 1089 | Risk Ratio (M‐H, Random, 95% CI) | 1.16 [0.93, 1.44] |
| 2 Parasitaemia Prevalence: Non‐randomized controlled studies Show forest plot | 3 | Risk Ratio (M‐H, Random, 95% CI) | Subtotals only | |
| Analysis 3.2  Comparison 3 MDA versus no MDA in areas of high endemicity (Stratified by study design), Outcome 2 Parasitaemia Prevalence: Non‐randomized controlled studies. | ||||
| 2.1 At baseline | 3 | 9395 | Risk Ratio (M‐H, Random, 95% CI) | 0.84 [0.70, 1.00] |
| 2.2 During MDA | 3 | 12561 | Risk Ratio (M‐H, Random, 95% CI) | 0.17 [0.11, 0.27] |
| 2.3 1‐3 months post MDA | 2 | 7197 | Risk Ratio (M‐H, Random, 95% CI) | 0.52 [0.33, 0.81] |
| 3 Parasitaemia Prevalence: Uncontrolled before‐and‐after studies Show forest plot | 7 | Risk Ratio (M‐H, Random, 95% CI) | Subtotals only | |
| Analysis 3.3 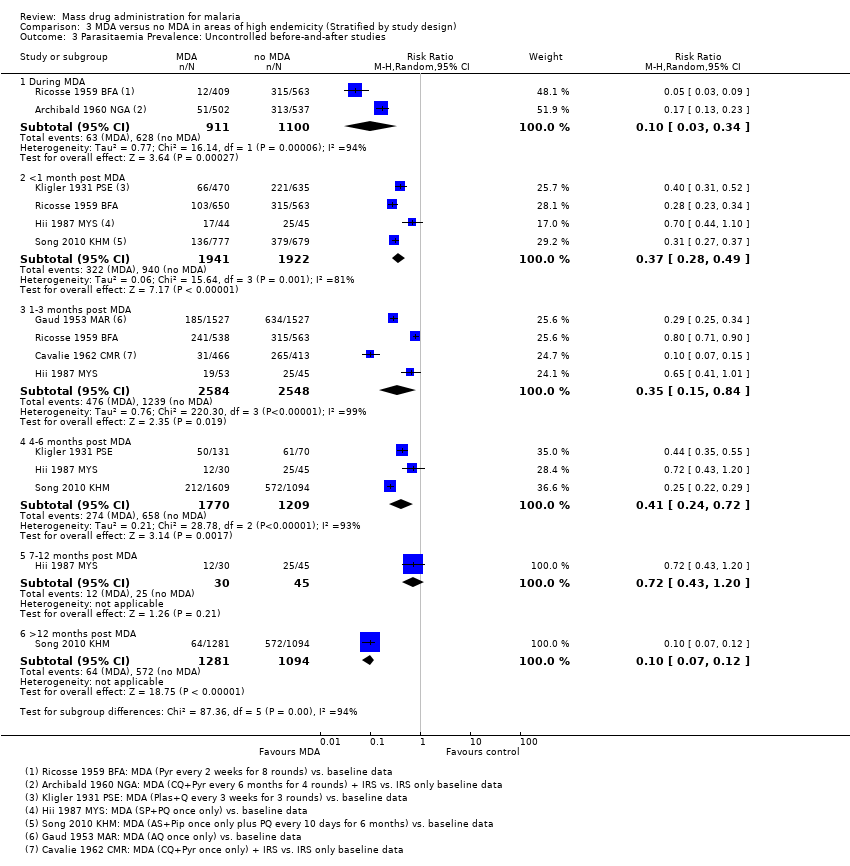 Comparison 3 MDA versus no MDA in areas of high endemicity (Stratified by study design), Outcome 3 Parasitaemia Prevalence: Uncontrolled before‐and‐after studies. | ||||
| 3.1 During MDA | 2 | 2011 | Risk Ratio (M‐H, Random, 95% CI) | 0.10 [0.03, 0.34] |
| 3.2 <1 month post MDA | 4 | 3863 | Risk Ratio (M‐H, Random, 95% CI) | 0.37 [0.28, 0.49] |
| 3.3 1‐3 months post MDA | 4 | 5132 | Risk Ratio (M‐H, Random, 95% CI) | 0.35 [0.15, 0.84] |
| 3.4 4‐6 months post MDA | 3 | 2979 | Risk Ratio (M‐H, Random, 95% CI) | 0.41 [0.24, 0.72] |
| 3.5 7‐12 months post MDA | 1 | 75 | Risk Ratio (M‐H, Random, 95% CI) | 0.72 [0.43, 1.20] |
| 3.6 >12 months post MDA | 1 | 2375 | Risk Ratio (M‐H, Random, 95% CI) | 0.10 [0.07, 0.12] |
| 4 Parasitaemia Incidence: Cluster‐randomized trials Show forest plot | 1 | Rate Ratio (Random, 95% CI) | 0.84 [0.53, 1.32] | |
| Analysis 3.4  Comparison 3 MDA versus no MDA in areas of high endemicity (Stratified by study design), Outcome 4 Parasitaemia Incidence: Cluster‐randomized trials. | ||||
| 4.1 < 1 month post MDA | 1 | Rate Ratio (Random, 95% CI) | 0.41 [0.23, 0.74] | |
| 4.2 1‐3 months post MDA | 1 | Rate Ratio (Random, 95% CI) | 1.03 [0.75, 1.41] | |
| 4.3 4‐6 months post MDA | 1 | Rate Ratio (Random, 95% CI) | 1.11 [0.84, 1.45] | |
| 5 Gametocytaemia Prevalence: Cluster‐randomized trials Show forest plot | 1 | Risk Ratio (M‐H, Random, 95% CI) | Subtotals only | |
| Analysis 3.5  Comparison 3 MDA versus no MDA in areas of high endemicity (Stratified by study design), Outcome 5 Gametocytaemia Prevalence: Cluster‐randomized trials. | ||||
| 5.1 At baseline | 1 | 1376 | Risk Ratio (M‐H, Random, 95% CI) | 0.66 [0.33, 1.29] |
| 5.2 4‐6 months post MDA | 1 | 1414 | Risk Ratio (M‐H, Random, 95% CI) | 1.07 [0.62, 1.85] |
| 6 Gametocytaemia Prevalence: Non‐randomized controlled studies Show forest plot | 3 | Risk Ratio (M‐H, Random, 95% CI) | Subtotals only | |
| Analysis 3.6 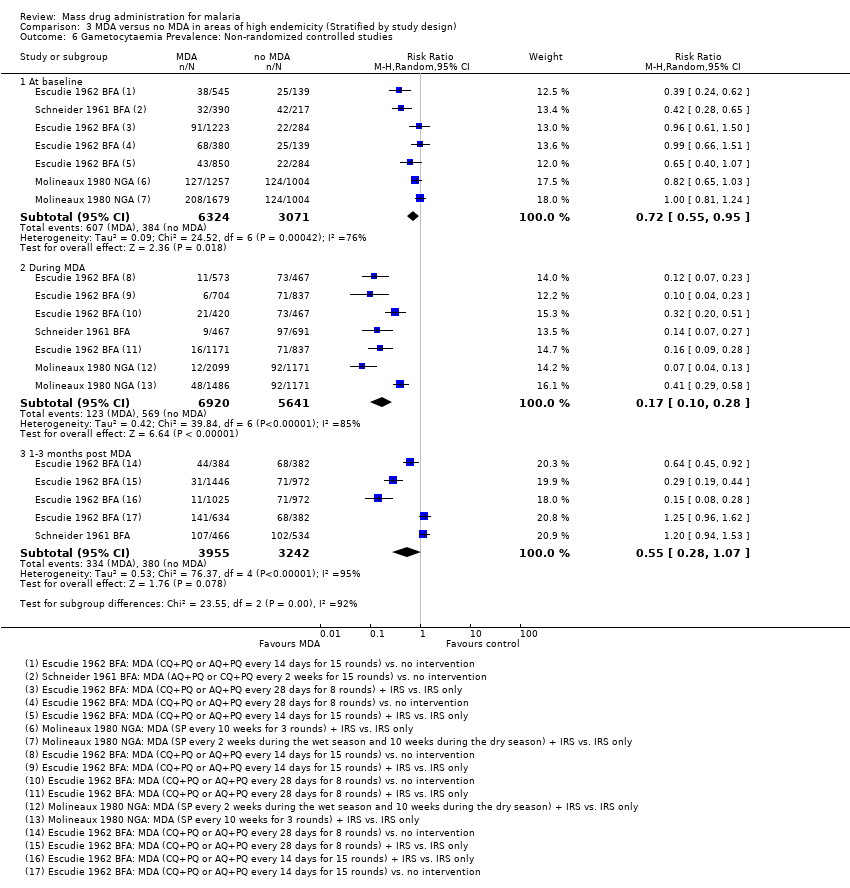 Comparison 3 MDA versus no MDA in areas of high endemicity (Stratified by study design), Outcome 6 Gametocytaemia Prevalence: Non‐randomized controlled studies. | ||||
| 6.1 At baseline | 3 | 9395 | Risk Ratio (M‐H, Random, 95% CI) | 0.72 [0.55, 0.95] |
| 6.2 During MDA | 3 | 12561 | Risk Ratio (M‐H, Random, 95% CI) | 0.17 [0.10, 0.28] |
| 6.3 1‐3 months post MDA | 2 | 7197 | Risk Ratio (M‐H, Random, 95% CI) | 0.55 [0.28, 1.07] |
| 7 Gametocytaemia Prevalence: Uncontrolled before‐and‐after studies Show forest plot | 5 | Risk Ratio (M‐H, Random, 95% CI) | Subtotals only | |
| Analysis 3.7 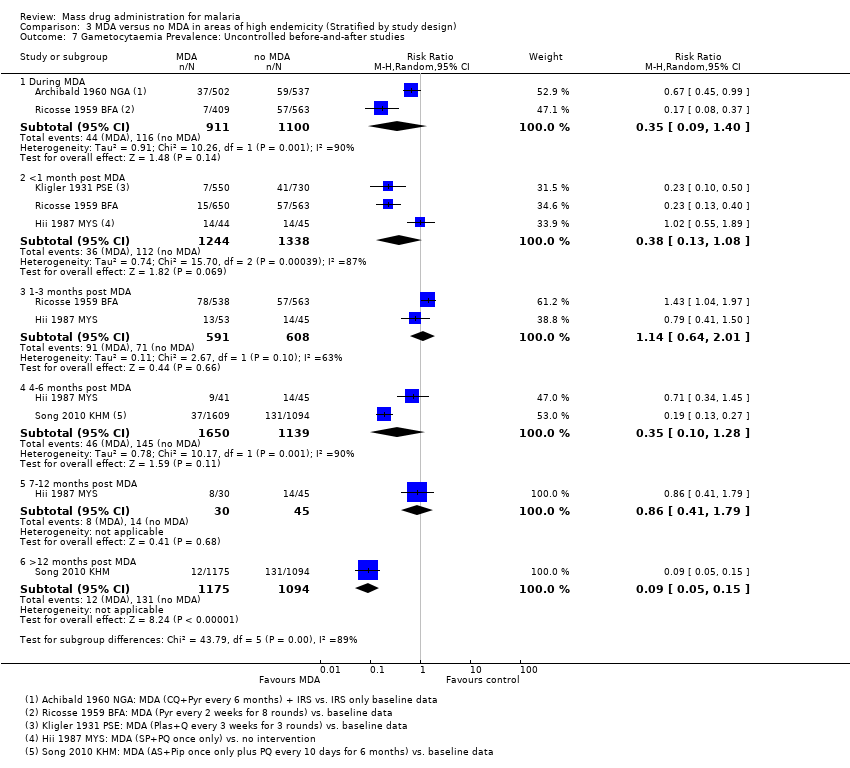 Comparison 3 MDA versus no MDA in areas of high endemicity (Stratified by study design), Outcome 7 Gametocytaemia Prevalence: Uncontrolled before‐and‐after studies. | ||||
| 7.1 During MDA | 2 | 2011 | Risk Ratio (M‐H, Random, 95% CI) | 0.35 [0.09, 1.40] |
| 7.2 <1 month post MDA | 3 | 2582 | Risk Ratio (M‐H, Random, 95% CI) | 0.38 [0.13, 1.08] |
| 7.3 1‐3 months post MDA | 2 | 1199 | Risk Ratio (M‐H, Random, 95% CI) | 1.14 [0.64, 2.01] |
| 7.4 4‐6 months post MDA | 2 | 2789 | Risk Ratio (M‐H, Random, 95% CI) | 0.35 [0.10, 1.28] |
| 7.5 7‐12 months post MDA | 1 | 75 | Risk Ratio (M‐H, Random, 95% CI) | 0.86 [0.41, 1.79] |
| 7.6 >12 months post MDA | 1 | 2269 | Risk Ratio (M‐H, Random, 95% CI) | 0.09 [0.05, 0.15] |
| 8 Anaemia Prevalence: Cluster‐randomized trials Show forest plot | 1 | Risk Ratio (M‐H, Random, 95% CI) | Subtotals only | |
| Analysis 3.8  Comparison 3 MDA versus no MDA in areas of high endemicity (Stratified by study design), Outcome 8 Anaemia Prevalence: Cluster‐randomized trials. | ||||
| 8.1 4‐6 months post MDA | 1 | 1414 | Risk Ratio (M‐H, Random, 95% CI) | 0.84 [0.75, 0.93] |
| 9 Mortality: Cluster‐randomized trials Show forest plot | 1 | Risk Ratio (M‐H, Random, 95% CI) | Subtotals only | |
| Analysis 3.9  Comparison 3 MDA versus no MDA in areas of high endemicity (Stratified by study design), Outcome 9 Mortality: Cluster‐randomized trials. | ||||
| 9.1 4‐6 months post MDA | 1 | 3655 | Risk Ratio (M‐H, Random, 95% CI) | 1.43 [0.34, 5.96] |
| Outcome or subgroup title | No. of studies | No. of participants | Statistical method | Effect size |
| 1 Parasitaemia Prevalence: Non‐randomized controlled studies Show forest plot | 1 | Risk Ratio (M‐H, Random, 95% CI) | Subtotals only | |
| Analysis 4.1  Comparison 4 MDA + vector control versus no intervention in areas of moderate endemicity (Stratified by study design), Outcome 1 Parasitaemia Prevalence: Non‐randomized controlled studies. | ||||
| 1.1 At baseline | 1 | 1080 | Risk Ratio (M‐H, Random, 95% CI) | 2.09 [1.48, 2.98] |
| 1.2 >12 months post MDA | 1 | 1331 | Risk Ratio (M‐H, Random, 95% CI) | 0.10 [0.05, 0.20] |
| 2 Parasitaemia Prevalence: Uncontrolled before‐and‐after studies Show forest plot | 4 | Risk Ratio (M‐H, Random, 95% CI) | Subtotals only | |
| Analysis 4.2 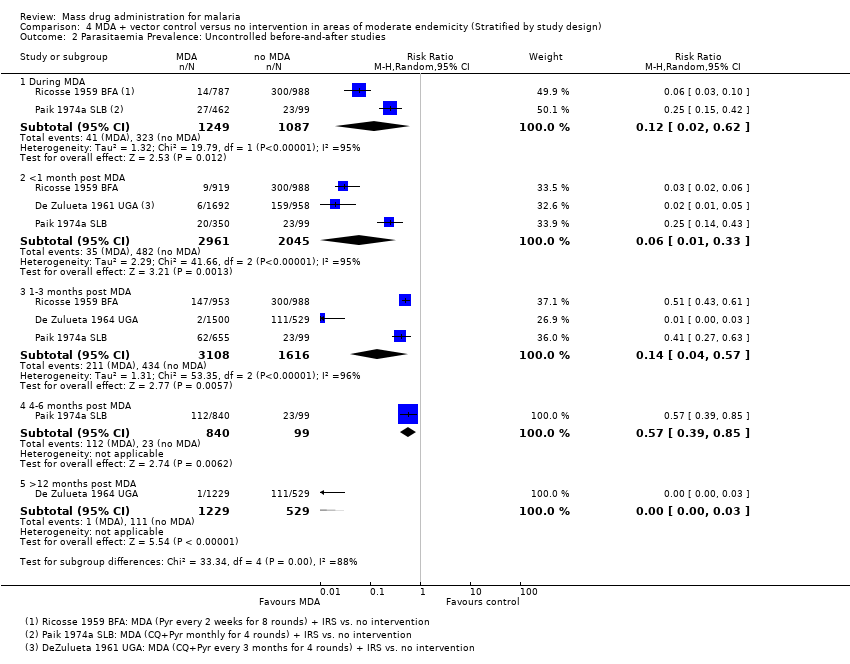 Comparison 4 MDA + vector control versus no intervention in areas of moderate endemicity (Stratified by study design), Outcome 2 Parasitaemia Prevalence: Uncontrolled before‐and‐after studies. | ||||
| 2.1 During MDA | 2 | 2336 | Risk Ratio (M‐H, Random, 95% CI) | 0.12 [0.02, 0.62] |
| 2.2 <1 month post MDA | 3 | 5006 | Risk Ratio (M‐H, Random, 95% CI) | 0.06 [0.01, 0.33] |
| 2.3 1‐3 months post MDA | 3 | 4724 | Risk Ratio (M‐H, Random, 95% CI) | 0.14 [0.04, 0.57] |
| 2.4 4‐6 months post MDA | 1 | 939 | Risk Ratio (M‐H, Random, 95% CI) | 0.57 [0.39, 0.85] |
| 2.5 >12 months post MDA | 1 | 1758 | Risk Ratio (M‐H, Random, 95% CI) | 0.00 [0.00, 0.03] |
| 3 Gametocytaemia Prevalence: Uncontrolled before‐and‐after studies Show forest plot | 2 | Risk Ratio (M‐H, Random, 95% CI) | Subtotals only | |
| Analysis 4.3  Comparison 4 MDA + vector control versus no intervention in areas of moderate endemicity (Stratified by study design), Outcome 3 Gametocytaemia Prevalence: Uncontrolled before‐and‐after studies. | ||||
| 3.1 During MDA | 2 | 4425 | Risk Ratio (M‐H, Random, 95% CI) | 0.13 [0.06, 0.27] |
| 3.2 < 1 month post MDA | 1 | 1907 | Risk Ratio (M‐H, Random, 95% CI) | 0.01 [0.00, 0.16] |
| 3.3 1‐3 months post MDA | 1 | 1941 | Risk Ratio (M‐H, Random, 95% CI) | 0.22 [0.11, 0.41] |
| Outcome or subgroup title | No. of studies | No. of participants | Statistical method | Effect size |
| 1 Parasitaemia Prevalence: Non‐randomized controlled studies Show forest plot | 3 | Risk Ratio (M‐H, Random, 95% CI) | Subtotals only | |
| Analysis 5.1 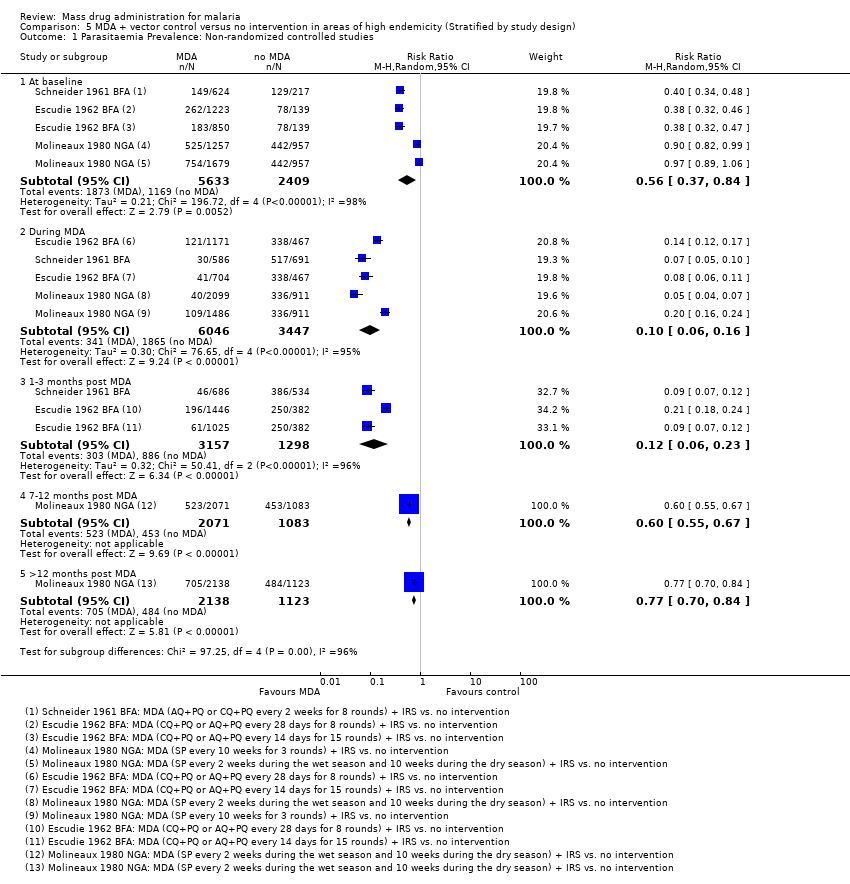 Comparison 5 MDA + vector control versus no intervention in areas of high endemicity (Stratified by study design), Outcome 1 Parasitaemia Prevalence: Non‐randomized controlled studies. | ||||
| 1.1 At baseline | 3 | 8042 | Risk Ratio (M‐H, Random, 95% CI) | 0.56 [0.37, 0.84] |
| 1.2 During MDA | 3 | 9493 | Risk Ratio (M‐H, Random, 95% CI) | 0.10 [0.06, 0.16] |
| 1.3 1‐3 months post MDA | 2 | 4455 | Risk Ratio (M‐H, Random, 95% CI) | 0.12 [0.06, 0.23] |
| 1.4 7‐12 months post MDA | 1 | 3154 | Risk Ratio (M‐H, Random, 95% CI) | 0.60 [0.55, 0.67] |
| 1.5 >12 months post MDA | 1 | 3261 | Risk Ratio (M‐H, Random, 95% CI) | 0.77 [0.70, 0.84] |
| 2 Parasitaemia Prevalence: Uncontrolled before‐and‐after studies Show forest plot | 2 | Risk Ratio (M‐H, Random, 95% CI) | Subtotals only | |
| Analysis 5.2  Comparison 5 MDA + vector control versus no intervention in areas of high endemicity (Stratified by study design), Outcome 2 Parasitaemia Prevalence: Uncontrolled before‐and‐after studies. | ||||
| 2.1 During MDA | 2 | 5437 | Risk Ratio (M‐H, Random, 95% CI) | 0.17 [0.09, 0.31] |
| 2.2 1‐3 months post MDA | 2 | 5440 | Risk Ratio (M‐H, Random, 95% CI) | 0.13 [0.01, 2.51] |
| 2.3 4‐6 months post MDA | 1 | 415 | Risk Ratio (M‐H, Random, 95% CI) | 0.83 [0.66, 1.04] |
| 2.4 7‐12 months post MDA | 1 | 412 | Risk Ratio (M‐H, Random, 95% CI) | 0.93 [0.75, 1.16] |
| 3 Gametocytaemia Prevalence: Non‐randomized controlled studies Show forest plot | 3 | Risk Ratio (M‐H, Random, 95% CI) | Subtotals only | |
| Analysis 5.3  Comparison 5 MDA + vector control versus no intervention in areas of high endemicity (Stratified by study design), Outcome 3 Gametocytaemia Prevalence: Non‐randomized controlled studies. | ||||
| 3.1 At baseline | 3 | 8042 | Risk Ratio (M‐H, Random, 95% CI) | 0.53 [0.31, 0.90] |
| 3.2 During MDA | 3 | 9493 | Risk Ratio (M‐H, Random, 95% CI) | 0.08 [0.03, 0.20] |
| 3.3 1‐3 months post MDA | 2 | 4455 | Risk Ratio (M‐H, Random, 95% CI) | 0.08 [0.05, 0.14] |
| 3.4 7‐12 months post MDA | 1 | 3154 | Risk Ratio (M‐H, Random, 95% CI) | 0.87 [0.73, 1.05] |
| 3.5 > 12 months post MDA | 1 | 3261 | Risk Ratio (M‐H, Random, 95% CI) | 0.96 [0.81, 1.14] |
| 4 Gametocytaemia Prevalence: Uncontrolled before‐and‐after studies Show forest plot | 1 | Risk Ratio (M‐H, Random, 95% CI) | Subtotals only | |
| Analysis 5.4 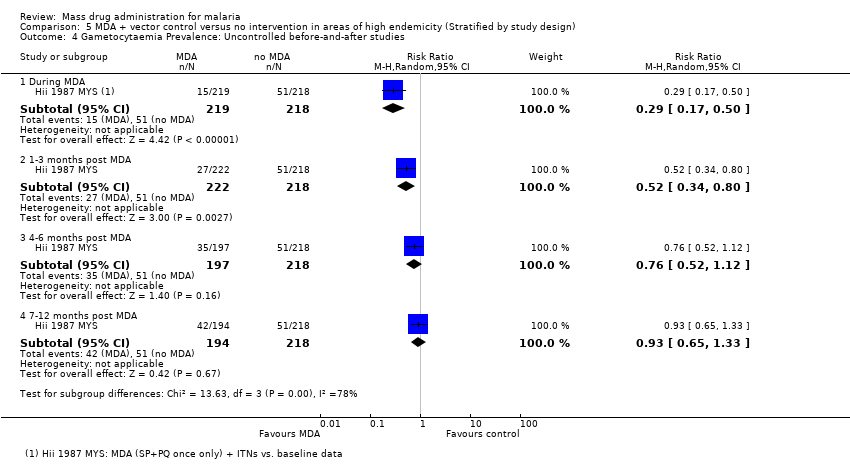 Comparison 5 MDA + vector control versus no intervention in areas of high endemicity (Stratified by study design), Outcome 4 Gametocytaemia Prevalence: Uncontrolled before‐and‐after studies. | ||||
| 4.1 During MDA | 1 | 437 | Risk Ratio (M‐H, Random, 95% CI) | 0.29 [0.17, 0.50] |
| 4.2 1‐3 months post MDA | 1 | 440 | Risk Ratio (M‐H, Random, 95% CI) | 0.52 [0.34, 0.80] |
| 4.3 4‐6 months post MDA | 1 | 415 | Risk Ratio (M‐H, Random, 95% CI) | 0.76 [0.52, 1.12] |
| 4.4 7‐12 months post MDA | 1 | 412 | Risk Ratio (M‐H, Random, 95% CI) | 0.93 [0.65, 1.33] |
| Outcome or subgroup title | No. of studies | No. of participants | Statistical method | Effect size |
| 1 MDA versus no MDA: Uncontrolled before‐and‐after studies Show forest plot | 4 | Rate Ratio (Random, 95% CI) | Subtotals only | |
| Analysis 6.1 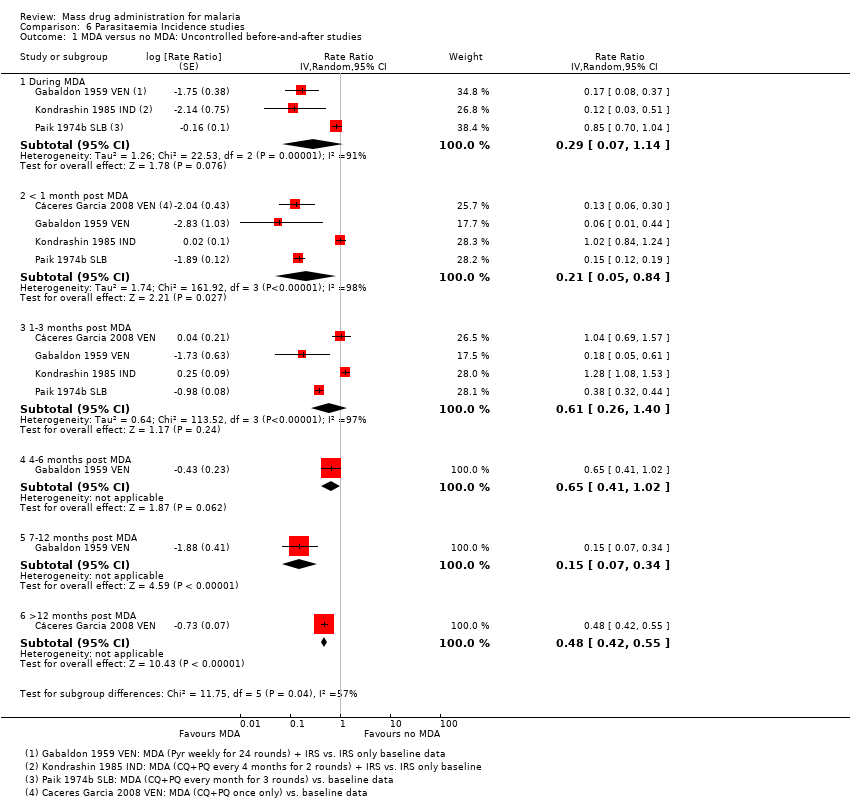 Comparison 6 Parasitaemia Incidence studies, Outcome 1 MDA versus no MDA: Uncontrolled before‐and‐after studies. | ||||
| 1.1 During MDA | 3 | Rate Ratio (Random, 95% CI) | 0.29 [0.07, 1.14] | |
| 1.2 < 1 month post MDA | 4 | Rate Ratio (Random, 95% CI) | 0.21 [0.05, 0.84] | |
| 1.3 1‐3 months post MDA | 4 | Rate Ratio (Random, 95% CI) | 0.61 [0.26, 1.40] | |
| 1.4 4‐6 months post MDA | 1 | Rate Ratio (Random, 95% CI) | 0.65 [0.41, 1.02] | |
| 1.5 7‐12 months post MDA | 1 | Rate Ratio (Random, 95% CI) | 0.15 [0.07, 0.34] | |
| 1.6 >12 months post MDA | 1 | Rate Ratio (Random, 95% CI) | 0.48 [0.42, 0.55] | |
| 2 MDA + vector control versus no MDA: Uncontrolled before‐and‐after studies Show forest plot | 2 | Rate Ratio (Random, 95% CI) | Subtotals only | |
| Analysis 6.2  Comparison 6 Parasitaemia Incidence studies, Outcome 2 MDA + vector control versus no MDA: Uncontrolled before‐and‐after studies. | ||||
| 2.1 During MDA | 2 | Rate Ratio (Random, 95% CI) | 0.92 [0.49, 1.75] | |
| 2.2 < 1 month post MDA | 2 | Rate Ratio (Random, 95% CI) | 0.04 [0.00, 1.54] | |
| 2.3 1‐3 months post MDA | 2 | Rate Ratio (Random, 95% CI) | 0.08 [0.01, 0.98] | |
| 2.4 4‐6 months post MDA | 2 | Rate Ratio (Random, 95% CI) | 0.11 [0.01, 1.97] | |
| 2.5 7‐12 months post MDA | 2 | Rate Ratio (Random, 95% CI) | 0.16 [0.01, 3.10] | |
| 2.6 > 12 months post MDA | 1 | Rate Ratio (Random, 95% CI) | 0.04 [0.03, 0.07] | |
| Outcome or subgroup title | No. of studies | No. of participants | Statistical method | Effect size |
| 1 Parasitaemia Prevalence during MDA Show forest plot | 4 | Risk Ratio (M‐H, Random, 95% CI) | Subtotals only | |
| Analysis 7.1  Comparison 7 MDA versus no MDA in areas of moderate and high endemicity (Stratified by study design; subgrouped by 8‐aminoquinoline), Outcome 1 Parasitaemia Prevalence during MDA. | ||||
| 1.1 Non‐randomized controlled studies ‐ with 8‐aminoquinoline | 2 | 6634 | Risk Ratio (M‐H, Random, 95% CI) | 0.20 [0.12, 0.32] |
| 1.2 Non‐randomized controlled studies ‐ without 8‐aminoquinoline | 2 | 52941 | Risk Ratio (M‐H, Random, 95% CI) | 0.16 [0.08, 0.31] |
| 2 Parasitaemia Prevalence 1‐3 months post MDA Show forest plot | 4 | Risk Ratio (M‐H, Random, 95% CI) | Subtotals only | |
| Analysis 7.2  Comparison 7 MDA versus no MDA in areas of moderate and high endemicity (Stratified by study design; subgrouped by 8‐aminoquinoline), Outcome 2 Parasitaemia Prevalence 1‐3 months post MDA. | ||||
| 2.1 Non‐randomized controlled studies ‐ with 8‐aminoquinoline | 2 | 7197 | Risk Ratio (M‐H, Random, 95% CI) | 0.52 [0.33, 0.81] |
| 2.2 Non‐randomized controlled studies ‐ without 8‐aminoquinoline | 2 | 1557 | Risk Ratio (M‐H, Random, 95% CI) | 0.15 [0.10, 0.23] |
| 3 Parasitaemia Prevalence during MDA Show forest plot | 4 | Risk Ratio (M‐H, Random, 95% CI) | Subtotals only | |
| Analysis 7.3 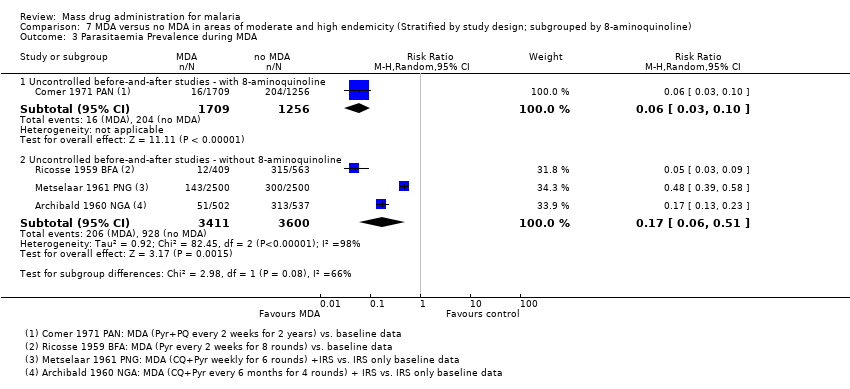 Comparison 7 MDA versus no MDA in areas of moderate and high endemicity (Stratified by study design; subgrouped by 8‐aminoquinoline), Outcome 3 Parasitaemia Prevalence during MDA. | ||||
| 3.1 Uncontrolled before‐and‐after studies ‐ with 8‐aminoquinoline | 1 | 2965 | Risk Ratio (M‐H, Random, 95% CI) | 0.06 [0.03, 0.10] |
| 3.2 Uncontrolled before‐and‐after studies ‐ without 8‐aminoquinoline | 3 | 7011 | Risk Ratio (M‐H, Random, 95% CI) | 0.17 [0.06, 0.51] |
| 4 Parasitaemia Prevalence <1 month post MDA Show forest plot | 7 | Risk Ratio (M‐H, Random, 95% CI) | Subtotals only | |
| Analysis 7.4  Comparison 7 MDA versus no MDA in areas of moderate and high endemicity (Stratified by study design; subgrouped by 8‐aminoquinoline), Outcome 4 Parasitaemia Prevalence <1 month post MDA. | ||||
| 4.1 Uncontrolled before‐and‐after studies ‐ with 8‐aminoquinoline | 3 | 2650 | Risk Ratio (M‐H, Random, 95% CI) | 0.42 [0.29, 0.61] |
| 4.2 Uncontrolled before‐and‐after studies ‐ without 8‐aminoquinoline | 4 | 4309 | Risk Ratio (M‐H, Random, 95% CI) | 0.29 [0.22, 0.38] |
| 5 Parasitaemia Prevalence 1‐3 months post MDA Show forest plot | 7 | Risk Ratio (M‐H, Fixed, 95% CI) | Subtotals only | |
| Analysis 7.5  Comparison 7 MDA versus no MDA in areas of moderate and high endemicity (Stratified by study design; subgrouped by 8‐aminoquinoline), Outcome 5 Parasitaemia Prevalence 1‐3 months post MDA. | ||||
| 5.1 Uncontrolled before‐and‐after studies ‐ with 8‐aminoquinoline | 1 | 98 | Risk Ratio (M‐H, Fixed, 95% CI) | 0.65 [0.41, 1.01] |
| 5.2 Uncontrolled before‐and‐after studies ‐ without 8‐aminoquinoline | 6 | 12959 | Risk Ratio (M‐H, Fixed, 95% CI) | 0.32 [0.29, 0.34] |
| 6 Parasitaemia Prevalence 4‐6 months post MDA Show forest plot | 5 | Risk Ratio (M‐H, Random, 95% CI) | Subtotals only | |
| Analysis 7.6  Comparison 7 MDA versus no MDA in areas of moderate and high endemicity (Stratified by study design; subgrouped by 8‐aminoquinoline), Outcome 6 Parasitaemia Prevalence 4‐6 months post MDA. | ||||
| 6.1 Uncontrolled before‐and‐after studies ‐ with 8‐aminoquinoline | 3 | 2979 | Risk Ratio (M‐H, Random, 95% CI) | 0.41 [0.24, 0.72] |
| 6.2 Uncontrolled before‐and‐after studies ‐ without 8‐aminoquinoline | 2 | 3797 | Risk Ratio (M‐H, Random, 95% CI) | 1.75 [0.41, 7.41] |
| Outcome or subgroup title | No. of studies | No. of participants | Statistical method | Effect size |
| 1 Parasitaemia Prevalence at baseline Show forest plot | 2 | Risk Ratio (M‐H, Random, 95% CI) | Subtotals only | |
| Analysis 8.1  Comparison 8 MDA versus no MDA for all endemicity levels (Stratified by study design; subgrouped by plasmodium species), Outcome 1 Parasitaemia Prevalence at baseline. | ||||
| 1.1 Non‐randomized controlled studies ‐ falciparum | 2 | 1537 | Risk Ratio (M‐H, Random, 95% CI) | 1.34 [1.03, 1.74] |
| 1.2 Non‐randomized controlled studies ‐ vivax | 2 | 1537 | Risk Ratio (M‐H, Random, 95% CI) | 3.84 [1.33, 11.04] |
| 2 Parasitaemia Prevalence during MDA Show forest plot | 2 | Risk Ratio (M‐H, Random, 95% CI) | Subtotals only | |
| Analysis 8.2  Comparison 8 MDA versus no MDA for all endemicity levels (Stratified by study design; subgrouped by plasmodium species), Outcome 2 Parasitaemia Prevalence during MDA. | ||||
| 2.1 Uncontrolled before‐and‐after studies ‐ falciparum | 2 | 5561 | Risk Ratio (M‐H, Random, 95% CI) | 0.40 [0.08, 1.97] |
| 2.2 Uncontrolled before‐and‐after studies ‐ vivax | 2 | 5561 | Risk Ratio (M‐H, Random, 95% CI) | 0.60 [0.40, 0.90] |
| 3 Parasitaemia Prevalence <1 month post MDA Show forest plot | 5 | Risk Ratio (M‐H, Random, 95% CI) | Subtotals only | |
| Analysis 8.3  Comparison 8 MDA versus no MDA for all endemicity levels (Stratified by study design; subgrouped by plasmodium species), Outcome 3 Parasitaemia Prevalence <1 month post MDA. | ||||
| 3.1 Non‐randomized controlled studies ‐ falciparum | 1 | 433 | Risk Ratio (M‐H, Random, 95% CI) | 0.02 [0.00, 0.08] |
| 3.2 Non‐randomized controlled studies ‐ vivax | 1 | 433 | Risk Ratio (M‐H, Random, 95% CI) | 0.05 [0.00, 0.82] |
| 3.3 Uncontrolled before‐and‐after studies ‐ falciparum | 4 | 7367 | Risk Ratio (M‐H, Random, 95% CI) | 0.22 [0.18, 0.29] |
| 3.4 Uncontrolled before‐and‐after studies ‐ vivax | 4 | 7367 | Risk Ratio (M‐H, Random, 95% CI) | 0.50 [0.41, 0.61] |
| 4 Parasitaemia Prevalence 1‐3 months post MDA Show forest plot | 3 | Risk Ratio (M‐H, Random, 95% CI) | Subtotals only | |
| Analysis 8.4 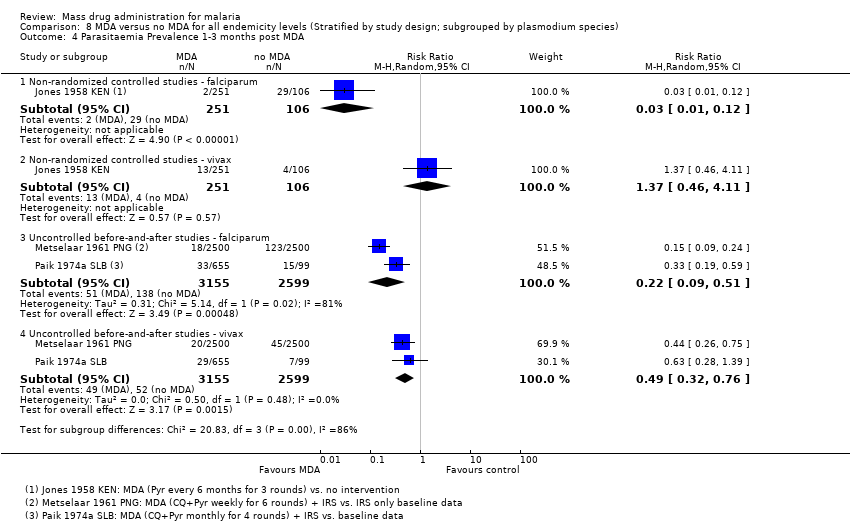 Comparison 8 MDA versus no MDA for all endemicity levels (Stratified by study design; subgrouped by plasmodium species), Outcome 4 Parasitaemia Prevalence 1‐3 months post MDA. | ||||
| 4.1 Non‐randomized controlled studies ‐ falciparum | 1 | 357 | Risk Ratio (M‐H, Random, 95% CI) | 0.03 [0.01, 0.12] |
| 4.2 Non‐randomized controlled studies ‐ vivax | 1 | 357 | Risk Ratio (M‐H, Random, 95% CI) | 1.37 [0.46, 4.11] |
| 4.3 Uncontrolled before‐and‐after studies ‐ falciparum | 2 | 5754 | Risk Ratio (M‐H, Random, 95% CI) | 0.22 [0.09, 0.51] |
| 4.4 Uncontrolled before‐and‐after studies ‐ vivax | 2 | 5754 | Risk Ratio (M‐H, Random, 95% CI) | 0.49 [0.32, 0.76] |
| 5 Parasitaemia Prevalence 4‐6 months post MDA Show forest plot | 3 | Risk Ratio (M‐H, Random, 95% CI) | Subtotals only | |
| Analysis 8.5  Comparison 8 MDA versus no MDA for all endemicity levels (Stratified by study design; subgrouped by plasmodium species), Outcome 5 Parasitaemia Prevalence 4‐6 months post MDA. | ||||
| 5.1 Non‐randomized controlled studies ‐ falciparum | 1 | 410 | Risk Ratio (M‐H, Random, 95% CI) | 0.22 [0.14, 0.33] |
| 5.2 Non‐randomized controlled studies ‐ vivax | 1 | 410 | Risk Ratio (M‐H, Random, 95% CI) | 0.81 [0.31, 2.08] |
| 5.3 Uncontrolled before‐and‐after studies ‐ falciparum | 2 | 3642 | Risk Ratio (M‐H, Random, 95% CI) | 0.40 [0.13, 1.23] |
| 5.4 Uncontrolled before‐and‐after studies ‐ vivax | 2 | 3642 | Risk Ratio (M‐H, Random, 95% CI) | 0.31 [0.24, 0.39] |
| 6 Parasitaemia Prevalence >12 months post MDA Show forest plot | 3 | Risk Ratio (M‐H, Random, 95% CI) | Subtotals only | |
| Analysis 8.6  Comparison 8 MDA versus no MDA for all endemicity levels (Stratified by study design; subgrouped by plasmodium species), Outcome 6 Parasitaemia Prevalence >12 months post MDA. | ||||
| 6.1 Non‐randomized controlled studies ‐ falciparum | 1 | 1331 | Risk Ratio (M‐H, Random, 95% CI) | 0.01 [0.00, 0.13] |
| 6.2 Non‐randomized controlled studies ‐ vivax | 1 | 1331 | Risk Ratio (M‐H, Random, 95% CI) | 0.36 [0.15, 0.86] |
| 6.3 Uncontrolled before‐and‐after studies ‐ falciparum | 2 | 5884 | Risk Ratio (M‐H, Random, 95% CI) | 0.06 [0.04, 0.09] |
| 6.4 Uncontrolled before‐and‐after studies ‐ vivax | 2 | 5884 | Risk Ratio (M‐H, Random, 95% CI) | 0.17 [0.12, 0.24] |
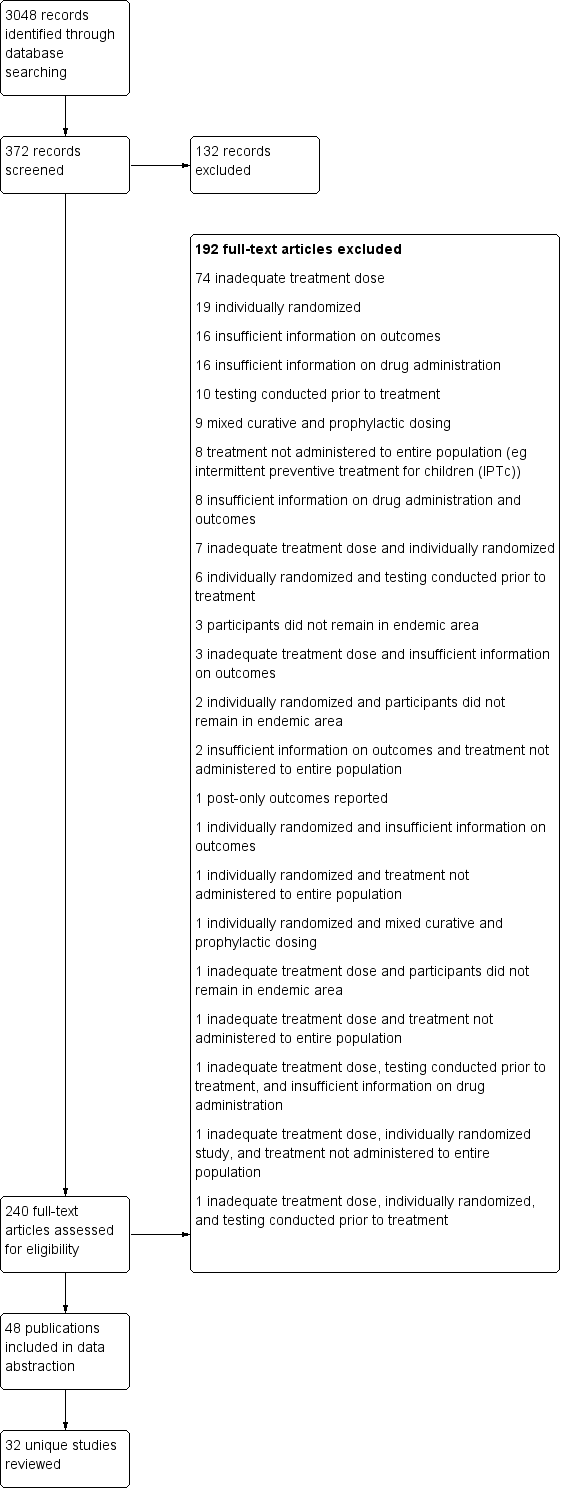
Study flow diagram.

Risk of bias summary: review authors' judgements about each risk of bias item for each included study.

Risk of bias graph: review authors' judgements about each risk of bias item presented as percentages across all included studies.

Comparison 1 MDA versus no MDA in areas of low endemicity (Stratified by study design), Outcome 1 Parasitaemia Prevalence: Cluster‐randomized trials.
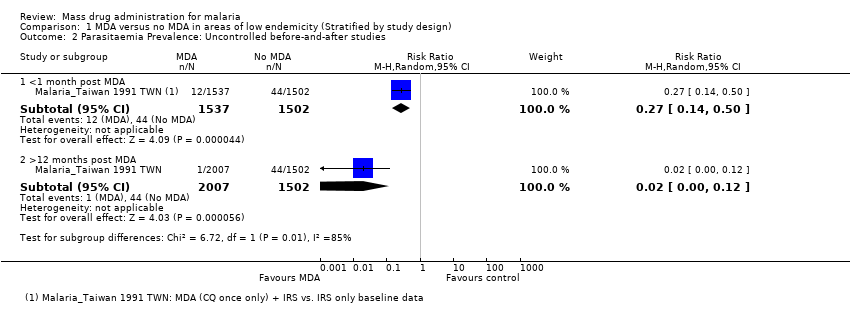
Comparison 1 MDA versus no MDA in areas of low endemicity (Stratified by study design), Outcome 2 Parasitaemia Prevalence: Uncontrolled before‐and‐after studies.
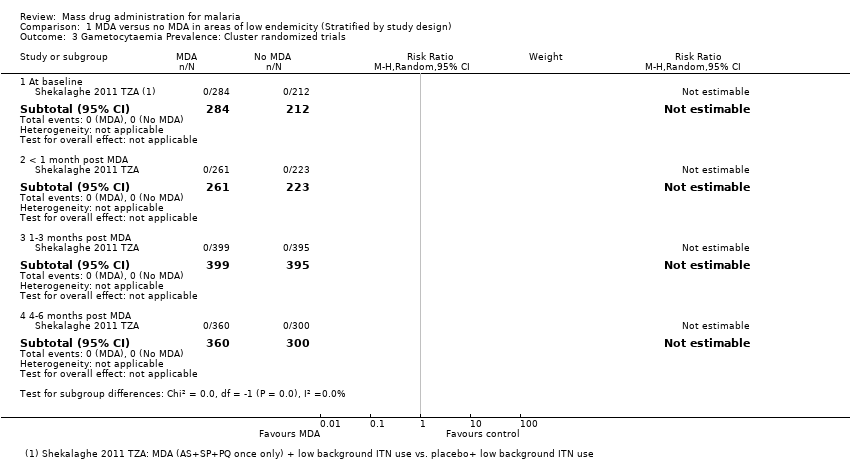
Comparison 1 MDA versus no MDA in areas of low endemicity (Stratified by study design), Outcome 3 Gametocytaemia Prevalence: Cluster randomized trials.

Comparison 2 MDA versus no MDA in areas of moderate endemicity (Stratified by study design), Outcome 1 Parasitaemia Prevalence: Non‐randomized controlled studies.

Comparison 2 MDA versus no MDA in areas of moderate endemicity (Stratified by study design), Outcome 2 Parasitaemia Prevalence: Uncontrolled before‐and‐after studies.

Comparison 2 MDA versus no MDA in areas of moderate endemicity (Stratified by study design), Outcome 3 Gametocytaemia Prevalence: Non‐randomized controlled studies.

Comparison 2 MDA versus no MDA in areas of moderate endemicity (Stratified by study design), Outcome 4 Gametocytaemia Prevalence: Uncontrolled before‐and‐after studies.

Comparison 3 MDA versus no MDA in areas of high endemicity (Stratified by study design), Outcome 1 Parasitaemia Prevalence: Cluster‐randomized trials.
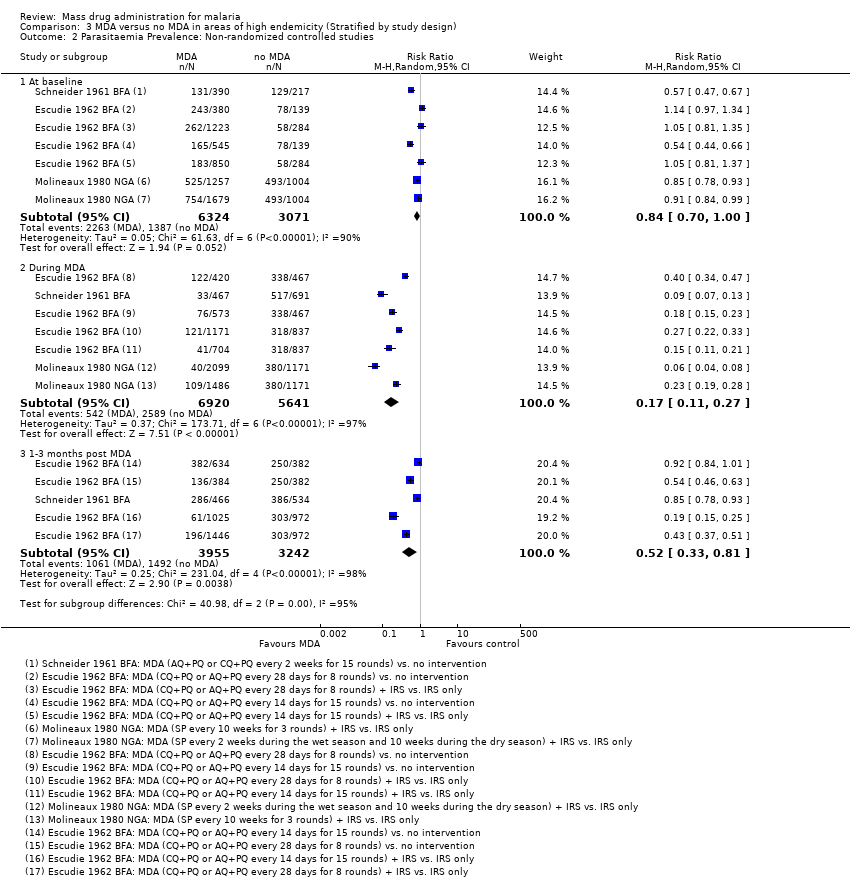
Comparison 3 MDA versus no MDA in areas of high endemicity (Stratified by study design), Outcome 2 Parasitaemia Prevalence: Non‐randomized controlled studies.

Comparison 3 MDA versus no MDA in areas of high endemicity (Stratified by study design), Outcome 3 Parasitaemia Prevalence: Uncontrolled before‐and‐after studies.

Comparison 3 MDA versus no MDA in areas of high endemicity (Stratified by study design), Outcome 4 Parasitaemia Incidence: Cluster‐randomized trials.

Comparison 3 MDA versus no MDA in areas of high endemicity (Stratified by study design), Outcome 5 Gametocytaemia Prevalence: Cluster‐randomized trials.

Comparison 3 MDA versus no MDA in areas of high endemicity (Stratified by study design), Outcome 6 Gametocytaemia Prevalence: Non‐randomized controlled studies.

Comparison 3 MDA versus no MDA in areas of high endemicity (Stratified by study design), Outcome 7 Gametocytaemia Prevalence: Uncontrolled before‐and‐after studies.

Comparison 3 MDA versus no MDA in areas of high endemicity (Stratified by study design), Outcome 8 Anaemia Prevalence: Cluster‐randomized trials.
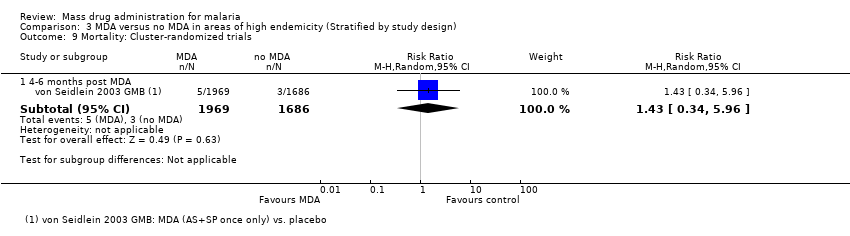
Comparison 3 MDA versus no MDA in areas of high endemicity (Stratified by study design), Outcome 9 Mortality: Cluster‐randomized trials.

Comparison 4 MDA + vector control versus no intervention in areas of moderate endemicity (Stratified by study design), Outcome 1 Parasitaemia Prevalence: Non‐randomized controlled studies.

Comparison 4 MDA + vector control versus no intervention in areas of moderate endemicity (Stratified by study design), Outcome 2 Parasitaemia Prevalence: Uncontrolled before‐and‐after studies.
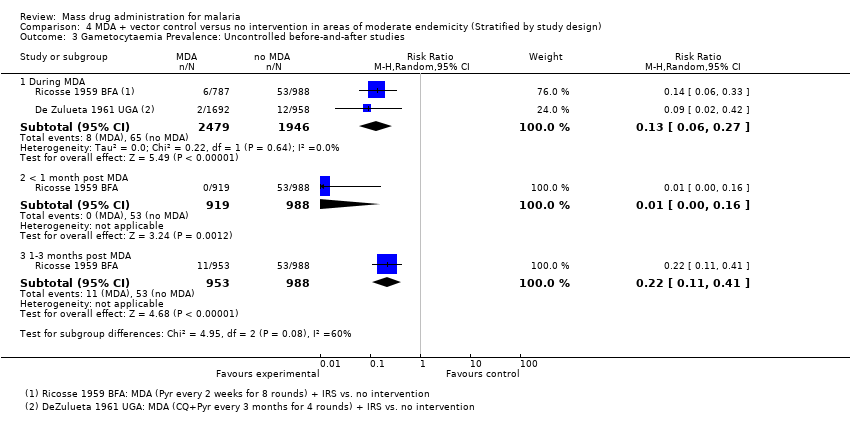
Comparison 4 MDA + vector control versus no intervention in areas of moderate endemicity (Stratified by study design), Outcome 3 Gametocytaemia Prevalence: Uncontrolled before‐and‐after studies.

Comparison 5 MDA + vector control versus no intervention in areas of high endemicity (Stratified by study design), Outcome 1 Parasitaemia Prevalence: Non‐randomized controlled studies.

Comparison 5 MDA + vector control versus no intervention in areas of high endemicity (Stratified by study design), Outcome 2 Parasitaemia Prevalence: Uncontrolled before‐and‐after studies.

Comparison 5 MDA + vector control versus no intervention in areas of high endemicity (Stratified by study design), Outcome 3 Gametocytaemia Prevalence: Non‐randomized controlled studies.

Comparison 5 MDA + vector control versus no intervention in areas of high endemicity (Stratified by study design), Outcome 4 Gametocytaemia Prevalence: Uncontrolled before‐and‐after studies.

Comparison 6 Parasitaemia Incidence studies, Outcome 1 MDA versus no MDA: Uncontrolled before‐and‐after studies.

Comparison 6 Parasitaemia Incidence studies, Outcome 2 MDA + vector control versus no MDA: Uncontrolled before‐and‐after studies.
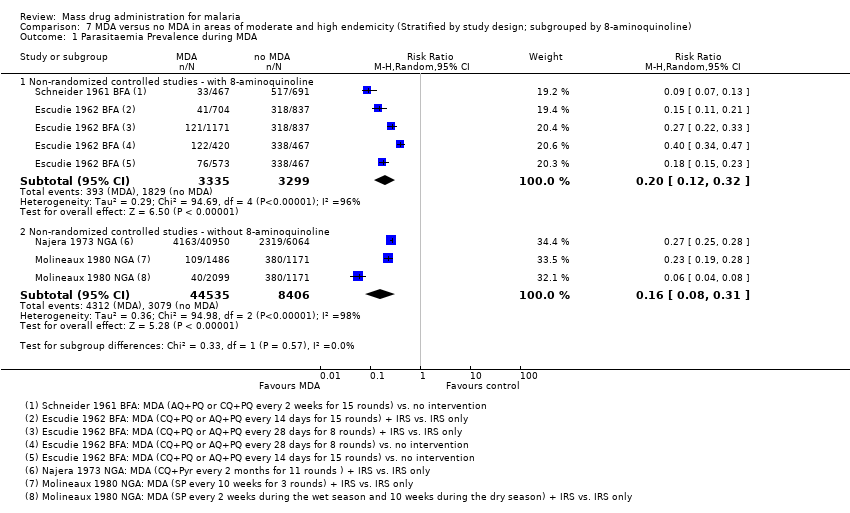
Comparison 7 MDA versus no MDA in areas of moderate and high endemicity (Stratified by study design; subgrouped by 8‐aminoquinoline), Outcome 1 Parasitaemia Prevalence during MDA.
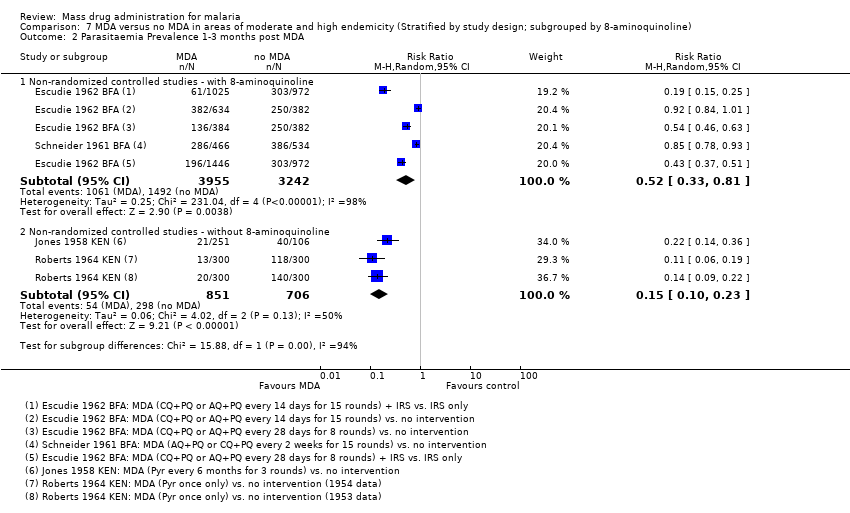
Comparison 7 MDA versus no MDA in areas of moderate and high endemicity (Stratified by study design; subgrouped by 8‐aminoquinoline), Outcome 2 Parasitaemia Prevalence 1‐3 months post MDA.

Comparison 7 MDA versus no MDA in areas of moderate and high endemicity (Stratified by study design; subgrouped by 8‐aminoquinoline), Outcome 3 Parasitaemia Prevalence during MDA.
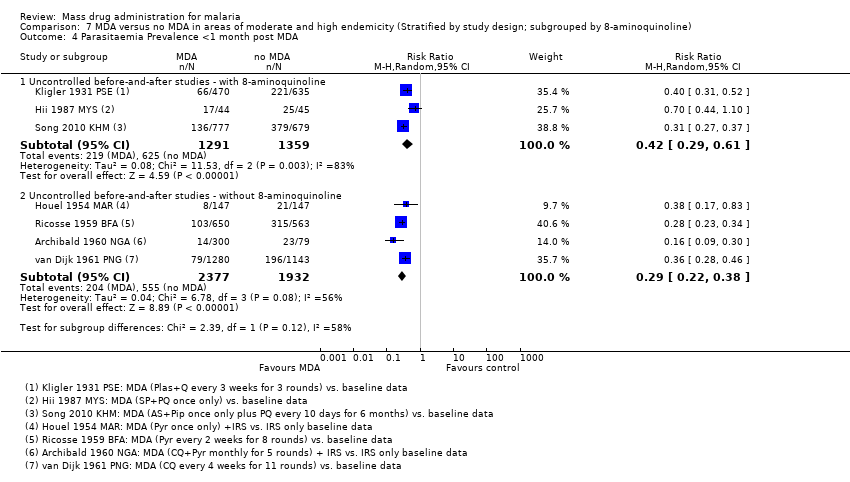
Comparison 7 MDA versus no MDA in areas of moderate and high endemicity (Stratified by study design; subgrouped by 8‐aminoquinoline), Outcome 4 Parasitaemia Prevalence <1 month post MDA.
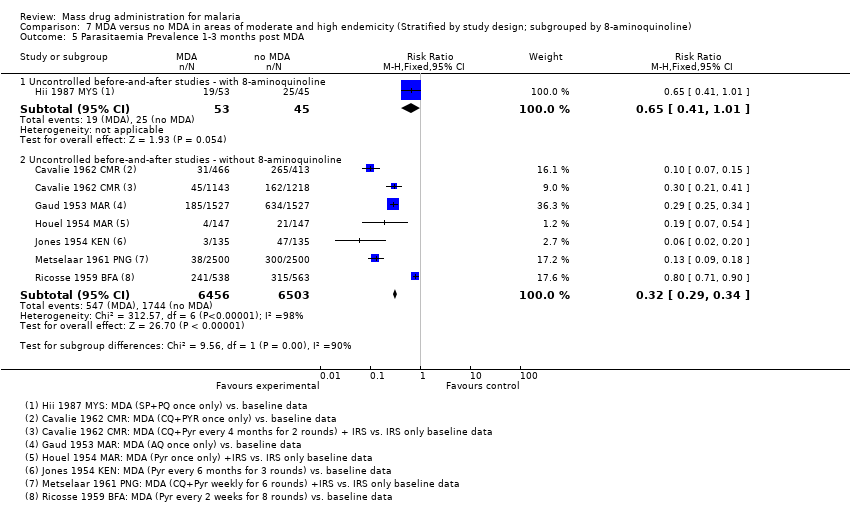
Comparison 7 MDA versus no MDA in areas of moderate and high endemicity (Stratified by study design; subgrouped by 8‐aminoquinoline), Outcome 5 Parasitaemia Prevalence 1‐3 months post MDA.
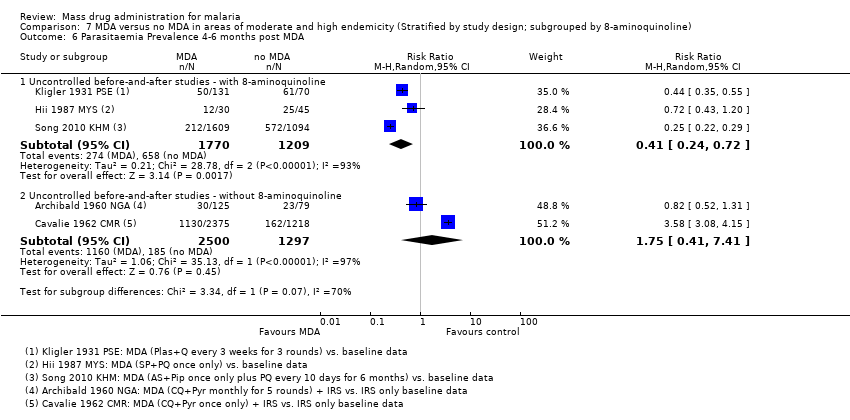
Comparison 7 MDA versus no MDA in areas of moderate and high endemicity (Stratified by study design; subgrouped by 8‐aminoquinoline), Outcome 6 Parasitaemia Prevalence 4‐6 months post MDA.
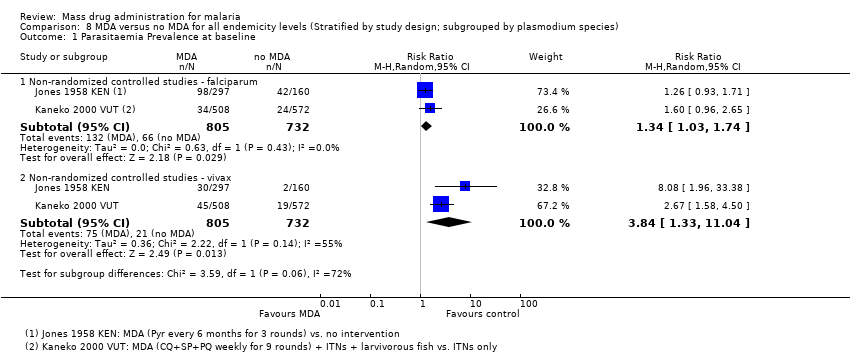
Comparison 8 MDA versus no MDA for all endemicity levels (Stratified by study design; subgrouped by plasmodium species), Outcome 1 Parasitaemia Prevalence at baseline.

Comparison 8 MDA versus no MDA for all endemicity levels (Stratified by study design; subgrouped by plasmodium species), Outcome 2 Parasitaemia Prevalence during MDA.

Comparison 8 MDA versus no MDA for all endemicity levels (Stratified by study design; subgrouped by plasmodium species), Outcome 3 Parasitaemia Prevalence <1 month post MDA.

Comparison 8 MDA versus no MDA for all endemicity levels (Stratified by study design; subgrouped by plasmodium species), Outcome 4 Parasitaemia Prevalence 1‐3 months post MDA.

Comparison 8 MDA versus no MDA for all endemicity levels (Stratified by study design; subgrouped by plasmodium species), Outcome 5 Parasitaemia Prevalence 4‐6 months post MDA.

Comparison 8 MDA versus no MDA for all endemicity levels (Stratified by study design; subgrouped by plasmodium species), Outcome 6 Parasitaemia Prevalence >12 months post MDA.
| Study ID | Design | Country | Year | Endemicity | MDA group | Control group/ Baseline | |||||
| Drug (dose) | Interval | No. of rounds | Population | Coverage | Co‐intervention | ||||||
| Shekalaghe 2011 | CRT | Tanzania | 2008 | 0%* | AS (4 mg/kg/day for 3 days) +SP (25 mg/1.25 mg on day 1) +PQ (0.75 mg on day 3) | ‐ | 1 | 1110 | 93% | Background ITN use | Placebo + Background ITN use |
| Malaria_Taiwan 1991 | BAS | Taiwan | 1955 | 3‐4%* | CQ (12 mg/kg) | ‐ | 1 | 1520 | ND | IRS | IRS |
| CRT = Cluster‐randomized trial; BAS = Uncontrolled before‐and‐after study; AS = Artesunate; SP = Sulfadoxine‐Pyrimethamine; PQ = Primaquine; CQ = Chloroquine; ND = Not described; IRS = Indoor Residual Spraying. *In all ages | |||||||||||
| Study ID | Design | Country | Year | Endemicity | MDA group | Control group/baseline | |||||
| Drug (dose) | Interval | No. of rounds | Population | Coverage | Co‐intervention | ||||||
| Najera 1973 | N‐RCS | Nigeria | 1966‐68 | 29%* | CQ (450 mg) + Pyr (45 mg) | 2 months | 11 | 52,000 | 78‐92% | IRS | IRS alone |
| Singh 1953 | N‐RCS | India | 1952‐53 | 22%* | AQ (600 mg) | 2 weeks | 5 | 125 | ND | None | No intervention |
| Jones 1958 | N‐RCS | Kenya | 1952‐53 | 34%† | Pyr (100 mg) | 6 months | 3 | 3721‐4500 | ND | None | No intervention |
| Roberts 1964 | N‐RCS | Kenya | 1953 | 28%* | Pyr (50 mg) | ‐ | 1 | 101,000 | 95% | None | No intervention |
| N‐RCS | Kenya | 1954 | 22%* | Pyr (50 mg) | ‐ | 1 | 99,000 | 95% | None | No intervention | |
| Archibald 1960 | BAS | Nigeria | 1958 | 29%† | CQ (600 mg) + Pyr (25 mg) | 1 month | 5 | 10,000 | ND | IRS | IRS |
| Cavalie 1962 | BAS | Cameroon | 1960‐61 | 20%† | CQ (600 mg) + Pyr (50 mg) | 4 months | 2 | 22,500 | 76‐92% | IRS | IRS |
| Houel 1954 | BAS | Morocco | 1953 | 14%† | Pyr (100 mg) | ‐ | 1 | 9999 | ND | IRS | IRS |
| Metselaar 1961 | BAS | New Guinea | 1958‐59 | 13‐21%† | CQ (450 mg) +Pyr (50 mg) | 1 week | 6 | 2500 | 90% | IRS | IRS |
| Jones 1954 | BAS | Kenya | 1952‐53 | 35%† | Pyr (100 mg) | 6 months | 3 | 3721 | ND | None | ‐ |
| van Dijk 1961 | BAS | Papua New Guinea | 1960 | 39%† | CQ (450 mg) | 4 weeks | 11 | 1250 | 97% | None | ‐ |
| Comer 1971 | BAS | Panama | 1965‐68 | 17%* | Pyr (50 mg / 75 mg) + PQ (40 mg) | 2 weeks | 49 | 1709 | 61‐87% | None | ‐ |
| N‐RCS = Non‐randomized controlled study; BAS = Uncontrolled before‐and‐after study; AQ = Amodiaquine; Pyr = Pyrimethamine; CQ = Chloroquine; PQ = Primaquine; ND = Not described; IRS = Indoor Residual Spraying. *In all ages †Amongst children only | |||||||||||
| Study ID | Design | Country | Year | Endemicity | MDA group | Control group | |||||
| Drug (dose) | Interval | No. of rounds | Population | Coverage | Co‐intervention | ||||||
| Von Seidlein 2003 | CRT | Gambia | 1999 | 43%† | AS (4 mg/kg/day for 3 days) +SP (25 mg/1.25 mg on day 1) | ‐ | 1 | 1969 | 89% | None | Placebo |
| Molineaux 1980 | N‐RCS | Nigeria | 1970‐75 | 46%* | SP (500 mg/25 mg) | 10 weeks | 9‡ | 14,129 | 85% | IRS | IRS alone |
| SP (500 mg/25 mg) | 2‐10 weeks | 23‡ | 1810 | 85% | IRS | IRS alone | |||||
| Escudie 1962 | N‐RCS | Burkina Faso | 1960‐61 | 56.1%† | CQ (600 mg)/AQ (600 mg) +PQ (15 mg) | 1 month | 8 | 1890 | 75‐92% | None | No intervention |
| CQ (600 mg)/AQ (600 mg) +PQ (15 mg) | 2 weeks | 15 | 2560 | 84‐97% | None | No intervention | |||||
| CQ (600 mg)/AQ (600 mg) +PQ (15 mg) | 1 month | 8 | 5400 | 81‐92% | IRS | IRS alone‐ | |||||
| CQ (600 mg)/AQ (600 mg) +PQ (15 mg) | 2 weeks | 15 | 3490 | 82‐94% | IRS | IRS alone‐ | |||||
| Schneider 1961 | N‐RCS | Burkina Faso | 1960‐61 | 59%† | CQ (600 mg)/AQ (600 mg) +PQ (15 mg) | 2 weeks | 15 | 2500 | 90% | None | No intervention |
| Archibald 1960 | BAS | Nigeria | 1957‐59 | 64%† | CQ (600 mg) +Pyr (25 mg) | 6 months | 4 | 1300 | ND | IRS | IRS‐ |
| Cavalie 1962 | BAS | Cameroon | 1960‐61 | 65%* | CQ (600 mg) +Pyr (50 mg) | ‐ | 1 | 7000 | 100% | IRS | IRS |
| Gaud 1953 | BAS | Morocco | 1952 | 42%* | AQ (600 mg) | ‐ | 1 | 3000 | ND | None | ‐ |
| Ricosse 1959 | BAS | Burkina Faso | 1958‐59 | 56%† | Pyr (50 mg) | 2 weeks | 8 | 3000 | 82‐91% | None | ‐ |
| Song 2010 | BAS | Cambodia | 2003‐06 | 56%† | AS (125 mg/day for 2 days) + PIP (750 mg/day for 2 days) + PQ (9 mg every 10 days) | ‐ | 1 | 3653 | ND | None | ‐ |
| Hii 1987 | BAS | Malaysia | 1984‐85 | 56%† | SP (1500 mg / 75 mg) + PQ (30 mg) | ‐ | 1 | 148 | 76% | None | ‐ |
| Kligler 1931 | BAS | Palestine | 1930 | 67%† | Plas (30 mg) + Q (900 mg) twice daily for 5 days | 3 weeks | 3 | 953 | 79% | None | ‐ |
| CRT= Cluster‐randomized trial; N‐RCS = Non‐randomized controlled study; BAS = Uncontrolled before‐and‐after study; AS = Artesunate; SP = Sulfadoxine (or sulfalene)‐Pyrimethamine; Pyr = Pyrimethamine; CQ = Chloroquine; AQ = Amodiaquine; PQ = Primaquine; Pip = Piperaquine; Plas = Plasmochin; Q = Quinine; ND = Not described; IRS = Indoor Residual Spraying. *In all ages †Amongst children only ‡Estimated from the data provided | |||||||||||
| Study ID | Design | Country | Year | Endemicity | MDA group | Control group/ baseline | |||||
| Drug (dose) | Interval | No. of rounds | Population | Coverage | Co‐intervention | ||||||
| Moderate Endemicity | |||||||||||
| Kaneko 2000 | N‐RCS | Vanuatu | 1991‐99 | 29%* | CQ (600 mg) + SP (1500 mg/75 mg) + PQ (45 mg) weeks 1, 5, and 9; CQ (300 mg) + PQ (45 mg) weeks 2, 3, 4, 6, 7, and 8 | 1 week | 9 | 718 | 79‐92% | ITN + larvivorous fish | low baseline coverage of ITNs |
| Ricosse 1959 | BAS | Burkina Faso | 1958‐59 | 15%† | Pyr (50 mg) | 2 weeks | 8 | 5000 | 82‐91% | IRS | None |
| De Zulueta 1961 | BAS | Uganda | 1959‐60 | 34%† | CQ (600 mg) + Pyr (50 mg) | 3 months | 4 | 30,384 | 80% | IRS | None |
| De Zulueta 1964 | BAS | Uganda | 1960 | 23%† | CQ (600 mg) + Pyr (50 mg) | 5 months | 2 | 16,000 | 50% | IRS | None |
| Paik 1974a | BAS | Solomon Islands | 1972 | 28%* | CQ (600 mg) +Pyr (50 mg) | 1 month | 4 | ND | 90% | IRS | None |
| High Endemicity | |||||||||||
| Molineaux 1980 | N‐RCS | Nigeria | 1970‐75 | 46%* | SP (500 mg/25 mg) | 10 weeks | 9‡ | 14,129 | 85% | IRS | None |
| SP (500 mg/25 mg) | 2‐10 weeks | 23‡ | 1810 | 85% | IRS | None | |||||
| Escudie 1962 | N‐RCS | Burkina Faso | 1960‐61 | 56.1%† | CQ (600 mg) /AQ (600 mg) + PQ (15 mg) | 1 month | 8 | 5400 | 81‐92% | IRS | None |
| CQ (600 mg)/AQ (600 mg) + PQ (15 mg) | 2 weeks | 15 | 3490 | 82‐94% | IRS | None | |||||
| Schneider 1961 | N‐RCS | Burkina Faso | 1960‐61 | 59%† | AQ (600 mg) + PQ (15 mg) | 2 weeks | 8 | 3525 | ND | IRS | None |
| Metselaar 1961 | BAS | New Guinea | 1958‐59 | 46%* | CQ (450 mg) +Pyr (50 mg) | 1 week | 6 | 2500 | 90% | IRS | None |
| Hii 1987 | BAS | Malaysia | 1984‐85 | 46%† | SP (1500 mg / 75 mg) + PQ (30 mg) | ‐ | 1 | 754 | 87% | ITN | None |
| N‐RCS = Non‐randomized controlled study; BAS = Uncontrolled before‐and‐after study; AQ = Amodiaquine; Pyr = Pyrimethamine; CQ = Chloroquine; SP = Sulfadoxine (or sulfalene)‐Pyrimethamine; PQ = Primaquine; ND = Not described; IRS = Indoor Residual Spraying; ITN = Insecticide Treated Net. *In all ages †Amongst children only ‡Estimated from the data provided | |||||||||||
| Study ID | Design | Country | Year | Baseline Incidence | MDA group | Baseline | |||||
| Drug (dose) | Interval | No. of rounds | Population | Coverage | Co‐intervention | ||||||
| Garfield 1983 | BAS | Nicaragua | 1981‐82 | 0.4/1000 | CQ (500 mg/day for 3 days) + PQ (15 mg/day for 3 days) | ‐ | 1 | 2,300,000 | 70‐80% | Larval control | None |
| Simeons 1938 | BAS | India | 1935 | 156/1000 | Ate (300 mg) + Plas (60 mg) | ‐ | 1 | 5650 | 100% | Larval control | None |
| Gabaldon 1959 | BAS | Venezuela | 1956‐57 | 0.4/1000 | Pyr (50 mg) | 1 week | 24 | 111,995 | ND | IRS | IRS |
| Kondrashin 1985 | BAS | India | 1981 | 4/1000 | CQ (600 mg) + PQ (45 mg) | 6 months | 2 | 51,325 | 85% | IRS | IRS |
| Paik 1974b | BAS | Solomon Islands | 1972‐73 | 15/1000 | CQ (300 mg/day for 5 days) + PQ (15 mg/day for 5 days) | 3 months | 3 | 1200 | 90% | None | ‐ |
| Cáceres Garcia 2008 | BAS | Venezuela | 2002‐07 | 22/1000 | CQ (25 mg/kg over 3 days) +PQ (3.5 mg/kg over 7 days) | ‐ | 1 | 22,941 | 77% | None | ‐ |
| BAS = Uncontrolled before‐and‐after study; PQ = Primaquine; CQ = Chloroquine; Pyr = Pyrimethamine; Plas = Plasmochin; Ate = Atebrin; ND = Not described; IRS = Indoor Residual Spraying. †Amongst children only | |||||||||||
| Mass drug administration in areas of low endemicity | |||||||
| Patient or population: People living in malaria endemic areas | |||||||
| Timepoint | Outcomes | Study design | Illustrative comparative risks* (95% CI) | Relative effect | No of | Quality of the evidence | |
| Assumed risk | Corresponding risk | ||||||
| Control | MDA | ||||||
| <1 month | Parasite | Before‐and‐after | 50 per 10001 | 14 per 1000 | RR 0.27 | 1 study | ⊕⊝⊝⊝ |
| Parasite | ‐ | ‐ | ‐ | ‐ | 0 studies | ‐ | |
| Gametocyte | ‐ | ‐ | ‐ | ‐ | 0 studies2 | ‐ | |
| 12 months | Parasite | Before‐and‐after | 50 per 10001 | 1 per 1000 | RR 0.02 | 1 study | ⊕⊝⊝⊝ |
| Parasite | ‐ | ‐ | ‐ | ‐ | 0 studies | ‐ | |
| Gametocyte | ‐ | ‐ | ‐ | ‐ | 0 studies2 | ‐ | |
| The assumed risk has been set at 5%. The corresponding risk (and its 95% CI) is based on the assumed risk in the comparison group and the relative effect of the intervention (and its 95% CI). | |||||||
| GRADE Working Group grades of evidence | |||||||
| 1 For illustrative purposes the control group prevalence has been set at 5%. | |||||||
| Mass drug administration in areas of moderate endemicity | |||||||
| Patient or population: People living in malaria endemic areas | |||||||
| Timepoint post MDA | Outcomes | Study design | Illustrative comparative risks* (95% CI) | Relative effect | No of studies | Quality of the evidence | |
| Assumed risk | Corresponding risk | ||||||
| Control | MDA | ||||||
| <1 month | Parasitaemia | Non‐randomized | 250 per 1000 | 5 per 1000 | RR 0.03 | 3 studies | ⊕⊕⊕⊝ |
| Before‐and‐after | 250 per 1000 | 73 per 1000 | RR 0.29 | 3 studies | ⊕⊕⊝⊝ | ||
| Parasitaemia | ‐ | ‐ | ‐ | 0 studies | ‐ | ||
| Gametocytaemia | Non‐randomized | 100 per 1000 | 28 per 1000 | RR 0.28 | 1 study | ⊕⊝⊝⊝ | |
| Before‐and‐after | 100 per 1000 | 47 per 1000 | RR 0.47 | 3 studies | ⊕⊕⊝⊝ | ||
| 4‐6 months | Parasitaemia | Non‐randomized | 250 per 1000 | 70 per 1000 | RR 0.18 | 2 studies | ⊕⊕⊝⊝ |
| Before‐and‐after | 250 per 1000 | 438 per 1000 | RR 1.75 | 2 studies | ⊕⊝⊝⊝ | ||
| Parasitaemia | ‐ | ‐ | ‐ | ‐ | 0 studies | ‐ | |
| Gametocytaemia | Non‐randomized | 100 per 1000 | 52 per 1000 | RR 0.52 | 1 study | ⊕⊝⊝⊝ | |
| Before‐and‐after | 100 per 1000 | 35 per 1000 | RR 0.35 | 1 study | ⊕⊝⊝⊝ | ||
| The assumed risk for parasitaemia prevalence has been set at 25%. Gametocytaemia prevalence was generally lower in the included studies and the assumed risk has therefore been set at 10%. The corresponding risk (and its 95% CI) is based on the assumed risk in the comparison group and the relative effect of the intervention (and its 95% CI). | |||||||
| GRADE Working Group grades of evidence | |||||||
| 1 No serious risk of bias: Although there were some differences in prevalence at baseline, these were much smaller in size than the large effects seen post‐intervention. | |||||||
| Mass drug administration in areas of high endemicity | |||||||
| Patient or population: People living in malaria endemic areas | |||||||
| Timepoint post MDA | Outcomes | Study design | Illustrative comparative risks* (95% CI) | Relative effect | No of studies | Quality of the evidence | |
| Assumed risk | Corresponding risk | ||||||
| Control | MDA | ||||||
| < 1 month | Parasitaemia | Cluster‐randomized | 500 per 1000 | 410 per 1000 | RR 0.82 | 1 study | ⊕⊕⊝⊝ |
| Non‐randomized | 500 per 1000 | 85 per 1000 | RR 0.17 | 3 studies | ⊕⊕⊕⊝ | ||
| Before‐and‐after | 500 per 1000 | 185 per 1000 | RR 0.37 | 4 studies | ⊕⊕⊝⊝ | ||
| Parasitaemia | Cluster‐randomized | 60 per 1000 | 25 per 1000 | RR 0.41 | 1 study | ⊕⊕⊕⊝ | |
| Gametocytaemia | Non‐randomized | 100 per 1000 | 16 per 1000 | RR 0.16 | 3 studies | ⊕⊕⊕⊝ | |
| Before‐and‐after | 100 per 1000 | 38 per 1000 | RR 0.38 | 3 studies | ⊕⊕⊝⊝ | ||
| 4‐6 months | Parasitaemia | Cluster‐randomized | 500 per 1000 | 580 per 1000 | RR 1.16 | 1 study | ⊕⊕⊕⊝ |
| Non‐randomized | ‐ | ‐ | ‐ | 0 studies | ‐ | ||
| Before‐and‐after | 500 per 1000 | 205 per 1000 | RR 0.41 | 3 studies | ⊕⊕⊝⊝ | ||
| Parasitaemia | Cluster‐randomized | 60 per 1000 | 67 per 1000 | RR 1.11 | 1 study | ⊕⊕⊕⊝ | |
| Gametocytaemia | Cluster‐randomized | 100 per 1000 | 107 per 1000 | RR 1.07 | 1 study | ⊕⊕⊝⊝ | |
| Non‐randomized | ‐ | ‐ | ‐ | 0 studies | ‐ | ||
| Before‐and‐after | 100 per 1000 | 35 per 1000 | RR 0.35 | 2 studies | ⊕⊝⊝⊝ | ||
| The assumed risk for parasitaemia prevalence has been set at 50%. Gametocytaemia prevalence was generally lower in the included studies and the assumed risk has therefore been set at 10%. The assumed risk for parasitaemia incidence is taken from the control group of the single trial. The corresponding risk (and its 95% CI) is based on the assumed risk in the comparison group and the relative effect of the intervention (and its 95% CI). | |||||||
| GRADE Working Group grades of evidence | |||||||
| 1 No serious risk of bias: This cluster‐randomized trial was at low risk of bias. | |||||||
| Outcome or subgroup title | No. of studies | No. of participants | Statistical method | Effect size |
| 1 Parasitaemia Prevalence: Cluster‐randomized trials Show forest plot | 1 | Risk Ratio (M‐H, Random, 95% CI) | Subtotals only | |
| 1.1 At baseline | 1 | 496 | Risk Ratio (M‐H, Random, 95% CI) | 0.0 [0.0, 0.0] |
| 1.2 <1 month post MDA | 1 | 484 | Risk Ratio (M‐H, Random, 95% CI) | 0.0 [0.0, 0.0] |
| 1.3 1‐3 months post MDA | 1 | 794 | Risk Ratio (M‐H, Random, 95% CI) | 0.0 [0.0, 0.0] |
| 1.4 4‐6 months post MDA | 1 | 660 | Risk Ratio (M‐H, Random, 95% CI) | 0.0 [0.0, 0.0] |
| 2 Parasitaemia Prevalence: Uncontrolled before‐and‐after studies Show forest plot | 1 | Risk Ratio (M‐H, Random, 95% CI) | Subtotals only | |
| 2.1 <1 month post MDA | 1 | 3039 | Risk Ratio (M‐H, Random, 95% CI) | 0.27 [0.14, 0.50] |
| 2.2 >12 months post MDA | 1 | 3509 | Risk Ratio (M‐H, Random, 95% CI) | 0.02 [0.00, 0.12] |
| 3 Gametocytaemia Prevalence: Cluster randomized trials Show forest plot | 1 | Risk Ratio (M‐H, Random, 95% CI) | Subtotals only | |
| 3.1 At baseline | 1 | 496 | Risk Ratio (M‐H, Random, 95% CI) | 0.0 [0.0, 0.0] |
| 3.2 < 1 month post MDA | 1 | 484 | Risk Ratio (M‐H, Random, 95% CI) | 0.0 [0.0, 0.0] |
| 3.3 1‐3 months post MDA | 1 | 794 | Risk Ratio (M‐H, Random, 95% CI) | 0.0 [0.0, 0.0] |
| 3.4 4‐6 months post MDA | 1 | 660 | Risk Ratio (M‐H, Random, 95% CI) | 0.0 [0.0, 0.0] |
| Outcome or subgroup title | No. of studies | No. of participants | Statistical method | Effect size |
| 1 Parasitaemia Prevalence: Non‐randomized controlled studies Show forest plot | 4 | Risk Ratio (M‐H, Random, 95% CI) | Subtotals only | |
| 1.1 At baseline | 4 | 3123 | Risk Ratio (M‐H, Random, 95% CI) | 0.73 [0.43, 1.24] |
| 1.2 During MDA | 1 | 47014 | Risk Ratio (M‐H, Random, 95% CI) | 0.27 [0.25, 0.28] |
| 1.3 < 1 month post MDA | 3 | 1934 | Risk Ratio (M‐H, Random, 95% CI) | 0.03 [0.01, 0.08] |
| 1.4 1‐3 months post MDA | 2 | 1557 | Risk Ratio (M‐H, Random, 95% CI) | 0.15 [0.10, 0.23] |
| 1.5 4‐6 months post MDA | 2 | 1610 | Risk Ratio (M‐H, Random, 95% CI) | 0.18 [0.10, 0.33] |
| 1.6 7‐12 months post MDA | 1 | 600 | Risk Ratio (M‐H, Random, 95% CI) | 0.19 [0.11, 0.33] |
| 2 Parasitaemia Prevalence: Uncontrolled before‐and‐after studies Show forest plot | 7 | Risk Ratio (M‐H, Random, 95% CI) | Subtotals only | |
| 2.1 During MDA | 2 | 7965 | Risk Ratio (M‐H, Random, 95% CI) | 0.17 [0.02, 1.47] |
| 2.2 <1 month post MDA | 3 | 3096 | Risk Ratio (M‐H, Random, 95% CI) | 0.29 [0.17, 0.48] |
| 2.3 1‐3 months post MDA | 4 | 7925 | Risk Ratio (M‐H, Random, 95% CI) | 0.16 [0.08, 0.31] |
| 2.4 4‐6 months post MDA | 2 | 3797 | Risk Ratio (M‐H, Random, 95% CI) | 1.75 [0.41, 7.41] |
| 3 Gametocytaemia Prevalence: Non‐randomized controlled studies Show forest plot | 2 | Risk Ratio (M‐H, Random, 95% CI) | Subtotals only | |
| 3.1 At baseline | 2 | 1622 | Risk Ratio (M‐H, Random, 95% CI) | 1.40 [0.76, 2.57] |
| 3.2 During MDA | 1 | 47014 | Risk Ratio (M‐H, Random, 95% CI) | 0.48 [0.42, 0.54] |
| 3.3 <1 month post MDA | 1 | 433 | Risk Ratio (M‐H, Random, 95% CI) | 0.28 [0.10, 0.82] |
| 3.4 1‐3 months post MDA | 1 | 357 | Risk Ratio (M‐H, Random, 95% CI) | 0.17 [0.03, 0.86] |
| 3.5 4‐6 months post MDA | 1 | 410 | Risk Ratio (M‐H, Random, 95% CI) | 0.52 [0.24, 1.11] |
| 4 Gametocytaemia Prevalence: Uncontrolled before‐and‐after studies Show forest plot | 3 | Risk Ratio (M‐H, Random, 95% CI) | Subtotals only | |
| 4.1 <1 month post MDA | 3 | 3096 | Risk Ratio (M‐H, Random, 95% CI) | 0.47 [0.25, 0.87] |
| 4.2 1‐3 months post MDA | 1 | 294 | Risk Ratio (M‐H, Random, 95% CI) | 0.36 [0.12, 1.12] |
| 4.3 4‐6 months post MDA | 1 | 204 | Risk Ratio (M‐H, Random, 95% CI) | 0.35 [0.12, 1.01] |
| Outcome or subgroup title | No. of studies | No. of participants | Statistical method | Effect size |
| 1 Parasitaemia Prevalence: Cluster‐randomized trials Show forest plot | 1 | Risk Ratio (M‐H, Random, 95% CI) | Subtotals only | |
| 1.1 At baseline | 1 | 1376 | Risk Ratio (M‐H, Random, 95% CI) | 0.97 [0.86, 1.10] |
| 1.2 1‐3 months post MDA | 1 | 1800 | Risk Ratio (M‐H, Random, 95% CI) | 0.82 [0.67, 1.01] |
| 1.3 4‐6 months post MDA | 1 | 1089 | Risk Ratio (M‐H, Random, 95% CI) | 1.16 [0.93, 1.44] |
| 2 Parasitaemia Prevalence: Non‐randomized controlled studies Show forest plot | 3 | Risk Ratio (M‐H, Random, 95% CI) | Subtotals only | |
| 2.1 At baseline | 3 | 9395 | Risk Ratio (M‐H, Random, 95% CI) | 0.84 [0.70, 1.00] |
| 2.2 During MDA | 3 | 12561 | Risk Ratio (M‐H, Random, 95% CI) | 0.17 [0.11, 0.27] |
| 2.3 1‐3 months post MDA | 2 | 7197 | Risk Ratio (M‐H, Random, 95% CI) | 0.52 [0.33, 0.81] |
| 3 Parasitaemia Prevalence: Uncontrolled before‐and‐after studies Show forest plot | 7 | Risk Ratio (M‐H, Random, 95% CI) | Subtotals only | |
| 3.1 During MDA | 2 | 2011 | Risk Ratio (M‐H, Random, 95% CI) | 0.10 [0.03, 0.34] |
| 3.2 <1 month post MDA | 4 | 3863 | Risk Ratio (M‐H, Random, 95% CI) | 0.37 [0.28, 0.49] |
| 3.3 1‐3 months post MDA | 4 | 5132 | Risk Ratio (M‐H, Random, 95% CI) | 0.35 [0.15, 0.84] |
| 3.4 4‐6 months post MDA | 3 | 2979 | Risk Ratio (M‐H, Random, 95% CI) | 0.41 [0.24, 0.72] |
| 3.5 7‐12 months post MDA | 1 | 75 | Risk Ratio (M‐H, Random, 95% CI) | 0.72 [0.43, 1.20] |
| 3.6 >12 months post MDA | 1 | 2375 | Risk Ratio (M‐H, Random, 95% CI) | 0.10 [0.07, 0.12] |
| 4 Parasitaemia Incidence: Cluster‐randomized trials Show forest plot | 1 | Rate Ratio (Random, 95% CI) | 0.84 [0.53, 1.32] | |
| 4.1 < 1 month post MDA | 1 | Rate Ratio (Random, 95% CI) | 0.41 [0.23, 0.74] | |
| 4.2 1‐3 months post MDA | 1 | Rate Ratio (Random, 95% CI) | 1.03 [0.75, 1.41] | |
| 4.3 4‐6 months post MDA | 1 | Rate Ratio (Random, 95% CI) | 1.11 [0.84, 1.45] | |
| 5 Gametocytaemia Prevalence: Cluster‐randomized trials Show forest plot | 1 | Risk Ratio (M‐H, Random, 95% CI) | Subtotals only | |
| 5.1 At baseline | 1 | 1376 | Risk Ratio (M‐H, Random, 95% CI) | 0.66 [0.33, 1.29] |
| 5.2 4‐6 months post MDA | 1 | 1414 | Risk Ratio (M‐H, Random, 95% CI) | 1.07 [0.62, 1.85] |
| 6 Gametocytaemia Prevalence: Non‐randomized controlled studies Show forest plot | 3 | Risk Ratio (M‐H, Random, 95% CI) | Subtotals only | |
| 6.1 At baseline | 3 | 9395 | Risk Ratio (M‐H, Random, 95% CI) | 0.72 [0.55, 0.95] |
| 6.2 During MDA | 3 | 12561 | Risk Ratio (M‐H, Random, 95% CI) | 0.17 [0.10, 0.28] |
| 6.3 1‐3 months post MDA | 2 | 7197 | Risk Ratio (M‐H, Random, 95% CI) | 0.55 [0.28, 1.07] |
| 7 Gametocytaemia Prevalence: Uncontrolled before‐and‐after studies Show forest plot | 5 | Risk Ratio (M‐H, Random, 95% CI) | Subtotals only | |
| 7.1 During MDA | 2 | 2011 | Risk Ratio (M‐H, Random, 95% CI) | 0.35 [0.09, 1.40] |
| 7.2 <1 month post MDA | 3 | 2582 | Risk Ratio (M‐H, Random, 95% CI) | 0.38 [0.13, 1.08] |
| 7.3 1‐3 months post MDA | 2 | 1199 | Risk Ratio (M‐H, Random, 95% CI) | 1.14 [0.64, 2.01] |
| 7.4 4‐6 months post MDA | 2 | 2789 | Risk Ratio (M‐H, Random, 95% CI) | 0.35 [0.10, 1.28] |
| 7.5 7‐12 months post MDA | 1 | 75 | Risk Ratio (M‐H, Random, 95% CI) | 0.86 [0.41, 1.79] |
| 7.6 >12 months post MDA | 1 | 2269 | Risk Ratio (M‐H, Random, 95% CI) | 0.09 [0.05, 0.15] |
| 8 Anaemia Prevalence: Cluster‐randomized trials Show forest plot | 1 | Risk Ratio (M‐H, Random, 95% CI) | Subtotals only | |
| 8.1 4‐6 months post MDA | 1 | 1414 | Risk Ratio (M‐H, Random, 95% CI) | 0.84 [0.75, 0.93] |
| 9 Mortality: Cluster‐randomized trials Show forest plot | 1 | Risk Ratio (M‐H, Random, 95% CI) | Subtotals only | |
| 9.1 4‐6 months post MDA | 1 | 3655 | Risk Ratio (M‐H, Random, 95% CI) | 1.43 [0.34, 5.96] |
| Outcome or subgroup title | No. of studies | No. of participants | Statistical method | Effect size |
| 1 Parasitaemia Prevalence: Non‐randomized controlled studies Show forest plot | 1 | Risk Ratio (M‐H, Random, 95% CI) | Subtotals only | |
| 1.1 At baseline | 1 | 1080 | Risk Ratio (M‐H, Random, 95% CI) | 2.09 [1.48, 2.98] |
| 1.2 >12 months post MDA | 1 | 1331 | Risk Ratio (M‐H, Random, 95% CI) | 0.10 [0.05, 0.20] |
| 2 Parasitaemia Prevalence: Uncontrolled before‐and‐after studies Show forest plot | 4 | Risk Ratio (M‐H, Random, 95% CI) | Subtotals only | |
| 2.1 During MDA | 2 | 2336 | Risk Ratio (M‐H, Random, 95% CI) | 0.12 [0.02, 0.62] |
| 2.2 <1 month post MDA | 3 | 5006 | Risk Ratio (M‐H, Random, 95% CI) | 0.06 [0.01, 0.33] |
| 2.3 1‐3 months post MDA | 3 | 4724 | Risk Ratio (M‐H, Random, 95% CI) | 0.14 [0.04, 0.57] |
| 2.4 4‐6 months post MDA | 1 | 939 | Risk Ratio (M‐H, Random, 95% CI) | 0.57 [0.39, 0.85] |
| 2.5 >12 months post MDA | 1 | 1758 | Risk Ratio (M‐H, Random, 95% CI) | 0.00 [0.00, 0.03] |
| 3 Gametocytaemia Prevalence: Uncontrolled before‐and‐after studies Show forest plot | 2 | Risk Ratio (M‐H, Random, 95% CI) | Subtotals only | |
| 3.1 During MDA | 2 | 4425 | Risk Ratio (M‐H, Random, 95% CI) | 0.13 [0.06, 0.27] |
| 3.2 < 1 month post MDA | 1 | 1907 | Risk Ratio (M‐H, Random, 95% CI) | 0.01 [0.00, 0.16] |
| 3.3 1‐3 months post MDA | 1 | 1941 | Risk Ratio (M‐H, Random, 95% CI) | 0.22 [0.11, 0.41] |
| Outcome or subgroup title | No. of studies | No. of participants | Statistical method | Effect size |
| 1 Parasitaemia Prevalence: Non‐randomized controlled studies Show forest plot | 3 | Risk Ratio (M‐H, Random, 95% CI) | Subtotals only | |
| 1.1 At baseline | 3 | 8042 | Risk Ratio (M‐H, Random, 95% CI) | 0.56 [0.37, 0.84] |
| 1.2 During MDA | 3 | 9493 | Risk Ratio (M‐H, Random, 95% CI) | 0.10 [0.06, 0.16] |
| 1.3 1‐3 months post MDA | 2 | 4455 | Risk Ratio (M‐H, Random, 95% CI) | 0.12 [0.06, 0.23] |
| 1.4 7‐12 months post MDA | 1 | 3154 | Risk Ratio (M‐H, Random, 95% CI) | 0.60 [0.55, 0.67] |
| 1.5 >12 months post MDA | 1 | 3261 | Risk Ratio (M‐H, Random, 95% CI) | 0.77 [0.70, 0.84] |
| 2 Parasitaemia Prevalence: Uncontrolled before‐and‐after studies Show forest plot | 2 | Risk Ratio (M‐H, Random, 95% CI) | Subtotals only | |
| 2.1 During MDA | 2 | 5437 | Risk Ratio (M‐H, Random, 95% CI) | 0.17 [0.09, 0.31] |
| 2.2 1‐3 months post MDA | 2 | 5440 | Risk Ratio (M‐H, Random, 95% CI) | 0.13 [0.01, 2.51] |
| 2.3 4‐6 months post MDA | 1 | 415 | Risk Ratio (M‐H, Random, 95% CI) | 0.83 [0.66, 1.04] |
| 2.4 7‐12 months post MDA | 1 | 412 | Risk Ratio (M‐H, Random, 95% CI) | 0.93 [0.75, 1.16] |
| 3 Gametocytaemia Prevalence: Non‐randomized controlled studies Show forest plot | 3 | Risk Ratio (M‐H, Random, 95% CI) | Subtotals only | |
| 3.1 At baseline | 3 | 8042 | Risk Ratio (M‐H, Random, 95% CI) | 0.53 [0.31, 0.90] |
| 3.2 During MDA | 3 | 9493 | Risk Ratio (M‐H, Random, 95% CI) | 0.08 [0.03, 0.20] |
| 3.3 1‐3 months post MDA | 2 | 4455 | Risk Ratio (M‐H, Random, 95% CI) | 0.08 [0.05, 0.14] |
| 3.4 7‐12 months post MDA | 1 | 3154 | Risk Ratio (M‐H, Random, 95% CI) | 0.87 [0.73, 1.05] |
| 3.5 > 12 months post MDA | 1 | 3261 | Risk Ratio (M‐H, Random, 95% CI) | 0.96 [0.81, 1.14] |
| 4 Gametocytaemia Prevalence: Uncontrolled before‐and‐after studies Show forest plot | 1 | Risk Ratio (M‐H, Random, 95% CI) | Subtotals only | |
| 4.1 During MDA | 1 | 437 | Risk Ratio (M‐H, Random, 95% CI) | 0.29 [0.17, 0.50] |
| 4.2 1‐3 months post MDA | 1 | 440 | Risk Ratio (M‐H, Random, 95% CI) | 0.52 [0.34, 0.80] |
| 4.3 4‐6 months post MDA | 1 | 415 | Risk Ratio (M‐H, Random, 95% CI) | 0.76 [0.52, 1.12] |
| 4.4 7‐12 months post MDA | 1 | 412 | Risk Ratio (M‐H, Random, 95% CI) | 0.93 [0.65, 1.33] |
| Outcome or subgroup title | No. of studies | No. of participants | Statistical method | Effect size |
| 1 MDA versus no MDA: Uncontrolled before‐and‐after studies Show forest plot | 4 | Rate Ratio (Random, 95% CI) | Subtotals only | |
| 1.1 During MDA | 3 | Rate Ratio (Random, 95% CI) | 0.29 [0.07, 1.14] | |
| 1.2 < 1 month post MDA | 4 | Rate Ratio (Random, 95% CI) | 0.21 [0.05, 0.84] | |
| 1.3 1‐3 months post MDA | 4 | Rate Ratio (Random, 95% CI) | 0.61 [0.26, 1.40] | |
| 1.4 4‐6 months post MDA | 1 | Rate Ratio (Random, 95% CI) | 0.65 [0.41, 1.02] | |
| 1.5 7‐12 months post MDA | 1 | Rate Ratio (Random, 95% CI) | 0.15 [0.07, 0.34] | |
| 1.6 >12 months post MDA | 1 | Rate Ratio (Random, 95% CI) | 0.48 [0.42, 0.55] | |
| 2 MDA + vector control versus no MDA: Uncontrolled before‐and‐after studies Show forest plot | 2 | Rate Ratio (Random, 95% CI) | Subtotals only | |
| 2.1 During MDA | 2 | Rate Ratio (Random, 95% CI) | 0.92 [0.49, 1.75] | |
| 2.2 < 1 month post MDA | 2 | Rate Ratio (Random, 95% CI) | 0.04 [0.00, 1.54] | |
| 2.3 1‐3 months post MDA | 2 | Rate Ratio (Random, 95% CI) | 0.08 [0.01, 0.98] | |
| 2.4 4‐6 months post MDA | 2 | Rate Ratio (Random, 95% CI) | 0.11 [0.01, 1.97] | |
| 2.5 7‐12 months post MDA | 2 | Rate Ratio (Random, 95% CI) | 0.16 [0.01, 3.10] | |
| 2.6 > 12 months post MDA | 1 | Rate Ratio (Random, 95% CI) | 0.04 [0.03, 0.07] | |
| Outcome or subgroup title | No. of studies | No. of participants | Statistical method | Effect size |
| 1 Parasitaemia Prevalence during MDA Show forest plot | 4 | Risk Ratio (M‐H, Random, 95% CI) | Subtotals only | |
| 1.1 Non‐randomized controlled studies ‐ with 8‐aminoquinoline | 2 | 6634 | Risk Ratio (M‐H, Random, 95% CI) | 0.20 [0.12, 0.32] |
| 1.2 Non‐randomized controlled studies ‐ without 8‐aminoquinoline | 2 | 52941 | Risk Ratio (M‐H, Random, 95% CI) | 0.16 [0.08, 0.31] |
| 2 Parasitaemia Prevalence 1‐3 months post MDA Show forest plot | 4 | Risk Ratio (M‐H, Random, 95% CI) | Subtotals only | |
| 2.1 Non‐randomized controlled studies ‐ with 8‐aminoquinoline | 2 | 7197 | Risk Ratio (M‐H, Random, 95% CI) | 0.52 [0.33, 0.81] |
| 2.2 Non‐randomized controlled studies ‐ without 8‐aminoquinoline | 2 | 1557 | Risk Ratio (M‐H, Random, 95% CI) | 0.15 [0.10, 0.23] |
| 3 Parasitaemia Prevalence during MDA Show forest plot | 4 | Risk Ratio (M‐H, Random, 95% CI) | Subtotals only | |
| 3.1 Uncontrolled before‐and‐after studies ‐ with 8‐aminoquinoline | 1 | 2965 | Risk Ratio (M‐H, Random, 95% CI) | 0.06 [0.03, 0.10] |
| 3.2 Uncontrolled before‐and‐after studies ‐ without 8‐aminoquinoline | 3 | 7011 | Risk Ratio (M‐H, Random, 95% CI) | 0.17 [0.06, 0.51] |
| 4 Parasitaemia Prevalence <1 month post MDA Show forest plot | 7 | Risk Ratio (M‐H, Random, 95% CI) | Subtotals only | |
| 4.1 Uncontrolled before‐and‐after studies ‐ with 8‐aminoquinoline | 3 | 2650 | Risk Ratio (M‐H, Random, 95% CI) | 0.42 [0.29, 0.61] |
| 4.2 Uncontrolled before‐and‐after studies ‐ without 8‐aminoquinoline | 4 | 4309 | Risk Ratio (M‐H, Random, 95% CI) | 0.29 [0.22, 0.38] |
| 5 Parasitaemia Prevalence 1‐3 months post MDA Show forest plot | 7 | Risk Ratio (M‐H, Fixed, 95% CI) | Subtotals only | |
| 5.1 Uncontrolled before‐and‐after studies ‐ with 8‐aminoquinoline | 1 | 98 | Risk Ratio (M‐H, Fixed, 95% CI) | 0.65 [0.41, 1.01] |
| 5.2 Uncontrolled before‐and‐after studies ‐ without 8‐aminoquinoline | 6 | 12959 | Risk Ratio (M‐H, Fixed, 95% CI) | 0.32 [0.29, 0.34] |
| 6 Parasitaemia Prevalence 4‐6 months post MDA Show forest plot | 5 | Risk Ratio (M‐H, Random, 95% CI) | Subtotals only | |
| 6.1 Uncontrolled before‐and‐after studies ‐ with 8‐aminoquinoline | 3 | 2979 | Risk Ratio (M‐H, Random, 95% CI) | 0.41 [0.24, 0.72] |
| 6.2 Uncontrolled before‐and‐after studies ‐ without 8‐aminoquinoline | 2 | 3797 | Risk Ratio (M‐H, Random, 95% CI) | 1.75 [0.41, 7.41] |
| Outcome or subgroup title | No. of studies | No. of participants | Statistical method | Effect size |
| 1 Parasitaemia Prevalence at baseline Show forest plot | 2 | Risk Ratio (M‐H, Random, 95% CI) | Subtotals only | |
| 1.1 Non‐randomized controlled studies ‐ falciparum | 2 | 1537 | Risk Ratio (M‐H, Random, 95% CI) | 1.34 [1.03, 1.74] |
| 1.2 Non‐randomized controlled studies ‐ vivax | 2 | 1537 | Risk Ratio (M‐H, Random, 95% CI) | 3.84 [1.33, 11.04] |
| 2 Parasitaemia Prevalence during MDA Show forest plot | 2 | Risk Ratio (M‐H, Random, 95% CI) | Subtotals only | |
| 2.1 Uncontrolled before‐and‐after studies ‐ falciparum | 2 | 5561 | Risk Ratio (M‐H, Random, 95% CI) | 0.40 [0.08, 1.97] |
| 2.2 Uncontrolled before‐and‐after studies ‐ vivax | 2 | 5561 | Risk Ratio (M‐H, Random, 95% CI) | 0.60 [0.40, 0.90] |
| 3 Parasitaemia Prevalence <1 month post MDA Show forest plot | 5 | Risk Ratio (M‐H, Random, 95% CI) | Subtotals only | |
| 3.1 Non‐randomized controlled studies ‐ falciparum | 1 | 433 | Risk Ratio (M‐H, Random, 95% CI) | 0.02 [0.00, 0.08] |
| 3.2 Non‐randomized controlled studies ‐ vivax | 1 | 433 | Risk Ratio (M‐H, Random, 95% CI) | 0.05 [0.00, 0.82] |
| 3.3 Uncontrolled before‐and‐after studies ‐ falciparum | 4 | 7367 | Risk Ratio (M‐H, Random, 95% CI) | 0.22 [0.18, 0.29] |
| 3.4 Uncontrolled before‐and‐after studies ‐ vivax | 4 | 7367 | Risk Ratio (M‐H, Random, 95% CI) | 0.50 [0.41, 0.61] |
| 4 Parasitaemia Prevalence 1‐3 months post MDA Show forest plot | 3 | Risk Ratio (M‐H, Random, 95% CI) | Subtotals only | |
| 4.1 Non‐randomized controlled studies ‐ falciparum | 1 | 357 | Risk Ratio (M‐H, Random, 95% CI) | 0.03 [0.01, 0.12] |
| 4.2 Non‐randomized controlled studies ‐ vivax | 1 | 357 | Risk Ratio (M‐H, Random, 95% CI) | 1.37 [0.46, 4.11] |
| 4.3 Uncontrolled before‐and‐after studies ‐ falciparum | 2 | 5754 | Risk Ratio (M‐H, Random, 95% CI) | 0.22 [0.09, 0.51] |
| 4.4 Uncontrolled before‐and‐after studies ‐ vivax | 2 | 5754 | Risk Ratio (M‐H, Random, 95% CI) | 0.49 [0.32, 0.76] |
| 5 Parasitaemia Prevalence 4‐6 months post MDA Show forest plot | 3 | Risk Ratio (M‐H, Random, 95% CI) | Subtotals only | |
| 5.1 Non‐randomized controlled studies ‐ falciparum | 1 | 410 | Risk Ratio (M‐H, Random, 95% CI) | 0.22 [0.14, 0.33] |
| 5.2 Non‐randomized controlled studies ‐ vivax | 1 | 410 | Risk Ratio (M‐H, Random, 95% CI) | 0.81 [0.31, 2.08] |
| 5.3 Uncontrolled before‐and‐after studies ‐ falciparum | 2 | 3642 | Risk Ratio (M‐H, Random, 95% CI) | 0.40 [0.13, 1.23] |
| 5.4 Uncontrolled before‐and‐after studies ‐ vivax | 2 | 3642 | Risk Ratio (M‐H, Random, 95% CI) | 0.31 [0.24, 0.39] |
| 6 Parasitaemia Prevalence >12 months post MDA Show forest plot | 3 | Risk Ratio (M‐H, Random, 95% CI) | Subtotals only | |
| 6.1 Non‐randomized controlled studies ‐ falciparum | 1 | 1331 | Risk Ratio (M‐H, Random, 95% CI) | 0.01 [0.00, 0.13] |
| 6.2 Non‐randomized controlled studies ‐ vivax | 1 | 1331 | Risk Ratio (M‐H, Random, 95% CI) | 0.36 [0.15, 0.86] |
| 6.3 Uncontrolled before‐and‐after studies ‐ falciparum | 2 | 5884 | Risk Ratio (M‐H, Random, 95% CI) | 0.06 [0.04, 0.09] |
| 6.4 Uncontrolled before‐and‐after studies ‐ vivax | 2 | 5884 | Risk Ratio (M‐H, Random, 95% CI) | 0.17 [0.12, 0.24] |