Administración de suplementos de vitamina D para la prevención de infecciones en niños menores de cinco años de edad
Información
- DOI:
- https://doi.org/10.1002/14651858.CD008824.pub2Copiar DOI

- Base de datos:
-
- Cochrane Database of Systematic Reviews
- Versión publicada:
-
- 09 noviembre 2016see what's new
- Tipo:
-
- Intervention
- Etapa:
-
- Review
- Grupo Editorial Cochrane:
-
Grupo Cochrane de Enfermedades infecciosas
- Clasificada:
-
- Pendiente de actualización
Studies awaiting assessment
The CIDG is currently examining a search conducted up to April 2019 for potentially relevant studies. These studies have not yet been incorporated into this Cochrane Review. All eligible published studies found in the last search (16 Jun, 2016) were included and four ongoing studies were identified (see 'Characteristics of ongoing studies' section).Evaluada: 23 April 2019
- Pendiente de actualización
- Copyright:
-
- Copyright © 2016 The Authors. Cochrane Database of Systematic Reviews published by John Wiley & Sons, Ltd. on behalf of The Cochrane Collaboration.
- This is an open access article under the terms of the Creative Commons Attribution‐Non‐Commercial Licence, which permits use, distribution and reproduction in any medium, provided the original work is properly cited and is not used for commercial purposes.
Cifras del artículo
Altmetric:
Citado por:
Autores
Contributions of authors
Drs Mohammad Y Yakoob, Farhan Raza, and Rehana A Salam participated in all steps of manuscript preparation, including literature search, data extraction, analysis, and manuscript writing. Dr Zulfiqar A Bhutta conceptualized the idea of the review, edited the manuscript, and is the overall guarantor of the integrity of this work.
Sources of support
Internal sources
-
Aga Khan University, Pakistan.
Financial support
-
Liverpool School of Tropical Medicine, UK.
External sources
-
Department for International Development (DFID), UK.
Grant: 5242
Declarations of interest
Dr. Zulfiqar Bhutta was a co‐investigator in the Manaseki‐Holland 2012 trial in Afghanistan, which we included in this Cochrane review.
Acknowledgements
We thank the Alonso 2011 trial authors for providing data on infectious outcomes from their trial. We also acknowledge the contributions of Dr Shamlan M Sheikh in conducting the initial literature search for articles pertinent to the 'Background' section for the protocol (Yakoob 2010). The editorial base for the Cochrane Infectious Diseases Group is funded by the UK Department for International Development (DFID) for the benefit of low‐ and middle‐income countries (Grant: 5242). The views expressed in this review do not necessarily reflect UK government policy.
Version history
| Published | Title | Stage | Authors | Version |
| 2016 Nov 09 | Vitamin D supplementation for preventing infections in children under five years of age | Review | Mohammad Y Yakoob, Rehana A Salam, Farhan R Khan, Zulfiqar A Bhutta | |
| 2010 Nov 10 | Vitamin D supplementation for preventing infections in children less than five years of age | Protocol | Mohammad Yawar Yakoob, Zulfiqar A Bhutta | |
Differences between protocol and review
-
Two new authors joined the review author team (RAS and FR).
-
Under the 'Types of participants' section, we modified the exclusion criteria. We excluded studies among children with severe illnesses like rickets, human immunodeficiency virus (HIV)/acquired immune deficiency syndrome (AIDS), meningitis, severe malnutrition, sickle cell disease, etc. Similarly, we also decided to exclude studies of supplementation in preterm and low birthweight infants. These groups represent high‐risk children and might have different biological response to supplementation and extremely high baseline risk of infections, and results would not be generalizable to healthy children.
-
In the 'Types of interventions' section, we removed the condition of at least two weeks of supplementation. The pattern/dosage of supplementation of vitamin D is different from other micronutrients such as zinc. It can be given in large doses as a single administration and need not be given on a continuous daily basis for supplementation.
-
We amended the wording of 'vitamin D levels' to 'vitamin D concentrations' throughout the review.
-
We added the outcomes of all‐cause mortality and cause‐specific mortality post hoc because the included trials presented data on these outcomes.
-
We modified the 'Assessment of risk of bias in included studies' section to make it more explicit and in accordance with the latest recommendations of the Cochrane Handbook for Systematic Reviews of Interventions (Higgins 2011).
-
We removed sections on dealing with cluster‐randomized controlled trials (cluster‐RCTs) since we did not find any cluster‐RCTs in this review.
We did not implement the following aspects of analyses in the protocol.
Assessment of reporting biases
If we had found a sufficient number of trials that met the inclusion criteria of this Cochrane review, we would have generated funnel plots to help assess the possibility of publication bias. We would have inspected the funnel plot visually for asymmetry and also have used statistical analytical indicators such as the Begg's or Egger's P‐values. If we suspected publication bias, then we would have used the trim‐and‐fill method to infer the existence of unpublished studies, as determined from the funnel plot, and would subsequently have corrected the meta‐analysis by imputing the presence of missing studies to yield an unbiased pooled estimate.
Subgroup analyses and investigation of heterogeneity
We had planned to carry out the following three prespecified subgroup analyses for incidence of infections.
-
Subgroup analysis according to the age of participants: less than one year of age and one to less than five years of age.
-
Subgroup analysis to examine the possibility that there would be a variable response according to the dosages of vitamin D supplementation, for example, standard dosages versus high (greater than standard).
-
Subgroup analysis according to the duration of vitamin D supplementation, for example, low (six months or less) versus high (greater than six months).
We had also planned to explore the contribution of these variables to heterogeneity by meta‐regression.
Sensitivity analyses
We had planned to perform sensitivity analyses according to the following factors.
-
Method and adequacy of allocation concealment.
-
Blinding status of the participants.
-
Percentage lost to follow‐up by excluding studies with an attrition of greater than or equal to 20%.
-
Random‐effects model for the primary analysis.
Keywords
MeSH
Medical Subject Headings (MeSH) Keywords
- Diarrhea [epidemiology, *prevention & control];
- Incidence;
- Malaria [prevention & control];
- Pneumonia [epidemiology, *prevention & control];
- Randomized Controlled Trials as Topic;
- Tuberculosis, Pulmonary [prevention & control];
- Vitamin D [*administration & dosage, blood];
- Vitamin D Deficiency [epidemiology];
- Vitamins [*administration & dosage];
Medical Subject Headings Check Words
Child, Preschool; Humans; Infant;
PICO
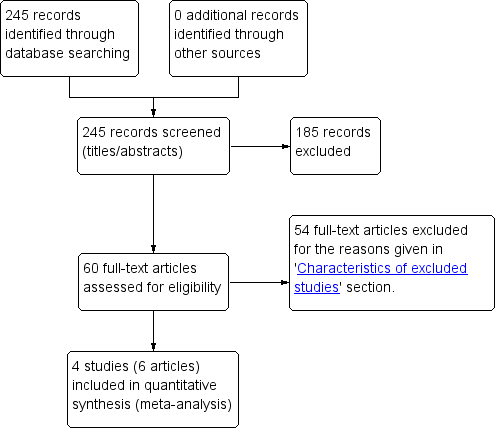
Study flow diagram.
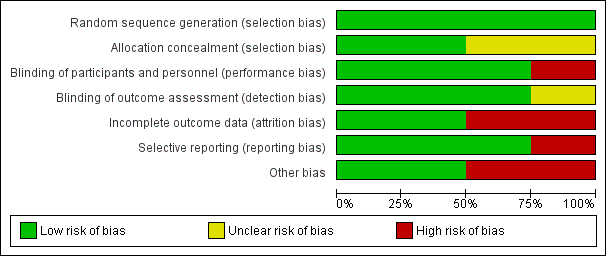
'Risk of bias' graph: review authors' judgements about each 'Risk of bias' item presented as percentages across all included trials.
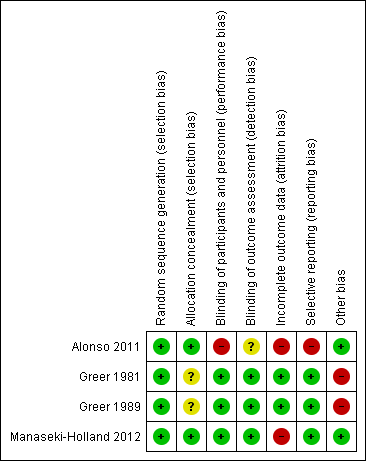
'Risk of bias' summary: review authors' judgements about each 'Risk of bias' item for each included trial.
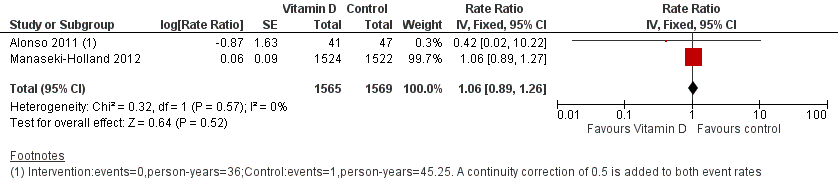
Forest plot of comparison: 1 Vitamin D versus control, outcome: 1.1 Incidence rate radiologically confirmed first or only episode of pneumonia.
Forest plot of comparison: 1 Vitamin D versus control, outcome: 1.2 All‐cause mortality.
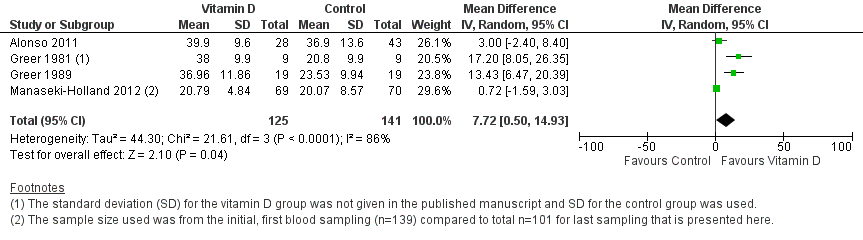
Forest plot of comparison: 1 Vitamin D versus control, outcome: 1.4 Mean serum vitamin D concentrations in ng/mL.
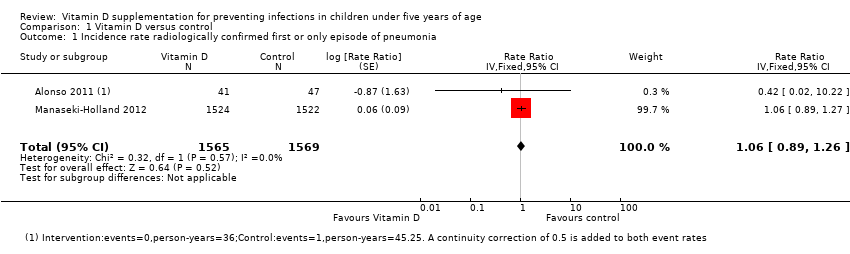
Comparison 1 Vitamin D versus control, Outcome 1 Incidence rate radiologically confirmed first or only episode of pneumonia.
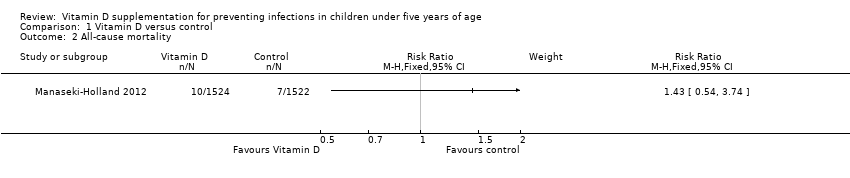
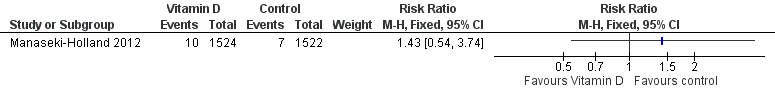
Comparison 1 Vitamin D versus control, Outcome 2 All‐cause mortality.
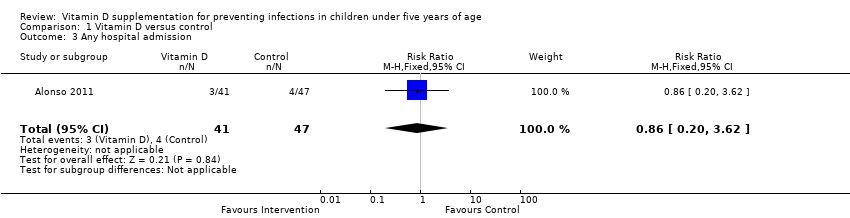
Comparison 1 Vitamin D versus control, Outcome 3 Any hospital admission.
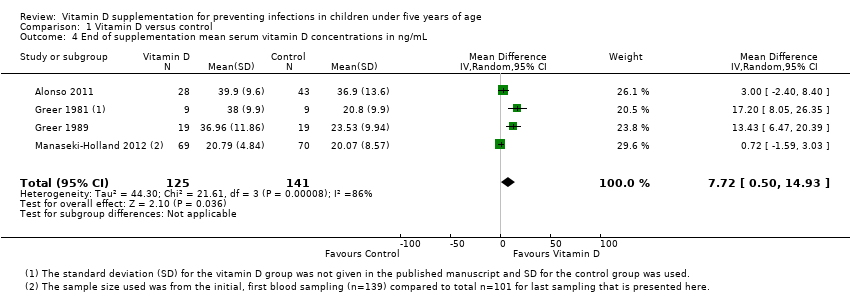
Comparison 1 Vitamin D versus control, Outcome 4 End of supplementation mean serum vitamin D concentrations in ng/mL.

Comparison 1 Vitamin D versus control, Outcome 5 Baseline mean serum vitamin D concentrations in ng/mL.
| Vitamin D versus control for preventing infections in children under five years of age | |||||
| Patient or population: children under five years of age Control: placebo or no supplementation | |||||
| Outcomes | Illustrative comparative risks* (95% CI) | Relative/absolute effect | Number of participants | Quality of the evidence | |
| Assumed risk | Corresponding risk | ||||
| Control | Vitamin D | ||||
| All‐cause mortality | 5 per 1000 | 7 per 1000 | Risk ratio 1.43 | 3046 (1) | ⊕⊕⊝⊝ |
| Cause‐specific mortality | 3 per 1000 | 5 per 1000 (1 to 16) | Risk ratio 1.50 | 3046 (1) | ⊕⊕⊝⊝ |
| Incidence rate radiologically confirmed first or only episode of pneumonia | 157 episodes per 1000 person‐years | 166 episodes per 1000 person years | Rate ratio 1.06 | 3134 | ⊕⊕⊕⊝ |
| Any hospital admission | 9 per 100 | 8 per 100 (2 to 33`) | Risk ratio 0.86 (0.20 to 3.62) | 88 (1) | ⊕⊝⊝⊝ |
| TB cases | ‐ | ‐ | ‐ | 0 studies | ‐ |
| Diarrhoea cases | ‐ | ‐ | ‐ | 2 studies7 | ‐ |
| Malaria cases | ‐ | ‐ | ‐ | 0 studies | ‐ |
| Febrile illness | ‐ | ‐ | ‐ | 0 studies | ‐ |
| Mean serum vitamin D concentrations | 141 | 125 | Mean difference 7.72ng/mL higher (0.50 higher to 14.93 higher) | 266 (4) | ⊕⊕⊝⊝ |
| *The basis for the assumed risk (e.g. the median control group risk across studies) is provided in footnotes. The corresponding risk (and its 95% CI) is based on the assumed risk in the comparison group and the relative effect of the intervention (and its 95% CI). | |||||
| GRADE Working Group grades of evidence | |||||
| 1Downgraded by 1 for imprecision: the estimate varies from 46% decrease to over 3‐fold increase for all‐cause mortality; and from 58% decrease to over 5‐fold increase for cause‐specific mortality. | |||||
| Outcome or subgroup title | No. of studies | No. of participants | Statistical method | Effect size |
| 1 Incidence rate radiologically confirmed first or only episode of pneumonia Show forest plot | 2 | 3134 | Rate Ratio (Fixed, 95% CI) | 1.06 [0.89, 1.26] |
| 2 All‐cause mortality Show forest plot | 1 | Risk Ratio (M‐H, Fixed, 95% CI) | Subtotals only | |
| 3 Any hospital admission Show forest plot | 1 | 88 | Risk Ratio (M‐H, Fixed, 95% CI) | 0.86 [0.20, 3.62] |
| 4 End of supplementation mean serum vitamin D concentrations in ng/mL Show forest plot | 4 | 266 | Mean Difference (IV, Random, 95% CI) | 7.72 [0.50, 14.93] |
| 5 Baseline mean serum vitamin D concentrations in ng/mL Show forest plot | 1 | 46 | Mean Difference (IV, Fixed, 95% CI) | 0.34 [‐3.30, 3.98] |