Administración de suplementos de vitamina D para la prevención de infecciones en niños menores de cinco años de edad
Resumen
Antecedentes
La vitamina D es un micronutriente importante para el crecimiento óseo y la función inmunitaria. La deficiencia puede llevar al raquitismo y ha estado vinculada a diversas infecciones, incluidas las infecciones respiratorias. No se han evaluado sistemáticamente las pruebas de los efectos de la administración de suplementos sobre las infecciones en los niños.
Objetivos
Evaluar la función de la administración de suplementos de vitamina D en la prevención de la neumonía, la tuberculosis (TB), diarrea y el paludismo en niños menores de cinco años de edad. Lo anterior incluye países de ingresos altos, medios y bajos.
Métodos de búsqueda
Se hicieron búsquedas en el registro especializado del Grupo Cochrane de Enfermedades Infecciosas (Cochrane Infectious Diseases Group Specialized Register), Registro Cochrane Central de Ensayos Controlados (Cochrane Central Register of Controlled Trials) (CENTRAL), la Cochrane Library, MEDLINE, EMBASE, LILACS, la WHO International Clinical Trials Registry Platform (ICTRP; http://www.who.int/ictrp/en/) , ClinicalTrials.gov y en el ISRCTN registry (http://www.isrctn.com/) hasta el 16 junio 2016.
Criterios de selección
Se incluyeron ensayos controlados aleatorios (ECA) que evaluaron la administración preventiva de suplementos de vitamina D (versus placebo o ninguna intervención) en niños menores de cinco años de edad.
Obtención y análisis de los datos
Dos autores de la revisión examinaron de forma independiente los títulos y resúmenes, extrajeron los datos y evaluaron el riesgo de sesgo de los ensayos incluidos.
Resultados principales
Cuatro ensayos cumplieron los criterios de inclusión, con un total de 3198 niños menores de cinco años de edad, y se realizaron en Afganistán, España y Estados Unidos. Hubo amplia variación en la prevalencia de la deficiencia de vitamina D en estas poblaciones (intervalo: 73,1% en Afganistán, 10% a 12% en Estados Unidos y 6,2% en España). Los ensayos incluidos evaluaron la mortalidad (dos ensayos), la incidencia de neumonía (dos ensayos), la incidencia de diarrea (dos ensayos), la hospitalización (dos ensayos) y la concentración sérica media de vitamina D (cuatro ensayos).
Se desconoce si la administración de suplementos de vitamina D repercute en la mortalidad por todas las causas porque este resultado tuvo bajo poder estadístico, debido al número reducido de eventos (cociente de riesgos [CR] 1,43; intervalo de confianza [IC] del 95%: 0,54 a 3,74; un ensayo, 3046 participantes, pruebas de baja calidad).
Para la neumonía, hubo pocas diferencias en los episodios de primer o único episodio de neumonía "confirmada radiológicamente" entre el grupo que recibió suplementos y el que no los recibió (cociente de tasas: 1,06; intervalo de confianza [IC] del 95%: 0,89 a 1,26; dos ensayos, 3134 participantes, pruebas de calidad moderada) y de igual manera para los niños con neumonía confirmada o no confirmada (CR 0,95; IC del 95%: 0,87 a 1,04; un ensayo, 3046 participantes). En estos dos ensayos, no hubo diferencias evidentes entre los niños que recibieron suplementos y los que no los recibieron con respecto a los episodios de diarrea.
En el único ensayo de gran tamaño de Afganistán, los autores informaron que la administración de suplementos de vitamina D se asoció con un aumento de los episodios repetidos de neumonía confirmada por radiografía del tórax (CR 1,69; IC del 95%: 1,28 a 2,21; un ensayo, 3046 participantes), pero no se vio representada en el resultado de neumonía confirmada o no confirmada (CR 1,06; IC del 95%: 1,00 a 1,13; un ensayo, 3046 participantes).
Para el ingreso hospitalario medido en un ensayo pequeño, no se detectaron diferencias (CR 0,86; IC del 95%: 0,20 a 3,62; un ensayo, 88 participantes; pruebas de muy baja calidad).
La concentración sérica media de vitamina D fue mayor en los niños que recibieron suplementos versus los que no los recibieron al final del período de administración de suplementos (DM 7,72 ng/ml; IC del 95%: 0,50 a 14,93; cuatro ensayos, 266 participantes, pruebas de baja calidad). Estos resultados se derivan fundamentalmente de dos ensayos más pequeños con una magnitud grande del efecto. En los otros dos ensayos más grandes, la concentración sérica de vitamina D se elevó en el grupo de intervención durante la mayor parte del ensayo pero no al final de la administración de suplementos. Esto puede deberse al tiempo transcurrido hasta la medición de la última dosis, cumplimiento deficiente o mayor necesidad de vitamina D con la lactancia.
No se encontró ningún ensayo que informara la incidencia de tuberculosis, paludismo o enfermedad febril, la duración de la neumonía, la duración de la diarrea, la gravedad de la infección y la mortalidad por una causa específica (tuberculosis, diarrea o paludismo).
Conclusiones de los autores
Las pruebas de un ensayo de gran tamaño no demostraron el beneficio de la administración de suplementos de vitamina D en la incidencia de neumonía o diarrea en niños menores de cinco años. Según lo que se sabe, no se han realizado ensayos que evaluaron la administración de suplementos para la prevención de otras infecciones, incluida la tuberculosis y el paludismo.
PICOs
Resumen en términos sencillos
Administración de suplementos de vitamina D para la prevención de infecciones en niños menores de cinco años
Antecedentes
La vitamina D es un micronutriente importante para el crecimiento óseo y la función inmunitaria. La deficiencia puede llevar al raquitismo y ha estado vinculada a diversas infecciones, incluidas las infecciones respiratorias. Varios estudios informaron una asociación entre la deficiencia de vitamina D y las infecciones en niños, y se piensa que está relacionada con la función de la vitamina D en el sistema inmunológico. En esta revisión sistemática, los investigadores Cochrane examinaron la función de la administración de suplementos de vitamina D en la prevención de infecciones en niños menores de cinco años de edad. Los investigadores estudiaron los casos de neumonía, tuberculosis (TB), diarrea y paludismo en esta revisión.
Características de los estudios
Los autores de la revisión examinaron las pruebas disponibles hasta el 17 de junio de 2016, e incluyeron cuatro ensayos con un total de 3198 niños menores de cinco años de edad. Los ensayos incluidos se realizaron en Afganistán, España y Estados Unidos.
Hallazgos clave
La revisión no detectó un efecto de la administración de suplementos de vitamina D sobre la muerte (pruebas de baja calidad); el primer o único episodio de neumonía; o en niños con neumonía, de forma independiente de si había sido confirmada por pruebas del hospital (pruebas de calidad moderada). Las pruebas limitadas mostraron que no hubo diferencias evidentes en los primeros episodios o los episodios repetidos de diarrea en los niños que recibieron suplementos y los que no los recibieron. No se sabe si la vitamina D tiene algún efecto en los ingresos al hospital, ya que hubo sólo un estudio pequeño que lo midió (pruebas de muy baja calidad). La concentración sérica media de vitamina D fue mayor en los niños que recibieron suplementos versus los que no los recibieron al final del período de administración de suplementos (pruebas de baja calidad). Un ensayo de gran tamaño de Afganistán mostró un aumento de los episodios repetidos de neumonía confirmada pero no en la neumonía confirmada y no confirmada. Ninguno de los ensayos incluidos informó la tuberculosis o el paludismo como resultados.
Conclusiones
Un ensayo de gran tamaño no ha demostrado un efecto de la vitamina D sobre la muerte o las infecciones respiratorias en niños menores de cinco años de edad. No se encontraron ensayos que evaluaran la administración de suplementos de vitamina D para prevenir otras infecciones como la tuberculosis y el paludismo.
Authors' conclusions
Summary of findings
| Vitamin D versus control for preventing infections in children under five years of age | |||||
| Patient or population: children under five years of age Control: placebo or no supplementation | |||||
| Outcomes | Illustrative comparative risks* (95% CI) | Relative/absolute effect | Number of participants | Quality of the evidence | |
| Assumed risk | Corresponding risk | ||||
| Control | Vitamin D | ||||
| All‐cause mortality | 5 per 1000 | 7 per 1000 | Risk ratio 1.43 | 3046 (1) | ⊕⊕⊝⊝ |
| Cause‐specific mortality | 3 per 1000 | 5 per 1000 (1 to 16) | Risk ratio 1.50 | 3046 (1) | ⊕⊕⊝⊝ |
| Incidence rate radiologically confirmed first or only episode of pneumonia | 157 episodes per 1000 person‐years | 166 episodes per 1000 person years | Rate ratio 1.06 | 3134 | ⊕⊕⊕⊝ |
| Any hospital admission | 9 per 100 | 8 per 100 (2 to 33`) | Risk ratio 0.86 (0.20 to 3.62) | 88 (1) | ⊕⊝⊝⊝ |
| TB cases | ‐ | ‐ | ‐ | 0 studies | ‐ |
| Diarrhoea cases | ‐ | ‐ | ‐ | 2 studies7 | ‐ |
| Malaria cases | ‐ | ‐ | ‐ | 0 studies | ‐ |
| Febrile illness | ‐ | ‐ | ‐ | 0 studies | ‐ |
| Mean serum vitamin D concentrations | 141 | 125 | Mean difference 7.72ng/mL higher (0.50 higher to 14.93 higher) | 266 (4) | ⊕⊕⊝⊝ |
| *The basis for the assumed risk (e.g. the median control group risk across studies) is provided in footnotes. The corresponding risk (and its 95% CI) is based on the assumed risk in the comparison group and the relative effect of the intervention (and its 95% CI). | |||||
| GRADE Working Group grades of evidence | |||||
| 1Downgraded by 1 for imprecision: the estimate varies from 46% decrease to over 3‐fold increase for all‐cause mortality; and from 58% decrease to over 5‐fold increase for cause‐specific mortality. | |||||
Background
Description of the condition
Vitamin D is a family of fat‐soluble molecules that are important micronutrients for humans, and two forms (D2 and D3) play a central role in bone growth by increasing the uptake of calcium from the gut (Bentley 2013). Vitamin D is therefore especially important in growing children, and a deficiency in vitamin D can lead to rickets, which is characterized by weak and deformed bones.
Humans can obtain both vitamin D2 and D3 from their diet, with fish liver oils, eggs, and milk being particularly rich in both. However, we obtain most of our vitamin D in the form of vitamin D3 by synthesizing it directly when their skin is exposed to sunlight. This powers a photochemical reaction in which a derivative of cholesterol is converted into pre‐vitamin D3, which is then transformed into vitamin D3 by the heat of the skin (Wagner 2008a).
Vitamin D2 and D3 are water‐insoluble and are transported in the blood to the liver bound to carrier proteins, mainly vitamin D‐binding protein. Here, they are converted to 25‐hydroxyvitamin D (25(OH)D), which is the major circulating form of vitamin D. In the kidneys, 25(OH)D is converted to 1,25‐dihydroxyvitamin D (1,25(OH)D) via the action of the enzyme 1α hydroxylase (Holick 2008; White 2008). This is the active form of vitamin D in the body, and is thus the true hormonal form of vitamin D. It binds to the vitamin D receptor (VDR), which is found on the nuclear membrane of many cells (Walker 2009).
Vitamin D levels in the body are best measured using the concentration of 25(OH)D in blood serum. According to the US Institute of Medicine (IOM 2010), concentrations of 25(OH)D above 50 nmol/L (20 ng/mL) can provide benefit to most in the population and are considered in the normal range. Vitamin D deficiency refers to concentrations below this cut‐off value. It is estimated that around one billion people in the world may have suboptimal vitamin D concentrations (Walker 2009). The major risk factors are lack of sunlight (especially during winter months), vegetarian diets, a dark pigmented skin (as melanin acts as a natural sunscreen), increased pollution, and wearing long‐sleeved garments or clothes completely covering the body (Williams 2008; Nimitphong 2013). Modern recommendations to avoid the sun to prevent skin cancers may also be contributing to a deficiency in vitamin D (Misra 2008).
Fortified foods such as infant formulas, breakfast cereal, cheese, and cows' milk are the major dietary sources of vitamin D in children, but they may not be consumed in sufficient quantities. Furthermore, dairy products may not be fortified in all countries. Diet contributes less than 10% to 20% of an adult’s vitamin D stores, and this proportion may be even smaller in children (Sichert‐Hellert 2006). Since vitamin D is a fat‐soluble vitamin, a diet that is extremely low in fat can also impair its absorption. Breast milk can be a poor source of vitamin D, particularly if the mother has clinical or subclinical vitamin D deficiency.
Over the past 20 years, much attention has been paid to recognition of vitamin D deficiency in children worldwide. Childhood vitamin D deficiency is highly prevalent in many developing countries, even those with abundant sunlight such as Turkey (Ozgür 1996), Iran (Salimpour 1975; Bassil 2013), Saudi Arabia (Elidrissy 1984), Jordan (Bassil 2013), the United Arab Emirates (Bassil 2013), Algeria (Garabedian 1991), India (Ghai 1991; Wayse 2004), China (Zhao 1991; Zhao 1992; Du 2001; Zhang 2013), and Nigeria (Akpede 1999; Akpede 2001). A study on the health status of children in low‐ and middle‐income countries reported that 73.1% of underprivileged children were 25(OH)D‐deficient (Manaseki‐Holland 2008). A high occurrence of vitamin D deficiency in infants and children has also been reported in many other countries, including industrialized ones (Prentice 2008) such as the USA (Mansbach 2009), the UK (Lawson 1999), Greece (Nicolaidou 2006), Finland Lehtonen‐Veromaa 1999), Canada (Ward 2007), and New Zealand (Grant 2009).
Description of the intervention
In the past, clinicians have primarily focused on the role of vitamin D in preventing and treating rickets. However, a few early researchers realized that children with rickets were more likely to have respiratory infections. Initially, clinicians presumed these infections were caused by poor lung function as a result of bone deformities and the overall compromised nutritional status associated with rickets. Since then, several studies, including case‐control and case series studies, have linked rickets with pneumonia and respiratory tract infections (Salimpour 1975; Muhe 1997; Najada 2004), and implicated vitamin D deficiency as a potential risk factor for these infections. Many epidemiological studies have also been conducted in children to assess the link between inadequate vitamin D concentrations and respiratory infections, including tuberculosis (TB) (Wayse 2004; Nnoaham 2008; Williams 2008; Karatekin 2009; McNally 2009; Roth 2009). The findings from these studies have been mixed, with some reporting strong positive associations and others no associations. A retrospective case‐series of 64 paediatric TB patients during a two‐year period in UK showed that 86% of children were either vitamin D‐deficient or vitamin D‐insufficient (Williams 2008). Other case‐control studies in Europe and Australia showed an increased risk of vitamin D deficiency in children with TB compared to healthy controls (Gray 2012; Venturini 2014), while another study from India did not find vitamin D deficiency a risk factor for TB in children (Jubulis 2014). Evidence is also emerging on the role of vitamin D deficiency as a risk factor for gastroenteritis. A prospective cohort study of school‐age children in Colombia reported a significant two‐fold increased risk of diarrhoea with vomiting over a one‐year period in vitamin D‐deficient compared to vitamin D‐sufficient children. This indicated increased susceptibility to norovirus and Salmonella or Shigella bacterial infections (Thornton 2013). Vitamin D insufficiency has also been linked to more severe malarial infections in Ugandan children 18 months to 12 years old (Cusick 2014). In animal models, vitamin D is known to inhibit the development of cerebral malaria during Plasmodium berghei infection (He 2014); and in another study, the death rate in mice from P. berghei infection reduced after addition of cod liver oil or vitamin D and dicalcium phosphate to antimalarial drugs (Sautet 1957; Luong 2015).
The precise molecular mechanisms by which vitamin D helps defend people against infectious disease are now being elucidated. It has become clear that 1,25(OH)D plays a role not only in calcium homeostasis and bone metabolism, but also in the integrity of the innate immune system (Bhutta 2008; Wagner 2008b; Dimitrov 2015). Acting via the VDR, 1,25(OH)D alters the activity of many immune system cells, including macrophages, regulatory T cells, and natural killer cells.
Based on bone health benefits of vitamin D, the US Institute of Medicine (IOM) published new dietary guidelines in 2010, with the adequate intake for infants of 400 International Units (IU) daily of vitamin D, and raised the Recommended Dietary Allowance (RDA) for children older than one year from 400 IU/day in 2008 (Wagner 2008a) to 600 IU/day (IOM 2010). Health Canada also has similar recommendations of 400 IU/day for all exclusively breastfed, healthy infants; this should be continued until the infant's diet provides at least 400 IU/day from other sources (Canadian Paediatric Society 2007). However, the IOM committee did not find sufficient conclusive evidence for effects on non‐skeletal outcomes (Shapses 2011). It is therefore not yet known if these doses are sufficient to deliver all potential non‐skeletal health benefits related to vitamin D, and some experts recommend that at least 1000 IU/day may be required to consistently raise serum 25(OH)D concentrations above 30 ng/mL (Holick 2011). Vitamin D is generally safe and well tolerated when given at appropriate doses; cases of hypercalcaemia have been documented with vitamin D toxicity (only at doses of 50,000 IU/day or more for several weeks), which may eventually lead to vascular and tissue calcification with subsequent renal and cardiovascular damage (IOM 2010).
How the intervention might work
Vitamin D influences the action of more than 200 human genes in a wide range of tissues and displays as many molecular mechanisms (Cannell 2008). In particular, it interacts with the human immune system in a wide variety of ways, and helps to protect against infectious diseases (Gunville 2013). For example, it has been known for 20 years that exposure to 1,25(OH)D stimulates anti‐mycobacterial activity in human monocytes and macrophages. Recent research suggests that this is due to vitamin D helping to generate antimicrobial peptides (AMPs) like cathelicidin and some β defensins (White 2008; Gunville 2013). These AMPs then lead to enhanced killing of intracellular Mycobacterium tuberculosis by direct membrane damage and also by acting as chemoattractants for monocytes.
Recent research also indicates that a sufficient intake of vitamin D is essential for killer T cells to fend off serious infections, by controlling T cell antigen receptor (TCR) signalling and the activation of human T cells. Besides this, 1,25(OH)D also suppresses an overzealous adaptive immune response to pathogens that may be difficult for macrophages to handle efficiently (Walker 2009). The levels of plasma interleukin‐1ß have also been shown to be low in children with vitamin D deficiency which can predispose them to infections (Liang 2010; Bentley 2013).
The relationship between vitamin D and infectious diseases is also supported by genetic studies of polymorphisms in the gene for the VDR. Researchers have found a significant link between single nucleotide polymorphisms of genes related to the innate immune function, including the VDR, and genetic susceptibility to respiratory syncytial virus (RSV) bronchiolitis (Janssen 2007).
While there is much research on the beneficial effects of vitamin D for TB infections, data are emerging from various sources about its role in fighting other bacterial and viral pathogens. Apart from the synthesis of AMPs (cathelicidin and defensins), the binding of activated vitamin D to the VDR can modulate viral lower respiratory tract disease. One of the defensins, retrocyclin‐2, inhibits infection with the influenza virus by blocking its fusion with cell membranes (Leikina 2005). Respiratory tract infections peak during the winter season when there is less sunlight and so vitamin D deficiency during this season may enhance the infectivity of influenza viruses. A randomized controlled trial (RCT) on 334 schoolchildren showed that vitamin D supplements had a beneficial effect on influenza A incidence during the four‐month study period (Urashima 2010).
Vitamin D and its role in malarial infection has also been explored. It inhibits development of cerebral malaria in animal models due to suppression of inducible systemic inflammatory responses with reduced production of cytokines (interferon‐Ƴ and tumour necrosis factor) (He 2014). Vitamin D also inhibits penetration of P. berghei into erythrocyte membranes (Sergacheva 1986) and inhibits growth of Plasmodium falciparum in red blood cells in vitro (Vial 1982). VDR expression was also higher in patients with Plasmodium vivax infection, which indicates a link between VDR polymorphism and severity of malarial infection (Ray 2012).
Cystic fibrosis (CF) is an inherited disorder seen in children, and is characterized by pancreatic insufficiency and recurrent infections. Children with CF have inadequate fat‐soluble vitamins, including vitamin D. Yim 2007 showed that there was enhanced antibacterial activity against airway pathogens, such as Pseudomonas aeruginosa and Bordetella bronchiseptica, in both normal and CF bronchial epithelial cells in participants supplemented with 1,25(OH)D. They also witnessed 1,25(OH)D‐induced production of cathelicidin in this cell type.
Why it is important to do this review
Globally, pneumonia and diarrhoea constitute the leading infectious causes of childhood deaths in children under five years of age, and the burden is concentrated in Southeast Asia and Africa. This also explains the focus of this Cochrane Review on this age range. According to 2010 estimates, there were 120 million episodes of pneumonia and 1.731 billion episodes of diarrhoea worldwide (Walker 2013). Twelve per cent of pneumonia episodes and 2% of diarrhoea episodes progressed to severe disease; the case‐fatality ratio for severe pneumonia was 8.9% (uncertainty range: 3.1 to 12.5%) and for severe diarrhoea 2.0% (1.4 to 4.4%) (Walker 2013).
Rickets is the best‐known medical condition associated with vitamin D deficiency. It has also been linked to various infectious diseases, especially respiratory infections such as pneumonia, TB, and bronchiolitis, which suggests that suboptimal concentrations of vitamin D may be responsible in the aetiology of these infections (see the 'Description of the intervention' section). Due to lack of evidence on the role of vitamin D in preventing infections, the mortality and morbidity burden of infections in children due to vitamin D deficiency has not yet been quantified.
Vitamin D supplementation is a relatively simple intervention that might decrease the incidence of many infections. A study in the UK on a small cohort reported that the cost of preventing vitamin D deficiency in a high‐risk population of Asian children was much lower than the cost of treating the general health issues linked with chronic vitamin D deficiency (Zipitis 2006). Because of its cost effectiveness and ease of administration, it can easily be applied on a large scale to children in communities or in health facilities. Vitamin D could therefore help prevent the enormous burden of morbidity and mortality in children.
Objectives
To evaluate the role of vitamin D supplementation for preventing pneumonia, tuberculosis (TB), diarrhoea, and malaria in children under five years of age. This includes high‐, middle‐, and low‐income countries.
Methods
Criteria for considering studies for this review
Types of studies
Randomized controlled trials (RCTs), whether individually‐ or cluster‐RCTs.
Types of participants
Children under five years of age. We excluded studies on children with pre‐existing illnesses, such as rickets, human immunodeficiency virus (HIV)/ acquired immune deficiency syndrome (AIDS), meningitis, severe malnutrition, and sickle cell disease. We also excluded studies of supplementation in preterm and low birthweight infants.
Types of interventions
Interventions
We included trials of synthetic oral vitamin D supplementation of various doses and frequencies compared to a control group (placebo or no intervention). The co‐interventions (for example, multiple vitamins or adjunct mineral and nutrient supplementation) should have been identical in both groups, that is vitamin D supplementation was the only difference between the intervention and control groups. We excluded studies that evaluated the effects of food fortification or the consumption of vitamin D‐rich foods. If a trial included more than one eligible intervention group (for example, differing in dose), we combined the groups for the main analysis, although they could be treated separately for subgroup analyses.
Comparisons
-
Vitamin D versus placebo or no treatment.
-
Vitamin D plus 'other micronutrient(s)' versus 'other micronutrient(s)'.
We excluded the following comparisons.
-
Vitamin D plus 'other micronutrient' versus placebo or no treatment.
-
Vitamin D plus 'other micronutrient' versus 'different other micronutrient'.
Types of outcome measures
Primary outcomes
-
Incidence rate (number of cases or episodes per total child‐years) of the following.
-
Pneumonia.
-
Tuberculosis (TB).
-
Secondary outcomes
-
Incidence rate (number of cases or episodes per total child‐years) of the following.
-
Diarrhoea.
-
Malaria.
-
-
Incidence rate (cases or episodes per total child‐years) of febrile illness.
-
Duration (mean number of days of all episodes) of the following.
-
Pneumonia (positive clinical examination or chest radiograph findings).
-
Diarrhoea.
-
-
Severity of infection.
-
Moderate or severe pneumonia (as defined by the authors).
-
Moderate or severe diarrhoea, that is, history of loose stools more than three times per day and history of oral dehydration or intravenous fluid therapy.
-
-
All‐cause mortality (included post hoc in this review).
-
Cause‐specific mortality (included post hoc in this review).
-
Pneumonia.
-
TB.
-
Diarrhoea.
-
Malaria.
-
-
Hospital admission rate due to infections.
-
Change in mean serum vitamin D concentrations
-
Adverse outcomes
-
New cases per total children of the following.
-
Nausea within 72 hours.
-
Vomiting within 72 hours.
-
Headache within 72 hours.
-
Constipation.
-
Kidney stones.
-
We included trials that reported on at least one of the review‐defined outcomes. If a trial had information on infection‐related outcomes in the full text but data were unavailable, we contacted the trial authors to get the complete results.
Time of outcome assessment
We grouped outcomes by time: zero to 12 months, 13 to 60 months, and over 60 months. When trials reported multiple time points, we extracted the longest outcome interval in a given time period.
Search methods for identification of studies
We attempted to identify all relevant studies regardless of language, setting/region (low‐, middle‐, and high‐income countries), or publication status (published, unpublished, in press, and ongoing).
Electronic searches
We searched the following databases for relevant studies using the search terms and strategy detailed in Appendix 1: the Cochrane Infectious Diseases Group (CIDG) Specialized Register; the Cochrane Central Register of Controlled Trials (CENTRAL), published in the Cochrane Library issue 6 2016; MEDLINE (Pubmed, 1966 to 16 June 2016); EMBASE (OVID, 1980 to 16 June 2016); and LILACS (1982 to 16 June 2016). We also searched the WHO International Clinical Trials Registry Platform (ICTRP; http://www.who.int/ictrp/en/) , ClinicalTrials.gov and the ISRCTN registry (http://www.isrctn.com/) for ongoing trials, using "vitamin D" and ‘child* OR infant*’ as search term (all accessed on 16 June 2016).
Searching other resources
We contacted researchers in the field to identify additional studies that may be eligible for inclusion. We also checked the reference lists of all studies identified by the above methods.
Data collection and analysis
Selection of studies
Two review authors (MYY and FR) independently assessed studies for inclusion. They selected potentially relevant studies by screening the titles and abstracts of studies, if available. We retrieved and reviewed full‐text articles when we could not determine their relevance from titles or abstracts. Three review authors (MYY, RAS, and FR) independently screened these full‐text articles to assess the eligibility of all potentially relevant studies and filled out eligibility forms, which we designed in accordance with the specified inclusion criteria. We resolved differences of opinion about studies' suitability for inclusion by discussion between all review authors. We presented the excluded studies that appeared to meet the inclusion criteria but on further investigation of the full‐text article did not in the 'Characteristics of excluded studies' table, along with the reason(s) for their exclusion. In the case of conference abstracts, if additional data were not forthcoming, we used the information provided in the abstract for review purposes. We also attempted to contact the trial authors regarding eligibility for studies where eligibility was unclear.Figure 1 shows the study flow diagram.

Study flow diagram.
Data extraction and management
We used a data extraction sheet to extract the following information from each included trial.
-
Dates.
-
Location (country, urban/rural).
-
Method of recruitment.
-
Inclusion criteria.
-
Unit of analysis.
-
Allocation ratio.
-
Risk of bias (see below).
-
Participants.
-
Sample size and person‐time of follow‐up.
-
Socio‐demographics (age, gender).
-
Co‐morbidities.
-
-
Intervention and comparison.
-
Number of eligible intervention groups.
-
-
For each intervention and comparison group of interest.
-
Dosage.
-
Duration.
-
Frequency.
-
Co‐intervention (if any).
-
Details of the comparison.
-
-
Outcomes.
-
Outcomes and time points (a) collected and (b) reported.
-
-
For each outcome of interest.
-
Outcome definition and unit of measurement (if relevant).
-
Loss to follow‐up.
-
-
Miscellaneous.
-
Key conclusions of trial authors.
-
References to other relevant trials.
-
Correspondence required.
-
For incidence rates (count data), we extracted the number of events in the treatment and control groups, and the total person‐time at risk in each group, or the rate ratio and a measure of variance, for example, standard error (SE) directly from the trial report. We used cumulative incidences or risks for dichotomous data such as mortality risks and adverse events for which we extracted the number of participants experiencing the condition and the total number of participants in each treatment group.
Assessment of risk of bias in included studies
Two review authors (MYY and RAS) independently assessed methodological quality using the Cochrane 'Risk of bias' assessment tool (Higgins 2011). We assessed the included trials based on the following six components.
Sequence generation (checking for selection bias and baseline exchangeability)
For each included trial we described the method used to generate allocation sequence in sufficient detail. We assessed the method as at one of the following levels of bias.
-
Low risk (any truly random process, for example, random number table, computer random number generation).
-
High risk (any quasi‐ or non‐random process, for example, odd or even date of birth; hospital or clinic record number).
-
Unclear risk.
Allocation concealment (checking for selection bias and baseline exchangeability)
We described for each included trial the method used to conceal the allocation sequence and determine whether intervention allocation could have been foreseen in advance of or during recruitment, or changed after assignment. We assessed the method as the following.
-
Low risk (for example, telephone or central randomization; consecutively numbered sealed opaque envelopes).
-
High risk (for example, open random allocation; unsealed or non‐opaque envelopes).
-
Unclear risk.
Blinding (checking for possible performance bias)
We described for each included trial the methods used, if any, to blind trial participants and personnel from knowledge of which intervention a participant received. We judged trials to be at low risk of bias if they were blinded, or if we judge that the lack of blinding could not have affected the results. We assessed the methods as follows.
-
Low, high, or unclear risk for participants.
-
Low, high, or unclear risk for personnel.
-
Low, high, or unclear risk for outcome assessors.
Incomplete outcome data (checking for possible attrition bias through withdrawals, dropouts, protocol deviations)
For each included trial we described the data missing, including attrition and exclusions from the analysis. We stated whether the trial authors reported attrition and exclusions, the numbers included in the analysis at each stage (compared with the total randomized participants), and if the trial authors reported the reasons for attrition. We assessed the methods as follows.
-
Low risk.
-
High risk.
-
Unclear risk.
Selective reporting bias (deviation from a priori specification in the protocol)
We assessed selective reporting bias in the included trials as follows.
-
Low risk (where it was clear that the trial authors reported all of the trial's prespecified outcomes and all expected outcomes of interest to the review).
-
High risk (where the trial authors did not report all the trial's prespecified outcomes; did not prespecify one or more primary outcomes; reported the outcomes of interest incompletely and so could not be used, the trial failed to include the results of a key outcome that we would have expected the trial authors to have reported).
-
Unclear risk.
Other potential sources of bias
For each included trial, we described susceptibility to other possible sources of bias, for example, information bias (misclassification). We assessed whether each included trial was free of other issues that could put it at risk of bias.
-
Low risk.
-
High risk.
-
Unclear risk.
Overall risk of bias
We made explicit judgements about whether the included trials were at high or low risk of bias, according to the criteria given in the Cochrane Handbook for Systematic Reviews of Interventions (Higgins 2011). With reference to the risk of bias criteria we have listed above, we assessed the likely magnitude and direction of bias. We had planned to explore the impact of the level of bias through undertaking sensitivity analyses for the primary outcomes.
We presented findings in a 'Risk of bias' tables where, for each question‐based entry, our 'Risk of bias' judgement is followed by a text box that provides details on the available information that led us to each judgement. Also we presented the results in 'Risk of bias' figures. For information that was unclear based on the full‐text article(s), we attempted to contact the trial authors for clarification. We resolved any disagreements between the two review authors who performed the 'Risk of bias' assessments by discussion among all the review authors. Further details about the 'Risk of bias' assessment tool are included in Chapter 8 of the Cochrane Handbook for Systematic Reviews of Interventions (Higgins 2011).
Quality of the evidence
We assessed the quality of the evidence using the Grading of Recommendations Assessment, Development and Evaluation (GRADE) approach (Schünemann 2009) for the following outcomes for the main comparison of vitamin D versus placebo/control.
-
All‐cause mortality.
-
Incidence rates of pneumonia.
-
Incidence rates of TB.
-
Incidence rates of diarrhoea.
-
Incidence rates of febrile illness.
-
Incidence rates of malaria.
-
Mean serum vitamin D concentrations.
We used the GRADEpro Guideline Development Tool (GDT) (GRADEpro GDT 2015) to import data from Review Manager (RevMan) (RevMan 2014) to create a 'Summary of findings' table. We produced a summary of the intervention effect and a measure of quality for each of the above outcomes using the Grading of Recommendations Assessment, Development and Evaluation (GRADE) approach. The GRADE approach uses five considerations (study limitations, consistency of effect, imprecision, indirectness, and publication bias) to assess the quality of evidence for each outcome. The evidence can be downgraded from 'high quality' by one level for serious (or by two levels for very serious) limitations based on assessments in these five areas.
Measures of treatment effect
Count data
We used rate ratios with 95% confidence intervals (CIs) to combine count data.
Dichotomous data
For dichotomous data, we presented results as risk ratios with 95% CIs using intention‐to‐treat (ITT) analysis results from the included trials.
Continuous data
We combined the continuous data using mean differences (MDs) if continuous data were summarized by arithmetic means and standard deviations. We combined them on the log scale using the MD where the data were summarized using geometric means, We reported medians and ranges.
Unit of analysis issues
No cluster‐randomized controlled trials (cluster‐RCTs) met the inclusion criteria of this review, and all included RCTs performed randomization and analysed at the individual level.
Dealing with missing data
We described missing data, including dropouts. Differential dropout rates can lead to biased estimates of the effect size, and bias may arise if the reasons for dropping out differ across groups. We reported the reasons for dropout. If data were missing for some cases, or if the trial authors did not report the reasons for dropping out, we contacted the trial authors. If there were missing data for dichotomous outcomes, we used ITT analyses as opposed to the complete‐case analyses because in the latter the intervention and control groups are no longer exchangeable at baseline with respect to different characteristics that may introduce confounding bias in the analysis.
Assessment of heterogeneity
We assessed the included RCTs for clinical, methodological, and statistical heterogeneity. We assessed clinical heterogeneity by comparing the distribution of important factors, such as the study participants, study setting, dose and duration of the intervention and co‐interventions. We evaluated methodological heterogeneity on the basis of factors such as the method of sequence generation, allocation concealment, blinding of outcome assessment, and loss to follow‐up. We assessed statistical heterogeneity among the included trials by visual inspection of forest plot and the I² statistic (calculated as I² statistic = 100% x (Q‐df )/Q; where Q is Cochrane’s heterogeneity statistic and df is the degree of freedom) (Higgins 2003). The I² statistic describes the percentage of variability attributable to between‐study heterogeneity rather than due to sampling error or chance. If the I² statistic value exceeded 50%, we considered heterogeneity to be substantial. We had also planned to undertake subgroup analyses to explore reasons for high levels of heterogeneity, where applicable.
Assessment of reporting biases
We planned to use funnel plots to assess reporting biases but only four trials met our inclusion criteria. See the 'Differences between protocol and review' section.
Data synthesis
We performed meta‐analyses using RevMan (RevMan 2014). We chose a fixed‐effect model when the I² statistic value less than or equal to 50%, and a random‐effects model otherwise. We used generic inverse variance (GIV) analysis for count data such as the rate ratio, where the estimates of log rate ratio and its SE were directly entered. This was to facilitate the use of rate ratios for studies where the actual denominator of person‐time was unavailable or was given in standardized units only, such as per 1000 child‐days. For dichotomous data, such as the risk ratio, we entered detailed information on the number of events and total participants rather than relying on the GIV method.
Subgroup analysis and investigation of heterogeneity
See the 'Differences between protocol and review' section.
Sensitivity analysis
See the 'Differences between protocol and review' section.
Results
Description of studies
See the 'Characteristics of included studies', 'Characteristics of excluded studies', and 'Characteristics of ongoing studies' sections.
Results of the search
We identified 245 titles and abstracts from our literature search (after we removed duplicates), which we further screened. We selected 60 abstracts for full‐text review, and four trials (six articles) met the inclusion criteria (Figure 1). Two trials reported the outcomes of pneumonia, diarrhoea, and any hospital admissions (Alonso 2011; Manaseki‐Holland 2012); for Alonso 2011, we sought detailed data on infections from the trial authors. All four included trials reported mean serum vitamin D concentrations (Greer 1981; Greer 1989; Alonso 2011; Manaseki‐Holland 2012). We did not find any studies that evaluated either tuberculosis (TB) or malaria as outcomes.
Included studies
We have presented essential information about the included trials in the 'Characteristics of included studies' table. We obtained the data on infections from the Alonso 2011 trial from the trial authors.
Greer 1981 was conducted in a single, private paediatric practice in Cincinnati, Ohio (USA) where the standard procedure was not to give breast‐fed babies vitamin D. It was a randomized double‐blind prospective trial. The trial included 18 healthy, term, exclusively breast‐fed infants and randomly divided participants into two groups. One group (N = 9) received a daily placebo of propylene glycol and the other group (N = 9) received vitamin D 400 IU/d till 12 weeks of age. The dose was in accordance with the IOM recommendations (400 IU/d). The proportion of season‐adjusted vitamin D deficiency/inadequacy in this population is reported to be 10% among male and 12% among female children during 2001 to 2006 (Looker 2011).
Greer 1989 was conducted in a private paediatric practice in Madison, Wisconsin (USA) where all mothers were planning to exclusively breast‐feed their babies for the first six months of life. It was a randomized double‐blind prospective trial. The trial included 46 healthy, term, breast‐fed white infants and randomly divided participants into two groups. One group (N = 24) received a daily placebo of propylene glycol and the other group (N = 22) received vitamin D 400 IU/d until six months of age. The dose was in accordance with the IOM recommendations (400 IU/d). The proportion of season‐adjusted vitamin D deficiency/inadequacy in this population is reported to be 10% among male and 12% among female children during 2001 to 2006 (Looker 2011).
Alonso 2011 was conducted in 11 primary healthcare centres of a community in northern Spain. The participants included healthy term infants presenting for a routine health visit in the first 15 days of life. The intervention group included 48 infants who were administered vitamin D 402 IU/day, while the control group comprised of 54 infants who did not receive either vitamin D or placebo. The trial excluded seven infants from each group before the start of the trial, with a final sample of 88 infants (intervention = 41, control = 47). There were 52.3% male participants; the follow‐up period was 12 months. The dose given was in accordance with the IOM recommendations (400 IU/d). The trial authors did not report the outcomes of incidence of pneumonia and diarrhoea in the published paper and we obtained unpublished data from the contact author Dr Maruchi Alonso. We have presented this data in Appendix 2. The proportion of vitamin D deficiency in the paediatric population in Italy with the same latitude as Spain is reported to be 6.2% (Lippi 2007).
Manaseki‐Holland 2012 was conducted in Kabul, Afghanistan, within the catchment area of a teaching hospital serving an inner‐city population. The participants included infants aged one to 11 months, with 1524 randomized to the intervention group and 1522 to placebo controls. The intervention group received quarterly oral 100,000 IU vitamin D3 supplementation versus placebo in the comparison group; the follow‐up period was 18 months. There were 52.2% male participants, and 42.4% were under six months of age. The frequency of supplementation ranged from a single dose to six doses during the follow‐up period. The dose given represented upper level of intake (1000 to 2500 IU/d) because most children were vitamin D‐deficient at baseline. The proportion of vitamin D deficiency in this paediatric population is reported to be 73.1% (Manaseki‐Holland 2008).
Excluded studies
We excluded 54 studies that did not meet our inclusion criteria. We provided further details in the 'Characteristics of excluded studies' table.
Risk of bias in included studies
All the included trials were individually randomized controlled trials (RCTs). Figure 2 and Figure 3 provide a graphical summary of the 'Risk of bias' assessments for the included trials.

'Risk of bias' graph: review authors' judgements about each 'Risk of bias' item presented as percentages across all included trials.

'Risk of bias' summary: review authors' judgements about each 'Risk of bias' item for each included trial.
Allocation
Alonso 2011 and Manaseki‐Holland 2012 were at low risk of bias for randomization as the trial used methods for random sequence generation and allocation concealment that were adequate. The randomization process in Greer 1981 and Greer 1989 was through random number tables by the pharmacist after the trial authors called in (obtained from communication with the trial authors) and so were at low risk for this bias; however, the trial authors did not describe the procedures for allocation concealment, which resulted in the judgements of unclear risk.
Blinding
Alonso 2011 was unblinded to participants and personnel and hence we rated it at high risk of bias; while the risk was unclear for the blinding of outcome assessment since it did not provide any information. Greer 1981, Greer 1989, and Manaseki‐Holland 2012 were at low risk of bias since the treatment was masked from participants and personnel and the outcome assessors were also blinded.
Incomplete outcome data
Alonso 2011 was at high risk of attrition bias since it had a high loss to follow‐up rate in the intervention group (26.8%) compared to the control group (8.5%) and the trial authors did not give the distribution of reasons for drop out in each group. Manaseki‐Holland 2012 was also at high risk of attrition bias since the attrition rate was approximately 30% in each group and the trial authors did not report the reasons for loss to follow‐up in the published paper. Greer 1981 and Greer 1989 were at low risk of attrition bias. In Greer 1981 there was no loss to follow‐up, while although in Greer 1989 the attrition rates were approximately 10% to 20%, the reasons for loss to follow‐up were similarly distributed between the two groups.
Selective reporting
The protocols were unavailable for any of the included trials, however Alonso 2011 did not report any of the infection outcomes in the published paper. Furthermore, the methods section mentioned outcomes such as child's body weight, length, and head circumference that the trial authors did not further discuss in the results section. The protocols of the Greer 1981, Greer 1989, and Manaseki‐Holland 2012 were unavailable but based on the 'methods' section of these articles, it seems the trial authors reported all expected pre‐specified outcomes.
Other potential sources of bias
Greer 1981 and Greer 1989 did not adequately describe the allocation concealment process, with a slight possibility of confounding and selection bias at baseline.
Effects of interventions
Primary outcomes
Primary outcomes for our review included incidence rates of pneumonia and TB. Two trials reported incidence rates of pneumonia (Alonso 2011; Manaseki‐Holland 2012); while none reported incidence rate of TB. Since Manaseki‐Holland 2012 reported first and repeat episodes of pneumonia separately and we could not access data on overall person‐time of the children followed in the two groups, we therefore report this outcome as first and repeat episodes of pneumonia.
Incidence rate of first or only episode of pneumonia
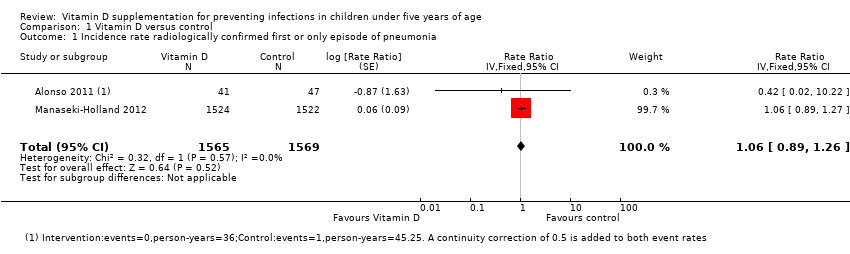
Two trials reported incidence rate of first or only episode of pneumonia confirmed by chest radiograph (Alonso 2011; Manaseki‐Holland 2012). One trial reported confirmed or unconfirmed pneumonia (Manaseki‐Holland 2012). Moderate quality evidence showed that there was no effect of vitamin D supplementation on the incidence of first or only episode of pneumonia confirmed by chest radiograph (rate ratio (RR) 1.06, 95% confidence interval (CI) 0.89 to 1.26; 3134 participants, two trials, moderate quality evidence; Analysis 1.1; Figure 4). The result was similar for confirmed or unconfirmed pneumonia (RR 0.95, 95% CI: 0.87 to 1.04; 3046 participants, one trial) (Manaseki‐Holland 2012).
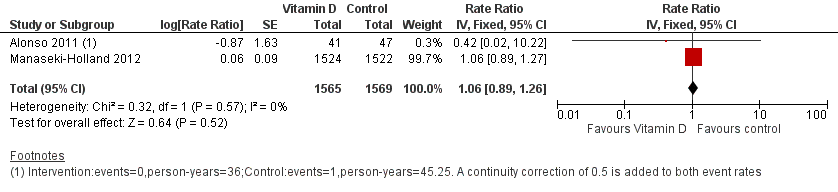
Forest plot of comparison: 1 Vitamin D versus control, outcome: 1.1 Incidence rate radiologically confirmed first or only episode of pneumonia.
Incidence rate of repeat episodes of pneumonia
One large trial from Afghanistan reported incidence rate of repeat episodes of pneumonia (Manaseki‐Holland 2012). There was a significant increase in repeat episodes pneumonia confirmed by chest radiograph (RR 1.69, 95% CI 1.28 to 2.21; 3046 participants, one trial), but not reflected in the outcome of confirmed or unconfirmed pneumonia (RR 1.06, 95% CI 1.00 to 1.13; 3046 participants; one trial).
Secondary outcomes
We reported the incidence rate of diarrhoea separately as first and repeat episodes of diarrhoea, since Manaseki‐Holland 2012 reported it separately and we could not access data on overall person‐time of the children followed in the two groups.
Incidence rate of first or only episode of diarrhoea
Two trials reported incidence rate of first or only episode of diarrhoea (Alonso 2011; Manaseki‐Holland 2012); however, we could not perform a meta‐analysis since Alonso 2011 reported rate ratios while Manaseki‐Holland 2012 reported hazard ratios (HR). The incidence of first or only episode of diarrhoea was similar in the supplemented and unsupplemented children in both trials (RR 0.14, 95% CI 0.01 to 2.59; 88 participants, Alonso 2011; and HR 1.02, 95% CI 0.95 to 1.11; 3046 participants, Manaseki‐Holland 2012).
Incidence rate of repeat episodes of diarrhoea
One trial reported the incidence of repeat episodes of diarrhoea (Manaseki‐Holland 2012). There was no effect of vitamin D supplementation on the repeat episodes of diarrhoea (HR 1.05, 95% CI 0.98 to 1.17; 3046 participants, one trial).
All‐cause mortality
One large trial from Afghanistan reported all‐cause mortality (Manaseki‐Holland 2012). Due to the low quality evidence from this trial and few events resulting in an underpowered outcome, we do not know whether vitamin D supplementation impacts on all‐cause mortality (RR 1.43, 95% CI 0.54 to 3.74; 3046 participants, one trial; Analysis 1.2; Figure 5). The risk difference showed no excess deaths in the supplementation group compared to the control group (risk difference 0.00, 95% CI −0.00 to 0.01; 3046 participants, one trial).

Forest plot of comparison: 1 Vitamin D versus control, outcome: 1.2 All‐cause mortality.
Cause‐specific mortality
The same large trial in Afghanistan, Manaseki‐Holland 2012, reported no significant difference in pneumonia and septicaemia cause‐specific mortality between the supplemented and the control groups (RR 1.50, 95% CI 0.42 to 5.30; 3046 participants, one trial. There was no reported cause‐specific mortality in either group in the Alonso 2011 trial.
Hospital admissions
Two trials reported that vitamin D supplementation did not affect any hospital admissions (Alonso 2011; Manaseki‐Holland 2012). Numeric data was unavailable from Manaseki‐Holland 2012 (despite contact with the trial authors). The estimates from Alonso 2011 trial did not detect a difference, but numbers were small (RR 0.86; 95% CI 0.20 to 3.62, 88 participants, one trial; very low quality evidence).
Mean serum vitamin D concentrations
Four trials reported mean serum vitamin D concentrations (Greer 1981; Greer 1989; Alonso 2011; Manaseki‐Holland 2012). At the end of supplementation period, mean concentrations of vitamin D were higher in the supplemented relative to unsupplemented children (mean difference (MD) 7.72 ng/mL, 95% CI 0.50 to 14.93; 266 participants, four trials; low quality evidence; Analysis 1.4; Figure 6). This was driven primarily by two smaller trials (Greer 1981; Greer 1989). In the larger two trials that also contributed to outcomes of pneumonia and mortality (Alonso 2011; Manaseki‐Holland 2012), vitamin D concentrations were higher in the intervention group at other time points but could not be sustained until the end of supplementation.This may be related to time elapsed at measurement (four months) from the last dose (Manaseki‐Holland 2012), or other reasons such as incomplete compliance or increased need of vitamin D with infant age (Alonso 2011). Baseline vitamin D concentrations were available for one out of four trials (MD 0.34 ng/mL, 95% CI −3.30 to 3.98; 46 participants, one trial; Analysis 1.5). We contacted the authors of the remaining three trials but either the baseline measurement was not done (Alonso 2011), was done one week after the first dose (Manaseki‐Holland 2012), or the trial was too old for trial authors to have the data (Greer 1981).

Forest plot of comparison: 1 Vitamin D versus control, outcome: 1.4 Mean serum vitamin D concentrations in ng/mL.
Adverse events
None of the included trials reported any adverse events of vitamin D supplementation. In Alonso 2011, one infant had vitamin D concentrations that were too high (almost 100 ng/mL) and supplementation was suspended. An abdominal ultrasound and a subsequent analytical control were performed, and were normal (personal communication with Alonso M). Two children in Manaseki‐Holland 2012 trial had toxic concentrations of vitamin D (150 ng/mL).
None of the included trials reported other prespecified secondary outcomes including incidence rates of TB, malaria, and febrile illness; duration of pneumonia; duration of diarrhoea; severity of infection; cause‐specific mortality (due to TB, diarrhoea, or malaria); and adverse events, such as hypercalcaemia or seizures.
Subgroup analyses
We did not find sufficient trials to conduct prespecified subgroup analyses or to explore heterogeneity.
Sensitivity analyses
We did not find sufficient trials to conduct prespecified sensitivity analyses.
Discussion
This systematic review evaluated the effects of vitamin D supplementation on preventing pneumonia, tuberculosis (TB), diarrhoea, and malaria in children under five years of age.
Summary of main results
In the large trial from Afghanistan, the incidence of first or only episode of pneumonia (both radiologically confirmed, and confirmed or unconfirmed) was similar in supplemented and unsupplemented children (Manaseki‐Holland 2012). None of the included trials reported the impact of vitamin D supplementation on incidence rate of TB. Among secondary outcomes, there was no effect of vitamin D supplementation on first and repeat episodes of diarrhoea, all‐cause mortality, cause specific mortality, and any hospital admissions. The mean vitamin D concentrations at the last follow‐up were higher in intervention compared to control groups in the meta‐analysis of four, driven by two smaller trials (Greer 1981; Greer 1989). In individual results of larger two trials (Alonso 2011; Manaseki‐Holland 2012), the concentrations in the intervention and control groups were similar at the last follow‐up, although levels were higher in intervention group at other time points during the trial. There were no adverse events reported in any of the included trials. None of the included trials reported other prespecified secondary outcomes, including incidence rates of malaria, incidence rates of febrile illness, duration of pneumonia, duration of diarrhoea, severity of infection, and cause‐specific mortality (due to TB, diarrhoea, and malaria).
Overall completeness and applicability of evidence
We found that there was no benefit of vitamin D supplementation in preventing either pneumonia or diarrhoea in children under five years. However, the included trials had limitations. Alonso 2011 had a very small sample size and may not have been adequately powered to detect small differences in outcome. This trial was conducted in a developed country among infants at lower risk of vitamin D deficiency. Manaseki‐Holland 2012 was a secondary analysis of a large trial conducted in Afghanistan; a population that has both a high prevalence of vitamin D deficiency and incidence of pneumonia. This trial was adequately powered with a larger sample size; however, it is only generalizable to similar settings. Greer 1981 and Greer 1989 were small trials and the allocation process in these trials was also not adequately described. Thus, the existing evidence of vitamin D supplementation among children on infectious diseases has limited applicability since we included only two trials in separate settings in the final analysis. The higher number of repeat episodes of pneumonia in the vitamin D supplementation group is counterintuitive and based on a single trial that is likely to be a chance finding (Manaseki‐Holland 2012). However, the need for further trials in areas with low vitamin D deficiency should be assessed based on other competing resources for research.
Quality of the evidence
We judged Greer 1981 and Greer 1989 as at unclear risk of bias for allocation concealment. However, these trials were of low risk of bias for random sequence generation, blinding, incomplete outcome, and selective reporting.
We considered the Alonso 2011 trial to be at 'high risk of bias' for blinding, incomplete outcome, and selective reporting. This trial did not use a placebo, and the participants, trial personnel, and outcome assessors were not blinded to the treatment assignment, thereby introducing possible differential misclassification of outcomes that could shift the rate ratios in either direction. Alonso 2011 did not report any of the infection‐related outcomes in the published paper.
Regarding the large trial from Afghanistan, Manaseki‐Holland 2012, we judged it to be at 'low risk of bias' for randomization, allocation concealment, blinding, and selective reporting. However, the trial had a high loss to follow‐up across all intervention groups. There was potential random misclassification of episodes of pneumonia, both confirmed or unconfirmed by chest radiographs, that could have attenuated the results towards the null (Manaseki‐Holland 2012).
For important outcomes we used the Grading of Recommendations Assessment, Development and Evaluation (GRADE) approach to assess the quality of the evidence. We rated the quality of the evidence for the 'incidence rate of radiologically confirmed first or only episode of pneumonia' as moderate quality ; while 'all‐cause mortality', 'cause‐specific mortality' and 'mean serum vitamin D concentrations' were low quality ; and 'any hospital admissions' were very low quality.
Potential biases in the review process
We believe that there were minimal potential biases in this review process. There was a systematic evaluation at all stages, including literature search screening, full‐text eligibility, and data extraction. Two review authors did this independently and resolved discrepancies by discussion among all the review authors. We modified a few points in the protocol post hoc (after the data extraction) in this review to incorporate all the outcomes mentioned in the included trials, for example, all‐cause mortality and cause‐specific mortality, but most outcomes remained those prespecified in the protocol.
Agreements and disagreements with other studies or reviews
A previous meta‐analysis that covered two different trials studied the preventive effect of vitamin D supplementation on respiratory tract infections in paediatric populations (Charan 2012). The review did not evaluate pneumonia as an outcome separately from other upper and lower respiratory tract infections, such as influenza. It included the Manaseki‐Holland 2010 trial that we excluded because participant children had pneumonia at baseline at the start of supplementation. We included the additional trials of Alonso 2011 and Manaseki‐Holland 2012 This meta‐analysis did not study other infections, such as TB, diarrhoea, or malaria. Mao 2013 also did a meta‐analysis on the role of vitamin D supplementation in preventing respiratory tract infections but included both paediatric and adult studies. They included only one trial, Manaseki‐Holland 2012, from among two trials on infections selected for our review. Multiple other reviews on vitamin D supplementation studied either high‐risk children with asthma or cystic fibrosis or reported outcomes other than infections such as bone mineral density or miscellaneous other outcomes (Ferguson 2009; Winzenberg 2010; Winzenberg 2011; Theodoratou 2014; Pojsupap 2015).
'Risk of bias' graph: review authors' judgements about each 'Risk of bias' item presented as percentages across all included trials.
'Risk of bias' summary: review authors' judgements about each 'Risk of bias' item for each included trial.
Forest plot of comparison: 1 Vitamin D versus control, outcome: 1.1 Incidence rate radiologically confirmed first or only episode of pneumonia.
Forest plot of comparison: 1 Vitamin D versus control, outcome: 1.2 All‐cause mortality.
Forest plot of comparison: 1 Vitamin D versus control, outcome: 1.4 Mean serum vitamin D concentrations in ng/mL.
Comparison 1 Vitamin D versus control, Outcome 1 Incidence rate radiologically confirmed first or only episode of pneumonia.

Comparison 1 Vitamin D versus control, Outcome 2 All‐cause mortality.

Comparison 1 Vitamin D versus control, Outcome 3 Any hospital admission.

Comparison 1 Vitamin D versus control, Outcome 4 End of supplementation mean serum vitamin D concentrations in ng/mL.

Comparison 1 Vitamin D versus control, Outcome 5 Baseline mean serum vitamin D concentrations in ng/mL.
| Vitamin D versus control for preventing infections in children under five years of age | |||||
| Patient or population: children under five years of age Control: placebo or no supplementation | |||||
| Outcomes | Illustrative comparative risks* (95% CI) | Relative/absolute effect | Number of participants | Quality of the evidence | |
| Assumed risk | Corresponding risk | ||||
| Control | Vitamin D | ||||
| All‐cause mortality | 5 per 1000 | 7 per 1000 | Risk ratio 1.43 | 3046 (1) | ⊕⊕⊝⊝ |
| Cause‐specific mortality | 3 per 1000 | 5 per 1000 (1 to 16) | Risk ratio 1.50 | 3046 (1) | ⊕⊕⊝⊝ |
| Incidence rate radiologically confirmed first or only episode of pneumonia | 157 episodes per 1000 person‐years | 166 episodes per 1000 person years | Rate ratio 1.06 | 3134 | ⊕⊕⊕⊝ |
| Any hospital admission | 9 per 100 | 8 per 100 (2 to 33`) | Risk ratio 0.86 (0.20 to 3.62) | 88 (1) | ⊕⊝⊝⊝ |
| TB cases | ‐ | ‐ | ‐ | 0 studies | ‐ |
| Diarrhoea cases | ‐ | ‐ | ‐ | 2 studies7 | ‐ |
| Malaria cases | ‐ | ‐ | ‐ | 0 studies | ‐ |
| Febrile illness | ‐ | ‐ | ‐ | 0 studies | ‐ |
| Mean serum vitamin D concentrations | 141 | 125 | Mean difference 7.72ng/mL higher (0.50 higher to 14.93 higher) | 266 (4) | ⊕⊕⊝⊝ |
| *The basis for the assumed risk (e.g. the median control group risk across studies) is provided in footnotes. The corresponding risk (and its 95% CI) is based on the assumed risk in the comparison group and the relative effect of the intervention (and its 95% CI). | |||||
| GRADE Working Group grades of evidence | |||||
| 1Downgraded by 1 for imprecision: the estimate varies from 46% decrease to over 3‐fold increase for all‐cause mortality; and from 58% decrease to over 5‐fold increase for cause‐specific mortality. | |||||
| Outcome or subgroup title | No. of studies | No. of participants | Statistical method | Effect size |
| 1 Incidence rate radiologically confirmed first or only episode of pneumonia Show forest plot | 2 | 3134 | Rate Ratio (Fixed, 95% CI) | 1.06 [0.89, 1.26] |
| 2 All‐cause mortality Show forest plot | 1 | Risk Ratio (M‐H, Fixed, 95% CI) | Subtotals only | |
| 3 Any hospital admission Show forest plot | 1 | 88 | Risk Ratio (M‐H, Fixed, 95% CI) | 0.86 [0.20, 3.62] |
| 4 End of supplementation mean serum vitamin D concentrations in ng/mL Show forest plot | 4 | 266 | Mean Difference (IV, Random, 95% CI) | 7.72 [0.50, 14.93] |
| 5 Baseline mean serum vitamin D concentrations in ng/mL Show forest plot | 1 | 46 | Mean Difference (IV, Fixed, 95% CI) | 0.34 [‐3.30, 3.98] |