Recuento plaquetario, longitud del bazo y cociente recuento plaquetario/longitud del bazo para el diagnóstico de las várices esofágicas en pacientes con hepatopatías crónicas o trombosis de la vena portal
Información
- DOI:
- https://doi.org/10.1002/14651858.CD008759.pub2Copiar DOI

- Base de datos:
-
- Cochrane Database of Systematic Reviews
- Versión publicada:
-
- 26 abril 2017see what's new
- Tipo:
-
- Diagnostic
- Etapa:
-
- Review
- Grupo Editorial Cochrane:
-
Grupo Cochrane de Hepatobiliar
- Copyright:
-
- Copyright © 2017 The Cochrane Collaboration. Published by John Wiley & Sons, Ltd.
Cifras del artículo
Altmetric:
Citado por:
Autores
Contributions of authors
AC: completed the search for studies, performed data extraction and quality assessment, drafted parts of the review, provided methodological and statistical analyses and expert hepatology opinion, and reviewed the final version of the manuscript.
JCG: formulated the research question, searched the articles, performed data extraction and quality assessment, drafted the manuscript, and reviewed the final version of the manuscript.
JY: searched for articles, performed data extraction and quality assessment, and reviewed the final version of the manuscript.
TAW: implemented search strategies, and reviewed the final version of the manuscript.
NR: searched for articles and reviewed the final version of the manuscript.
SL: formulated the research question, provided hepatology expert opinion, drafted the manuscript, and reviewed the final version of the manuscript.
GC: completed the search for studies, performed data extraction and quality assessment, drafted parts of the manuscript, conducted statistical analyses, provided methodological expertise, and reviewed the final version of the manuscript.
Sources of support
Internal sources
-
No sources of support supplied
External sources
-
Canadian Institutes of Health Research (CIHR), Canada.
Synthesis Grant: Knowledge Translation, 2008
-
Canadian Association for the Study of the Liver, Canada.
CASL/Schering Victor Feinman Fellowship for the period of one year (2007), for Dr. Juan Cristobal Gana
Declarations of interest
None known.
Acknowledgements
Dimitrinka Nikolova for continuous help during the review process.
Sarah Louise Klingenberg for assistance with the search strategy.
Contact Editor: Gennaro D'Amico, Italy.
Sign‐off Editor: Christian Gluud, Denmark.
Cochrane Review Group funding acknowledgement: The Danish State is the largest single funder of the Cochrane Hepato‐Biliary Group through its investment in the Copenhagen Trial Unit, Centre for Clinical Intervention Research, Rigshospitalet, Copenhagen University Hospital, Denmark. Disclaimer: The views and opinions expressed in this review are those of the review authors and do not necessarily reflect those of the Danish State or the Copenhagen Trial Unit.
Version history
| Published | Title | Stage | Authors | Version |
| 2017 Apr 26 | Platelet count, spleen length, and platelet count‐to‐spleen length ratio for the diagnosis of oesophageal varices in people with chronic liver disease or portal vein thrombosis | Review | Agostino Colli, Juan Cristóbal Gana, Jason Yap, Thomasin Adams‐Webber, Natalie Rashkovan, Simon C Ling, Giovanni Casazza | |
| 2010 Oct 06 | Platelet count, spleen length, and platelet count/spleen length ratio for the diagnosis of oesophageal varices in patients with chronic liver disease or portal vein thrombosis | Protocol | Juan Cristobal Gana, Dan Turner, Jason Yap, Thomasin Adams‐Webber, Natalie Rashkovan, Simon C Ling | |
Differences between protocol and review
At the review stage, we decided to analyse paediatric and adult patients separately, as we found only studies enrolling only adult people or only paediatric patients. Furthermore, transitivity of results to children is unknown.
Analyses of sources of heterogeneity were added as secondary objectives, in accordance with recommendations provided in the Cochrane Handbook for Diagnostic Test of Accuracy Reviews.
The QUADAS‐2 tool was used instead of the original QUADAS tool.
Keywords
MeSH
Medical Subject Headings (MeSH) Keywords
- Chronic Disease;
- *Duodenoscopy;
- Esophageal and Gastric Varices [blood, *diagnosis, pathology];
- Hepatitis C, Chronic [complications];
- Liver Diseases [*complications];
- Organ Size;
- *Platelet Count;
- *Portal Vein;
- Randomized Controlled Trials as Topic;
- Sensitivity and Specificity;
- Spleen [*anatomy & histology];
- Triage;
- Venous Thrombosis [*complications];
Medical Subject Headings Check Words
Adult; Child; Humans;

Study flow diagram.

Methodological quality of the 71 included studies.

Quality assessment summary: review authors' judgements about each risk of bias item for each included study.
Not all of the included studies considered all three index tests. Cells are empty when an index test was not considered in a study.

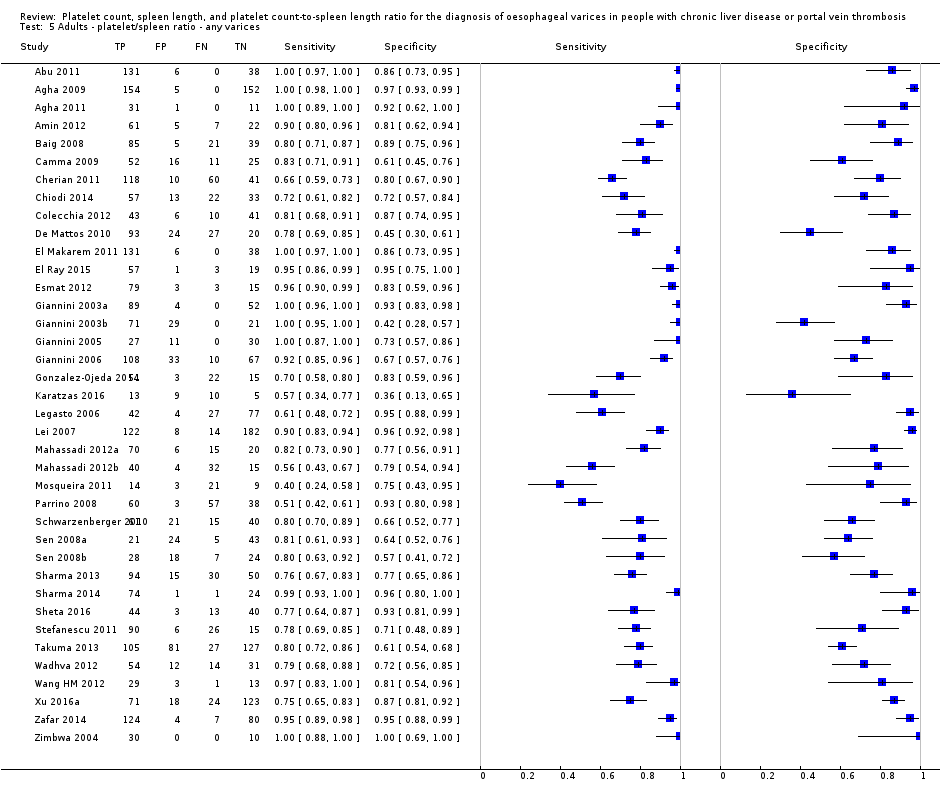
Forest plot. Adult participants ‐ platelet count ‐ any varices.

Forest plots. Adult participants ‐ platetelet count ‐ various cut‐off values ‐ any varices.

Studies in the ROC space. Adult participants ‐ platelet count ‐ various cut‐off values ‐ any varices.

Forest plot. Adult participants ‐ spleen length ‐ any varices.

Forest plots. Adult participants ‐ spleen length ‐ any varices: various cut‐off values.

Studies in the ROC space. Adult participants ‐ spleen length ‐ any varices: various cut‐off values.
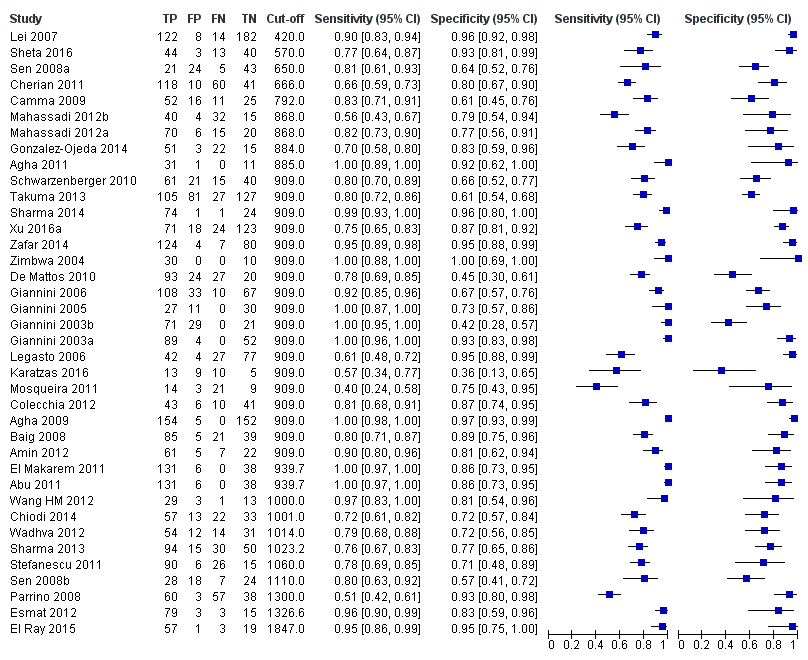
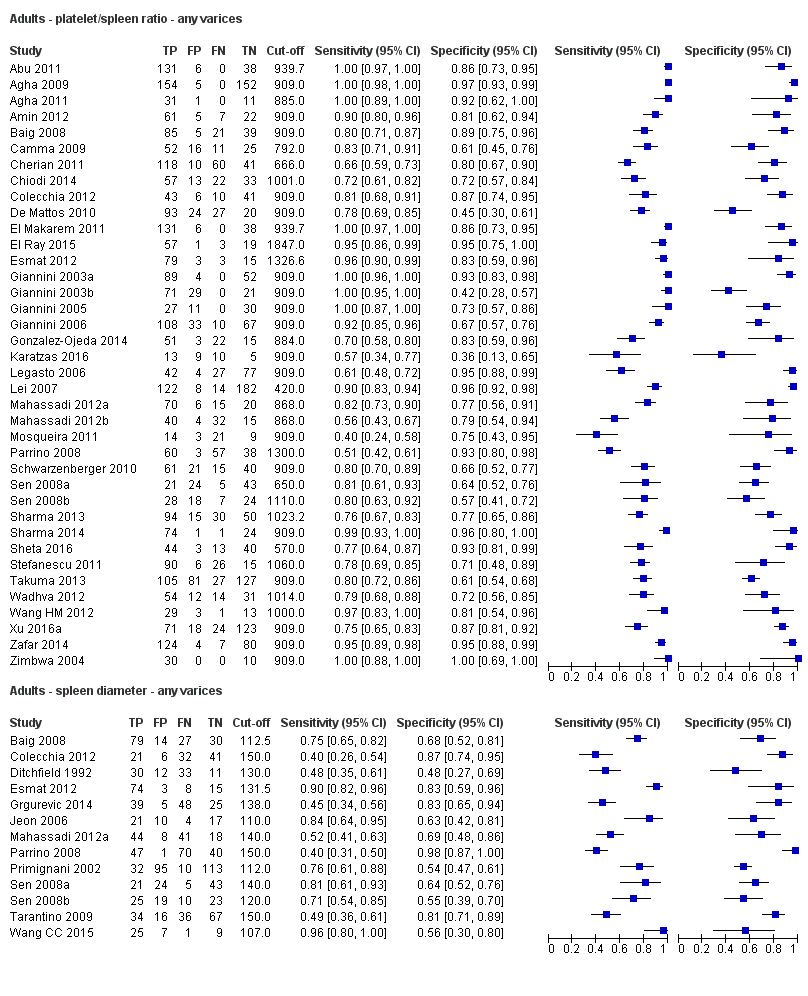
Forest plot. Adult participants ‐ platelet count‐to‐spleen length ratio ‐ any varices.

Studies in the ROC space. Adult participants ‐ platelet count‐to‐spleen length ratio. Only studies with a cut‐off value of 909 (n/mm3)/mm ‐ any varices.

Indirect comparison. Forest plot. Adult participants ‐ platelet count compared with spleen length ‐ any varices.

Forest plot. Indirect comparison. Adult participants ‐ platelet count (cut‐off around 150,000) compared with spleen length (cut‐off around 110 mm) ‐ any varices.
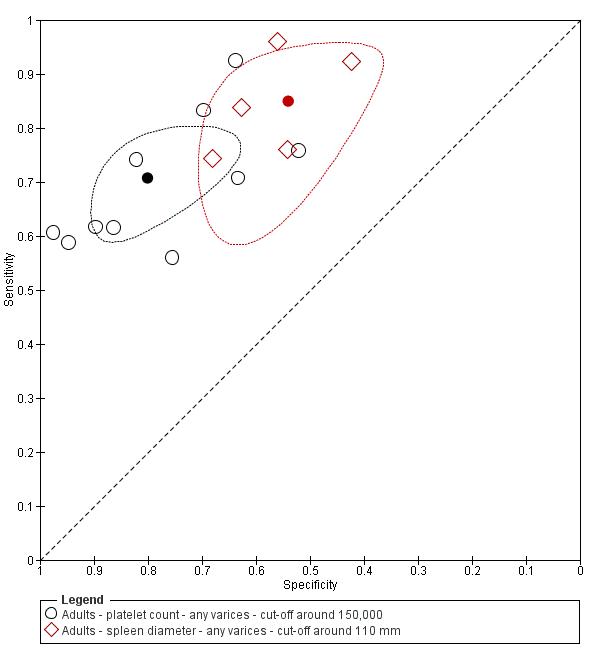
Indirect comparison. Studies in the ROC space. Adult participants ‐ platelet count (cut‐off around 150,000) compared with spleen length (cut‐off around 110 mm) ‐ any varices.
Indirect comparison. Forest plots. Adult participants ‐ platelet count compared with platelet count‐to‐spleen length ratio ‐ any varices.
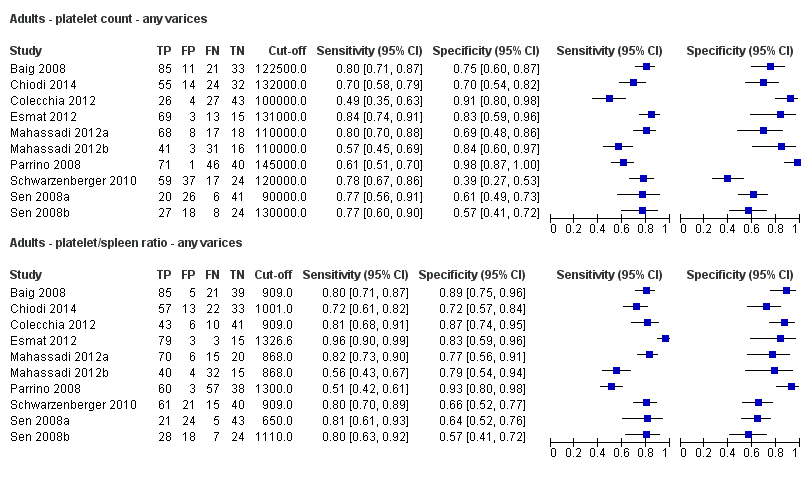
Direct comparison. Forest plots. Adult participants ‐ platelet count compared with platelet count‐to‐spleen length ratio ‐ any varices.

Indirect comparison. Forest plots. Adult participants ‐ platelet count (cut‐off around 150.000/mm3) compared with platelet count‐to‐spleen length ratio (cut‐off 909 (n/mm3)/mm) ‐ any varices.

Indirect comparison. Studies in the ROC space. Adult participants ‐ platelet count (cut‐off around 150.000) compared with platelet count‐to‐spleen length ratio (cut‐off 909 (n/mm3)/mm) ‐ any varices.
Indirect comparison. Forest plots. Adult participants ‐ platelet count‐to‐spleen length ratio compared with spleen length ‐ any varices.

Indirect comparison. Forest plots. Adult participants ‐ platelet count‐to‐spleen length ratio (cut‐off 909 (n/mm3)/mm) compared with spleen length (cut‐off around 110) ‐ any varices.

Indirect comparison. Studies in the ROC space. Adult participants ‐ platelet count‐to‐spleen length ratio (cut‐off 909 (n/mm3)/mm) compared with spleen length (cut‐off around 110 mm) ‐ any varices.

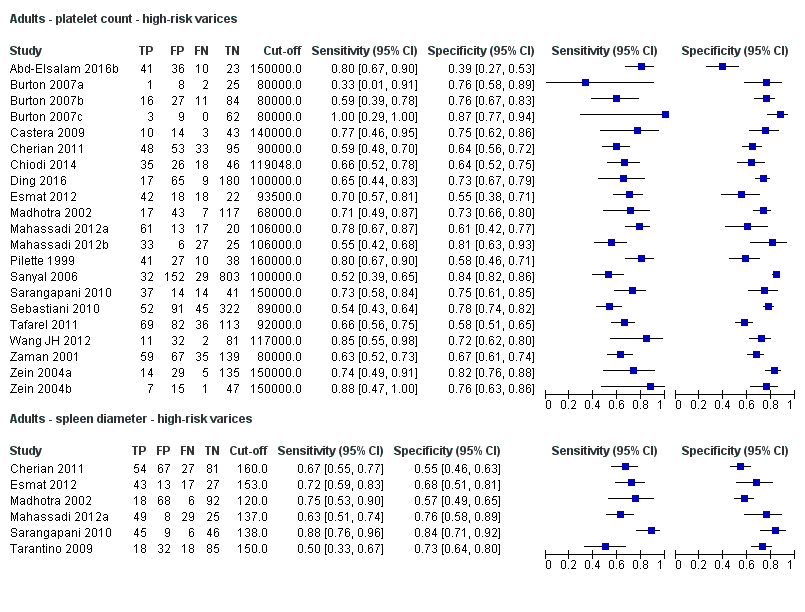
Forest plot. Adult participants ‐ platelet count ‐ high‐risk varices.
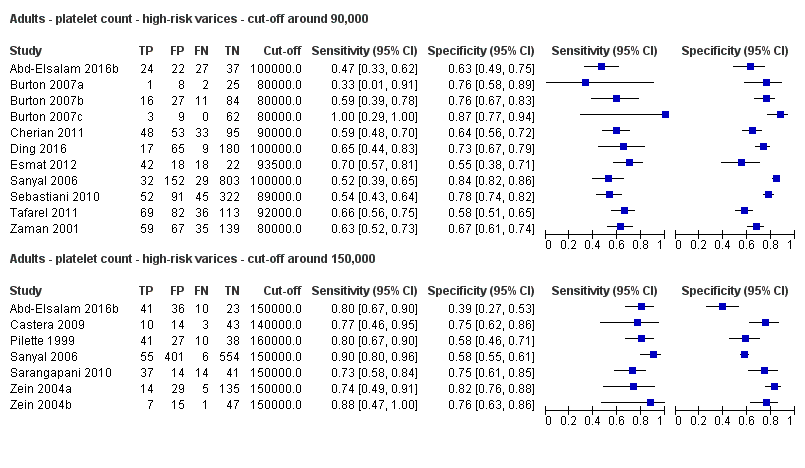
Forest plots. Adult participants ‐ platelet count ‐ various cut‐off values ‐ high‐risk varices.
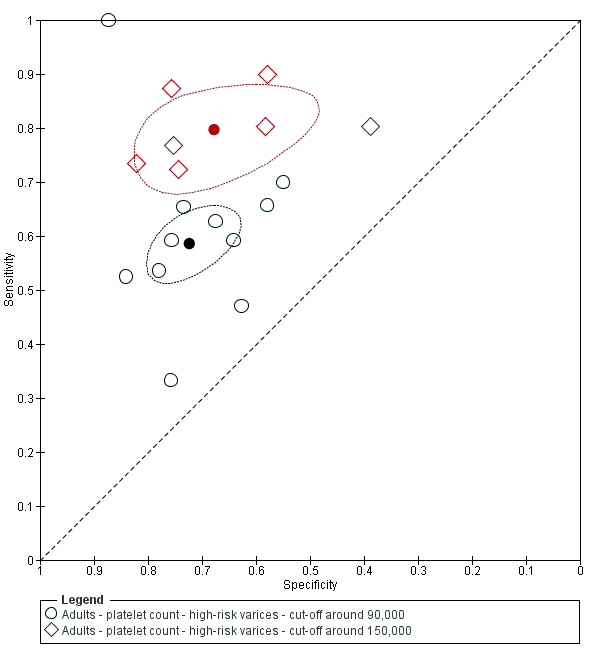
Studies in the ROC space. Adult participants ‐ platelet count ‐ various cut‐off values ‐ high‐risk varices.
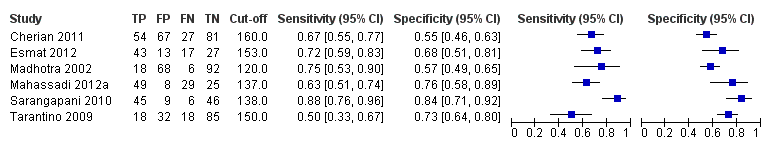
Forest plot. Adult participants ‐ spleen length ‐ high‐risk varices.

Forest plot. Adult participants ‐ platelet count‐to‐spleen length ratio ‐ high‐risk varices.
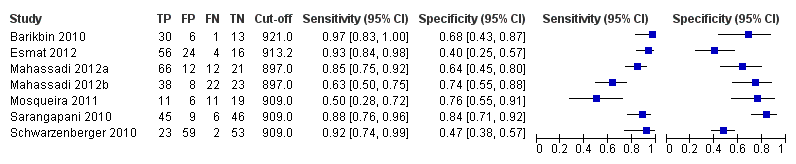
Forest plot. Adult participants ‐ platelet count‐to‐spleen length ratio ‐ cut‐off around 909 (n/mm3)/mm ‐ high‐risk varices.

Studies in the ROC space. Adult participants ‐ platelet count‐to‐spleen length ratio ‐ cut‐off around 909 (n/mm3)/mm ‐ high‐risk varices.
Indirect comparison. Forest plot. Adult participants ‐ platelet count compared with spleen length ‐ high‐risk varices.

Indirect comparison. Forest plots. Adult participants ‐ platelet count compared with platelet count‐to‐spleen length ratio ‐ high‐risk varices.

Direct comparison. Forest plots. Adult participants ‐ platelet count compared with platelet count‐to‐spleen length ratio ‐ high‐risk varices.

Indirect comparison. Forest plots. Adult participants ‐ platelet count (cut‐off around 150.000/mm3) compared with platelet count‐to‐spleen length ratio (cut‐off 909 (n/mm3)/mm) ‐ high‐risk varices.

Indirect comparison. Studies in the ROC space. Adult participants ‐ platelet count (cut‐off around 150,000/mm3) compared with platelet count‐to‐spleen length ratio (cut‐off 909 (n/mm3)/mm) ‐ high‐risk varices.

Indirect comparison. Forest plots. Adult participants ‐ platelet count‐to‐spleen length ratio compared with spleen length ‐ high‐risk varices.
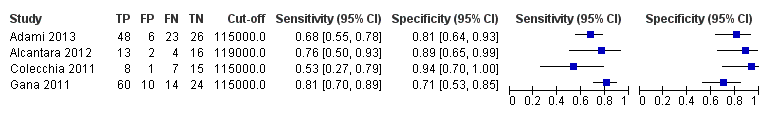
Forest plot. Paediatric participants ‐ platelet count ‐ any varices.

Forest plot. Paediatric participants ‐ platelet count‐to‐spleen length z‐score ratio ‐ any varices.

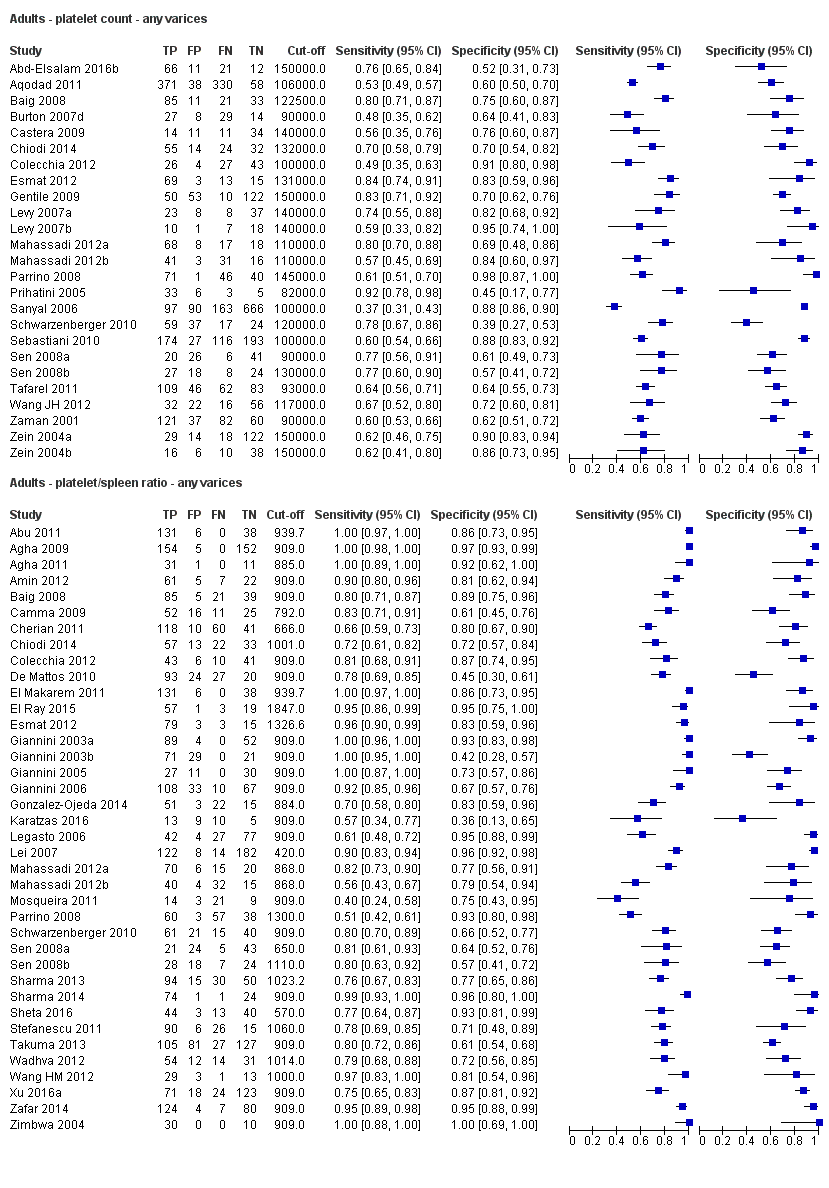
Adults ‐ platelet count ‐ any varices.

Adults ‐ platelet count ‐ any varices ‐ cut‐off around 100,000.

Adults ‐ platelet count ‐ any varices ‐ cut‐off around 120,000.

Adults ‐ platelet count ‐ any varices ‐ cut‐off around 150,000.
Adults ‐ platelet/spleen ratio ‐ any varices.

Adults ‐ platelet/spleen ratio ‐ any varices ‐ cut‐off 909.

Adults ‐ spleen diameter ‐ any varices.

Adults ‐ spleen diameter ‐ any varices ‐ cut‐off around 110 mm.

Adults ‐ spleen diameter ‐ any varices ‐ cut‐off around 150 mm.
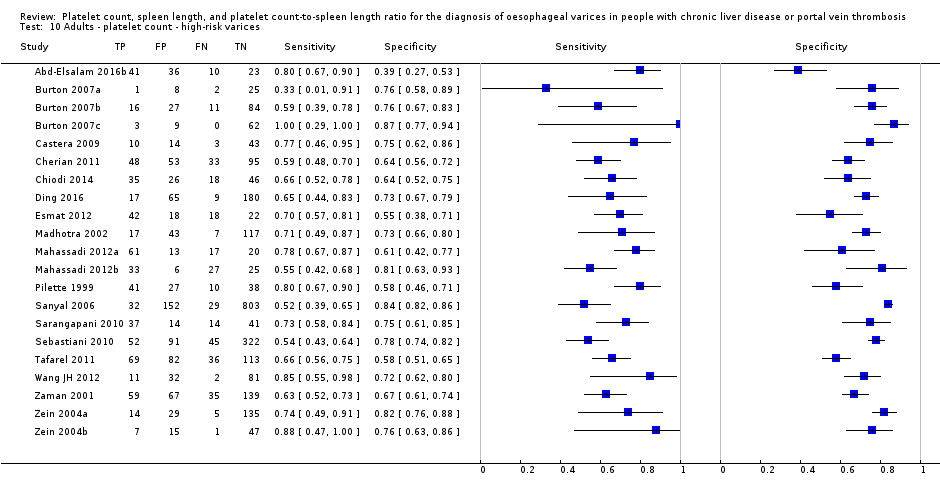
Adults ‐ platelet count ‐ high‐risk varices.

Adults ‐ platelet count ‐ high‐risk varices ‐ cut‐off around 90,000.

Adults ‐ platelet count ‐ high‐risk varices ‐ cut‐off around 150,000.

Adults ‐ platelet/spleen ratio ‐ high‐risk varices.
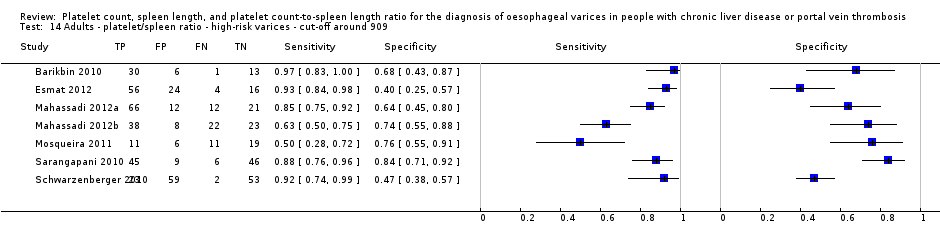
Adults ‐ platelet/spleen ratio ‐ high‐risk varices ‐ cut‐off around 909.
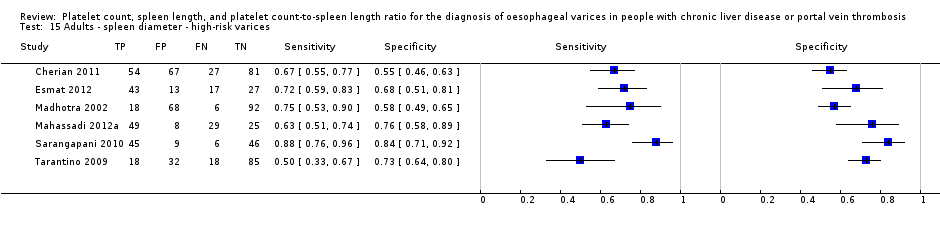
Adults ‐ spleen diameter ‐ high‐risk varices.

Paediatrics ‐ platelet count ‐ any varices.

Paediatrics ‐ platelet/spleen ratio z‐score ‐ any varices.
| Review question | What is the diagnostic accuracy of platelet count for the diagnosis of oesophageal varices in adults with liver disease or portal vein thrombosis? | |||||
| Population | Adults with diagnosis of chronic liver disease or portal vein thrombosis. Age ≥ 18 years | |||||
| Settings | Outpatients and inpatients in secondary/tertiary care setting | |||||
| Study design | Prospective and retrospective cross‐sectional studies. No case‐control studies were found | |||||
| Index tests | Platelet count | |||||
| Reference standards | Upper endoscopy | |||||
| Target condition | Summary accuracy (95% CI) | No. of participants (studies) | Prevalence, Median (range ) | Implications in a hypothetical cohort of 1000 people | Post‐test probability | Quality and comments |
| Any varices Cut‐off value: around 150,000 /mm3 (range 140,000 to 150,000/mm3) | Sensitivity 0.71 (0.63 to 0.77) Specificity 0.80 (0.69 to 0.88) LR+ 3.6 LR‐ 0.37 | 2054 participants (10) | 38% | With a prevalence of 38%, 380 out of 1000 people will have varices of any size. Of these 380 people, 110 (29% of 380) people with varices will receive misdiagnosis and will not received appropriate prophylaxis or follow‐up The remaining 620 people will have no varices. 124 people (20% of 620) will receive false diagnosis of varices and will undergo an unnecessary endoscopy | Assuming a pretest probability of 38% Post‐test probabilities:
| Most studies are at high risk of bias No predefinition of cut‐off value of the index test for most studies Median prevalence of any varices is lower than that reported by most guidelines (around 50%) . |
| High risk varices Cut‐off value: around 150,000 /mm3 (range 140,000 to 160,000/mm3) | Sensitivity 0.80 (0.73 to 0.85) Specificity 0.68 (0.57 to 0.77) LR+ 2.5 LR‐ 0.30 | 1671 participants (7) | 20% | With a prevalence of 20%, 200 out of 1000 people will have varices at high risk of bleeding. Of these 200 people, 40 (20% of 200) people with high‐risk varices will receive misdiagnosis and will not receive effective prophylaxis The remaining 800 people will not have high‐risk varices. 256 people (32% of 800) will receive false diagnosis of high‐risk varices and will undergo an unnecessary endoscopy | Assuming a pretest probability of 20% Post‐test probabilities:
| Most or all studies at high risk of bias No predefinition of cut‐off value of the index test for most studies |
| Review question | What is the diagnostic accuracy of spleen length for the diagnosis of oesophageal varices in adult people with liver disease or portal vein thrombosis? | |||||
| Population | Adults with diagnosis of chronic liver disease or portal vein thrombosis. Age ≥ 18 years | |||||
| Settings | Outpatients and inpatients in secondary/tertiary care setting | |||||
| Study design | Prospective and retrospective cross‐sectional studies. No case‐control studies were found | |||||
| Index tests | Spleen length | |||||
| Reference standards | Upper endoscopy | |||||
| Target condition | Summary accuracy (95% CI) | No. of participants (studies) | Prevalence, Median (range ) | Implications in a hypothetical cohort of 1000 people | Post‐test probability | Quality and comments |
| Any varices Cut‐off value: around 110 mm (range 110 to 112.5 mm) | Sensitivity 0.85 (0.75 to 0.91) Specificity 0.54 (0.46 to 0.62) LR+ 1.8 (1.6 to 1.21) LR‐ 0.28 (0.17 to 0.44) | 594 participants (5) | 53% | With a prevalence of 53%, 530 out of 1000 people will have varices of any size. Of these 530 people, 80 (15% of 530) people with varices will receive misdiagnosis and will not receive appropriate prophylaxis or follow‐up The remaining 470 people will have no varices. 216 people (46% of 470) will receive false diagnosis of varices and will undergo an unnecessary endoscopy | Assuming a pretest probability of 53% Post‐test probabilities:
| Most or all studies at high risk of bias |
| High‐risk varices Cut‐off value: no common cut‐off value. Range 120 to 160 mm | Sensitivity ranged from 0.50 to 0.88 and specificity from 0.55 to 0.84 | 883 participants (6) | 42% | Inconsistency of results (no common cut‐off value) prevents any conclusions . | Most or all studies at high risk of bias | |
| What is the diagnostic accuracy of platelet count‐to‐spleen length ratio? | ||||||
| Review question | What is the diagnostic accuracy of platelet count‐to‐spleen length ratio for the diagnosis of oesophageal varices in adult people with liver disease or portal vein thrombosis? | |||||
| Population | Adults with diagnosis of chronic liver disease or portal vein thrombosis. Age ≥ 18 years | |||||
| Settings | Outpatients and inpatients in secondary/tertiary care setting | |||||
| Study design | Prospective and retrospective cross‐sectional studies. No case‐control studies were found | |||||
| Index tests | Platelet count‐to‐spleen length ratio | |||||
| Reference standards | Upper endoscopy | |||||
| Target condition | Summary accuracy | No. of participants (studies) | Prevalence, Median (range ) | Implications in a hypothetical cohort of 1000 people | Post‐test probability | Quality and comments |
| Any varices Cut‐off value: 909 (n/mm3)/mm | Sensitivity 0.93 (0.93 to 0.87) Specificity 0.84 (0.75 to 0.91) LR+ 5.9 LR‐ 0.09 | 2637 participants (17) | 58% | With a prevalence of 58%, 580 out of 1000 people will have varices of any size. Of these 580 people, 41 (7% of 580) people with varices will receive misdiagnosis and will not receive appropriate prophylaxis or follow‐up The remaining 420 people will have no varices. 67 people (16% of 420) will receive false diagnosis of varices and will undergo an unnecessary endoscopy | Assuming a pretest probability of 58% Post‐test probabilities:
| Most studies are at high risk of bias |
| High‐risk varices Cut‐off value: around 909 (n/mm3)/mm (range 897 to 921 (n/mm3)/mm) | Sensitivity 0.85 (0.72 to 0.93) Specificity 0.66 (0.52 to 0.77) LR+ 2.5 LR‐ 0.22 | 642 participants (7) | 60% | With a prevalence of 60%, 600 out of 1000 people will have varices at high risk of bleeding. Of these 2600 people, 90 (15% of 600) people with high‐risk varices will receive misdiagnosis and will not receive effective prophylaxis The remaining 400 people will not have high‐risk varices. 136 people (34% of 400) will receive false diagnosis of high‐risk varices and will undergo an unnecessary endoscopy | Assuming a pre‐test probability of 60% Post‐test probabilities:
| Most studies are at high risk of bias Median prevalence of any varices is higher than that reported by most guidelines (around 25%) |
| What is the diagnostic accuracy of platelet count? | ||||||
| Review question | What is the diagnostic accuracy of platelet count for the diagnosis of oesophageal varices in paediatric people with liver disease or portal vein thrombosis? | |||||
| Population | Children with diagnosis of chronic liver disease or portal vein thrombosis. Age < 18 years | |||||
| Settings | Outpatients and inpatients in secondary/tertiary care setting | |||||
| Study design | Prospective and retrospective cross‐sectional studies. No case‐control studies were found | |||||
| Index tests | Platelet count | |||||
| Reference standards | Upper endoscopy | |||||
| Target condition | Summary accuracy | No. of participants (studies) | Prevalence, Median (range ) | Implications in a hypothetical cohort of 1000 people | Post‐test probability | Quality and comments |
| Any varices Cut‐off value: around 120,000 /mm3 (range 115,000 to 119,000/mm3) | Sensitivity 0.71 (0.60 to 0.80) Specificity 0.83 (0.70 to 0.91) LR+ 4.2 LR‐ 0.35 | 277 participants (4) | 58% | With a prevalence of 58%, 580 out of 1000 children will have varices of any size. Of these 580 children, 168 (29% of 580) children with varices will receive misdiagnosis and will not receive appropriate. prophylaxis or follow‐up The remaining 420 children will have no varices. 71 children (17% of 420) will receive false diagnosis of varices and will undergo an unnecessary endoscopy | Assuming a pretest probability of 58% Post‐test probabilities:
| Studies were at high risk of bias |
| What is the diagnostic accuracy of platelet count‐to‐spleen length ratio? | ||||||
| Review question | What is the diagnostic accuracy of platelet count‐to‐spleen length ratio for the diagnosis of oesophageal varices in paediatric people with liver disease or portal vein thrombosis? | |||||
| Population | Children with diagnosis of chronic liver disease or portal vein thrombosis. Age < 18 years | |||||
| Settings | Outpatients and inpatients in secondary/tertiary care setting | |||||
| Study design | Prospective and retrospective cross‐sectional studies. No case‐control studies were found | |||||
| Index tests | Platelet count‐to‐spleen length ratio | |||||
| Reference standards | Upper endoscopy | |||||
| Target condition | Summary accuracy (95% CI) | No. of participants (studies) | Prevalences | Implications in a hypothetical cohort of 1000 people | Post‐test probability | Quality and comments |
| Any varices Cut‐off value: around 1000 (n/mm3)/mm | Sensitivity 0.74 (0.65 to 0.81) Specificity 0.64 (0.36 to 0.85) LR+ 2.0 (1.0 to 4.0) LR‐ 0.41 (0.27 to 0.61) | 197 participants | 72% and 73% | With a prevalence of 50%, 500 out of 1000 children will have varices of any size. Of these 500 children, 130 (26% of 500) children with varices will receive misdiagnosis and will not receive appropriate prophylaxis or follow‐up The remaining 500 children will have no varices. 180 children (36% of 500) will receive false diagnosis of varices and will undergo an unnecessary endoscopy | Assuming a pretest probability of 50% Post‐test probabilities:
| Limited evidence. Only 2 studies were found. These 2 studies were at high risk of bias |
| Any varices ‐ indirect comparisons | |||||
| Index test | No. of studies | Cut‐off value | Sensitivity (95% CI) | Specificity (95% CI) | P value* |
| Platelet count | 10 | Around 150,000/mm3 | 0.71 (0.63 to 0.77) | 0.80 (0.69 to 0.88) | 0.252 |
| Platelet count‐to‐spleen length ratio | 17 | 909 (n/mm3)/mm | 0.93 (0.83 to 0.97) | 0.84 (0.75 to 0.91) | |
| Platelet count | 9 | Around 150,000/mm3 | 0.71 (0.63 to 0.77) | 0.80 (0.69 to 0.88) | 0.021 |
| Spleen length | 5 | Around 110 mm | 0.85 (0.75 to 0.91) | 0.54 (0.46 to 0.62) | |
| Platelet count‐to‐spleen length ratio | 17 | 909 (n/mm3)/mm | 0.93 (0.83 to 0.97) | 0.84 (0.75 to 0.91) | <0.001 |
| Spleen length | 5 | Around 110 mm | 0.85 (0.75 to 0.91) | 0.54 (0.46 to 0.62) | |
| * Pair‐wise comparisons between index tests performed by adding the index test as covariate to the bivariate model. P values were obtained by comparing the ‐2 log likelihood of the model with the covariate with the ‐2 log likelihood of the model without the covariate. | |||||
| Pooled results | |||||
| Cut‐off | Sensitivity (95% CI) | Specificity (95% CI) | LR+ (95% CI) | LR‐ (95% CI) | |
| Any varices | |||||
| Platelet count | Around 100,000 | 0.57 (0.50 to 0.64) | 0.75 (0.67 to 0.82) | 2.3 (1.7 to 3.1) | 0.57 (0.49 to 0.67) |
| Around 120,000 | 0.77 (0.72 to 0.81) | 0.69 (0.57 to 0.78) | 2.4 (1.7 to 3.5) | 0.34 (0.26 to 0.44) | |
| Around 150,000 | 0.71 (0.63 to 0.77) | 0.80 (0.69 to 0.88) | 3.6 (2.4 to 5.4) | 0.37 (0.30 to 0.45) | |
| Spleen length | Around 110 mm | 0.85 (0.75 to 0.91) | 0.54 (0.46 to 0.62) | 1.8 (1.6 to 2.1) | 0.28 (0.17 to 0.44) |
| Around 150 mm | 0.57 (0.41 to 0.71) | 0.82 (0.72 to 0.89) | 3.2 (2.3 to 4.4) | 0.53 (0.39 to 0.72) | |
| Platelet count‐to‐spleen length ratio | 909 (n/mm3)/mm | 0.93 (0.83 to 0.97) | 0.84 (0.75 to 0.91) | 5.9 (3.5 to 9.9) | 0.09 (0.03 to 0.22) |
| High‐risk varices | |||||
| Platelet count | Around 90,000 | 0.59 (0.54 to 0.64) | 0.72 (0.66 to 0.78) | 2.1 (1.8 to 2.6) | 0.57 (0.52 to 0.63) |
| Around 150,000 | 0.80 (0.73 to 0.85) | 0.68 (0.57 to 0.77) | 2.5 (1.8 to 3.3) | 0.30 (0.23 to 0.39) | |
| Spleen length | ‐ | ‐ | ‐ | ‐ | ‐ |
| Platelet count‐to‐spleen length ratio | Around 909 (n/mm3)/mm | 0.85 (0.72 to 0.93) | 0.66 (0.52 to 0.77) | 2.5 (1.8 to 3.4) | 0.22 (0.12 to 0.42) |
| Test | No. of studies | No. of participants |
| 1 Adults ‐ platelet count ‐ any varices Show forest plot | 25 | 5096 |
| 2 Adults ‐ platelet count ‐ any varices ‐ cut‐off around 100,000 Show forest plot | 11 | 3506 |
| 3 Adults ‐ platelet count ‐ any varices ‐ cut‐off around 120,000 Show forest plot | 7 | 815 |
| 4 Adults ‐ platelet count ‐ any varices ‐ cut‐off around 150,000 Show forest plot | 10 | 2054 |
| 5 Adults ‐ platelet/spleen ratio ‐ any varices Show forest plot | 38 | 5235 |
| 6 Adults ‐ platelet/spleen ratio ‐ any varices ‐ cut‐off 909 Show forest plot | 17 | 2637 |
| 7 Adults ‐ spleen diameter ‐ any varices Show forest plot | 13 | 1489 |
| 8 Adults ‐ spleen diameter ‐ any varices ‐ cut‐off around 110 mm Show forest plot | 5 | 594 |
| 9 Adults ‐ spleen diameter ‐ any varices ‐ cut‐off around 150 mm Show forest plot | 5 | 598 |
| 10 Adults ‐ platelet count ‐ high‐risk varices Show forest plot | 21 | 4266 |
| 11 Adults ‐ platelet count ‐ high‐risk varices ‐ cut‐off around 90,000 Show forest plot | 11 | 3084 |
| 12 Adults ‐ platelet count ‐ high‐risk varices ‐ cut‐off around 150,000 Show forest plot | 7 | 1671 |
| 13 Adults ‐ platelet/spleen ratio ‐ high‐risk varices Show forest plot | 10 | 930 |
| 14 Adults ‐ platelet/spleen ratio ‐ high‐risk varices ‐ cut‐off around 909 Show forest plot | 7 | 642 |
| 15 Adults ‐ spleen diameter ‐ high‐risk varices Show forest plot | 6 | 883 |
| 16 Paediatrics ‐ platelet count ‐ any varices Show forest plot | 4 | 277 |
| 17 Paediatrics ‐ platelet/spleen ratio z‐score ‐ any varices Show forest plot | 2 | 197 |