Recuento plaquetario, longitud del bazo y cociente recuento plaquetario/longitud del bazo para el diagnóstico de las várices esofágicas en pacientes con hepatopatías crónicas o trombosis de la vena portal
Resumen
Antecedentes
Las guías actuales recomiendan el cribado de los pacientes con várices esofágicas mediante esofagogastroduodenoscopia en el momento del diagnóstico de la cirrosis hepática. Lo anterior requiere que los pacientes se sometan reiteradamente a procedimientos invasivos desagradables con los riesgos consiguientes, aunque la mitad de estos pacientes no tienen várices esofágicas identificables diez años después del diagnóstico inicial de la cirrosis. El recuento plaquetario, la longitud del bazo y el cociente recuento plaquetario/longitud del bazo son pruebas no invasivas propuestas como pruebas de triaje para el diagnóstico de las várices esofágicas.
Objetivos
Objetivos principales
Determinar la exactitud diagnóstica del recuento plaquetario, la longitud del bazo y el cociente recuento plaquetario/longitud del bazo para el diagnóstico de las várices esofágicas de cualquier tamaño en pacientes pediátricos o adultos con hepatopatías crónicas o trombosis de la vena portal, independientemente de la etiología. Investigar la exactitud de estos exámenes no invasivos como triaje o reemplazo de la esofagogastroduodenoscopia.
Objetivos secundarios
Comparar la exactitud diagnóstica de estas mismas pruebas para el diagnóstico de las várices esofágicas de alto riesgo en pacientes pediátricos o adultos con hepatopatías crónicas o trombosis de la vena portal, independientemente de la etiología.
Se intentó realizar comparaciones pareadas entre las tres pruebas índice, a la vez que se consideraron valores de corte predeterminados.
Se investigaron las fuentes de heterogeneidad.
Métodos de búsqueda
Se hicieron búsquedas en el registro de ensayos controlados del Grupo Cochrane Hepatobiliar (Cochrane Hepato‐Biliary Group Controlled Trials Register), en el registro de estudios de exactitud de las pruebas de diagnóstico del Grupo Cochrane Hepatobiliar (Cochrane Hepato‐Biliary Group Diagnostic Test Accuracy Studies Register), en la Cochrane Library, MEDLINE (OvidSP), Embase (OvidSP), y en Science Citation Index ‐ Expanded (Web of Science) (14 junio de 2016). No hubo restricciones de idioma o de tipo de documento.
Criterios de selección
Estudios que evaluaron la exactitud diagnóstica del recuento plaquetario, la longitud del bazo y el cociente recuento plaquetario/longitud del bazo para el diagnóstico de las várices esofágicas mediante esofagogastroduodenoscopia como estándar de referencia en niños o adultos de cualquier edad con hepatopatías crónicas o trombosis de la vena portal, y sin várices hemorrágicas.
Obtención y análisis de los datos
Métodos Cochrane estándar como se esboza en el Manual Cochrane para las revisiones de exactitud de las pruebas diagnósticas.
Resultados principales
Se incluyeron 71 estudios, 67 de los cuales sólo reclutaron adultos y cuatro sólo niños. Todos los estudios incluidos fueron cruzados y se realizaron en un centro de atención terciaria. Ocho estudios presentaron los resultados del estudio en resúmenes o cartas. Se consideró que todos los estudios incluidos, excepto uno, tuvieron alto riesgo de sesgo. Hubo mucha preocupación en definir el valor de corte de las tres pruebas de índice; la mayoría de los estudios incluidos derivaron los mejores valores de corte a posteriori, con lo que se sobreestimó la exactitud; se diseñaron 16 estudios para validar el valor de corte de 909 (n/mm3)/mm para la relación entre el recuento de plaquetas y la longitud de la espina dorsal. El reclutamiento de los participantes no fue consecutivo en seis estudios y no estuvo claro en 31 estudios. Treinta y cuatro estudios evaluados realizaron un reclutamiento consecutivo. Once estudios excluyeron de los análisis a algunos participantes incluidos, y en sólo un estudio el intervalo entre las pruebas índice y el estándar de referencia fue más prolongado que tres meses.
Diagnóstico de várices de cualquier tamaño. El recuento de plaquetas mostró una sensibilidad de 0,71 (intervalo de confianza (IC) del 95%: 0,63 a 0,77) y una especificidad de 0,80 (IC del 95%: 0,69 a 0,88) (valor de corte de alrededor de 150.000/mm3 de 140.000 a 150.000/mm3; 10 estudios, 2054 participantes). Al examinar las posibles fuentes de heterogeneidad, se observó que de todos los factores predefinidos, sólo la etiología tenía una función: los estudios que incluían a participantes con hepatitis C crónica informaban de resultados diferentes en comparación con los estudios que incluían a participantes con etiologías mixtas (P = 0,036). La longitud del bazo mostró una sensibilidad de 0,85 (IC del 95%: 0,75 a 0,91) y una especificidad de 0,54 (IC del 95%: 0,46 a 0,62) (valores de corte de alrededor de 110 mm, de 110 a 112,5 mm; 13 estudios, 1489 participantes). Las estimaciones globales para la detección de várices de cualquier tamaño mostraron una sensibilidad de 0,93 (IC del 95%: 0,83 a 0,97) y una especificidad de 0,84 (IC del 95%: 0,75 a 0,91) en 17 estudios, y 2637 participantes tuvieron un valor de corte para el cociente recuento plaquetario/longitud del bazo de 909 (n/mm3)/mm. No se encontró un efecto de las fuentes predeterminadas de heterogeneidad. Una comparación indirecta general de los HSROC de las tres pruebas índice mostró que el cociente recuento plaquetario/longitud del bazo fue la prueba índice más exacta en comparación con el recuento plaquetario (p < 0,001) y la longitud del bazo (p < 0,001).
Diagnóstico de várices con alto riesgo de hemorragia. El recuento de plaquetas mostró una sensibilidad de 0,80 (IC del 95%: 0,73 a 0,85) y una especificidad de 0,68 (IC del 95%: 0,57 a 0,77) (valor de corte de alrededor de 150.000/mm3 de 140.000 a 160.000/mm3; siete estudios, 1.671 participantes). Para la longitud del bazo, sólo se obtuvo una curva ROC resumida, ya que no se encontró un límite común entre los estudios (seis estudios, 883 participantes). El cociente de la longitud del recuento de plaquetas a la espina dorsal mostró una sensibilidad de 0,85 (IC del 95%: 0,72 a 0,93) y una especificidad de 0,66 (IC del 95%: 0,52 a 0,77) (valor de corte de alrededor de 909 (n/mm3)/mm; de 897 a 921 (n/mm3)/mm; siete estudios, 642 participantes). Una comparación indirecta general de los HSROC de las tres pruebas índice mostró que el cociente recuento plaquetario/longitud del bazo fue la prueba índice más exacta en comparación con el recuento plaquetario (p < 0,003) y la longitud del bazo (p < 0,001).
Diagnóstico de várices de cualquiera tamaño en niños. Se encontraron cuatro estudios que incluyeron 277 niños con enfermedades hepáticas diferentes o trombosis de la vena portal. El recuento de plaquetas mostró una sensibilidad de 0,71 (IC del 95%: 0,60 a 0,80) y una especificidad de 0,83 (IC del 95%: 0,70 a 0,91) (valor de corte de alrededor de 115.000/mm3; cuatro estudios, 277 participantes). El recuento de plaquetas y la longitud de la puntuación z mostraron una sensibilidad de 0,74 (IC del 95%: 0,65 a 0,81) y una especificidad de 0,64 (IC del 95%: 0,36 a 0,84) (valor de corte de 25; dos estudios, 197 participantes).
Conclusiones de los autores
El cociente recuento plaquetario/longitud del bazo se podría utilizar para estratificar el riesgo de várices esofágicas. Esta prueba se puede utilizar como prueba de triaje antes de la endoscopia y descartar de esa manera a los adultos sin várices. En el caso de un cociente > 909 (n/mm3)/mm es posible descartar la presencia de várices esofágicas de cualquier tamaño y sólo se pasaría por alto el 7% de los adultos con várices de cualquier tamaño, lo que permite a los investigadores disminuir el número de exámenes de esofagogastroduodenoscopia. Esta prueba no es lo suficientemente exacta para identificar las várices esofágicas con alto riesgo de hemorragia que requieren profilaxis primaria. Los estudios futuros deben evaluar la exactitud diagnóstica de esta prueba en subgrupos específicos de pacientes, así como su capacidad de predecir las várices hemorrágicas. Se deben examinar nuevas pruebas no invasivas.
Resumen en términos sencillos
Recuento plaquetario, longitud del bazo y cociente recuento plaquetario/longitud del bazo para el diagnóstico de las várices esofágicas en pacientes con enfermedad hepática
Antecedentes
La cirrosis hepática es una enfermedad grave con cicatrices y nódulos en el tejido hepático. Como resultado, la función normal del hígado está deteriorada. Cualquiera sea la causa de la cirrosis, los cambios en la estructura del hígado y el flujo sanguíneo dentro del mismo aumentan la presión de la vena portal (hipertensión de la vena portal), que es la vena que drena sangre de los intestinos al hígado. La hipertensión portal induce la dilatación (ampliación) de las venas en la pared del esófago, que a menudo pueden romperse y causar hemorragias graves. Por lo tanto, cuando se diagnostica la cirrosis hepática, se recomienda la realización de una esofagogastroduodenoscopia (EGD) para detectar la presencia de várices esofágicas (áreas de dilatación anormal de las venas). Durante la EGD se inserta una cámara pequeña al final de un tubo que baja por el esófago desde la boca y las imágenes se retransmiten de vuelta a una pantalla. Las várices grandes o los signos rojos en várices incluso pequeñas muestran riesgos altos de rotura y hemorragia. Cuando se encuentran várices de alto riesgo, el tratamiento con betabloqueantes es efectivo para reducir el riesgo de hemorragia. Se podrían utilizar tres pruebas sencillas y no invasivas para identificar a las personas con una enfermedad hepática con alto riesgo de tener várices esofágicas: el recuento de plaquetas, una prueba de laboratorio sencilla realizada en una muestra de sangre mediante la cual se mide el número de plaquetas (un elemento de la sangre que asegura la coagulación); la longitud (diámetro máximo) del bazo, medida durante el examen ecográfico del abdomen; y la relación entre el recuento de plaquetas y la longitud del bazo.
Características de los estudios
Se efectuaron búsquedas en bases de datos científicas de estudios clínicos que compararon al recuento plaquetario, la longitud del bazo o el cociente recuento plaquetario/longitud del bazo versus la esofagogastroduodenoscopia para detectar la presencia de várices en niños o adultos con enfermedades hepáticas crónicas o trombosis de la vena portal (estrechamiento de la vena portal). La evidencia está actualizada hasta junio de 2016.
Resultados clave
Se encontraron 25 estudios con 5096 participantes que evaluaron el uso del recuento plaquetario para diagnosticar la presencia de várices y el grado de riesgo de sangrado, y compararon el recuento plaquetario versus la esofagogastroduodenoscopia en adultos con cirrosis: 13 estudios con 1489 participantes evaluaron la capacidad diagnóstica de la longitud del bazo y 38 estudios con 5235 participantes evaluaron la capacidad diagnóstica del cociente recuento plaquetario/longitud del bazo. El cociente recuento plaquetario/longitud del bazo fue la más exacta y se podría utilizar para identificar a los pacientes con enfermedad hepática que tuvieran alto riesgo de tener várices esofágicas. En particular, en los pacientes con cirrosis hepática entre los que 580 de 1000 pacientes se espera que tengan várices esofágicas, sólo en 41 (7% de 580) pacientes se pasará por alto la presencia de várices y no recibirán tratamiento preventivo apropiado ni seguimiento. Por lo tanto, si el cociente recuento plaquetario/longitud del bazo es menor de 909 (n/mm3)/mm (el umbral más utilizado), la presencia de várices esofágicas se puede descartar. Por lo tanto, es posible reducir el número de exámenes endoscópicos necesarios para encontrar un paciente con várices esofágicas. Por el contrario, este cociente no es lo suficientemente exacto para reemplazar la endoscopia en la identificación del alto riesgo de hemorragia de las várices esofágicas.
Calidad de la evidencia
Todos los estudios, excepto uno, tuvieron problemas de riesgo de sesgo que incluyó principalmente la definición de pruebas índice positivas o negativas (recuento plaquetario, longitud del bazo y el cociente), que se deben definir antes y no después de los análisis de los datos, así como el cegamiento de los resultados de la prueba para los endoscopistas que realizaron la esofagogastroduodenoscopia. Por lo tanto, estos problemas podrían afectar las estimaciones de la exactitud de las tres pruebas.
Authors' conclusions
Summary of findings
| Review question | What is the diagnostic accuracy of platelet count for the diagnosis of oesophageal varices in adults with liver disease or portal vein thrombosis? | |||||
| Population | Adults with diagnosis of chronic liver disease or portal vein thrombosis. Age ≥ 18 years | |||||
| Settings | Outpatients and inpatients in secondary/tertiary care setting | |||||
| Study design | Prospective and retrospective cross‐sectional studies. No case‐control studies were found | |||||
| Index tests | Platelet count | |||||
| Reference standards | Upper endoscopy | |||||
| Target condition | Summary accuracy (95% CI) | No. of participants (studies) | Prevalence, Median (range ) | Implications in a hypothetical cohort of 1000 people | Post‐test probability | Quality and comments |
| Any varices Cut‐off value: around 150,000 /mm3 (range 140,000 to 150,000/mm3) | Sensitivity 0.71 (0.63 to 0.77) Specificity 0.80 (0.69 to 0.88) LR+ 3.6 LR‐ 0.37 | 2054 participants (10) | 38% | With a prevalence of 38%, 380 out of 1000 people will have varices of any size. Of these 380 people, 110 (29% of 380) people with varices will receive misdiagnosis and will not received appropriate prophylaxis or follow‐up The remaining 620 people will have no varices. 124 people (20% of 620) will receive false diagnosis of varices and will undergo an unnecessary endoscopy | Assuming a pretest probability of 38% Post‐test probabilities:
| Most studies are at high risk of bias No predefinition of cut‐off value of the index test for most studies Median prevalence of any varices is lower than that reported by most guidelines (around 50%) . |
| High risk varices Cut‐off value: around 150,000 /mm3 (range 140,000 to 160,000/mm3) | Sensitivity 0.80 (0.73 to 0.85) Specificity 0.68 (0.57 to 0.77) LR+ 2.5 LR‐ 0.30 | 1671 participants (7) | 20% | With a prevalence of 20%, 200 out of 1000 people will have varices at high risk of bleeding. Of these 200 people, 40 (20% of 200) people with high‐risk varices will receive misdiagnosis and will not receive effective prophylaxis The remaining 800 people will not have high‐risk varices. 256 people (32% of 800) will receive false diagnosis of high‐risk varices and will undergo an unnecessary endoscopy | Assuming a pretest probability of 20% Post‐test probabilities:
| Most or all studies at high risk of bias No predefinition of cut‐off value of the index test for most studies |
| Review question | What is the diagnostic accuracy of spleen length for the diagnosis of oesophageal varices in adult people with liver disease or portal vein thrombosis? | |||||
| Population | Adults with diagnosis of chronic liver disease or portal vein thrombosis. Age ≥ 18 years | |||||
| Settings | Outpatients and inpatients in secondary/tertiary care setting | |||||
| Study design | Prospective and retrospective cross‐sectional studies. No case‐control studies were found | |||||
| Index tests | Spleen length | |||||
| Reference standards | Upper endoscopy | |||||
| Target condition | Summary accuracy (95% CI) | No. of participants (studies) | Prevalence, Median (range ) | Implications in a hypothetical cohort of 1000 people | Post‐test probability | Quality and comments |
| Any varices Cut‐off value: around 110 mm (range 110 to 112.5 mm) | Sensitivity 0.85 (0.75 to 0.91) Specificity 0.54 (0.46 to 0.62) LR+ 1.8 (1.6 to 1.21) LR‐ 0.28 (0.17 to 0.44) | 594 participants (5) | 53% | With a prevalence of 53%, 530 out of 1000 people will have varices of any size. Of these 530 people, 80 (15% of 530) people with varices will receive misdiagnosis and will not receive appropriate prophylaxis or follow‐up The remaining 470 people will have no varices. 216 people (46% of 470) will receive false diagnosis of varices and will undergo an unnecessary endoscopy | Assuming a pretest probability of 53% Post‐test probabilities:
| Most or all studies at high risk of bias |
| High‐risk varices Cut‐off value: no common cut‐off value. Range 120 to 160 mm | Sensitivity ranged from 0.50 to 0.88 and specificity from 0.55 to 0.84 | 883 participants (6) | 42% | Inconsistency of results (no common cut‐off value) prevents any conclusions . | Most or all studies at high risk of bias | |
| What is the diagnostic accuracy of platelet count‐to‐spleen length ratio? | ||||||
| Review question | What is the diagnostic accuracy of platelet count‐to‐spleen length ratio for the diagnosis of oesophageal varices in adult people with liver disease or portal vein thrombosis? | |||||
| Population | Adults with diagnosis of chronic liver disease or portal vein thrombosis. Age ≥ 18 years | |||||
| Settings | Outpatients and inpatients in secondary/tertiary care setting | |||||
| Study design | Prospective and retrospective cross‐sectional studies. No case‐control studies were found | |||||
| Index tests | Platelet count‐to‐spleen length ratio | |||||
| Reference standards | Upper endoscopy | |||||
| Target condition | Summary accuracy | No. of participants (studies) | Prevalence, Median (range ) | Implications in a hypothetical cohort of 1000 people | Post‐test probability | Quality and comments |
| Any varices Cut‐off value: 909 (n/mm3)/mm | Sensitivity 0.93 (0.93 to 0.87) Specificity 0.84 (0.75 to 0.91) LR+ 5.9 LR‐ 0.09 | 2637 participants (17) | 58% | With a prevalence of 58%, 580 out of 1000 people will have varices of any size. Of these 580 people, 41 (7% of 580) people with varices will receive misdiagnosis and will not receive appropriate prophylaxis or follow‐up The remaining 420 people will have no varices. 67 people (16% of 420) will receive false diagnosis of varices and will undergo an unnecessary endoscopy | Assuming a pretest probability of 58% Post‐test probabilities:
| Most studies are at high risk of bias |
| High‐risk varices Cut‐off value: around 909 (n/mm3)/mm (range 897 to 921 (n/mm3)/mm) | Sensitivity 0.85 (0.72 to 0.93) Specificity 0.66 (0.52 to 0.77) LR+ 2.5 LR‐ 0.22 | 642 participants (7) | 60% | With a prevalence of 60%, 600 out of 1000 people will have varices at high risk of bleeding. Of these 2600 people, 90 (15% of 600) people with high‐risk varices will receive misdiagnosis and will not receive effective prophylaxis The remaining 400 people will not have high‐risk varices. 136 people (34% of 400) will receive false diagnosis of high‐risk varices and will undergo an unnecessary endoscopy | Assuming a pre‐test probability of 60% Post‐test probabilities:
| Most studies are at high risk of bias Median prevalence of any varices is higher than that reported by most guidelines (around 25%) |
| What is the diagnostic accuracy of platelet count? | ||||||
| Review question | What is the diagnostic accuracy of platelet count for the diagnosis of oesophageal varices in paediatric people with liver disease or portal vein thrombosis? | |||||
| Population | Children with diagnosis of chronic liver disease or portal vein thrombosis. Age < 18 years | |||||
| Settings | Outpatients and inpatients in secondary/tertiary care setting | |||||
| Study design | Prospective and retrospective cross‐sectional studies. No case‐control studies were found | |||||
| Index tests | Platelet count | |||||
| Reference standards | Upper endoscopy | |||||
| Target condition | Summary accuracy | No. of participants (studies) | Prevalence, Median (range ) | Implications in a hypothetical cohort of 1000 people | Post‐test probability | Quality and comments |
| Any varices Cut‐off value: around 120,000 /mm3 (range 115,000 to 119,000/mm3) | Sensitivity 0.71 (0.60 to 0.80) Specificity 0.83 (0.70 to 0.91) LR+ 4.2 LR‐ 0.35 | 277 participants (4) | 58% | With a prevalence of 58%, 580 out of 1000 children will have varices of any size. Of these 580 children, 168 (29% of 580) children with varices will receive misdiagnosis and will not receive appropriate. prophylaxis or follow‐up The remaining 420 children will have no varices. 71 children (17% of 420) will receive false diagnosis of varices and will undergo an unnecessary endoscopy | Assuming a pretest probability of 58% Post‐test probabilities:
| Studies were at high risk of bias |
| What is the diagnostic accuracy of platelet count‐to‐spleen length ratio? | ||||||
| Review question | What is the diagnostic accuracy of platelet count‐to‐spleen length ratio for the diagnosis of oesophageal varices in paediatric people with liver disease or portal vein thrombosis? | |||||
| Population | Children with diagnosis of chronic liver disease or portal vein thrombosis. Age < 18 years | |||||
| Settings | Outpatients and inpatients in secondary/tertiary care setting | |||||
| Study design | Prospective and retrospective cross‐sectional studies. No case‐control studies were found | |||||
| Index tests | Platelet count‐to‐spleen length ratio | |||||
| Reference standards | Upper endoscopy | |||||
| Target condition | Summary accuracy (95% CI) | No. of participants (studies) | Prevalences | Implications in a hypothetical cohort of 1000 people | Post‐test probability | Quality and comments |
| Any varices Cut‐off value: around 1000 (n/mm3)/mm | Sensitivity 0.74 (0.65 to 0.81) Specificity 0.64 (0.36 to 0.85) LR+ 2.0 (1.0 to 4.0) LR‐ 0.41 (0.27 to 0.61) | 197 participants | 72% and 73% | With a prevalence of 50%, 500 out of 1000 children will have varices of any size. Of these 500 children, 130 (26% of 500) children with varices will receive misdiagnosis and will not receive appropriate prophylaxis or follow‐up The remaining 500 children will have no varices. 180 children (36% of 500) will receive false diagnosis of varices and will undergo an unnecessary endoscopy | Assuming a pretest probability of 50% Post‐test probabilities:
| Limited evidence. Only 2 studies were found. These 2 studies were at high risk of bias |
Background
Oesophageal varices in portal hypertension
Portal hypertension commonly accompanies advanced liver disease and often gives rise to life‐threatening complications, including haemorrhage from oesophageal and gastrointestinal varices. Prevalence of cirrhosis in high‐income countries ranges from 0.4% to 1.1% of the population (Bellentani 1994; Quinn 1997); up to two thirds of people with cirrhosis will develop gastro‐oesophageal varices (Pagliaro 1992; D'Amico 1999; Jensen 2002). The incidence of oesophageal varices among people with compensated cirrhosis is around 5% per year (Merli 2003; Groszmann 2005), and the cumulative incidence among people with well‐defined compensated cirrhosis seems lower: 44% at 10 years and 53% at 20 years (D'Amico 2014). Gastro‐oesophageal varices are an extension of oesophageal varices; isolated gastric varices in the absence of oesophageal varices are rare and usually are associated with splenic vein thrombosis (Garcia‐Tsao 2007). As varices grow larger, they become more likely to rupture and bleed (Lebrec 1980; NIEC 1988). Haemorrhage from ruptured oesophageal varices is one of the most common causes of gastrointestinal bleeding and is the most common cause of death among individuals with cirrhosis (D'Amico 2006 a; Garcia‐Tsao 2007). Studies conducted by the Northern Italian Endoscopic Club have shown that bleeding over two years occurs at a frequency of up to 30% from large varices compared with 5% to 18% from small varices (NIEC 1988; Zoli 1996; D'Amico 1999). Variceal bleeding is a medical emergency that, in spite of recent progress, is associated with mortality of 10% to 20% at six weeks. Up to 30% of initial bleeding episodes are fatal, and bleeding recurs among 70% of survivors (Graham 1981; NIEC 1988; Sharara 2001; D'Amico 2003; Bambha 2008). However, primary prophylaxis with non‐selective beta blockers or endoscopic variceal banding lowers the incidence of first variceal haemorrhage, especially from medium to large varices (Garcia‐Tsao 2008; de Franchis 2015). Detection of oesophageal varices allows one to define the bleeding risk and to identify progression to decompensated cirrhosis associated with further complications and a poor prognosis requiring more intense follow‐up (D'Amico 2006 b; D'Amico 2014).
Current North American European and Asian Pacific guidelines for detection and management of oesophageal varices recommend performance of oesophago‐gastro‐duodenoscopy to screen for oesophageal varices at the time hepatic cirrhosis is diagnosed (Garcia‐Tsao 2007; Sarin 2008; ASGE Standards of Practice Committee 2012). However, the point prevalence of oesophageal varices requiring prophylaxis is only about 15% to 25%, and most people undergoing screening oesophago‐gastro‐duodenoscopy do not have varices or have varices that do not require treatment. Moreover, oesophago‐gastro‐duodenoscopy is an invasive procedure that often requires sedation and may be associated with serious, even rare, complications and with frequent unexpected hospital admissions (Silvis 1976; Wolfsen 2004; Geraci 2009; Leffler 2010). Therefore, a cost‐effective triage pathway must be developed to select people who will benefit from oesophago‐gastro‐duodenoscopy screening. A recent consensus conference (de Franchis 2015) identified individuals with chronic liver disease who could safely avoid screening endoscopy because their risk of oesophageal varices was very low when liver stiffness was measured by transient elastography < 20 kPa and a platelet count > 150,000 per mm3. However no systematic review supports this recommendation (de Franchis 2015).
A non‐invasive test can play the role of a triage test if it can serve to accurately rule out the presence of varices without missing effective treatments, and hence to reduce the use of endoscopy, reserving its use for people with positive results. A non‐invasive test may even be more accurate than the reference standard, that is, oesophago‐gastro‐duodenoscopy, which is limited by interobserver reliability, which is poor even for the definition of the presence of varices and for assessment of their size and volume (Winkfield 2003). In such a case, the non‐invasive test could replace the reference standard. However, for a non‐invasive test to replace oesophago‐gastro‐duodenoscopy as the preferred diagnostic test for varices, it should accurately demonstrate the presence of varices while providing qualitative information that currently can be gained only from endoscopy. It is important to note that the non‐invasive test should be able to predict the risk of variceal bleeding with as much or greater accuracy than oesophago‐gastro‐duodenoscopy
Many non‐invasive tests have been proposed for the diagnosis of oesophageal varices. This systematic review is one of five that have examined the diagnostic utility of these tests (Gana 2010a; Gana 2010b; Gana 2010c; Colli 2014b).
Target condition being diagnosed
Oesophageal varices
Oesophageal varices of any size were diagnosed. Oesophageal varices are dilated blood vessels within the wall of the oesophagus that develop when resistance to blood flow through the liver is increased as the result of cirrhosis or portal vein obstruction. Large oesophageal varices are associated with greater risk of bleeding than are smaller varices. Red marks (or red signs) on varices diagnosed during oesophago‐gastro‐duodenoscopy have also been associated with increased bleeding risk (JSPH 1980; NIEC 1988; Garcia‐Tsao 2007; Garcia‐Tsao 2008). Medium varices were classified as large varices, as suggested by the American Association for the Study of Liver Diseases, because recommendations for management of medium‐sized varices are the same as for large varices (Garcia‐Tsao 2007).
Index test(s)
Platelet count, spleen length, and platelet count‐to‐spleen length ratio
If non‐invasive tests predict the presence of oesophageal varices with sufficient accuracy, then oesophago‐gastro‐duodenoscopy can be limited to patients identified to be at high risk of varices. Certain blood tests and imaging modalities and calculations based on their results have shown a promising correlation with oesophageal varices. Of these, the most frequently studied non‐invasive tests are platelet count and ultrasound measurements of spleen length. Increased spleen length in patients with chronic liver disease is almost always caused by increased portal pressure (Pockros 2002; Liangpunsakul 2003). Thrombocytopenia may be the result of splenic pooling of platelets due to portal hypertension, immune‐mediated mechanisms, or reduced thrombopoietin synthesis (Peck‐Radosavljevic 2000; Giannini 2003a; Peck‐Radosavljevic 2007). Integrating platelet count and spleen length in a ratio provides a measure of the degree of thrombocytopenia that may result from hypersplenism. This review aims to evaluate the diagnostic accuracy of platelet count, spleen length, or platelet count‐to‐spleen length ratio in predicting the presence of oesophageal varices.
Clinical pathway
At the time of diagnosis of hepatic cirrhosis of whatever aetiology, an oesophago‐gastro‐duodenoscopy is recommended to detect the presence of oesophageal varices and to define the risk of their rupture and bleeding while providing an overall prognostic assessment. In the case of high‐risk varices (large varices or presence of red marks), primary prophylaxis with a non‐selective beta‐blocker or endoscopic banding ligation of varices has been demonstrated to be effective and hence is recommended (D'Amico 1999; Imperiale 2001; Gluud 2007; Gluud 2012). If oesophago‐gastro‐duodenoscopy reveals no varices, a repeated examination is recommended in three years. If low‐risk varices are seen (small varices without red marks), then oesophago‐gastro‐duodenoscopy should be repeated in two years. If small varices are associated with red signs or with Child‐Pugh score B‐C (Pugh 1973), non‐selective beta‐blocker prophylaxis is recommended (Garcia‐Tsao 2007; Garcia‐Tsao 2008; ASGE Standards of Practice Committee 2012; de Franchis 2015).
Prior test(s)
The diagnosis of liver cirrhosis usually is based on clinical judgement derived from history, laboratory testing, physical examination, imaging, liver histology, or a combination of these. No prior test is recommended by the guidelines before screening with oesophago‐gastro‐duodenoscopy of oesophageal varices when the diagnosis of cirrhosis is made.
Role of index test(s)
The possible role of platelet count, spleen length, and platelet count‐to‐spleen length ratio involves screening people with a diagnosis of cirrhosis for the presence of varices, sparing oesophago‐gastro‐duodenoscopy in people with negative results. Furthermore, these non‐invasive tests could even be so accurate in detecting high‐risk varices (large varices or presence of red marks) for which primary prophylaxis is recommended that they could replace oesophago‐gastro‐duodenoscopy.
Alternative test(s)
Some non‐invasive tests other than platelet count, spleen length, and platelet count‐to‐spleen length ratio have been proposed for the diagnosis of oesophageal varices, such as serum markers for liver fibrosis, transient elastography, or imaging with ultrasound computed tomography, magnetic resonance, or capsule endoscopy (Colli 2014b).
We will examine some of these tests in future planned reviews (Gana 2010a; Gana 2010b; Gana 2010c).
Rationale
Effective prevention of the first variceal haemorrhage (primary prophylaxis) in adults with medium or large varices can be achieved via non‐selective beta‐blockers or endoscopic variceal ligation (D'Amico 1999; Imperiale 2001; Gluud 2007). Therefore, both North American (Grace 1998; Adams 2004; Garcia‐Tsao 2007; Garcia‐Tsao 2008) and European guidelines (Jalan 2000; Garcia‐Tsao 2008; EASL 2011; Tripathi 2015; NICE 2016) recommend endoscopy at the time of diagnosis of cirrhosis and at intervals thereafter to identify at‐risk patients who might benefit from prophylactic treatment. These guidelines require that patients repeatedly undergo an unpleasant invasive procedure with its attendant risks, although half have no identifiable oesophageal varices 10 years after the initial diagnosis of cirrhosis. Oesophago‐gastro‐duodenoscopy requires appropriate sedation and analgesia (Cotton 2006) and is associated with an overall complication rate of 0.13% and a mortality rate of 0.004% (Silvis 1976).
Two cost‐effectiveness studies suggested avoidance of surveillance oesophago‐gastro‐duodenoscopy and treatment with non‐selective beta‐blockers for all people with cirrhosis, irrespective of the presence or size of varices (Saab 2003; Spiegel 2003). A third cost‐effectiveness analysis suggested that this non‐selective strategy should be reserved for people with decompensated liver disease (Arguedas 2002). Those conflicting cost‐effectiveness recommendations do not recognise that non‐selective beta‐blockers do not prevent the development of oesophageal varices (Groszmann 2005). Therefore, oesophago‐gastro‐duodenoscopy remains the recommended test for the diagnosis and prognosis of oesophageal varices (Garcia‐Tsao 2007; Garcia‐Tsao 2008).
In view of the invasive nature and costs of oesophago‐gastro‐duodenoscopy, a non‐invasive test with adequate accuracy could serve as a screening test. Such a test would assist in triaging people before oesophago‐gastro‐duodenoscopy, and, if varices of sufficient risk of bleeding are present, primary prophylaxis will be recommended to prevent variceal haemorrhage. Non‐invasive tests for varices, if sufficiently accurate in detecting high‐risk varices, could even replace oesophago‐gastro‐duodenoscopy, which is still the preferred test for diagnosing oesophageal varices. For these reasons, we aimed (1) to assess the ability of platelet count, spleen length, and platelet count‐to‐spleen length ratio to triage people for oesophago‐gastro‐duodenoscopy investigation, and (2) to determine whether this approach could replace oesophago‐gastro‐duodenoscopy.
Objectives
Primary objectives
To determine the diagnostic accuracy of platelet count, spleen length, and platelet count‐to‐spleen length ratio for the diagnosis of oesophageal varices of any size in paediatric or adult patients with chronic liver disease or portal vein thrombosis, irrespective of their aetiology. To investigate the accuracy of these non‐invasive tests as triage or replacement of oesophago‐gastro‐duodenoscopy. We considered separately studies with adult participants and studies with paediatric participants.
Secondary objectives
To compare the diagnostic accuracy of platelet count, spleen length, and platelet count‐to‐spleen length ratio for the diagnosis of high‐risk oesophageal varices in paediatric or adult patients with chronic liver disease or portal vein thrombosis, irrespective of aetiology.
We aimed to perform pair‐wise comparisons between the three index tests, while considering predefined cut‐off values, as reported in the 'Index test' section.
We investigated the following sources of heterogeneity.
-
Chronic liver disease compared with portal vein thrombosis.
-
Prevalence of oesophageal varices in the study group (≥ 50% versus < 50% for any varices; > 25% versus ≤ 25% for high‐risk varices).
-
Severity of liver disease Child A (> 50% versus ≤ 50%).
-
Different aetiologies (hepatitis C virus (HCV)‐associated cirrhosis versus cirrhosis of all causes).
Methods
Criteria for considering studies for this review
Types of studies
We aimed to include studies that, irrespective of publication status and language, evaluated the diagnostic accuracy of platelet count, spleen length, and platelet count‐to‐spleen length ratio for the diagnosis of oesophageal varices with oesophago‐gastro‐duodenoscopy as the reference standard. We considered studies of cross‐sectional cohort design including people with clinical suspicion of portal hypertension as well as studies of participant‐control design that compared people with oesophageal varices versus matched controls (Colli 2014a). We excluded studies that analysed data only per varix rather than per participant unless participant data were made available by study authors.
Participants
Participants included paediatric or adult patients of any age with chronic liver disease or portal vein thrombosis, irrespective of aetiology, severity of disease, and duration of illness, in whom the presence or absence of varices was confirmed by oesophago‐gastro‐duodenoscopy. The review focused on diagnostic questions related to patients who have not yet suffered gastrointestinal bleeding from oesophageal varices. Patients with a previous surgical portal‐systemic shunt procedure or insertion of a transjugular intrahepatic portal‐systemic shunt (TIPS), previous ligation or sclerotherapy of oesophageal varices, previous history of upper gastrointestinal portal hypertensive bleeding, or previous primary prophylactic therapy of variceal haemorrhage make up a distinct group for whom the diagnosis or natural history of oesophageal varices has been modified. These patients were not the focus of this review, hence we excluded studies that included such patients unless investigators presented data in such a way as to allow this patient group to be isolated from other included patients.
Index tests
-
Platelet count is obtained from a complete blood count, a readily available automated clinical test. A platelet count cut‐off value less than 150,000/mm3 is considered thrombocytopenia.
-
Spleen length is usually obtained through evaluation of the patient's abdomen by ultrasound scan (USS). Interobserver agreement when spleen length is determined with USS is considered excellent. For adults, the upper limit of spleen length is 130 mm, beyond which the spleen is generally considered enlarged. Spleen length of 110 mm is regarded as a sensitive cut‐off for exclusion of splenomegaly (Grover 1993). For children, spleen length is expressed as a standard deviation score relative to normal values for both age and sex (spleen length z‐score) (Megremis 2004).
-
Platelet count‐to‐spleen length ratio is a derivative mathematical model shown to increase the accuracy of both non‐invasive tests for the diagnosis of oesophageal varices. The cut‐off value used most often for adults is 909 (n/mm3)/mm. In children, platelet count‐to‐spleen length ratio is calculated using the spleen length z‐score.
Target conditions
The presence of any oesophageal varices (independent of size) was detected by oesophago‐gastro‐duodenoscopy. For secondary analyses, the target condition considered was the presence of oesophageal varices at high risk of bleeding. High‐risk varices were defined as medium or large varices or small varices with red marks, or in patients with decompensated cirrhosis, as assessed by a B‐C Child‐Pugh score (Garcia‐Tsao 2007). Studies will require at least one of two target conditions to be identified: the presence of any oesophageal varices, or the presence of high‐risk varices.
Reference standards
Oesophago‐gastro‐duodenoscopy is the clinical reference standard test for the diagnosis of oesophageal varices in which the presence of varices in the oesophagus is directly observed through the endoscope. The size and appearance of oesophageal varices are graded at the time of endoscopy according to one of the systems described below, and the largest varix identified is used to classify the patient. Severity of cirrhosis, which is the other factor that defines bleeding risk, is assessed by Child‐Pugh score, with three classes ‐ A, B, and C ‐ indicating increasing severity (Pugh 1973). Patients whose largest varix is medium or large or who are included in class B‐C are considered for prophylactic therapy.
-
The Baveno Consensus system differentiates small from large oesophageal varices (de Franchis 1992), defining small oesophageal varices as varices that flatten with insufflation during endoscopy or that minimally protrude into the oesophageal lumen, and large oesophageal varices as varices that protrude into the oesophageal lumen and touch each other, or that fill at least 50% of the oesophageal lumen.
-
The Japanese Research Society for Portal Hypertension used three grades for variceal size (JSPH 1980). Grade 1 varices collapse with insufflation during endoscopy, grade 2 varices do not collapse with insufflation and do not occlude the lumen, and grade 3 varices occlude the lumen. For this review, we will consider grade 2 as equivalent to medium, and grade 3 as large.
-
The Japanese classification was revised by the Italian Liver Cirrhosis Project (ILCP) Group (Pagliaro 1988; Zoli 1996), which describes variceal size as the percentage of the radius of the oesophageal lumen that is occupied by the largest varix. A small or grade 1 varix is said to occupy less than 25%, a medium or grade 2 varix occupies 25% to 50%, and a large or grade 3 varix occupies greater than 50% of the radius of the lumen of the oesophagus.
-
The Cales criteria define varices as small if they flatten with insufflation during endoscopy, medium if they do not flatten with insufflation, and large if they do not flatten with insufflation during endoscopy and are confluent (Cales 1990).
-
We will include studies applying alternate classifications if adequately described and logically defined.
Red marks are usually noted as present or absent and may be described according to different classifications. Even small varices showing red marks are classified as ’at high risk of bleeding’.
The interval between index tests and oesophago‐gastro‐duodenoscopy has to be less than 3 months to avoid possible evolution of the target condition. When a study reported longer time intervals, we included the study but considered it to be at risk of bias. Clinically, patients with medium or large oesophageal varices or with red marks are at greatest risk of haemorrhage; therefore, we confined secondary analyses to two subgroups: patients with no varices and small varices compared with patients at high risk.
Search methods for identification of studies
Electronic searches
We searched the Cochrane Hepato‐Biliary Group Controlled Trials Register (Gluud 2016), the Cochrane Hepato‐Biliary Group Diagnostic Test of Accuracy Studies Register (Gluud 2016), the Cochrane Library, MEDLINE (OvidSP), Embase (OvidSP), and Science Citation Index ‐ Expanded (Web of Science) (Royle 2003). We have presented in Appendix 1 search strategies along with time spans of the searches. .We applied no language or document‐type restrictions.
Searching other resources
We identified additional references by manually searching the references of articles retrieved from computerised databases and relevant review articles. We sought information on unpublished studies by contacting experts in the field. In addition, we handsearched abstract books from meetings of the American Association for the Study of Liver Diseases (AASLD) and the European Association for the Study of the Liver (EASL) held over the past 10 years.
Data collection and analysis
We followed available guidelines as provided in the Cochrane Handbook for Diagnostic Test of Accuracy Reviews (DTA Handbook 2010).
Selection of studies
We retrieved publications if they were potentially eligible for inclusion on the basis of abstract review, or if they were relevant review articles for a manual reference search. Two review authors independently reviewed publications for eligibility. To determine eligibility, we assessed each publication to determine whether participants met the inclusion criteria detailed above. We included abstracts only if they provided sufficient data for analysis. We resolved disagreements by consensus.
Data extraction and management
Review authors, working in pairs (JCG and JY or AC and GC), completed a data extraction form for each included study. AC and GC completed extraction forms for studies retrieved during the last search (from 2009 to 2016). Each review author independently retrieved study data. In cases of discordance, we reached consensus through discussion.
We retrieved the following data.
-
General information: title, journal, year, publication status, and study design (prospective vs retrospective).
-
Sample size: number of participants meeting the criteria and total number of participants screened.
-
Baseline characteristics: baseline diagnosis, age, sex, race, and disease severity, and medications used concurrently. We considered severity of liver disease among the studied population by using the Child‐Pugh score (Pugh 1973) and the model for end‐stage liver disease (MELD) in adults (Kamath 2001), and by using the Child‐Pugh score and paediatric end‐stage liver disease (PELD) scores in children (McDiarmid 2002).
-
We reported index tests with all cut‐off values.
-
We used the following as clinical reference standard tests: variceal size, type of classification used, number of endoscopists, and handling of interobserver error on oesophago‐gastro‐duodenoscopy.
-
Numbers of true positive (TP), true negative (TN), false positive (FP), and false negative (FN) findings. We extracted these data for each presented cut‐off value and for the two target conditions.
We summarised data from each study in 2 × 2 tables (FP, FN, TP, TN) according to the two target conditions and entered the data into Review Manager 5 software.
Missing data
We contacted primary authors by email to ask for missing data that we needed to build the 2 × 2 tables. When we received no reply, we sent a second email two weeks later. When we still received no reply, we excluded the study.
Assessment of methodological quality
Two review authors independently assessed the risk of bias of included studies using QUADAS‐2 (revised tool for quality assessment of diagnostic accuracy studies) domains (Whiting 2011). In cases of discordance, we reached a consensus through discussion. We adopted the domains in Appendix 2 to address aspects of study quality involving the participant spectrum, index tests, target conditions, reference standards, and flow and timing. We did not plan to consider blinding of the index test to results of the reference standard for cases in which platelet count is obtained by an automated counter. We classified a study as having high risk of bias if we judged study to have high risk of bias or unclear risk of bias in at least one of the domains of QUADAS‐2.
Statistical analysis and data synthesis
We carried out statistical analyses according to recommendations provided in the Cochrane Handbook for Systematic Reviews of Diagnostic Test Accuracy (DTA Handbook 2010).
We built 2 × 2 tables (TP, TN, FP, FN) for each primary study for the three index tests for the two target conditions (any varices and high‐risk varices). We considered studies with adult participants and studies with paediatric participants separately, as we retrieved only studies that included only adult or paediatric participants.
For all combinations of index test/target condition/participants, we followed the following strategy of analysis. First, we performed a graphical descriptive analysis of the included studies: We reported forest plots (sensitivity and specificity separately, with their 95% confidence intervals (CIs)), and we provided a graphical representation of studies in the receiver operating characteristic (ROC) space (sensitivity against 1 ‐ specificity). Second, we performed a meta‐analysis. When primary studies reported accuracy estimates of an index test using different cut‐off points, we used the hierarchical summary ROC model (HSROC) to pool data (sensitivities and specificities) and to plot a summary ROC (SROC) curve (Rutter 2001). When considering studies with a common cut‐off value, we used the bivariate model and provided estimates of summary sensitivity and specificity. We used pooled estimates obtained from the fitted models to calculate summary estimates of positive and negative likelihood ratios (LR+ and LR‐, respectively).
For primary studies that reported accuracy results for more than one cut‐off point, we reported sensitivities and specificities for all cut‐off points, but we used a single cut‐off point for each study in HSROC (or bivariate) analysis.
We made pair‐wise comparisons between tests by adding a covariate for the index test to the HSROC (for comparisons of SROC curves) or bivariate (for comparisons of sensitivity and specificity at fixed cut‐off value) model. We assessed the significance of differences in test accuracy by using the log‐likelihood ratio test for comparison of models with and without the index test covariate term. We performed both indirect and direct comparisons, if sufficient data were available.
We considered P values less than 0.05 as two‐sided and statistically significant.
We performed all statistical analyses using SAS statistical software, release 9.4 (SAS Institute Inc., Cary, NC, USA) and macro METADAS (DTA Handbook 2010).
Investigations of heterogeneity
We investigated effects of the following predefined sources of heterogeneity.
-
Chronic liver disease compared with portal vein thrombosis.
-
Prevalence of oesophageal varices in the study group (≥ 50% versus < 50% for any varices; > 25% versus ≤ 25% for high‐risk varices).
-
Severity of liver disease Child A (> 50% versus ≤ 50%).
-
Different aetiologies (HCV‐associated cirrhosis versus all aetiologies),
by adding covariates to the bivariate or to the HSROC. We assessed the statistical significance of the covariate effect by using the log‐likelihood ratio test for comparison of models with and without the covariate term.
To limit the number of statistical analyses, we investigated sources of heterogeneity by considering only studies with the cut‐off value defined in the "Index test" section.
Sensitivity analyses
We attempted to assess effects of risk of bias of included studies on diagnostic accuracy by performing a sensitivity analysisfrom which we excluded studies with the following characteristics.
-
Studies classified at high risk of bias. We classified a study as having high risk of bias if we judged study to have high risk of bias or unclear risk of bias in at least one of the domains of QUADAS‐2 (Appendix 2). In addition, we identified the two following signalling questions as most relevant, and we decided to assess them in separate sensitivity analyses.
-
"Was a case‐control design avoided?"
-
"If a threshold was used, was it prespecified?"
-
-
Studies published only in abstract/letter form.
To limit the number of statistical analyses, we performed sensitivity analyses by considering only studies with the cut‐off value defined in the "Index test" section.
Results
Results of the search
We ran the search on 14 June 2016. We identified 3832 references by searching the following databases: the Cochrane Hepato‐Biliary Group Controlled Trials Register (n = 17), the Cochrane Hepato‐Biliary Group Diagnostic Test Accuracy Register (n = 8), the Cochrane Library (n = 73), MEDLINE (OvidSP) (n = 943), Embase (OvidSP) (n = 2188), and Science Citation Index ‐ Expanded (Web of Science) (n = 603). After exclusion of 1172 duplicates, 2660 references remained for possible eligibility. We retrieved five additional references through handsearching. After reading the title and the abstract of these 2665 references, we excluded 2566 of them, as they did not meet the inclusion criteria. We retrieved full texts of the remaining 99 records, and after reading the full texts, we excluded 34 studies for various reasons (see Characteristics of excluded studies). Finally, we included in our review 65 references reporting data on 71 studies (Figure 1).

Study flow diagram.
We reported in the Characteristics of included studies tables the main characteristics of the 71 included studies. Investigators reported five studies (Primignani 2002; Lei 2007; Aqodad 2011; El Ray 2015; Wang CC 2015) only in abstract form and three (Zimbwa 2004; Sen 2008a; Sen 2008b) as letters. Four studies (Colecchia 2011; Gana 2011; Alcantara 2012; Adami 2013) included only paediatric participants, and the other 67 studies included only adult participants. All included studies were cross‐sectional studies, prospective or retrospective, conducted at tertiary referral centres. Sixteen studies (Madhotra 2002; Baig 2008; Parrino 2008; Sen 2008a; Sen 2008b; Sarangapani 2010; Schwarzenberger 2010; Cherian 2011; Colecchia 2011; Colecchia 2012; Esmat 2012; Mahassadi 2012a; Mahassadi 2012b; Adami 2013; Chiodi 2014; Grgurevic 2014) assessed the accuracy of more than one index test on the same participants. The number of participants enrolled in each of the 71 included studies ranged from 31 to 1016 (median = 111). Eight studies included only participants in Child‐Pugh class A, three studies did not include any participant in Child‐Pugh class A, and 26 studies did not report Child‐Pugh classification.
Methodological quality of included studies
We have reported in detail results of the quality assessment of included studies in the Characteristics of included studies tables, and we have summarised this information in Figure 2 and Figure 3.

Methodological quality of the 71 included studies.
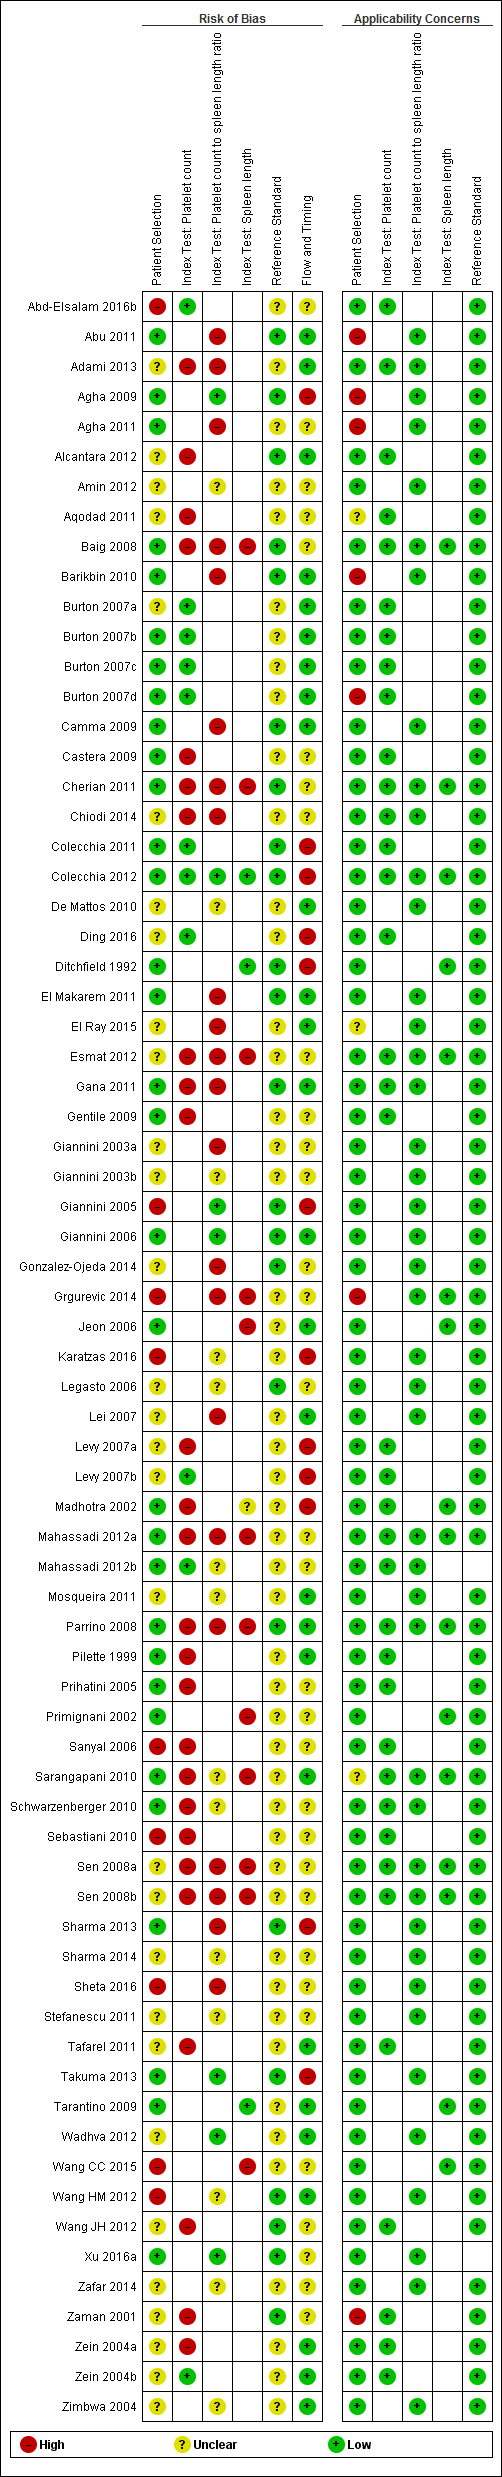
Quality assessment summary: review authors' judgements about each risk of bias item for each included study.
Not all of the included studies considered all three index tests. Cells are empty when an index test was not considered in a study.
Patient selection
All 71 studies were cross‐sectional: 29 studies were prospective, 21 were retrospective, and, in 21 studies, it was not clear whether a prospective or retrospective design was adopted. Thirty‐four studies reported that they enrolled consecutive participants; six studies reported non‐consecutive enrolment of participants (Sebastiani 2010; Wang HM 2012; Grgurevic 2014; Wang CC 2015; Abd‐Elsalam 2016b; Sheta 2016); for the remaining 31 studies, this information was unclear. The authors of three studies did not avoid inappropriate exclusions (Giannini 2005; Sanyal 2006; Karatzas 2016): One study included only people with previous negative screening for oesophageal varices who regularly attended an outpatient clinic and excluded the others (Giannini 2005); one study excluded patients with contraindications for computerised tomography, which was one of the index tests considered in that study (Karatzas 2016); one study included only participants from an interventional randomised clinical trial according to the exclusion criteria of this trial (Sanyal 2006). In eight other studies, information about exclusions was unclear. In summary, we classified nine studies as having high risk of bias, 30 studies unclear risk of bias, and 32 low risk of bias for the patient selection domain.
We had high concern regarding patient selection in seven studies, as they included mainly participants with advanced and decompensated disease (Zaman 2001; Burton 2007d; Agha 2009; Barikbin 2010; Abu 2011; Agha 2011; Grgurevic 2014); we had unclear concern about three studies that did not report a definition for severity of liver disease (Sarangapani 2010; Aqodad 2011; El Ray 2015).
Index tests
Platelet count: We considered 11 studies to have low risk of bias, and 26 to have high risk of bias.
Spleen length: We considered three studies to have low risk of bias, and 12 to have high risk of bias as the threshold value was not predefined and/or blind interpretation of results was not ensured (Primignani 2002; Jeon 2006; Baig 2008; Parrino 2008; Sen 2008a; Sen 2008b; Sarangapani 2010; Cherian 2011; Esmat 2012; Mahassadi 2012a; Grgurevic 2014; Wang CC 2015). One study provided a predefined cut‐off value but blinding presented unclear risk of bias (Madhotra 2002).
Platelet count‐to‐spleen length ratio: We considered seven studies to have low risk of bias, 22 high risk of bias, and 14 unclear risk of bias as the threshold value was not predefined and/or blind interpretation of results was not clearly ensured.
We had no applicability concerns.
Reference standards
All studies used an acceptable reference standard: gastrointestinal endoscopy with varices graded according to a recognised common scoring system. We had some concerns regarding blinded (without knowledge of results of the index tests) interpretation of the reference standard. Investigators in 23 studies reported that reference standard results were interpreted without knowledge of the results, and 48 studies provided unclear information on this. On the basis of these results, we classified 48 studies as having unclear risk of bias and 23 as having low risk of bias for the reference standard domain. We had no concerns regarding applicability.
Flow and timing
All participants underwent the same reference standard in all studies. The time interval between the index test and the reference standard execution was appropriate (i.e. < 3 months) in 34 studies, was inappropriate in one study (Ding 2016; time interval < 6 months), and was not reported in the remaining 36 studies.
Eleven studies excluded some participants from the analysis. Reasons reported by study authors included incomplete information, participants lost to follow‐up, and participants who did not undergo the reference standard or the index test. On the basis of these results, we classified 12 studies as having high risk of bias, 32 unclear risk of bias, and 27 low risk of bias for the flow and timing domain.
Overall assessment
Only one study was at low risk of bias in all four QUADAS‐2 domains (Giannini 2006). We classified 52 studies as having high risk of bias in at least one domain. We judged the remaining 18 studies as having unclear risk of bias.
Funding
Sebastiani 2010 reported under "Financial support" that the first study author "... is funded by an unrestricted grant from Roche‐Italia".
Sanyal 2006 reported under "Disclosures" that "This study was supported by the National Institute of Diabetes and Digestive and Kidney Diseases (contract numbers are listed below). Additional support was provided by the National Institute of Allergy and Infectious Diseases, the National Cancer Institute, the National Center for Minority Health and Health Disparities, and by General Clinical Research Center grants from the National Center for Research Resources, National Institutes of Health (grant numbers are listed below). Additional funding to conduct this study was supplied by Hoffmann‐La Roche, Inc, through a Cooperative Research and Development Agreement with the National Institutes of Health".
Eighteen studies reported that they received no funding. The remaining 51 studies provided no information on funding.
Findings
Adult participants ‐ any varices
Platelet count for any varices
Any cut‐off value
Twenty‐five studies with 5096 participants provided data assessing platelet count for the presence of any varices. The median prevalence of the target disease was 57% (range 26% to 88%). Cut‐off values ranged from 82,000 to 150,000/mm3. Sensitivity of platelet count for the diagnosis of oesophageal varices of any size ranged from 0.37 to 0.92, and specificity ranged from 0.39 to 0.98 (Figure 4).
Forest plot. Adult participants ‐ platelet count ‐ any varices.
We then carried out three meta‐analyses that included only studies that reported a cut‐off value of around 100,000/mm3, around 120,000/mm3, and around 150,000/mm3.
Cut‐off value around 100,000/mm3
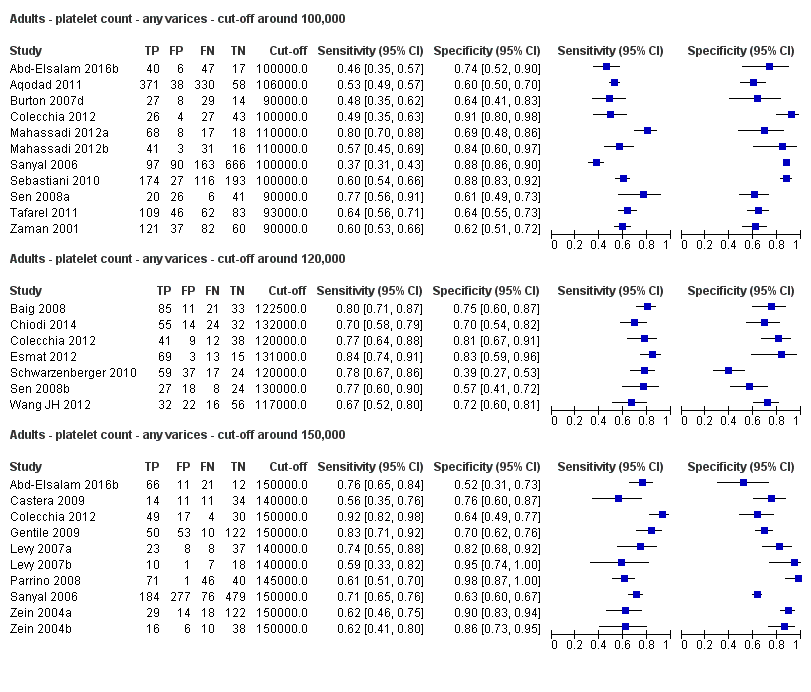
Eleven studies with 3506 participants provided data using a cut‐off value of around 100,000/mm3 (range 90,000 to 110,000/mm3). Sensitivity of the 11 studies varied from 0.37 to 0.80, and specificity from 0.60 to 0.91 (Figure 5). By using the bivariate model, we obtained the following estimates: sensitivity 0.57 (95% CI 0.50 to 0.64), specificity 0.75 (95% CI 0.67 to 0.82), LR+ 2.3 (95% CI 1.7 to 3.1), and LR‐ 0.57 (95% CI 0.49 to 0.67) (Figure 6).
Forest plots. Adult participants ‐ platetelet count ‐ various cut‐off values ‐ any varices.

Studies in the ROC space. Adult participants ‐ platelet count ‐ various cut‐off values ‐ any varices.
Cut‐off value around 120,000/mm3
Seven studies with 815 participants provided data using a cut‐off value of around 120,000/mm3 (range 117,000 to 132,000/mm3). Sensitivity of the seven studies varied from 0.67 to 0.84, and specificity from 0.39 to 0.83 (Figure 5). By using the bivariate model, we obtained the following estimates: sensitivity 0.77 (95% CI 0.72 to 0.81), specificity 0.69 (95% CI 0.57 to 0.78), LR+ 2.4 (95% CI 1.7 to 3.5), and LR‐ 0.34 (95% CI 0.26 to 0.44) (Figure 6).
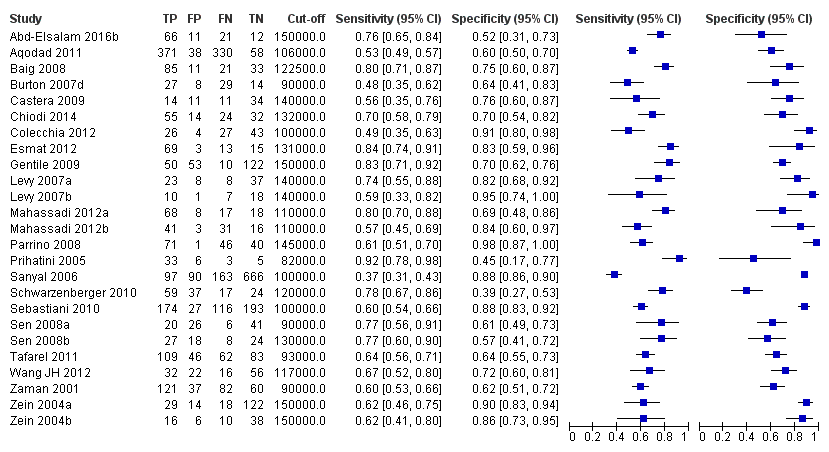
Cut‐off value around 150,000/mm3
Ten studies with 2054 participants provided data using a cut‐off value of around 150,000/mm3 (range 140,000 to 150,000/mm3). Sensitivity of the 10 studies varied from 0.56 to 0.92, and specificity from 0.52 to 0.98 (Figure 5). By using the bivariate model, we obtained the following estimates: sensitivity 0.71 (95% CI 0.63 to 0.77), specificity 0.80 (95% CI 0.69 to 0.88), LR+ 3.6 (95% CI 2.4 to 5.4), and LR‐ 0.37 (95% CI 0.30 to 0.45) (Figure 6).
Heterogeneity analysis
We investigated heterogeneity while considering only studies with a cut‐off value of around 150,000/mm3 ‐ the predefined cut‐off value. We found no effect of prevalence of varices (≤ 50% vs > 50%) or Child A on accuracy. We found an effect of aetiology (P = 0.036). Sensitivity and specificity were 0.76 (95% CI 0.60 to 0.86) and 0.63 (0.59 to 0.67) for the four studies that included only participants with HCV. Sensitivity and specificity were 0.71 (95% CI 0.66 to 0.76) and 0.88 (95% CI 0.83 to 0.91) for the four studies that included participants with mixed aetiology.
Sensitivity analysis
When considering Zein 2004b, Levy 2007b, Colecchia 2012, and Abd‐Elsalam 2016b, with a prespecified cut‐off value among all studies of around 150,000/mm3, we obtained sensitivity of 0.74 (95% CI 0.57 to 0.86) and specificity of 0.78 (95% CI 0.57 to 0.90). We could not perform the remaining sensitivity analyses, as all studies were cross‐sectional, all were at high/unclear risk of bias, and all were published as full text.
Spleen length for any varices
Any cut‐off value
Thirteen studies with 1489 participants provided data on assessment of spleen length for the presence of any varices. The median prevalence of the target disease was 62% (range 17% to 82%). Sensitivity of the 13 studies varied from 0.40 to 0.96, and specificity from 0.48 to 0.98. Cut‐off values ranged from 107 to 150 mm (Figure 7). We included in this analysis one study reporting data on two cut‐offs (110 mm and 150 mm) by using only the cut‐off of 150 mm (Colecchia 2012).

Forest plot. Adult participants ‐ spleen length ‐ any varices.
Cut‐off value around 110 mm
Five studies with 594 participants reported data using a cut‐off value of around 110 mm (range 110 to 112.5 mm). Sensitivity of the five studies varied from 0.75 to 0.96, and specificity from 0.43 to 0.68 (Figure 8). By using the bivariate model, we obtained the following estimates: sensitivity 0.85 (95% CI 0.75 to 0.91), specificity 0.54 (95% CI 0.46 to 0.62), LR+ 1.8 (95% CI 1.6 to 2.1), and LR‐ 0.28 (95% CI 0.17 to 0.44) (Figure 9).

Forest plots. Adult participants ‐ spleen length ‐ any varices: various cut‐off values.

Studies in the ROC space. Adult participants ‐ spleen length ‐ any varices: various cut‐off values.
Cut‐off value around 150 mm
FIve studies with 598 participants reported data using a cut‐off value of around 150 mm (range 140 to 150 mm). Sensitivity of the five studies varied from 0.40 to 0.81, and specificity from 0.64 to 0.96 (Figure 8). By using the bivariate model, we obtained the following estimates: sensitivity 0.57 (95% CI 0.41 to 0.71), specificity 0.82 (95% CI 0.72 to 0.89), LR+ 3.2 (95% CI 2.3 to 4.4), and LR‐ 0.53 (95% CI 0.39 to 0.72) (Figure 9).
Heterogeneity analysis
We could not assess effects of sources of heterogeneity among studies with a cut‐off value around 110 mm, as the models failed to converge owing to the small number of studies.
Sensitivity analysis
In considering studies with a cut‐off value of around 110 mm, when we excluded the two studies reported only in abstract form, we obtained sensitivity of 0.84 (95% CI 0.71 to 0.92) and specificity of 0.58 (95% CI 0.43 to 0.71) (Primignani 2002; Wang CC 2015). We could not perform the remaining sensitivity analyses because all studies were cross‐sectional and were at high/unclear risk of bias, and all but one of the studies used a prespecified cut‐off value.
Platelet count‐to‐spleen length ratio for any varices
Any cut‐off value
Thirty‐eight studies with 5235 participants provided data on assessment of platelet count to spleen length for the presence of varices of any size. The median prevalence of varices was 65% (range 28% to 85%). Sensitivity of the 38 studies varied from 0.40 to 1.00, and specificity from 0.36 to 1.00. Cut‐off values ranged from 420 to 1847 (n/mm3)/mm (Figure 10).
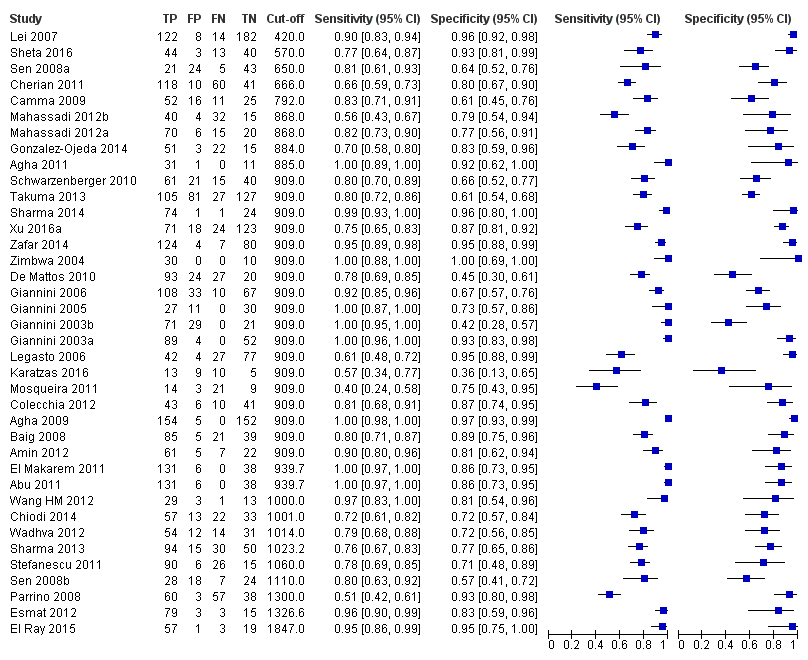
Forest plot. Adult participants ‐ platelet count‐to‐spleen length ratio ‐ any varices.
We then carried out a meta‐analysis including only studies that reported a cut‐off value of 909 (n/mm3)/mm.
Cut‐off value of 909 (n/mm3)/mm
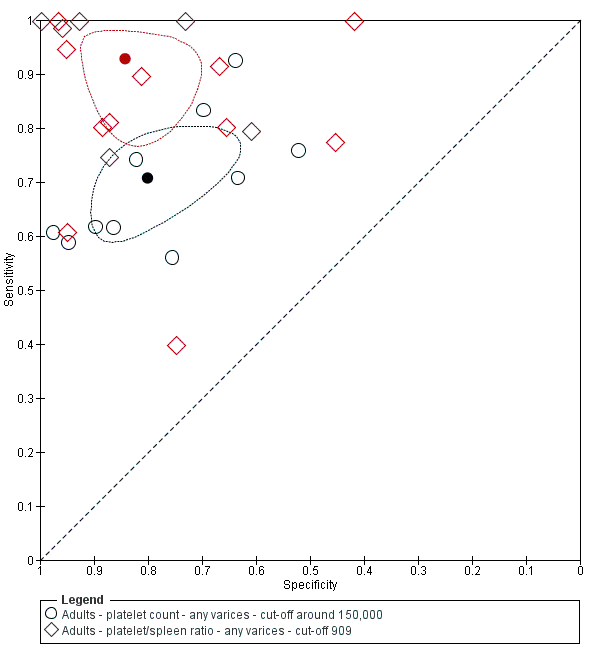
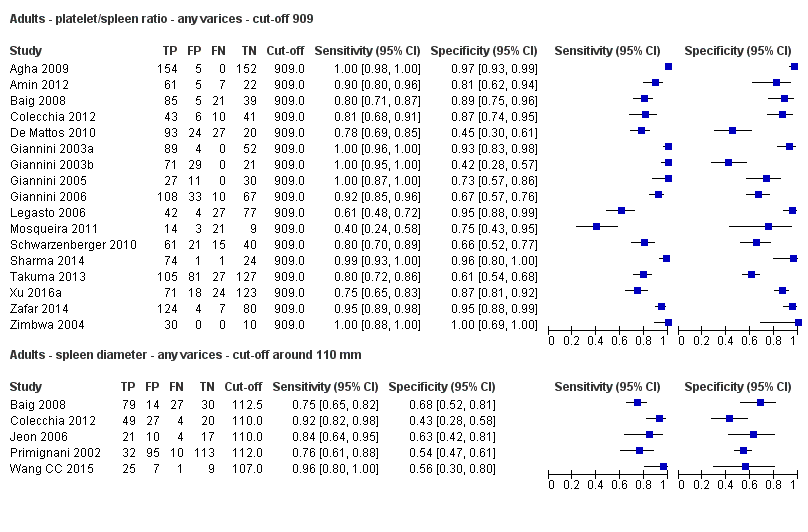
Seventeen studies with 2637 participants provided data using a cut‐off value of 909 (n/mm3)/mm. Sensitivity of the 17 studies varied from 0.40 to 1.00, and specificity from 0.42 to 1.00. By using the bivariate model, we obtained the following estimates: sensitivity 0.93 (95% CI 0.83 to 0.97), specificity 0.84 (95% CI 0.75 to 0.91), LR+ 5.9 (95% CI 3.5 to 9.9), and LR‐ 0.09 (95% CI 0.03 to 0.22) (Figure 11).
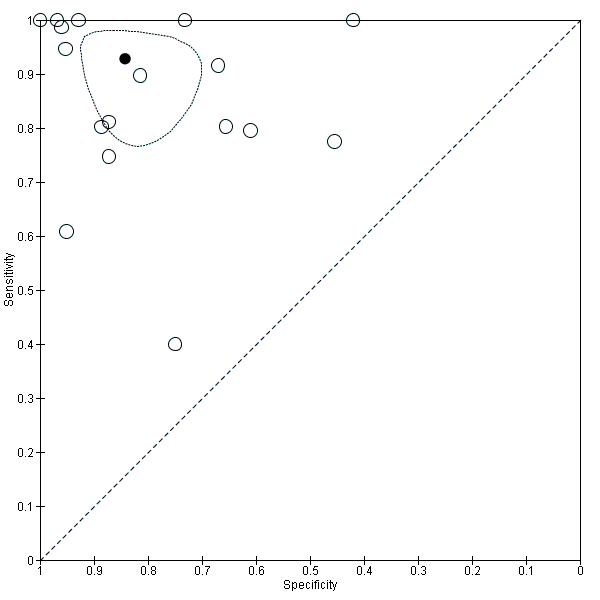
Studies in the ROC space. Adult participants ‐ platelet count‐to‐spleen length ratio. Only studies with a cut‐off value of 909 (n/mm3)/mm ‐ any varices.
Heterogeneity analysis
We investigated effects of sources of heterogeneity among studies using a cut‐off value of 909 (n/mm3)/mm. We found no effect of prevalence of varices, of prevalence of Child A participants, or of aetiology.
Sensitivity analysis
We could not perform the remaining sensitivity analyses, as all studies were cross‐sectional, all but one were at high/unclear risk of bias (Giannini 2006), all but one were published as full text (Zimbwa 2004), and all but one used a prespecified cut‐off value (Giannini 2003a).
Comparative analysis of tests for any varices
Platelet count compared with spleen length
We compared the accuracy of platelet count (25 studies) and spleen length (13 studies) for the presence of any varices (Figure 12) among all included studies (indirect comparisons) using varying cut‐off values. The HSROC model analysis showed a statistically significant result (P = 0.001), suggesting higher overall accuracy of the platelet count test.

Indirect comparison. Forest plot. Adult participants ‐ platelet count compared with spleen length ‐ any varices.
When we compared the 10 studies that reported a cut‐off value of 150,000/mm3 for platelet count with the five studies that reported a cut‐off value of around 110 mm for spleen length (indirect comparison; Figure 13), we observed higher accuracy of platelet count (P = 0.021; Figure 14; Table 1).
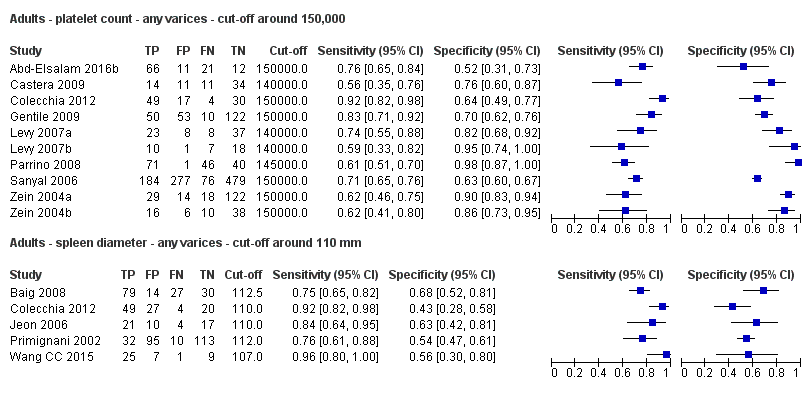
Forest plot. Indirect comparison. Adult participants ‐ platelet count (cut‐off around 150,000) compared with spleen length (cut‐off around 110 mm) ‐ any varices.
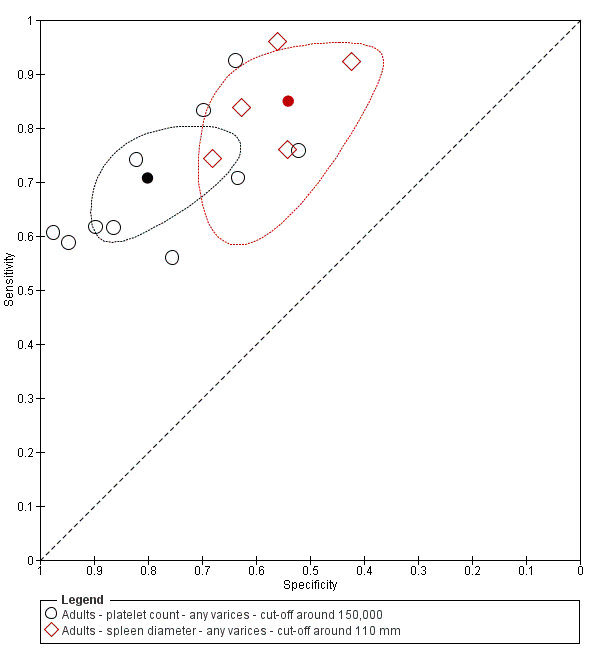
Indirect comparison. Studies in the ROC space. Adult participants ‐ platelet count (cut‐off around 150,000) compared with spleen length (cut‐off around 110 mm) ‐ any varices.
| Any varices ‐ indirect comparisons | |||||
| Index test | No. of studies | Cut‐off value | Sensitivity (95% CI) | Specificity (95% CI) | P value* |
| Platelet count | 10 | Around 150,000/mm3 | 0.71 (0.63 to 0.77) | 0.80 (0.69 to 0.88) | 0.252 |
| Platelet count‐to‐spleen length ratio | 17 | 909 (n/mm3)/mm | 0.93 (0.83 to 0.97) | 0.84 (0.75 to 0.91) | |
| Platelet count | 9 | Around 150,000/mm3 | 0.71 (0.63 to 0.77) | 0.80 (0.69 to 0.88) | 0.021 |
| Spleen length | 5 | Around 110 mm | 0.85 (0.75 to 0.91) | 0.54 (0.46 to 0.62) | |
| Platelet count‐to‐spleen length ratio | 17 | 909 (n/mm3)/mm | 0.93 (0.83 to 0.97) | 0.84 (0.75 to 0.91) | <0.001 |
| Spleen length | 5 | Around 110 mm | 0.85 (0.75 to 0.91) | 0.54 (0.46 to 0.62) | |
* Pair‐wise comparisons between index tests performed by adding the index test as covariate to the bivariate model. P values were obtained by comparing the ‐2 log likelihood of the model with the covariate with the ‐2 log likelihood of the model without the covariate.
Platelet count compared with platelet count‐to‐spleen length ratio
We compared the accuracy of platelet count (25 studies) and platelet count‐to‐spleen length ratio (38 studies) for the presence of any varices among all included studies (indirect comparisons; Figure 15) using varying cut‐off values. The HSROC model analysis showed a statistically significant result (P < 0.001), suggesting higher overall accuracy of the platelet count‐to‐spleen length ratio test. We performed HSROC analysis that was limited to the 10 studies reporting data on both index tests (Figure 16); we again found a statistically significant result favouring the ratio (P = 0.007; direct comparisons).

Indirect comparison. Forest plots. Adult participants ‐ platelet count compared with platelet count‐to‐spleen length ratio ‐ any varices.

Direct comparison. Forest plots. Adult participants ‐ platelet count compared with platelet count‐to‐spleen length ratio ‐ any varices.
On the contrary, when we compared the 17 studies that reported a cut‐off value of 909 (n/mm3)/mm for platelet count‐to‐spleen length ratio with the 10 studies that reported a cut‐off value of around 150,000/mm3 for platelet count (indirect comparison; Figure 17), we observed a non‐statistically significant result (P = 0.252; Figure 18; Table 1). Only one study (Colecchia 2012) provided data for direct comparison.
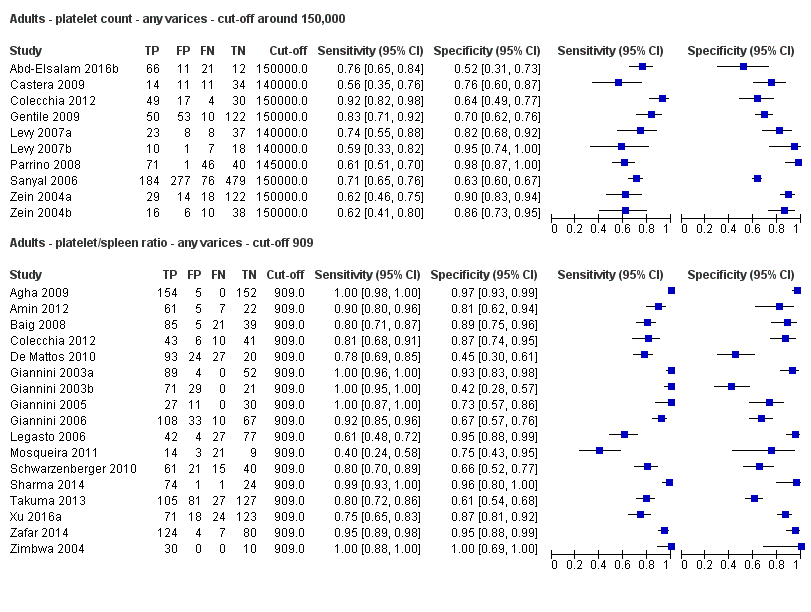
Indirect comparison. Forest plots. Adult participants ‐ platelet count (cut‐off around 150.000/mm3) compared with platelet count‐to‐spleen length ratio (cut‐off 909 (n/mm3)/mm) ‐ any varices.
Indirect comparison. Studies in the ROC space. Adult participants ‐ platelet count (cut‐off around 150.000) compared with platelet count‐to‐spleen length ratio (cut‐off 909 (n/mm3)/mm) ‐ any varices.
Platelet count‐to‐spleen length ratio compared with spleen length
We compared the accuracy of platelet count‐to‐spleen length ratio (38 studies) and spleen length (13 studies) for the presence of any varices among all included studies (indirect comparisons; Figure 19) using varying cut‐off values. The HSROC model analysis showed a statistically significant result (P < 0.001), suggesting higher overall accuracy of the platelet count‐to‐spleen length ratio test .

Indirect comparison. Forest plots. Adult participants ‐ platelet count‐to‐spleen length ratio compared with spleen length ‐ any varices.
When we compared the 17 studies that reported a cut‐off value of 909 (n/mm3)/mm for platelet count‐to‐spleen length ratio with the five studies that reported a cut‐off value of around 110 mm for spleen length (indirect comparison; Figure 20), we observed higher accuracy of platelet count‐to‐spleen length ratio (P < 0.001; Figure 21; Table 1).
Indirect comparison. Forest plots. Adult participants ‐ platelet count‐to‐spleen length ratio (cut‐off 909 (n/mm3)/mm) compared with spleen length (cut‐off around 110) ‐ any varices.

Indirect comparison. Studies in the ROC space. Adult participants ‐ platelet count‐to‐spleen length ratio (cut‐off 909 (n/mm3)/mm) compared with spleen length (cut‐off around 110 mm) ‐ any varices.
Adult participants ‐ high‐risk varices
Platelet count for high‐risk varices
Twenty‐one studies with 4266 participants provided data on assessment of platelet count for the presence of high‐risk varices. The median prevalence of high‐risk varices was 20% (range 4% to 70%). Sensitivity of the 21 studies varied from 0.33 to 1.00, and specificity from 0.39 to 0.87. Cut‐off values ranged from 68,000/mm3 to 160,000/mm3 (Figure 22). We fitted the HSROC model to the 21 studies, and we obtained an estimate of the SROC curve.

Forest plot. Adult participants ‐ platelet count ‐ high‐risk varices.
We carried out two meta‐analyses including only studies that reported a cut‐off value of around 90,000/mm3 and around 150,000/mm3 (Figure 23).

Forest plots. Adult participants ‐ platelet count ‐ various cut‐off values ‐ high‐risk varices.
Cut‐off value of around 90,000/mm3
Eleven studies with 3084 participants provided data using a cut‐off value of around 90,000/mm3 (range 80,000 to 100,000/mm3). Sensitivity of the 11 studies varied from 0.33 to 1.00, and specificity from 0.55 to 0.87. By using the bivariate model, we obtained the following estimates: sensitivity 0.59 (95% CI 0.54 to 0.64), specificity 0.72 (95% CI 0.66 to 0.78), LR+ 2.1 (95% CI 1.8 to 2.6), and LR‐ 0.57 (95% CI 0.52 to 0.63) (Figure 24).

Studies in the ROC space. Adult participants ‐ platelet count ‐ various cut‐off values ‐ high‐risk varices.
Cut‐off value of around 150,000/mm3
Seven studies with 1671 participants provided data using a cut‐off value of around 150,000/mm3 (range 140,000 to 160,000/mm3). Sensitivity of the seven studies varied from 0.73 to 0.90, and specificity from 0.39 to 0.82. By using the bivariate model, we obtained the following estimates: sensitivity 0.80 (95% CI 0.73 to 0.85), specificity 0.68 (95% CI 0.57 to 0.77), LR+ 2.5 (95% CI 1.8 to 3.3), and LR‐ 0.30 (95% CI 0.23 to 0.39) (Figure 24).
Heterogeneity analysis
We could not assess effects of sources of heterogeneity among studies with a cut‐off value of around 150,000/mm3, as the models failed to converge owing to the small number of studies.
Sensitivity analysis
For studies with a cut‐off value of around 150,000/mm3, we could not perform the sensitivity analysis, as all studies were cross‐sectional, all were at high/unclear risk of bias, all were published as full text, and only two reported a prespecified cut‐off value.
Spleen length for high‐risk varices
Six studies with 883 participants provided data on assessmentof spleen length for the presence of high‐risk varices. The median prevalence of high‐risk varices was 42% (range 13% to 70%). Sensitivity of the six studies varied from 0.50 to 0.88, and specificity from 0.55 to 0.84. Cut‐off values ranged from 120 mm to 160 mm (Figure 25). We used the HSROC model to obtain an estimate of the SROC curve.

Forest plot. Adult participants ‐ spleen length ‐ high‐risk varices.
Heterogeneity analysis
We found no effects of aetiology. We could not assess effects of Child A and of prevalence of varices, as the models failed to converge owing to the small number of studies.
Sensitivity analysis
We could not perform sensitivity analyses because all studies were cross‐sectional, all were at high/unclear risk of bias, all were published as full text, and only two reported a prespecified cut‐off value.
Platelet count‐to‐spleen length ratio for high‐risk varices
Ten studies with 930 participants provided data for assessment of platelet count‐to‐spleen length ratio for the presence of high‐risk varices. The median prevalence of high‐risk varices was 47% (range 15% to 70%). Sensitivity of the 10 studies varied from 0.50 to 1.00, and specificity from 0.29 to 0.84. Cut‐off values ranged from 870 to 1372 (n/mm3)/mm.(Figure 26).

Forest plot. Adult participants ‐ platelet count‐to‐spleen length ratio ‐ high‐risk varices.
Cut‐off value of around 909 (n/mm3)/mm
Seven studies with 642 participants provided data with a cut‐off value of around 909 (n/mm3)/mm (range 897 to 921 n/mm3/mm; Figure 27). Sensitivity of the seven studies varied from 0.50 to 0.97, and specificity from 0.40 to 0.84. By using the bivariate model, we obtained the following estimates: sensitivity 0.85 (95% CI 0.72 to 0.93), specificity 0.66 (95% CI 0.52 to 0.77), LR+ 2.5 (95% CI 1.8 to 3.4), and LR‐ 0.22 (95% CI 0.12 to 0.42) (Figure 28).

Forest plot. Adult participants ‐ platelet count‐to‐spleen length ratio ‐ cut‐off around 909 (n/mm3)/mm ‐ high‐risk varices.
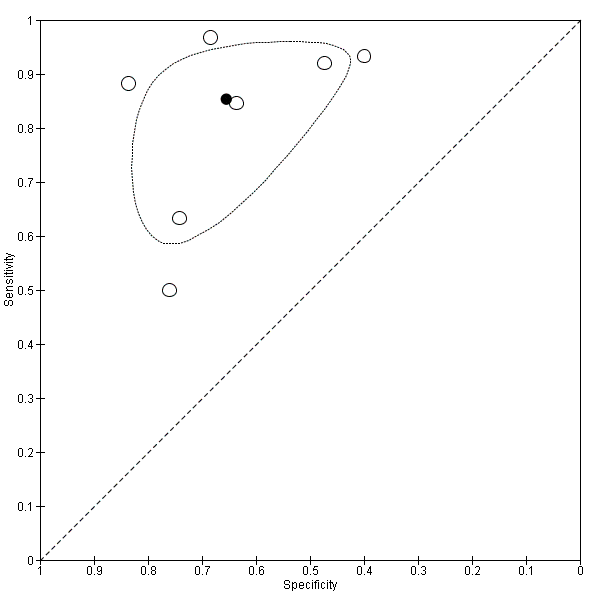
Studies in the ROC space. Adult participants ‐ platelet count‐to‐spleen length ratio ‐ cut‐off around 909 (n/mm3)/mm ‐ high‐risk varices.
Heterogeneity analysis
We investigated effects of sources of heterogeneity among studies with a cut‐off value of 909 (n/mm3)/mm. We found no effect of prevalence of varices nor of aetiology. We could not assess the effect of Child A (≤ 50% vs > 50%), as the models failed to converge owing to the small number of studies.
Sensitivity analysis
Among studies with a cut‐off value of around 909 (n/mm3)/mm, and when considering only those that reported a prespecified cut‐off value, we obtained sensitivity of 0.82 (95% CI 0.55 to 0.94) and specificity of 0.71 (95% CI 0.49 to 0.86). We could not perform the remaining sensitivity analyses because all studies were cross‐sectional, all were at high/unclear risk of bias, and all were published as full text.
Comparative analysis of tests for high‐risk varices
Platelet count compared with spleen length
We fitted the HSROC model to compare the accuracy of platelet count (21 studies) and spleen length (six studies) for the presence of high‐risk varices among all included studies (indirect comparisons; Figure 29), irrespective of the cut‐off value. We observed a non‐statistically significant result (P = 0.304).

Indirect comparison. Forest plot. Adult participants ‐ platelet count compared with spleen length ‐ high‐risk varices.
Platelet count compared with platelet count‐to‐spleen length ratio
We compared the accuracy of platelet count (21 studies) and platelet count‐to‐spleen length ratio (10 studies) for the presence of high‐risk varices among all included studies (indirect comparisons; Figure 30). The HSROC model analysis showed a statistically significant result (P = 0.003), suggesting higher overall accuracy of platelet count‐to‐spleen length ratio. We confirmed this result when we performed HSROC analysis limited to the five studies reporting data on both index tests (direct comparisons; P = 0.034) (Figure 31).
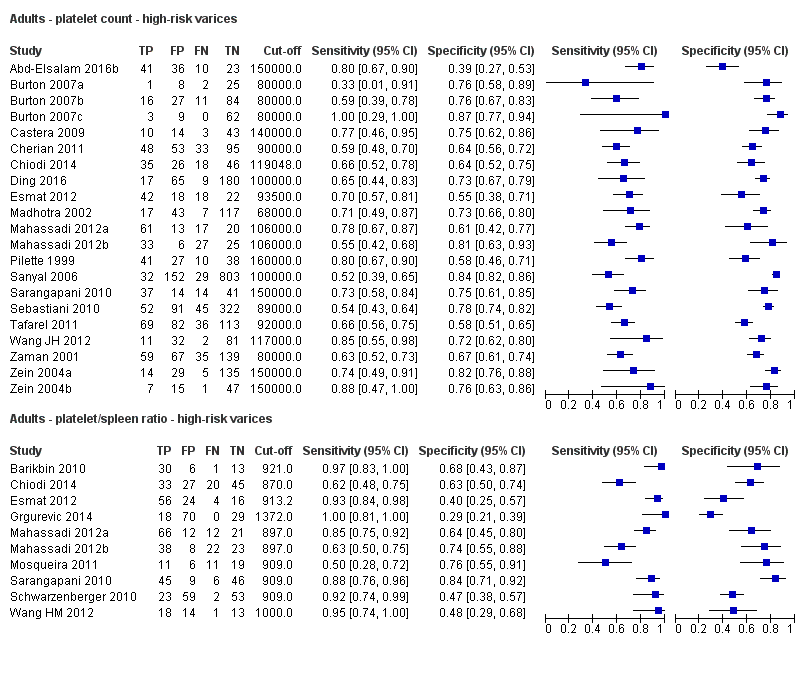
Indirect comparison. Forest plots. Adult participants ‐ platelet count compared with platelet count‐to‐spleen length ratio ‐ high‐risk varices.

Direct comparison. Forest plots. Adult participants ‐ platelet count compared with platelet count‐to‐spleen length ratio ‐ high‐risk varices.
When we compared the seven studies that reported a cut‐off value of 909 (n/mm3)/mm for platelet count‐to‐spleen length ratio with the seven studies that reported a cut‐off value of 150,000/mm3 for platelet count, we observed a non‐statistically significant result (indirect comparison, bivariate model; P = 0.638) (Figure 32; Figure 33). Only one study reported data on both tests (Sarangapani 2010).

Indirect comparison. Forest plots. Adult participants ‐ platelet count (cut‐off around 150.000/mm3) compared with platelet count‐to‐spleen length ratio (cut‐off 909 (n/mm3)/mm) ‐ high‐risk varices.

Indirect comparison. Studies in the ROC space. Adult participants ‐ platelet count (cut‐off around 150,000/mm3) compared with platelet count‐to‐spleen length ratio (cut‐off 909 (n/mm3)/mm) ‐ high‐risk varices.
Platelet count‐to‐spleen length ratio compared with spleen length
Finally, when we compared the accuracy of spleen length (six studies) and platelet count‐to‐spleen length ratio (10 studies) for the presence of high‐risk varices among all included studies (indirect comparisons; Figure 34), we observed a statistically significant difference between the two tests (P < 0.001), suggesting higher accuracy of platelet count‐to‐spleen length ratio.
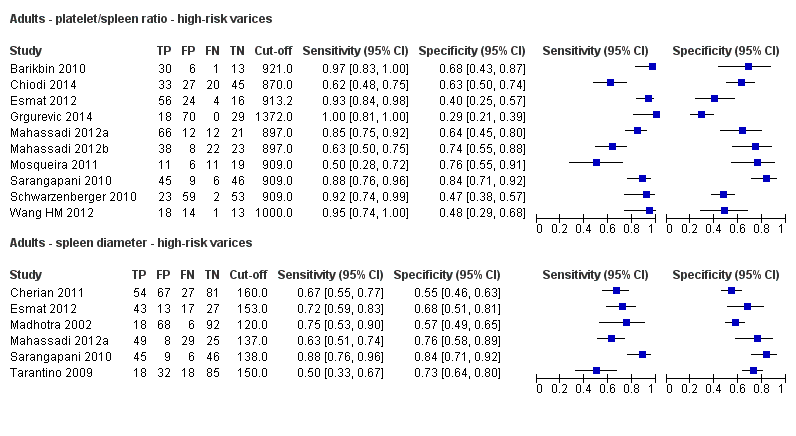
Indirect comparison. Forest plots. Adult participants ‐ platelet count‐to‐spleen length ratio compared with spleen length ‐ high‐risk varices.
Paediatric participants ‐ any varices
We found four studies including 277 paediatric participants with different types of liver disease and/or portal vein thrombosis (Colecchia 2011; Gana 2011; Alcantara 2012; Adami 2013).
Platelet count for any varices
Four studies with 277 paediatric participants provided data on assessment of platelet count for the presence of any varices. Cut‐off values used by the four studies were 115,000/mm3 (three studies) and 119,000/mm3 (one study). Sensitivity of platelet count for diagnosis of oesophageal varices of any size ranged from 0.53 to 0.81, and specificity from 0.71 to 0.94 (Figure 35). We fitted the bivariate model to the four studies, and we obtained the following estimates: sensitivity 0.71 (95% CI 0.60 to 0.80), specificity 0.83 (95% CI 0.70 to 0.91), LR+ 4.2 (95% CI 2.4 to 7.3), and LR‐ 0.35 (95% CI 0.25 to 0.48).

Forest plot. Paediatric participants ‐ platelet count ‐ any varices.
Spleen length z‐score for any varices
We found no studies reporting results of spleen length z‐score for any varices.
Platelet count‐to‐spleen length z‐score ratio for any varices
Two studies with 197 paediatric participants provided data on assessment of platelet count‐to‐spleen length ratio for the presence of any varices. Cut‐off values used by the two studies were 24 and 25. Sensitivities reported by the two studies were 0.69 and 0.82, and specificities 0.79 and 0.53 (Figure 36). We fitted the bivariate model, and we obtained the following estimates: sensitivity 0.74 (95% CI 0.65 to 0.81), specificity 0.64 (95% CI 0.36 to 0.85), LR+ 2.0 (95% CI 1.0 to 4.0), and LR‐ 0.41 (95% CI 0.27 to 0.61).

Forest plot. Paediatric participants ‐ platelet count‐to‐spleen length z‐score ratio ‐ any varices.
Discussion
Summary of main results
We included 71 studies, 67 of which enrolled only adults and four only children. We considered and analysed these four paediatric studies separately because they enrolled only paediatric patients with a different spectrum of the liver disease.
For adults, all included studies were undertaken in a secondary/tertiary care setting, and studies reported a wide range of prevalences of oesophageal varices ‐ both varices of any size and high‐risk varices. We considered all but one of the included studies to be at high risk of bias. We had major concerns about the predefinition of the cut‐off value for the three index tests: Most included studies derived a posteriori the best cut‐off values, overestimating accuracy. Only 10 studies assessed a predefined cut‐off value of platelet count, and only 16 were designed to validate the 909 (n/mm3)/mm cut‐off value for platelet count‐to‐spleen length ratio.
Platelet count‐to‐spleen length ratio seems the most accurate test ‐ more accurate than simple platelet count or spleen length measurement for the diagnosis of varices of any size or high‐risk varices. As expected, combining two measurements in a ratio improved accuracy: For portal hypertension, platelet count (numerator) decreases and spleen length (denominator) increases.
Estimates of sensitivity and specificity obtained by the bivariate model are reported in the 'Summary of findings' tables (summary of findings Table 1; summary of findings Table 2; summary of findings Table 3; summary of findings Table 4; summary of findings Table 5).
For the 17 studies assessing ratio of platelet count to spleen length using the cut‐off value of 909 (n/mm3)/mm for the diagnosis of varices of any size, sensitivity was 0.93 and specificity 0.84 (Table 2), whereas for high‐risk varices, accuracy was lower: sensitivity 0.85 and specificity 0.66. We found some heterogeneity of results that was not due to a threshold effect, as the same cut‐off value was used. Moreover, we found no effect of other explored factors: aetiology, severity of liver disease (Child class), and prevalence of the target disease.
| Pooled results | |||||
| Cut‐off | Sensitivity (95% CI) | Specificity (95% CI) | LR+ (95% CI) | LR‐ (95% CI) | |
| Any varices | |||||
| Platelet count | Around 100,000 | 0.57 (0.50 to 0.64) | 0.75 (0.67 to 0.82) | 2.3 (1.7 to 3.1) | 0.57 (0.49 to 0.67) |
| Around 120,000 | 0.77 (0.72 to 0.81) | 0.69 (0.57 to 0.78) | 2.4 (1.7 to 3.5) | 0.34 (0.26 to 0.44) | |
| Around 150,000 | 0.71 (0.63 to 0.77) | 0.80 (0.69 to 0.88) | 3.6 (2.4 to 5.4) | 0.37 (0.30 to 0.45) | |
| Spleen length | Around 110 mm | 0.85 (0.75 to 0.91) | 0.54 (0.46 to 0.62) | 1.8 (1.6 to 2.1) | 0.28 (0.17 to 0.44) |
| Around 150 mm | 0.57 (0.41 to 0.71) | 0.82 (0.72 to 0.89) | 3.2 (2.3 to 4.4) | 0.53 (0.39 to 0.72) | |
| Platelet count‐to‐spleen length ratio | 909 (n/mm3)/mm | 0.93 (0.83 to 0.97) | 0.84 (0.75 to 0.91) | 5.9 (3.5 to 9.9) | 0.09 (0.03 to 0.22) |
| High‐risk varices | |||||
| Platelet count | Around 90,000 | 0.59 (0.54 to 0.64) | 0.72 (0.66 to 0.78) | 2.1 (1.8 to 2.6) | 0.57 (0.52 to 0.63) |
| Around 150,000 | 0.80 (0.73 to 0.85) | 0.68 (0.57 to 0.77) | 2.5 (1.8 to 3.3) | 0.30 (0.23 to 0.39) | |
| Spleen length | ‐ | ‐ | ‐ | ‐ | ‐ |
| Platelet count‐to‐spleen length ratio | Around 909 (n/mm3)/mm | 0.85 (0.72 to 0.93) | 0.66 (0.52 to 0.77) | 2.5 (1.8 to 3.4) | 0.22 (0.12 to 0.42) |
For platelet count, accuracy estimates varied according to the different cut‐off values used in the included studies (Table 2). A low platelet count is associated with portal hypertension, and hence with oesophageal varices. As expected, with use of 120,000/mm3 instead of 100,000/mm3 as a cut‐off value, sensitivity increased and specificity decreased. In contrast, when the highest value of 150,000/mm3 was used, sensitivity decreased and specificity increased unexpectedly. Furthermore, we found an effect of aetiology of liver disease (chronic hepatitis C vs other or mixed aetiologies), but other factors such as prevalence of varices or severity of liver disease (proportion of Child A) showed no effect on accuracy.
A large spleen is associated with portal hypertension, and a higher cut‐off value (150 mm vs 110 mm) showed, as expected, lower sensitivity and higher specificity (Table 2). We found no effect of the other explored sources of heterogeneity.
Platelet count‐to‐spleen length ratio is a simple and inexpensive test that is available for all patients with cirrhosis at the moment of diagnosis and at any follow‐up control. Its accuracy allows the clinician to identify a patient with low risk of oesophageal varices. With assumption of prevalence of 58%, which is the median of the included studies and is close to the expected value of 50% in compensated cirrhosis (Garcia‐Tsao 2007), only 10% will be false negative (summary of findings Table 3). These patients, in the case of varices of any size, would miss an adequate follow‐up, and, in the case of high risk of bleeding varices, would miss an effective prophylaxis. As the proportion of high‐risk varices at the moment of first detection in compensated cirrhosis is lower than 30%, only about 3% of these patients should actually lose the opportunity of receiving effective treatment. When a non‐invasive test is used for screening oesophageal varices, a recent consensus conference defined as acceptable and safe a proportion of less than 5% of false negative results in the case of high‐risk varices requiring prophylaxis (de Franchis 2015; Abraldes 2016). On the other hand, as shown in summary of findings Table 3, in the case of prevalence of high‐risk varices of 60%, platelet count‐to‐spleen length ratio seems inadequate for ruling out or ruling in the presence of high‐risk varices, as 15% of patients with high‐risk varices would be missed and 21% of patients with a positive test result would be false positive and consequently overtreated. Finally, if this test is used as a triage test, 394 out of 1000 adults could avoid upper endoscopy, and only 10% would be false negatives for the diagnosis of varices of any size.
Assessment of any new non‐invasive test should take into account that platelet count‐to‐spleen length ratio is an accurate and widely available test not requiring additional costs at the moment of diagnosis of cirrhosis. It can also be combined with other tests such as liver stiffness or spleen stiffness measurement by transient elastography, or other techniques. Liver stiffness is widely used and, at least in cases of chronic hepatitis C, can replace histology for the diagnosis of cirrhosis, with high values predicting the presence of portal hypertension. Its accuracy can be further increased by combining liver stiffness measurements with platelet count (Abraldes 2016; de Franchis 2015), or hypothetically with platelet count‐to‐spleen length ratio.
Finally, from the four paediatric studies that considered platelet count (including 294 paediatric participants with different types of liver disease and/or portal vein thrombosis), we obtained estimates of sensitivity 0.71 and specificity of 0.83. These four studies used similar, not predefined, cut‐off values (range 115,000 to 119,000/mm3). Given that spleen length in paediatric patients changes with age, we included and analysed for the index tests of spleen length and platelet count‐to‐spleen length ratio only studies that expressed spleen size in a way that corrects for expected changes for age (z‐score). We found two studies with 197 paediatric participants that assessed the platelet count‐to‐spleen length z‐score ratio, using cut‐off values of 24 and 25, and we obtained estimates of sensitivity (0.74) and specificity (0.64). We found no studies assessing the accuracy of spleen length z‐score.
Strengths and weaknesses of the review
We aimed to assess the accuracy of three index tests for the diagnosis of oesophageal varices and included 71 studies that were conducted in many countries, showed widespread implementation globally of the index tests, and confirmed the clinical relevance of this review question. We identified four studies through manual searching of non‐indexed journals and are confident that we have included most, if not all, of the includable published studies. We also assessed the accuracy of the index tests to detect varices that are at high risk of bleeding, which provide the main clinical reason for screening cirrhotic patients with endoscopy. Moreover, the included studies allowed comparison of the accuracies of the three index tests.
An overall quality assessment of the studies showed several common methodological weaknesses, and we considered only one study to have low risk of bias. Most studies derived "a posteriori" the optimal cut‐off value with consequent overestimation of accuracy. Furthermore, in many instances, study reporting was incomplete, and investigators provided no information about consecutive enrolment and blinding of the reference standard. Prevalence of the target disease varied widely, suggesting different inclusion criteria, with participants enrolled not only at the time of diagnosis of cirrhosis, but also during follow‐up; and non‐consecutive enrolment, with retrospective selection based on available data. Anyway, the median prevalence of varices of any size was close to the expected value of around 50%. In contrast, prevalence of high‐risk varices was much higher than expected, suggesting that the index test was used not at the time of diagnosis of cirrhosis, but later, to monitor the development of complications.
Despite the large numbers of included studies and participants, estimates of accuracy were imprecise, and results of included studies were not consistent. This heterogeneity could be explained only in part by the use of different cut‐off values. Sources of this heterogeneity remained unexplained, even after inspection of the most likely explanatory variables, such as different severity and aetiology of liver disease and different prevalence of oesophageal varices. However, for the index test platelet count‐to‐spleen length ratio, we found 17 studies (with 2637 participants) that used the same cut‐off value: one derivation study and 16 validation studies. Through meta‐analysis of the results of these studies, we obtained consistent estimates of sensitivity and specificity, which could support the use of platelet count‐to‐spleen length ratio with this cut‐off to rule out the presence of varices in adults with cirrhosis.
Available data prevent proper comparison of accuracy through direct comparison of the three index tests, each with the same predefined cut‐off value. The included studies mainly allowed indirect comparisons, and in the case of direct comparisons, different cut‐off values were used across studies, preventing clear interpretation of results.
Another possible limitation of the review is that the reference standard for diagnosis and staging of oesophageal varices is not perfect. In fact, interobserver agreement in interpretation of oesophago‐gastro‐duodenoscopy findings is unfortunately well below that desired for an ideal reference standard (Cales 1989; Bendtsen 1990; Winkfield 2003). This poor reproducibility of the reference standard could impair the accuracy estimation of the index tests. Furthermore, included studies assessed the accuracy of index tests in diagnosing varices of any size or large oesophageal varices or both, but they did not directly assess bleeding risk by measuring actual bleeding outcomes. Thus, these studies could not answer directly the question of whether these index tests can predict bleeding or can properly indicate which people might benefit from primary prophylactic treatment.
We found two reviews on the same topic, both assessing the accuracy of platelet count‐to‐spleen length ratio (Chawla 2012; Ying 2012). One of these reviews considered only studies assessing the accuracy of the ratio with the predefined cut‐off value of 909 (n/mm3)/mm and included only eight studies (Chawla 2012). We found and included nine additional studies that validated this cut‐off. The other review (Ying 2012) included 20 studies assessing the accuracy of the ratio on the basis of all cut‐off values. In our review, we found 18 additional studies. Furthermore, in both reviews, the statistical approach was not the most appropriate, as neither bivariate nor hierarchical summary receiver operating characteristic (HSROC) models were used.
Applicability of findings to the review question
The accuracy of platelet count, spleen length, and platelet count‐to‐spleen length ratio in detecting the presence of oesophageal varices has been, with the limitations noted above, addressed in a tertiary care setting and in adult patients with suspected cirrhosis mainly due to chronic viral hepatitis or alcoholic liver disease. It is uncertain how applicable these results may be to other specific patient groups, such as those with cholestatic disease or portal vein thrombosis, children with liver disease, or patients in other settings.

Study flow diagram.

Methodological quality of the 71 included studies.

Quality assessment summary: review authors' judgements about each risk of bias item for each included study.
Not all of the included studies considered all three index tests. Cells are empty when an index test was not considered in a study.

Forest plot. Adult participants ‐ platelet count ‐ any varices.

Forest plots. Adult participants ‐ platetelet count ‐ various cut‐off values ‐ any varices.

Studies in the ROC space. Adult participants ‐ platelet count ‐ various cut‐off values ‐ any varices.

Forest plot. Adult participants ‐ spleen length ‐ any varices.

Forest plots. Adult participants ‐ spleen length ‐ any varices: various cut‐off values.

Studies in the ROC space. Adult participants ‐ spleen length ‐ any varices: various cut‐off values.

Forest plot. Adult participants ‐ platelet count‐to‐spleen length ratio ‐ any varices.

Studies in the ROC space. Adult participants ‐ platelet count‐to‐spleen length ratio. Only studies with a cut‐off value of 909 (n/mm3)/mm ‐ any varices.

Indirect comparison. Forest plot. Adult participants ‐ platelet count compared with spleen length ‐ any varices.

Forest plot. Indirect comparison. Adult participants ‐ platelet count (cut‐off around 150,000) compared with spleen length (cut‐off around 110 mm) ‐ any varices.

Indirect comparison. Studies in the ROC space. Adult participants ‐ platelet count (cut‐off around 150,000) compared with spleen length (cut‐off around 110 mm) ‐ any varices.
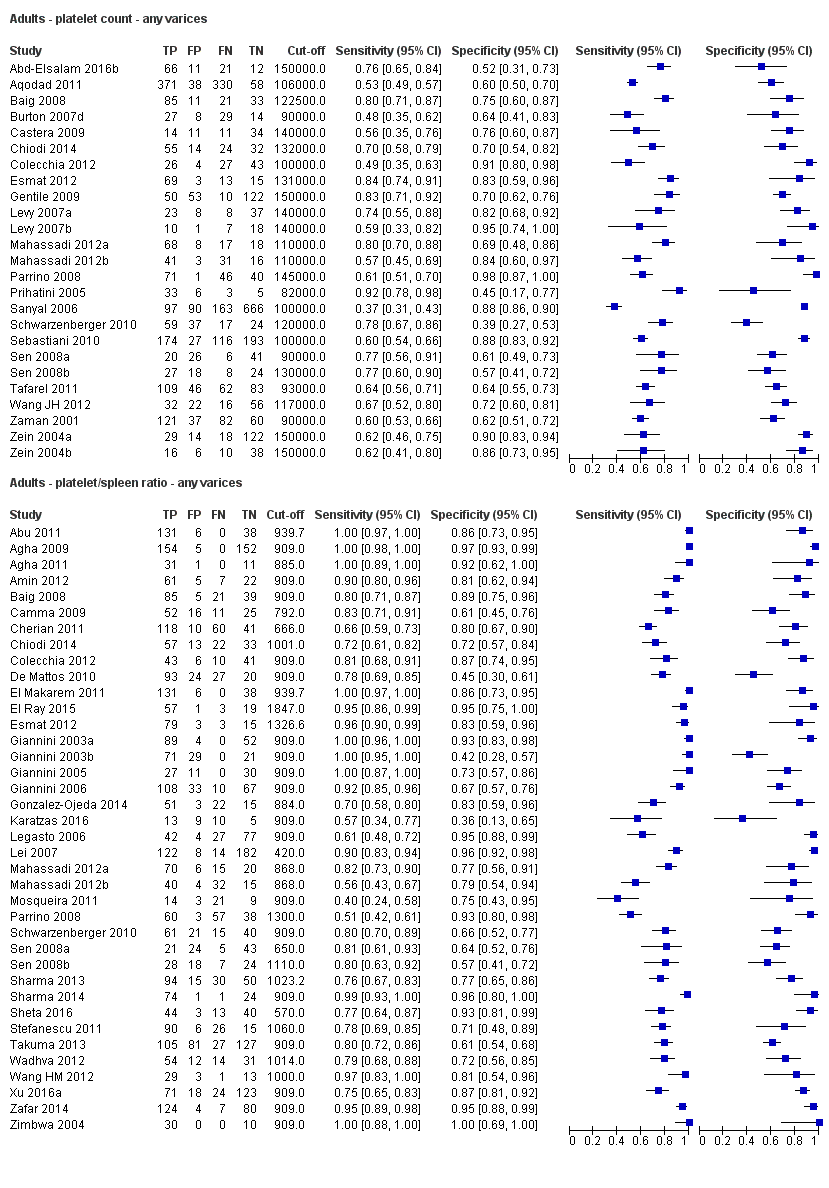
Indirect comparison. Forest plots. Adult participants ‐ platelet count compared with platelet count‐to‐spleen length ratio ‐ any varices.
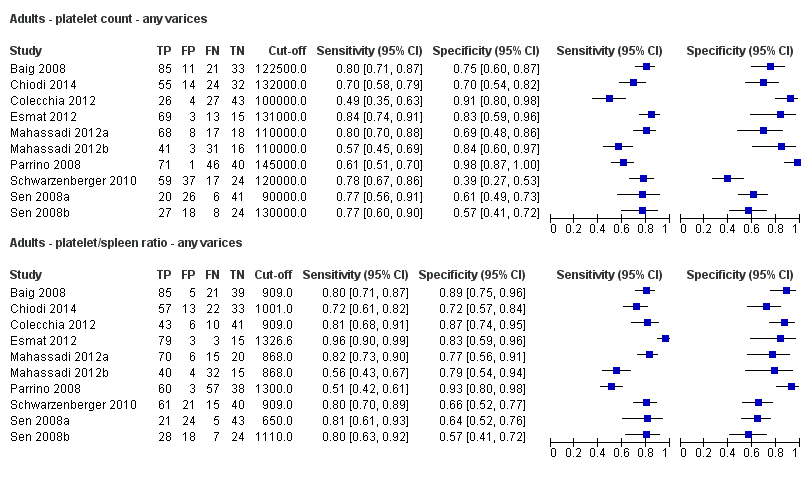
Direct comparison. Forest plots. Adult participants ‐ platelet count compared with platelet count‐to‐spleen length ratio ‐ any varices.

Indirect comparison. Forest plots. Adult participants ‐ platelet count (cut‐off around 150.000/mm3) compared with platelet count‐to‐spleen length ratio (cut‐off 909 (n/mm3)/mm) ‐ any varices.

Indirect comparison. Studies in the ROC space. Adult participants ‐ platelet count (cut‐off around 150.000) compared with platelet count‐to‐spleen length ratio (cut‐off 909 (n/mm3)/mm) ‐ any varices.
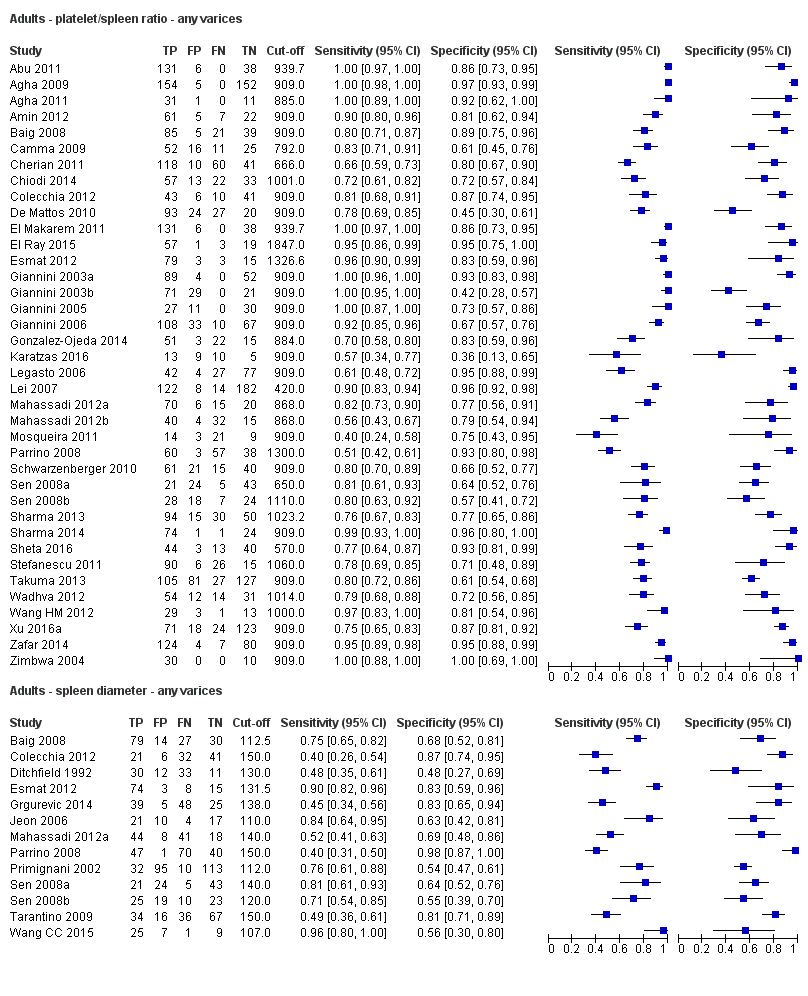
Indirect comparison. Forest plots. Adult participants ‐ platelet count‐to‐spleen length ratio compared with spleen length ‐ any varices.

Indirect comparison. Forest plots. Adult participants ‐ platelet count‐to‐spleen length ratio (cut‐off 909 (n/mm3)/mm) compared with spleen length (cut‐off around 110) ‐ any varices.

Indirect comparison. Studies in the ROC space. Adult participants ‐ platelet count‐to‐spleen length ratio (cut‐off 909 (n/mm3)/mm) compared with spleen length (cut‐off around 110 mm) ‐ any varices.

Forest plot. Adult participants ‐ platelet count ‐ high‐risk varices.
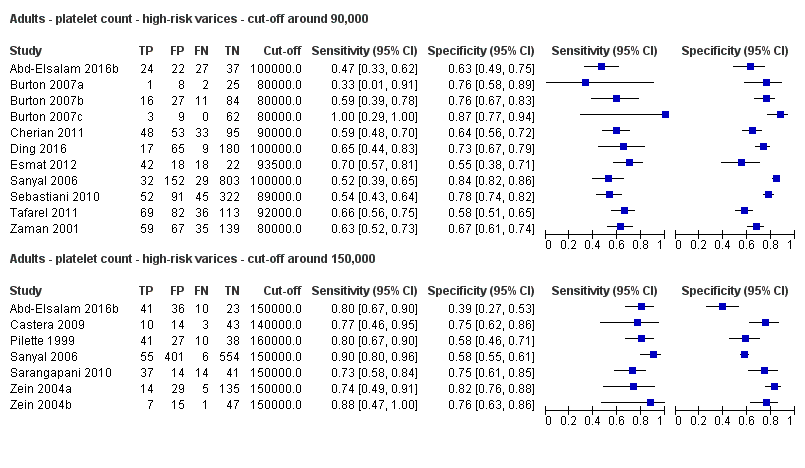
Forest plots. Adult participants ‐ platelet count ‐ various cut‐off values ‐ high‐risk varices.
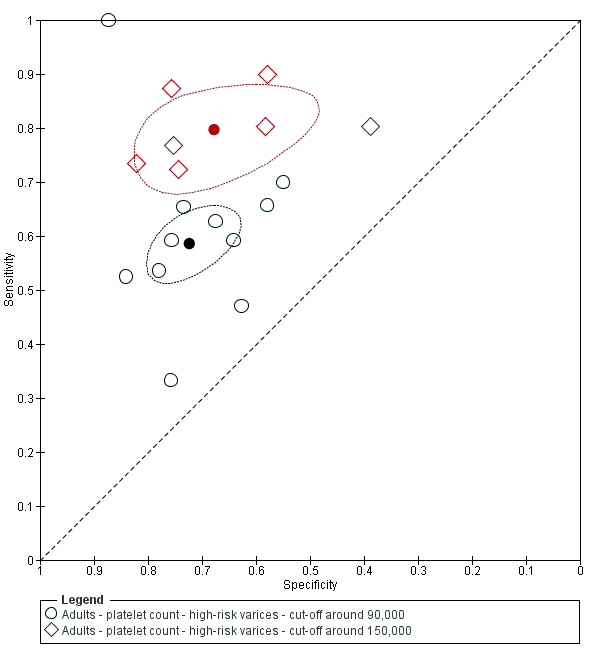
Studies in the ROC space. Adult participants ‐ platelet count ‐ various cut‐off values ‐ high‐risk varices.
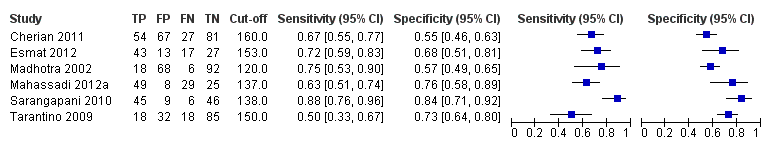
Forest plot. Adult participants ‐ spleen length ‐ high‐risk varices.

Forest plot. Adult participants ‐ platelet count‐to‐spleen length ratio ‐ high‐risk varices.
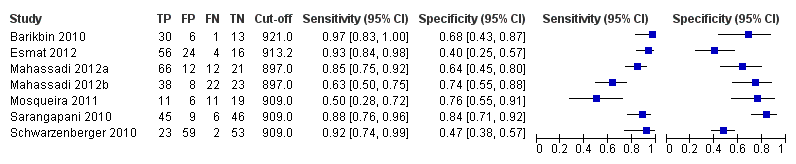
Forest plot. Adult participants ‐ platelet count‐to‐spleen length ratio ‐ cut‐off around 909 (n/mm3)/mm ‐ high‐risk varices.

Studies in the ROC space. Adult participants ‐ platelet count‐to‐spleen length ratio ‐ cut‐off around 909 (n/mm3)/mm ‐ high‐risk varices.
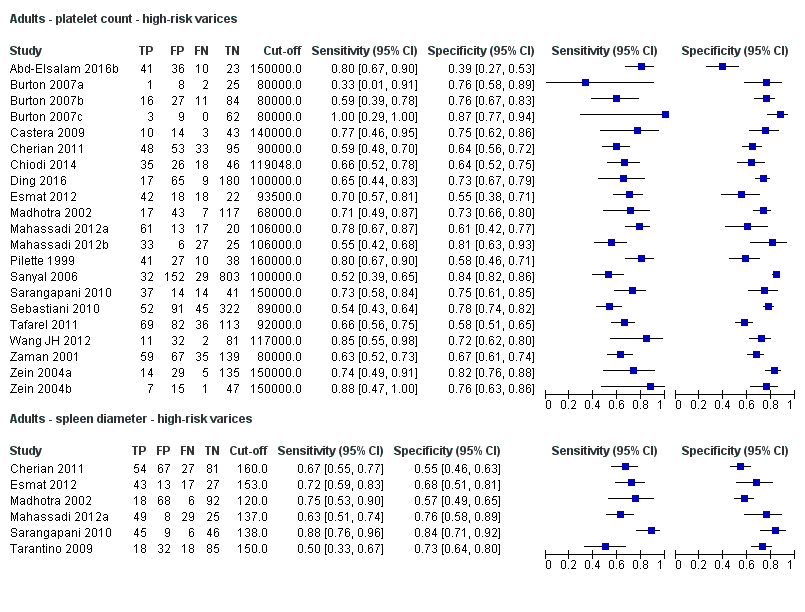
Indirect comparison. Forest plot. Adult participants ‐ platelet count compared with spleen length ‐ high‐risk varices.

Indirect comparison. Forest plots. Adult participants ‐ platelet count compared with platelet count‐to‐spleen length ratio ‐ high‐risk varices.

Direct comparison. Forest plots. Adult participants ‐ platelet count compared with platelet count‐to‐spleen length ratio ‐ high‐risk varices.

Indirect comparison. Forest plots. Adult participants ‐ platelet count (cut‐off around 150.000/mm3) compared with platelet count‐to‐spleen length ratio (cut‐off 909 (n/mm3)/mm) ‐ high‐risk varices.

Indirect comparison. Studies in the ROC space. Adult participants ‐ platelet count (cut‐off around 150,000/mm3) compared with platelet count‐to‐spleen length ratio (cut‐off 909 (n/mm3)/mm) ‐ high‐risk varices.

Indirect comparison. Forest plots. Adult participants ‐ platelet count‐to‐spleen length ratio compared with spleen length ‐ high‐risk varices.
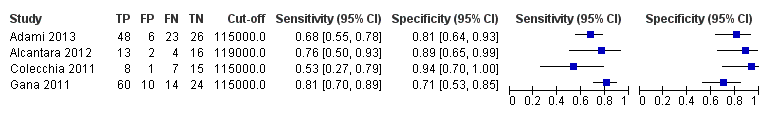
Forest plot. Paediatric participants ‐ platelet count ‐ any varices.

Forest plot. Paediatric participants ‐ platelet count‐to‐spleen length z‐score ratio ‐ any varices.

Adults ‐ platelet count ‐ any varices.

Adults ‐ platelet count ‐ any varices ‐ cut‐off around 100,000.

Adults ‐ platelet count ‐ any varices ‐ cut‐off around 120,000.

Adults ‐ platelet count ‐ any varices ‐ cut‐off around 150,000.
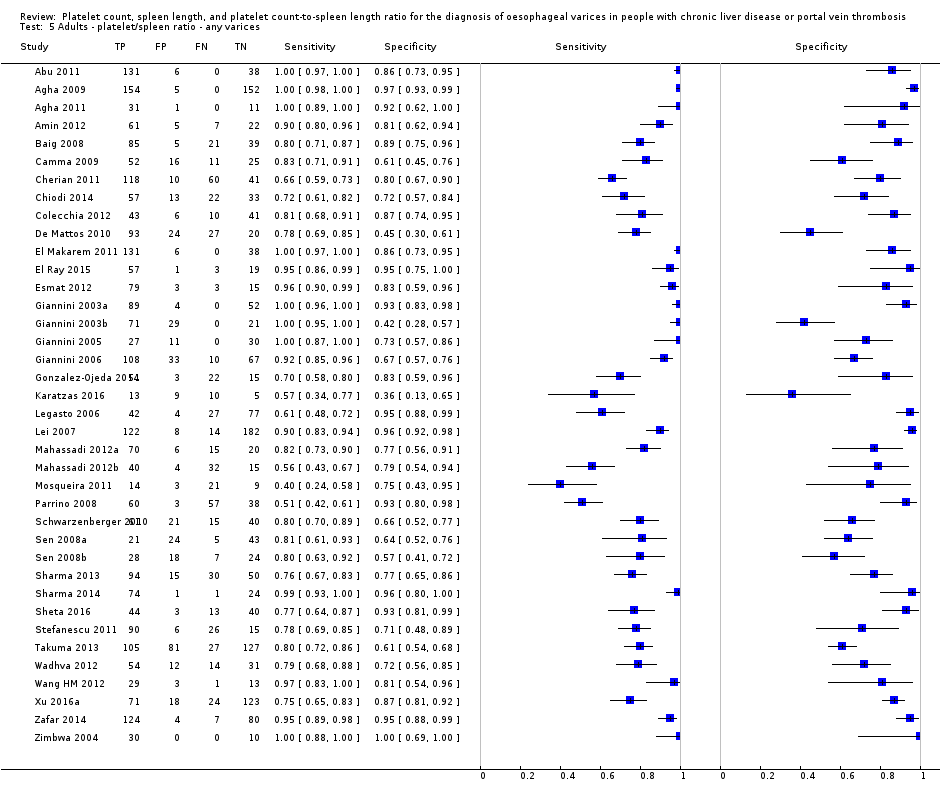
Adults ‐ platelet/spleen ratio ‐ any varices.

Adults ‐ platelet/spleen ratio ‐ any varices ‐ cut‐off 909.

Adults ‐ spleen diameter ‐ any varices.

Adults ‐ spleen diameter ‐ any varices ‐ cut‐off around 110 mm.

Adults ‐ spleen diameter ‐ any varices ‐ cut‐off around 150 mm.
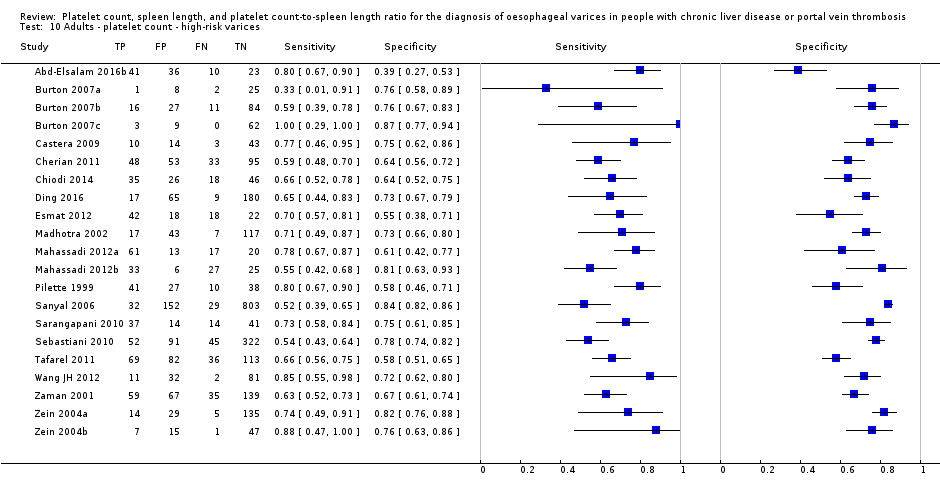
Adults ‐ platelet count ‐ high‐risk varices.

Adults ‐ platelet count ‐ high‐risk varices ‐ cut‐off around 90,000.

Adults ‐ platelet count ‐ high‐risk varices ‐ cut‐off around 150,000.

Adults ‐ platelet/spleen ratio ‐ high‐risk varices.
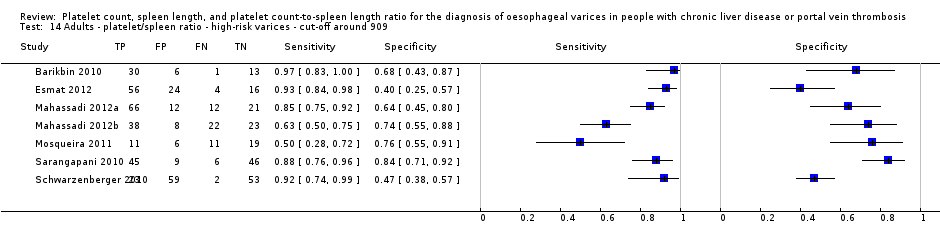
Adults ‐ platelet/spleen ratio ‐ high‐risk varices ‐ cut‐off around 909.
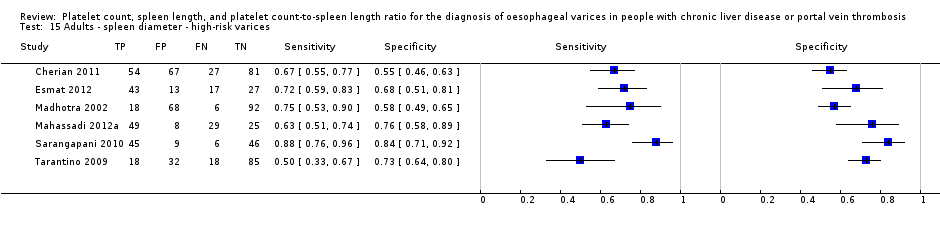
Adults ‐ spleen diameter ‐ high‐risk varices.

Paediatrics ‐ platelet count ‐ any varices.

Paediatrics ‐ platelet/spleen ratio z‐score ‐ any varices.
| Review question | What is the diagnostic accuracy of platelet count for the diagnosis of oesophageal varices in adults with liver disease or portal vein thrombosis? | |||||
| Population | Adults with diagnosis of chronic liver disease or portal vein thrombosis. Age ≥ 18 years | |||||
| Settings | Outpatients and inpatients in secondary/tertiary care setting | |||||
| Study design | Prospective and retrospective cross‐sectional studies. No case‐control studies were found | |||||
| Index tests | Platelet count | |||||
| Reference standards | Upper endoscopy | |||||
| Target condition | Summary accuracy (95% CI) | No. of participants (studies) | Prevalence, Median (range ) | Implications in a hypothetical cohort of 1000 people | Post‐test probability | Quality and comments |
| Any varices Cut‐off value: around 150,000 /mm3 (range 140,000 to 150,000/mm3) | Sensitivity 0.71 (0.63 to 0.77) Specificity 0.80 (0.69 to 0.88) LR+ 3.6 LR‐ 0.37 | 2054 participants (10) | 38% | With a prevalence of 38%, 380 out of 1000 people will have varices of any size. Of these 380 people, 110 (29% of 380) people with varices will receive misdiagnosis and will not received appropriate prophylaxis or follow‐up The remaining 620 people will have no varices. 124 people (20% of 620) will receive false diagnosis of varices and will undergo an unnecessary endoscopy | Assuming a pretest probability of 38% Post‐test probabilities:
| Most studies are at high risk of bias No predefinition of cut‐off value of the index test for most studies Median prevalence of any varices is lower than that reported by most guidelines (around 50%) . |
| High risk varices Cut‐off value: around 150,000 /mm3 (range 140,000 to 160,000/mm3) | Sensitivity 0.80 (0.73 to 0.85) Specificity 0.68 (0.57 to 0.77) LR+ 2.5 LR‐ 0.30 | 1671 participants (7) | 20% | With a prevalence of 20%, 200 out of 1000 people will have varices at high risk of bleeding. Of these 200 people, 40 (20% of 200) people with high‐risk varices will receive misdiagnosis and will not receive effective prophylaxis The remaining 800 people will not have high‐risk varices. 256 people (32% of 800) will receive false diagnosis of high‐risk varices and will undergo an unnecessary endoscopy | Assuming a pretest probability of 20% Post‐test probabilities:
| Most or all studies at high risk of bias No predefinition of cut‐off value of the index test for most studies |
| Review question | What is the diagnostic accuracy of spleen length for the diagnosis of oesophageal varices in adult people with liver disease or portal vein thrombosis? | |||||
| Population | Adults with diagnosis of chronic liver disease or portal vein thrombosis. Age ≥ 18 years | |||||
| Settings | Outpatients and inpatients in secondary/tertiary care setting | |||||
| Study design | Prospective and retrospective cross‐sectional studies. No case‐control studies were found | |||||
| Index tests | Spleen length | |||||
| Reference standards | Upper endoscopy | |||||
| Target condition | Summary accuracy (95% CI) | No. of participants (studies) | Prevalence, Median (range ) | Implications in a hypothetical cohort of 1000 people | Post‐test probability | Quality and comments |
| Any varices Cut‐off value: around 110 mm (range 110 to 112.5 mm) | Sensitivity 0.85 (0.75 to 0.91) Specificity 0.54 (0.46 to 0.62) LR+ 1.8 (1.6 to 1.21) LR‐ 0.28 (0.17 to 0.44) | 594 participants (5) | 53% | With a prevalence of 53%, 530 out of 1000 people will have varices of any size. Of these 530 people, 80 (15% of 530) people with varices will receive misdiagnosis and will not receive appropriate prophylaxis or follow‐up The remaining 470 people will have no varices. 216 people (46% of 470) will receive false diagnosis of varices and will undergo an unnecessary endoscopy | Assuming a pretest probability of 53% Post‐test probabilities:
| Most or all studies at high risk of bias |
| High‐risk varices Cut‐off value: no common cut‐off value. Range 120 to 160 mm | Sensitivity ranged from 0.50 to 0.88 and specificity from 0.55 to 0.84 | 883 participants (6) | 42% | Inconsistency of results (no common cut‐off value) prevents any conclusions . | Most or all studies at high risk of bias | |
| What is the diagnostic accuracy of platelet count‐to‐spleen length ratio? | ||||||
| Review question | What is the diagnostic accuracy of platelet count‐to‐spleen length ratio for the diagnosis of oesophageal varices in adult people with liver disease or portal vein thrombosis? | |||||
| Population | Adults with diagnosis of chronic liver disease or portal vein thrombosis. Age ≥ 18 years | |||||
| Settings | Outpatients and inpatients in secondary/tertiary care setting | |||||
| Study design | Prospective and retrospective cross‐sectional studies. No case‐control studies were found | |||||
| Index tests | Platelet count‐to‐spleen length ratio | |||||
| Reference standards | Upper endoscopy | |||||
| Target condition | Summary accuracy | No. of participants (studies) | Prevalence, Median (range ) | Implications in a hypothetical cohort of 1000 people | Post‐test probability | Quality and comments |
| Any varices Cut‐off value: 909 (n/mm3)/mm | Sensitivity 0.93 (0.93 to 0.87) Specificity 0.84 (0.75 to 0.91) LR+ 5.9 LR‐ 0.09 | 2637 participants (17) | 58% | With a prevalence of 58%, 580 out of 1000 people will have varices of any size. Of these 580 people, 41 (7% of 580) people with varices will receive misdiagnosis and will not receive appropriate prophylaxis or follow‐up The remaining 420 people will have no varices. 67 people (16% of 420) will receive false diagnosis of varices and will undergo an unnecessary endoscopy | Assuming a pretest probability of 58% Post‐test probabilities:
| Most studies are at high risk of bias |
| High‐risk varices Cut‐off value: around 909 (n/mm3)/mm (range 897 to 921 (n/mm3)/mm) | Sensitivity 0.85 (0.72 to 0.93) Specificity 0.66 (0.52 to 0.77) LR+ 2.5 LR‐ 0.22 | 642 participants (7) | 60% | With a prevalence of 60%, 600 out of 1000 people will have varices at high risk of bleeding. Of these 2600 people, 90 (15% of 600) people with high‐risk varices will receive misdiagnosis and will not receive effective prophylaxis The remaining 400 people will not have high‐risk varices. 136 people (34% of 400) will receive false diagnosis of high‐risk varices and will undergo an unnecessary endoscopy | Assuming a pre‐test probability of 60% Post‐test probabilities:
| Most studies are at high risk of bias Median prevalence of any varices is higher than that reported by most guidelines (around 25%) |
| What is the diagnostic accuracy of platelet count? | ||||||
| Review question | What is the diagnostic accuracy of platelet count for the diagnosis of oesophageal varices in paediatric people with liver disease or portal vein thrombosis? | |||||
| Population | Children with diagnosis of chronic liver disease or portal vein thrombosis. Age < 18 years | |||||
| Settings | Outpatients and inpatients in secondary/tertiary care setting | |||||
| Study design | Prospective and retrospective cross‐sectional studies. No case‐control studies were found | |||||
| Index tests | Platelet count | |||||
| Reference standards | Upper endoscopy | |||||
| Target condition | Summary accuracy | No. of participants (studies) | Prevalence, Median (range ) | Implications in a hypothetical cohort of 1000 people | Post‐test probability | Quality and comments |
| Any varices Cut‐off value: around 120,000 /mm3 (range 115,000 to 119,000/mm3) | Sensitivity 0.71 (0.60 to 0.80) Specificity 0.83 (0.70 to 0.91) LR+ 4.2 LR‐ 0.35 | 277 participants (4) | 58% | With a prevalence of 58%, 580 out of 1000 children will have varices of any size. Of these 580 children, 168 (29% of 580) children with varices will receive misdiagnosis and will not receive appropriate. prophylaxis or follow‐up The remaining 420 children will have no varices. 71 children (17% of 420) will receive false diagnosis of varices and will undergo an unnecessary endoscopy | Assuming a pretest probability of 58% Post‐test probabilities:
| Studies were at high risk of bias |
| What is the diagnostic accuracy of platelet count‐to‐spleen length ratio? | ||||||
| Review question | What is the diagnostic accuracy of platelet count‐to‐spleen length ratio for the diagnosis of oesophageal varices in paediatric people with liver disease or portal vein thrombosis? | |||||
| Population | Children with diagnosis of chronic liver disease or portal vein thrombosis. Age < 18 years | |||||
| Settings | Outpatients and inpatients in secondary/tertiary care setting | |||||
| Study design | Prospective and retrospective cross‐sectional studies. No case‐control studies were found | |||||
| Index tests | Platelet count‐to‐spleen length ratio | |||||
| Reference standards | Upper endoscopy | |||||
| Target condition | Summary accuracy (95% CI) | No. of participants (studies) | Prevalences | Implications in a hypothetical cohort of 1000 people | Post‐test probability | Quality and comments |
| Any varices Cut‐off value: around 1000 (n/mm3)/mm | Sensitivity 0.74 (0.65 to 0.81) Specificity 0.64 (0.36 to 0.85) LR+ 2.0 (1.0 to 4.0) LR‐ 0.41 (0.27 to 0.61) | 197 participants | 72% and 73% | With a prevalence of 50%, 500 out of 1000 children will have varices of any size. Of these 500 children, 130 (26% of 500) children with varices will receive misdiagnosis and will not receive appropriate prophylaxis or follow‐up The remaining 500 children will have no varices. 180 children (36% of 500) will receive false diagnosis of varices and will undergo an unnecessary endoscopy | Assuming a pretest probability of 50% Post‐test probabilities:
| Limited evidence. Only 2 studies were found. These 2 studies were at high risk of bias |
| Any varices ‐ indirect comparisons | |||||
| Index test | No. of studies | Cut‐off value | Sensitivity (95% CI) | Specificity (95% CI) | P value* |
| Platelet count | 10 | Around 150,000/mm3 | 0.71 (0.63 to 0.77) | 0.80 (0.69 to 0.88) | 0.252 |
| Platelet count‐to‐spleen length ratio | 17 | 909 (n/mm3)/mm | 0.93 (0.83 to 0.97) | 0.84 (0.75 to 0.91) | |
| Platelet count | 9 | Around 150,000/mm3 | 0.71 (0.63 to 0.77) | 0.80 (0.69 to 0.88) | 0.021 |
| Spleen length | 5 | Around 110 mm | 0.85 (0.75 to 0.91) | 0.54 (0.46 to 0.62) | |
| Platelet count‐to‐spleen length ratio | 17 | 909 (n/mm3)/mm | 0.93 (0.83 to 0.97) | 0.84 (0.75 to 0.91) | <0.001 |
| Spleen length | 5 | Around 110 mm | 0.85 (0.75 to 0.91) | 0.54 (0.46 to 0.62) | |
| * Pair‐wise comparisons between index tests performed by adding the index test as covariate to the bivariate model. P values were obtained by comparing the ‐2 log likelihood of the model with the covariate with the ‐2 log likelihood of the model without the covariate. | |||||
| Pooled results | |||||
| Cut‐off | Sensitivity (95% CI) | Specificity (95% CI) | LR+ (95% CI) | LR‐ (95% CI) | |
| Any varices | |||||
| Platelet count | Around 100,000 | 0.57 (0.50 to 0.64) | 0.75 (0.67 to 0.82) | 2.3 (1.7 to 3.1) | 0.57 (0.49 to 0.67) |
| Around 120,000 | 0.77 (0.72 to 0.81) | 0.69 (0.57 to 0.78) | 2.4 (1.7 to 3.5) | 0.34 (0.26 to 0.44) | |
| Around 150,000 | 0.71 (0.63 to 0.77) | 0.80 (0.69 to 0.88) | 3.6 (2.4 to 5.4) | 0.37 (0.30 to 0.45) | |
| Spleen length | Around 110 mm | 0.85 (0.75 to 0.91) | 0.54 (0.46 to 0.62) | 1.8 (1.6 to 2.1) | 0.28 (0.17 to 0.44) |
| Around 150 mm | 0.57 (0.41 to 0.71) | 0.82 (0.72 to 0.89) | 3.2 (2.3 to 4.4) | 0.53 (0.39 to 0.72) | |
| Platelet count‐to‐spleen length ratio | 909 (n/mm3)/mm | 0.93 (0.83 to 0.97) | 0.84 (0.75 to 0.91) | 5.9 (3.5 to 9.9) | 0.09 (0.03 to 0.22) |
| High‐risk varices | |||||
| Platelet count | Around 90,000 | 0.59 (0.54 to 0.64) | 0.72 (0.66 to 0.78) | 2.1 (1.8 to 2.6) | 0.57 (0.52 to 0.63) |
| Around 150,000 | 0.80 (0.73 to 0.85) | 0.68 (0.57 to 0.77) | 2.5 (1.8 to 3.3) | 0.30 (0.23 to 0.39) | |
| Spleen length | ‐ | ‐ | ‐ | ‐ | ‐ |
| Platelet count‐to‐spleen length ratio | Around 909 (n/mm3)/mm | 0.85 (0.72 to 0.93) | 0.66 (0.52 to 0.77) | 2.5 (1.8 to 3.4) | 0.22 (0.12 to 0.42) |
| Test | No. of studies | No. of participants |
| 1 Adults ‐ platelet count ‐ any varices Show forest plot | 25 | 5096 |
| 2 Adults ‐ platelet count ‐ any varices ‐ cut‐off around 100,000 Show forest plot | 11 | 3506 |
| 3 Adults ‐ platelet count ‐ any varices ‐ cut‐off around 120,000 Show forest plot | 7 | 815 |
| 4 Adults ‐ platelet count ‐ any varices ‐ cut‐off around 150,000 Show forest plot | 10 | 2054 |
| 5 Adults ‐ platelet/spleen ratio ‐ any varices Show forest plot | 38 | 5235 |
| 6 Adults ‐ platelet/spleen ratio ‐ any varices ‐ cut‐off 909 Show forest plot | 17 | 2637 |
| 7 Adults ‐ spleen diameter ‐ any varices Show forest plot | 13 | 1489 |
| 8 Adults ‐ spleen diameter ‐ any varices ‐ cut‐off around 110 mm Show forest plot | 5 | 594 |
| 9 Adults ‐ spleen diameter ‐ any varices ‐ cut‐off around 150 mm Show forest plot | 5 | 598 |
| 10 Adults ‐ platelet count ‐ high‐risk varices Show forest plot | 21 | 4266 |
| 11 Adults ‐ platelet count ‐ high‐risk varices ‐ cut‐off around 90,000 Show forest plot | 11 | 3084 |
| 12 Adults ‐ platelet count ‐ high‐risk varices ‐ cut‐off around 150,000 Show forest plot | 7 | 1671 |
| 13 Adults ‐ platelet/spleen ratio ‐ high‐risk varices Show forest plot | 10 | 930 |
| 14 Adults ‐ platelet/spleen ratio ‐ high‐risk varices ‐ cut‐off around 909 Show forest plot | 7 | 642 |
| 15 Adults ‐ spleen diameter ‐ high‐risk varices Show forest plot | 6 | 883 |
| 16 Paediatrics ‐ platelet count ‐ any varices Show forest plot | 4 | 277 |
| 17 Paediatrics ‐ platelet/spleen ratio z‐score ‐ any varices Show forest plot | 2 | 197 |