Intervenciones conservadoras para el tratamiento de las molestias en el brazo, cuello u hombro relacionadas con el trabajo en adultos
Información
- DOI:
- https://doi.org/10.1002/14651858.CD008742.pub2Copiar DOI

- Base de datos:
-
- Cochrane Database of Systematic Reviews
- Versión publicada:
-
- 12 diciembre 2013see what's new
- Tipo:
-
- Intervention
- Etapa:
-
- Review
- Grupo Editorial Cochrane:
-
Grupo Cochrane de Salud laboral
- Copyright:
-
- Copyright © 2013 The Cochrane Collaboration. Published by John Wiley & Sons, Ltd.
Cifras del artículo
Altmetric:
Citado por:
Autores
Contributions of authors
APV, SMAB‐Z, AB, HCWdV and BWK are responsible for drafting the protocol. The search was performed by APV, SMS, HCWdV and BWK, and selection of the studies and data extraction by APV, SMS and SMAB‐Z. APV and AB are responsible for the analysis. All authors are responsible for the interpretation of results and for the final draft of the review.
Sources of support
Internal sources
-
Erasmus Medical Centre, University, Netherlands.
Salary and time to enable the review authors to perform the review
External sources
-
No sources of support supplied
Declarations of interest
None known.
Acknowledgements
We thank Helen Handoll, Co‐ordinating Editor of the Bone, Joint and Muscle Trauma Review Group, and Jos Verbeek, Co‐ordinating Editor of the Cochrane Occupational Safety and Health Review Group, for their valuable comments and advice. We also thank Lesley Gillespie for her help with the search strategies, and Joanne Elliott, Lindsey Elstub and Amy Kavanagh for their help and comments about the protocol. We thank Jani Ruotsalainen, Managing Editor of the Cochrane Occupational Safety and Health Review Group, for his extensive comments on and editing of the review text. Finally, we thank Dolores Matthews for copy editing the text.
Version history
| Published | Title | Stage | Authors | Version |
| 2013 Dec 12 | Conservative interventions for treating work‐related complaints of the arm, neck or shoulder in adults | Review | Arianne P Verhagen, Sita MA Bierma‐Zeinstra, Alex Burdorf, Siobhán M Stynes, Henrica CW de Vet, Bart W Koes | |
| 2010 Oct 06 | Conservative interventions for treating work‐related complaints of the arm, neck or shoulder in adults | Protocol | Arianne P Verhagen, Sita MA Bierma‐Zeinstra, Alex Burdorf, Siobhán M Stynes, Henrica CW de Vet, Bart W Koes | |
Keywords
MeSH
Medical Subject Headings (MeSH) Keywords
- *Physical Therapy Modalities;
- Amitriptyline [therapeutic use];
- Analgesics, Non‐Narcotic [therapeutic use];
- Arm;
- Behavior Therapy [methods];
- Cumulative Trauma Disorders [*therapy];
- Ergonomics [methods];
- Massage;
- Neck;
- Occupational Diseases [*therapy];
- Randomized Controlled Trials as Topic;
- Shoulder;
- Sick Leave [statistics & numerical data];
Medical Subject Headings Check Words
Adult; Humans;
PICO

Study flow diagram.

Risk of bias summary: review authors' judgements about each risk of bias item for each included study.

Risk of bias graph: review authors' judgements about each risk of bias item presented as percentages across all included studies.

Funnel plot of comparison: 1 Exercise versus no treatment controls, outcome: 1.1 Pain intensity, short term.

Comparison 1 Exercise versus no treatment controls, Outcome 1 Pain intensity, short term.

Comparison 1 Exercise versus no treatment controls, Outcome 2 Pain intensity, long term.

Comparison 1 Exercise versus no treatment controls, Outcome 3 Disability, short term.

Comparison 1 Exercise versus no treatment controls, Outcome 4 Disability, short term.

Comparison 1 Exercise versus no treatment controls, Outcome 5 Disability, long term.

Comparison 1 Exercise versus no treatment controls, Outcome 6 Improvement, short term.

Comparison 1 Exercise versus no treatment controls, Outcome 7 Improvement, short term.

Comparison 1 Exercise versus no treatment controls, Outcome 8 Sick leave, long term.
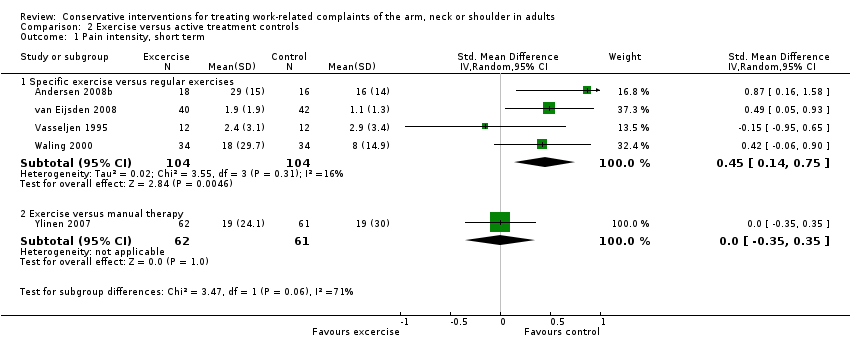
Comparison 2 Exercise versus active treatment controls, Outcome 1 Pain intensity, short term.

Comparison 2 Exercise versus active treatment controls, Outcome 2 Pain intensity, long term.

Comparison 2 Exercise versus active treatment controls, Outcome 3 Disability, short term.

Comparison 2 Exercise versus active treatment controls, Outcome 4 Disability, long term.

Comparison 2 Exercise versus active treatment controls, Outcome 5 Improvement, short term.

Comparison 3 Ergonomic intervention versus no treatment controls, Outcome 1 Pain intensity, short term.

Comparison 3 Ergonomic intervention versus no treatment controls, Outcome 2 Pain intensity, long term.

Comparison 3 Ergonomic intervention versus no treatment controls, Outcome 3 Disability, short term.

Comparison 3 Ergonomic intervention versus no treatment controls, Outcome 4 Disability, short term.
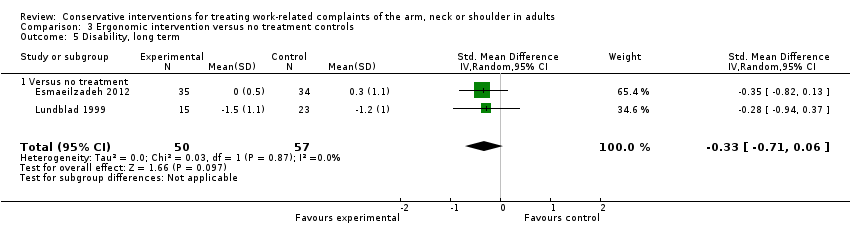
Comparison 3 Ergonomic intervention versus no treatment controls, Outcome 5 Disability, long term.

Comparison 3 Ergonomic intervention versus no treatment controls, Outcome 6 Disability, long term.
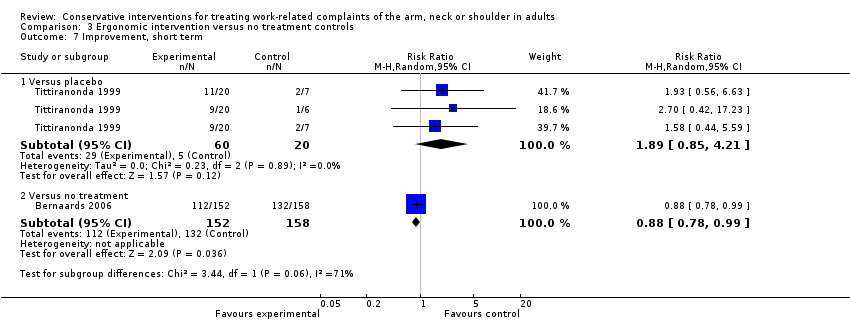
Comparison 3 Ergonomic intervention versus no treatment controls, Outcome 7 Improvement, short term.

Comparison 3 Ergonomic intervention versus no treatment controls, Outcome 8 Improvement, long term.

Comparison 3 Ergonomic intervention versus no treatment controls, Outcome 9 Sick leave, short term.

Comparison 4 Ergonomic intervention versus active treatment controls, Outcome 1 Pain intensity, short term.
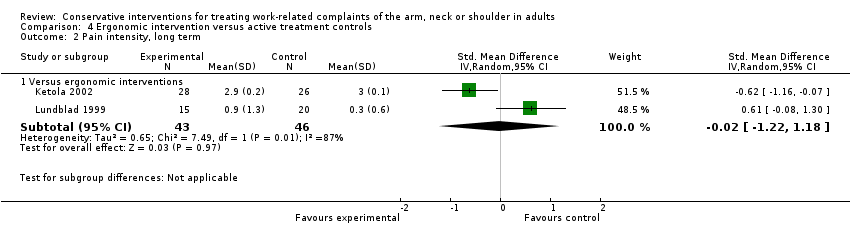
Comparison 4 Ergonomic intervention versus active treatment controls, Outcome 2 Pain intensity, long term.
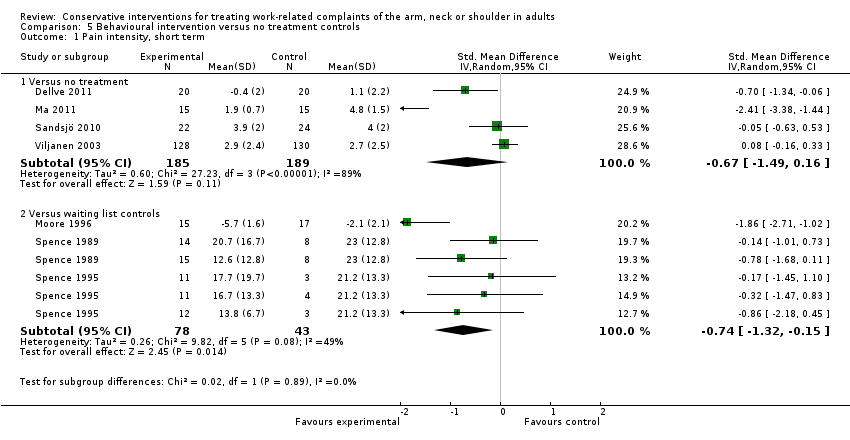
Comparison 5 Behavioural intervention versus no treatment controls, Outcome 1 Pain intensity, short term.

Comparison 5 Behavioural intervention versus no treatment controls, Outcome 2 Pain, short term.
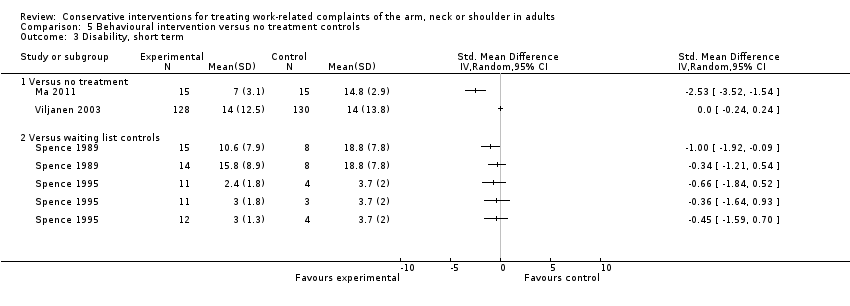
Comparison 5 Behavioural intervention versus no treatment controls, Outcome 3 Disability, short term.

Comparison 5 Behavioural intervention versus no treatment controls, Outcome 4 Disability, short term.
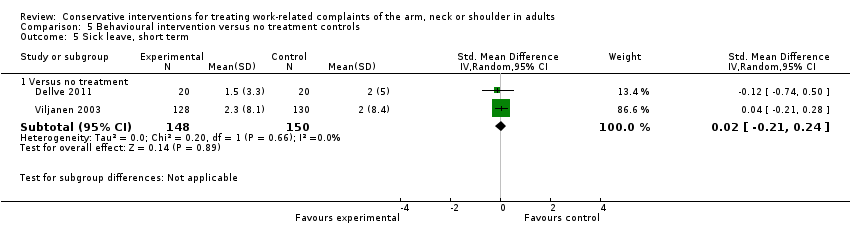
Comparison 5 Behavioural intervention versus no treatment controls, Outcome 5 Sick leave, short term.

Comparison 5 Behavioural intervention versus no treatment controls, Outcome 6 Sick leave, short term.

Comparison 5 Behavioural intervention versus no treatment controls, Outcome 7 Pain, long term.

Comparison 5 Behavioural intervention versus no treatment controls, Outcome 8 Disability, long term.

Comparison 6 Behavioural intervention versus active treatment controls, Outcome 1 Pain intensity, short term.

Comparison 6 Behavioural intervention versus active treatment controls, Outcome 2 Disability, short term.

Comparison 6 Behavioural intervention versus active treatment controls, Outcome 3 Work ability, short term.
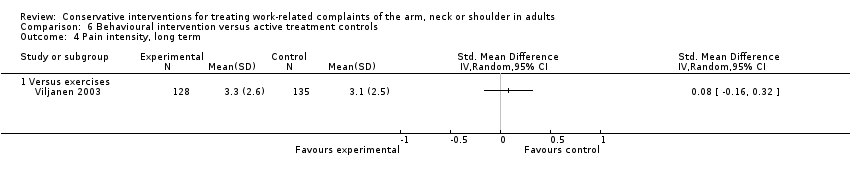
Comparison 6 Behavioural intervention versus active treatment controls, Outcome 4 Pain intensity, long term.
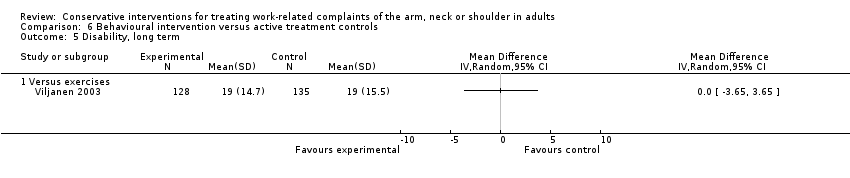
Comparison 6 Behavioural intervention versus active treatment controls, Outcome 5 Disability, long term.

Comparison 6 Behavioural intervention versus active treatment controls, Outcome 6 Work ability, long term.
| Item | Judgement |
| 1. Was the method of randomisation adequate? | Yes/No/Unsure |
| 2. Was the treatment allocation concealed? | Yes/No/Unsure |
| Was knowledge of the allocated interventions adequately prevented during the study? 3. Was the participant blinded to the intervention? 4. Was the care provider blinded to the intervention? 5. Was the outcome assessor blinded to the intervention? | Yes/No/Unsure Yes/No/Unsure Yes/No/Unsure |
| Were incomplete outcome data adequately addressed? 6. Was the dropout rate described and acceptable? 7. Were all randomly assigned participants analysed in the group to which they were allocated? |
Yes/No/Unsure Yes/No/Unsure |
| 8. Are reports of the study free of suggestion of selective outcome reporting? | Yes/No/Unsure |
| Other sources of potential bias: 9. Were the groups similar at baseline regarding the most important prognostic indicators? 10. Were co‐interventions avoided or similar? 11. Was compliance acceptable in all groups? 12. Was the timing of the outcome assessment similar in all groups? |
Yes/No/Unsure Yes/No/Unsure Yes/No/Unsure Yes/No/Unsure |
| Risk of bias was assessed using the 12 criteria above (Furlan 2009). The criteria for a judgement of 'Yes' are outlined in Appendix 2. | |
| Outcome or subgroup title | No. of studies | No. of participants | Statistical method | Effect size |
| 1 Pain intensity, short term Show forest plot | 10 | Std. Mean Difference (IV, Random, 95% CI) | Subtotals only | |
| 1.1 Versus no intervention | 5 | 431 | Std. Mean Difference (IV, Random, 95% CI) | ‐0.52 [‐1.08, 0.03] |
| 1.2 Versus discussion/counselling | 3 | 235 | Std. Mean Difference (IV, Random, 95% CI) | ‐0.25 [‐0.87, 0.37] |
| 1.3 Exercises plus additional treatment versus additional only | 2 | 309 | Std. Mean Difference (IV, Random, 95% CI) | ‐1.02 [‐2.99, 0.95] |
| 2 Pain intensity, long term Show forest plot | 4 | Std. Mean Difference (IV, Random, 95% CI) | Subtotals only | |
| 2.1 Versus no treatment | 2 | 308 | Std. Mean Difference (IV, Random, 95% CI) | ‐0.31 [‐0.96, 0.33] |
| 2.2 Versus discussion/counselling | 2 | 305 | Std. Mean Difference (IV, Random, 95% CI) | ‐0.07 [‐0.68, 0.54] |
| 3 Disability, short term Show forest plot | 3 | Std. Mean Difference (IV, Random, 95% CI) | Subtotals only | |
| 3.1 Versus no treatment | 2 | 295 | Std. Mean Difference (IV, Random, 95% CI) | ‐0.77 [‐2.50, 0.97] |
| 3.2 Versus discussion/counselling | 1 | 85 | Std. Mean Difference (IV, Random, 95% CI) | 0.51 [0.08, 0.94] |
| 4 Disability, short term Show forest plot | 1 | Risk Ratio (M‐H, Random, 95% CI) | Totals not selected | |
| 4.1 Exercises plus additional treatment versus additional only | 1 | Risk Ratio (M‐H, Random, 95% CI) | 0.0 [0.0, 0.0] | |
| 5 Disability, long term Show forest plot | 3 | Std. Mean Difference (IV, Random, 95% CI) | Subtotals only | |
| 5.1 Versus no treatment | 2 | 308 | Std. Mean Difference (IV, Random, 95% CI) | 0.14 [‐0.08, 0.37] |
| 5.2 Versus discussion/counselling | 1 | 179 | Std. Mean Difference (IV, Random, 95% CI) | ‐0.55 [‐0.87, ‐0.23] |
| 6 Improvement, short term Show forest plot | 1 | Risk Ratio (M‐H, Random, 95% CI) | Subtotals only | |
| 6.1 Versus discussion/counselling | 1 | 126 | Risk Ratio (M‐H, Random, 95% CI) | 0.53 [0.37, 0.78] |
| 7 Improvement, short term Show forest plot | 2 | Risk Ratio (M‐H, Random, 95% CI) | Subtotals only | |
| 7.1 Exercises plus additional treatment versus additional only | 2 | 396 | Risk Ratio (M‐H, Random, 95% CI) | 1.25 [0.81, 1.93] |
| 8 Sick leave, long term Show forest plot | 2 | Std. Mean Difference (IV, Random, 95% CI) | Subtotals only | |
| 8.1 Versus no treatment | 2 | 308 | Std. Mean Difference (IV, Random, 95% CI) | ‐0.03 [‐0.26, 0.19] |
| Outcome or subgroup title | No. of studies | No. of participants | Statistical method | Effect size |
| 1 Pain intensity, short term Show forest plot | 5 | Std. Mean Difference (IV, Random, 95% CI) | Subtotals only | |
| 1.1 Specific exercise versus regular exercises | 4 | 208 | Std. Mean Difference (IV, Random, 95% CI) | 0.45 [0.14, 0.75] |
| 1.2 Exercise versus manual therapy | 1 | 123 | Std. Mean Difference (IV, Random, 95% CI) | 0.0 [‐0.35, 0.35] |
| 2 Pain intensity, long term Show forest plot | 2 | Std. Mean Difference (IV, Random, 95% CI) | Subtotals only | |
| 2.1 Specific versus regular exercise | 2 | 201 | Std. Mean Difference (IV, Random, 95% CI) | 0.10 [‐0.18, 0.38] |
| 3 Disability, short term Show forest plot | 2 | Mean Difference (IV, Random, 95% CI) | Totals not selected | |
| 3.1 Specific versus regular exercise | 1 | Mean Difference (IV, Random, 95% CI) | 0.0 [0.0, 0.0] | |
| 3.2 Versus manual therapy | 1 | Mean Difference (IV, Random, 95% CI) | 0.0 [0.0, 0.0] | |
| 4 Disability, long term Show forest plot | 2 | 201 | Std. Mean Difference (IV, Random, 95% CI) | 0.11 [‐0.17, 0.38] |
| 4.1 Specific versus regular exercise | 2 | 201 | Std. Mean Difference (IV, Random, 95% CI) | 0.11 [‐0.17, 0.38] |
| 5 Improvement, short term Show forest plot | 5 | Risk Ratio (M‐H, Random, 95% CI) | Subtotals only | |
| 5.1 Specific versus regular exercise | 3 | 205 | Risk Ratio (M‐H, Random, 95% CI) | 0.86 [0.43, 1.71] |
| 5.2 Versus massage | 1 | 47 | Risk Ratio (M‐H, Random, 95% CI) | 0.78 [0.55, 1.11] |
| 5.3 Versus manual therapy | 1 | 125 | Risk Ratio (M‐H, Random, 95% CI) | 1.88 [1.29, 2.74] |
| Outcome or subgroup title | No. of studies | No. of participants | Statistical method | Effect size |
| 1 Pain intensity, short term Show forest plot | 5 | Std. Mean Difference (IV, Random, 95% CI) | Subtotals only | |
| 1.1 Versus placebo | 1 | 80 | Std. Mean Difference (IV, Random, 95% CI) | 0.53 [0.01, 1.04] |
| 1.2 Versus no treatment | 3 | 506 | Std. Mean Difference (IV, Random, 95% CI) | ‐0.07 [‐0.36, 0.22] |
| 1.3 Ergonomic intervention plus additional treatment versus additional only | 1 | 94 | Std. Mean Difference (IV, Random, 95% CI) | ‐0.60 [‐1.01, ‐0.18] |
| 2 Pain intensity, long term Show forest plot | 4 | Std. Mean Difference (IV, Random, 95% CI) | Subtotals only | |
| 2.1 Versus no treatment | 4 | 402 | Std. Mean Difference (IV, Random, 95% CI) | ‐0.76 [‐1.35, ‐0.16] |
| 3 Disability, short term Show forest plot | 2 | Mean Difference (IV, Random, 95% CI) | Subtotals only | |
| 3.1 Versus placebo | 1 | 80 | Mean Difference (IV, Random, 95% CI) | 0.93 [0.28, 1.57] |
| 3.2 Ergonomic intervention plus additional treatment versus additional only | 1 | 94 | Mean Difference (IV, Random, 95% CI) | ‐9.0 [‐15.02, ‐2.98] |
| 4 Disability, short term Show forest plot | 1 | Risk Ratio (M‐H, Random, 95% CI) | Totals not selected | |
| 4.1 Versus no treatment | 1 | Risk Ratio (M‐H, Random, 95% CI) | 0.0 [0.0, 0.0] | |
| 5 Disability, long term Show forest plot | 2 | 107 | Std. Mean Difference (IV, Random, 95% CI) | ‐0.33 [‐0.71, 0.06] |
| 5.1 Versus no treatment | 2 | 107 | Std. Mean Difference (IV, Random, 95% CI) | ‐0.33 [‐0.71, 0.06] |
| 6 Disability, long term Show forest plot | 1 | Risk Ratio (M‐H, Random, 95% CI) | Totals not selected | |
| 6.1 Versus no treatment | 1 | Risk Ratio (M‐H, Random, 95% CI) | 0.0 [0.0, 0.0] | |
| 7 Improvement, short term Show forest plot | 2 | Risk Ratio (M‐H, Random, 95% CI) | Subtotals only | |
| 7.1 Versus placebo | 1 | 80 | Risk Ratio (M‐H, Random, 95% CI) | 1.89 [0.85, 4.21] |
| 7.2 Versus no treatment | 1 | 310 | Risk Ratio (M‐H, Random, 95% CI) | 0.88 [0.78, 0.99] |
| 8 Improvement, long term Show forest plot | 1 | Risk Ratio (M‐H, Random, 95% CI) | Totals not selected | |
| 8.1 Versus no treatment | 1 | Risk Ratio (M‐H, Random, 95% CI) | 0.0 [0.0, 0.0] | |
| 9 Sick leave, short term Show forest plot | 2 | Risk Ratio (M‐H, Random, 95% CI) | Subtotals only | |
| 9.1 Versus no treatment | 2 | 330 | Risk Ratio (M‐H, Random, 95% CI) | 0.49 [0.32, 0.76] |
| Outcome or subgroup title | No. of studies | No. of participants | Statistical method | Effect size |
| 1 Pain intensity, short term Show forest plot | 3 | Std. Mean Difference (IV, Random, 95% CI) | Subtotals only | |
| 1.1 Versus ergonomic intervention | 3 | 134 | Std. Mean Difference (IV, Random, 95% CI) | 0.11 [‐0.24, 0.46] |
| 2 Pain intensity, long term Show forest plot | 2 | Std. Mean Difference (IV, Random, 95% CI) | Subtotals only | |
| 2.1 Versus ergonomic interventions | 2 | 89 | Std. Mean Difference (IV, Random, 95% CI) | ‐0.02 [‐1.22, 1.18] |
| Outcome or subgroup title | No. of studies | No. of participants | Statistical method | Effect size |
| 1 Pain intensity, short term Show forest plot | 7 | Std. Mean Difference (IV, Random, 95% CI) | Subtotals only | |
| 1.1 Versus no treatment | 4 | 374 | Std. Mean Difference (IV, Random, 95% CI) | ‐0.67 [‐1.49, 0.16] |
| 1.2 Versus waiting list controls | 3 | 121 | Std. Mean Difference (IV, Random, 95% CI) | ‐0.74 [‐1.32, ‐0.15] |
| 2 Pain, short term Show forest plot | 2 | Risk Ratio (M‐H, Random, 95% CI) | Totals not selected | |
| 2.1 Versus no treatment | 1 | Risk Ratio (M‐H, Random, 95% CI) | 0.0 [0.0, 0.0] | |
| 2.2 Behavioural intervention plus additional treatment versus additional only | 1 | Risk Ratio (M‐H, Random, 95% CI) | 0.0 [0.0, 0.0] | |
| 3 Disability, short term Show forest plot | 4 | Std. Mean Difference (IV, Random, 95% CI) | Totals not selected | |
| 3.1 Versus no treatment | 2 | Std. Mean Difference (IV, Random, 95% CI) | 0.0 [0.0, 0.0] | |
| 3.2 Versus waiting list controls | 2 | Std. Mean Difference (IV, Random, 95% CI) | 0.0 [0.0, 0.0] | |
| 4 Disability, short term Show forest plot | 2 | Risk Ratio (M‐H, Random, 95% CI) | Totals not selected | |
| 4.1 Versus no treatment | 1 | Risk Ratio (M‐H, Random, 95% CI) | 0.0 [0.0, 0.0] | |
| 4.2 Behavioural intervention plus additional treatment versus additional only | 1 | Risk Ratio (M‐H, Random, 95% CI) | 0.0 [0.0, 0.0] | |
| 5 Sick leave, short term Show forest plot | 2 | Std. Mean Difference (IV, Random, 95% CI) | Subtotals only | |
| 5.1 Versus no treatment | 2 | 298 | Std. Mean Difference (IV, Random, 95% CI) | 0.02 [‐0.21, 0.24] |
| 6 Sick leave, short term Show forest plot | 1 | Risk Ratio (M‐H, Random, 95% CI) | Totals not selected | |
| 6.1 Versus no treatment | 1 | Risk Ratio (M‐H, Random, 95% CI) | 0.0 [0.0, 0.0] | |
| 7 Pain, long term Show forest plot | 1 | Std. Mean Difference (IV, Random, 95% CI) | Totals not selected | |
| 7.1 Versus no treatment | 1 | Std. Mean Difference (IV, Random, 95% CI) | 0.0 [0.0, 0.0] | |
| 8 Disability, long term Show forest plot | 1 | Mean Difference (IV, Random, 95% CI) | Totals not selected | |
| 8.1 Versus no treatment | 1 | Mean Difference (IV, Random, 95% CI) | 0.0 [0.0, 0.0] | |
| Outcome or subgroup title | No. of studies | No. of participants | Statistical method | Effect size |
| 1 Pain intensity, short term Show forest plot | 5 | 396 | Std. Mean Difference (IV, Random, 95% CI) | ‐0.06 [‐0.25, 0.14] |
| 1.1 Versus behavioural interventions | 2 | 63 | Std. Mean Difference (IV, Random, 95% CI) | ‐0.23 [‐0.73, 0.27] |
| 1.2 Versus exercises | 3 | 333 | Std. Mean Difference (IV, Random, 95% CI) | ‐0.02 [‐0.24, 0.19] |
| 2 Disability, short term Show forest plot | 2 | Std. Mean Difference (IV, Random, 95% CI) | Subtotals only | |
| 2.1 Versus exercises | 2 | 293 | Std. Mean Difference (IV, Random, 95% CI) | ‐0.57 [‐1.66, 0.52] |
| 3 Work ability, short term Show forest plot | 2 | Std. Mean Difference (IV, Random, 95% CI) | Subtotals only | |
| 3.1 Versus exercises | 2 | 303 | Std. Mean Difference (IV, Random, 95% CI) | ‐0.15 [‐0.84, 0.54] |
| 4 Pain intensity, long term Show forest plot | 1 | Std. Mean Difference (IV, Random, 95% CI) | Totals not selected | |
| 4.1 Versus exercises | 1 | Std. Mean Difference (IV, Random, 95% CI) | 0.0 [0.0, 0.0] | |
| 5 Disability, long term Show forest plot | 1 | Mean Difference (IV, Random, 95% CI) | Totals not selected | |
| 5.1 Versus exercises | 1 | Mean Difference (IV, Random, 95% CI) | 0.0 [0.0, 0.0] | |
| 6 Work ability, long term Show forest plot | 1 | Mean Difference (IV, Random, 95% CI) | Totals not selected | |
| 6.1 Versus exercises | 1 | Mean Difference (IV, Random, 95% CI) | 0.0 [0.0, 0.0] | |