Contenido relacionado
Revisiones y protocolos relacionados
Poonam Mehta, Peter Stubbs, Sietske J Tamminga, Sita MA Bierma-Zeinstra, Siobhán M Stynes, Bart W Koes, Arianne P Verhagen | 13 septiembre 2022
Victor CW Hoe, Donna M Urquhart, Helen L Kelsall, Eva N Zamri, Malcolm R Sim | 23 octubre 2018
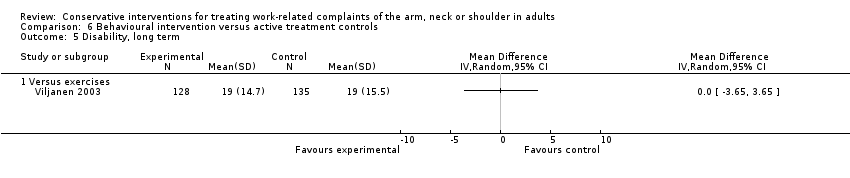
Arianne P Verhagen, Celinde C Karels, Sita MA Bierma‐Zeinstra, Lex L Burdorf, Anita Feleus, Saede SD Dahaghin, Henrica CW de Vet, Bart W Koes | 8 julio 2009
Sharon P Parry, Pieter Coenen, Nipun Shrestha, Peter B O'Sullivan, Christopher G Maher, Leon M Straker | 19 noviembre 2019
Nicole Vogel, Stefan Schandelmaier, Thomas Zumbrunn, Shanil Ebrahim, Wout EL de Boer, Jason W Busse, Regina Kunz | 30 marzo 2017
Karen Nieuwenhuijsen, Jos H Verbeek, Angela Neumeyer-Gromen, Arco C Verhoeven, Ute Bültmann, Babs Faber | 14 octubre 2020
Frederieke G Schaafsma, Norashikin Mahmud, Michiel F Reneman, Jean‐Baptiste Fassier, Franciscus HW Jungbauer | 12 enero 2016
Priti Mulimani, Victor CW Hoe, Melanie J Hayes, Jose Joy Idiculla, Adinegara BL Abas, Laxminarayan Karanth | 15 octubre 2018
Myrthe van Vilsteren, Sandra H van Oostrom, Henrica CW de Vet, Renée‐Louise Franche, Cécile RL Boot, Johannes R Anema | 5 octubre 2015
Anootnara Talkul Kuster, Therese K Dalsbø, Bao Yen Luong Thanh, Arnav Agarwal, Quentin V Durand‐Moreau, Ingvild Kirkehei | 30 agosto 2017