Блокатор фактора роста эндотелия сосудов при пролиферативной диабетической ретинопатии
Abstract
Background
Proliferative diabetic retinopathy (PDR) is a complication of diabetic retinopathy that can cause blindness. Although panretinal photocoagulation (PRP) is the treatment of choice for PDR, it has secondary effects that can affect vision. An alternative treatment such as anti‐vascular endothelial growth factor (anti‐VEGF), which produces an inhibition of vascular proliferation, could improve the vision of people with PDR.
Objectives
To assess the effectiveness and safety of anti‐VEGFs for PDR.
Search methods
We searched CENTRAL (which contains the Cochrane Eyes and Vision Group Trials Register) (2014, Issue 3), Ovid MEDLINE, Ovid MEDLINE In‐Process and Other Non‐Indexed Citations, Ovid MEDLINE Daily, Ovid OLDMEDLINE (January 1946 to April 2014), EMBASE (January 1980 to April 2014), the metaRegister of Controlled Trials (mRCT) (www.controlled‐trials.com), ClinicalTrials.gov (www.clinicaltrials.gov) and the World Health Organization (WHO) International Clinical Trials Registry Platform (ICTRP) (www.who.int/ictrp/search/en). We did not use any date or language restrictions in the electronic searches for trials. We last searched the electronic databases on 28 April 2014.
Selection criteria
We included randomised controlled trials (RCTs) comparing anti‐VEGFs to another active treatment, sham treatment or no treatment for people with PDR. We also included studies that assessed the combination of anti‐VEGFs with other treatments.
Data collection and analysis
Two review authors independently selected studies for inclusion, extracted data and assessed risk of bias for all included trials. We calculated the risk ratio (RR) or the mean difference (MD), and 95% confidence intervals (CI).
Main results
We included 18 RCTs with 1005 participants (1131 eyes) of whom 57% were men. The median number of participants per RCT was 40 (range 15 to 261). The studies took place in Asia (three studies), Europe (two studies), the Middle East (seven studies), North America (three studies) and South America (three studies). Eight RCTs recruited people eligible for PRP, nine RCTs enrolled people with diabetes requiring vitrectomy and one RCT recruited people undergoing cataract surgery. The median follow‐up was six months (range one to 12 months). Seven studies were at high risk of bias and the remainder were unclear risk of bias in one or more domains.
Very low quality evidence from one study of 61 people showed that people treated with bevacizumab and PRP were less likely to lose 3 or more lines of visual acuity at 12 months compared with people treated with PRP alone (RR 0.19, 95% CI 0.05 to 0.81). People treated with anti‐VEGF had an increased chance of gaining 3 or more lines of visual acuity but the effect was imprecise and compatible with no effect or being less likely to gain vision (RR 6.78, 95% CI 0.37 to 125.95). No other study reported these two outcomes. On average, people treated with anti‐VEGF (bevacizumab, pegaptanib or ranibizumab) had better visual acuity at 12 months compared with people not receiving anti‐VEGF (MD ‐0.07 logMAR, 95% CI ‐0.12 to ‐0.02; 5 RCTs, 373 participants, low quality evidence). There was some evidence to suggest a regression of PDR with smaller leakage on fluorescein angiography but it was difficult to estimate a pooled result from the two trials reporting this outcome. People receiving anti‐VEGF were less likely to have vitreous or pre‐retinal haemorrhage at 12 months (RR 0.32, 95% CI 0.16 to 0.65; 3 RCTs, 342 participants, low quality evidence). No study reported on fluorescein leakage or quality of life.
All of the nine trials of anti‐VEGF before or during vitrectomy investigated bevacizumab; most studies investigated bevacizumab before vitrectomy, one study investigated bevacizumab during surgery.
People treated with bevacizumab and vitrectomy were less likely to lose 3 or more lines of visual acuity at 12 months compared with people given vitrectomy alone but the effect was imprecise and compatible with no effect or being more likely to lose vision (RR 0.49, 95% CI 0.08 to 3.14; 3 RCTs, 94 participants, low quality evidence). People treated with bevacizumab were more likely to gain 3 or more lines of visual acuity (RR 1.62, 95% CI 1.20 to 2.17; 3 RCTs, 94 participants, low quality evidence). On average, people treated with bevacizumab had better visual acuity at 12 months compared with people not receiving bevacizumab but there was uncertainty in the estimate (the CIs included 0; i.e. were compatible with no effect, and there was considerable inconsistency between studies; MD ‐0.24 logMAR, 95% CI ‐0.50 to 0.01; 6 RCTs, 335 participants, I2 = 67%; low quality evidence). People receiving bevacizumab were less likely to have vitreous or pre‐retinal haemorrhage at 12 months (RR 0.30, 95% CI 0.18 to 0.52; 7 RCTs, 393 participants, low quality evidence). No study reported on quality of life.
Reasons for downgrading the quality of the evidence included risk of bias in included studies, imprecision of the estimates, inconsistency of effect estimates and indirectness (few studies reported at 12 months).
Adverse effects were rarely reported and there was no evidence for any increased risk with anti‐VEGF but given the relatively few studies that reported these, and the low event rate, the power of the analysis to detect any differences was low.
Authors' conclusions
There was very low or low quality evidence from RCTs for the efficacy and safety of anti‐VEGF agents when used to treat PDR over and above current standard treatments. However, the results suggest that anti‐VEGFs can reduce the risk of intraocular bleeding in people with PDR. Further carefully designed clinical trials should be able to improve this evidence.
PICO
Резюме на простом языке
Инъекции блокатора фактора роста эндотелия сосудов при прогрессирующей диабетической ретинопатии
Вопрос обзора
Помогают ли инъекции антисосудистого фактора роста эндотелия (анти‐VEGF) людям с прогрессирующей диабетической ретинопатией в плане зрения и прогрессирования заболевания? Безопасно ли это лечение?
Актуальность
Диабетическая ретинопатия ‐ это проблема задней части глаза, которая возникает у людей, страдающих диабетом. На более поздних стадиях заболевания новые кровеносные сосуды разрастаются в задней части глаза и вызывают проблемы со зрением. Эта прогрессирующая форма болезни известна как пролиферативная диабетическая ретинопатия. Анти‐VEGF были разработаны для торможения роста этих новых сосудов. Эти лекарства нужно вводить в глаз.
Дата поиска
Мы изучили исследования, опубликованные по 28 мая 2014 года.
Характеристика исследований
Мы нашли 18 клинических испытаний. Они были проведены в Азии (три испытания), Европе (два испытания), на Ближнем Востоке (семь испытаний), в Северной Америке (три испытания) и Южной Америке (три испытания). Всего в этих испытаниях приняли участие 1005 человек, было изучено 1131 глаз. В восьми исследованиях изучали анти‐VEGF с другим широко используемым лечением диабетической ретинопатии (лазер), в девяти исследованиях изучали анти‐VEGF во время операции на диабетическом глазе (во время витрэктомии) и в одном исследовании изучали использование анти‐VEGF у людей с диабетической ретинопатией, перенесших операцию по удалению катаракты. В большинстве исследований продолжали наблюдение участников в течение шести месяцев, но в некоторых исследованиях наблюдение продолжали в течение одного года.
Источники финансирования исследований
Одно исследование было финансировано промышленностью, ещё одно исследование было финансировано совместно правительством и промышленностью, и три исследования были финансированы правительством и неправительственными организациями. В остальных исследованиях источник финансирования не был указан.
Основные результаты
В одном небольшом исследовании мы обнаружили, что люди, получавшие лечение анти‐VEGF и лазером, реже теряли зрение по сравнению с людьми, получавшими лечение только лазером, но оценка была неточной: около 30% людей, получавших лечение лазером, потеряли зрение по сравнению с 6% и 24% людей, получавших лечение анти‐VEGF и лазером.
В среднем у людей, получавших анти‐VEGF, зрение было немного лучше, чем у людей, не получавших анти‐VEGF. У них также было меньше шансов получить кровотечение в глазу. Ни в одном из исследований не сообщали о качестве жизни. В одном из исследований показали, что инъекция анти‐VEGF менее болезненна, чем лазерное лечение.
Люди, лечившиеся анти‐VEGF до или во время витрэктомии (операции на диабетическом глазе), с меньшей вероятностью утрачивали часть зрения по сравнению с людьми, лечившимися только хирургическим путем, но оценка была неопределенной, и, возможно, анти‐VEGF не изменяли ситуацию или увеличивали риск потери зрения. В среднем у людей, получавших анти‐VEGF до или во время операции, зрение было немного лучше, чем у людей, не получавших анти‐VEGF, но опять же оценка была неопределенной. У них также было меньше шансов получить кровотечение в глазу. Ни в одном из исследований не сообщали о качестве жизни.
Побочные эффекты были редки, и не было достаточно данных, чтобы обнаружить разницу между двумя группами.
Качество доказательств
Качество доказательств было низким или очень низким. Мы посчитали, что некоторые из включенных исследований имеют риск смещения из‐за отсутствия маскировки видов лечения и проблем с последующим наблюдением. Некоторые из результатов были основаны на слишком малом числе участников. Лишь в немногих исследованиях наблюдение участников продолжали более шести месяцев.
Authors' conclusions
Summary of findings
| Anti‐VEGF with or without laser (panretinal photocoagulation; PRP) compared with PRP alone for proliferative diabetic retinopathy | |||||
| Patient or population: people with PDR Settings: hospital Intervention: anti‐VEGF with or without PRP Comparison: PRP | |||||
| Outcomes | Illustrative comparative risks* (95% CI) | Relative effect | No of participants | Quality of the evidence | |
| Assumed risk | Corresponding risk | ||||
| PRP | Anti‐VEGF with or without PRP | ||||
| Loss of ≥ 3 lines of ETDRS visual acuity | 300 per 1000 | 57 per 1000 (15 to 243) | RR 0.19 (0.05 to 0.81) | 61 (1 study) | ⊕⊝⊝⊝ |
| Gain of ≥ 3 lines of ETDRS visual acuity | 10 per 1000 | 68 per 1000 (4 to 1260) | RR 6.78 (0.37 to 125.95) | 61 (1 study) | ⊕⊕⊝⊝ |
| Visual acuity (logMAR scale value of 0 = 6/6 vision, higher score = worse vision) Follow‐up: 12 months | The mean visual acuity ranged across control groups from | The mean visual acuity in the intervention groups was | ‐ | 373 (5 studies) | ⊕⊕⊝⊝ |
| Regression of proliferative diabetic retinopathy (as measured by area of fluorescein leakage) Follow‐up: 12 months | In 1 trial, people who received bevacizumab in addition to PRP had more regression of PDR, as measured by area of fluorescein leakage at 6 months compared with people who had PRP alone (MD ‐8.13 mm2, 95% CI ‐10.94 mm2 to ‐5.32 mm2, 19 participants). In another trial, people who received ranibizumab in addition to PRP had more regression of PDR, as measured by change in area of fluorescein leakage between baseline and 12 months compared with people who had PRP alone, however, the size of the effect was smaller and the CIs were compatible with no effect, or less regression (MD ‐1.0 mm2, 95% CI ‐5.3 mm2 to 3.3 mm2, 20 participants) | ||||
| Presence of vitreous/pre‐retinal haemorrhage Follow‐up: 12 months | 150 per 1000 | 48 per 1000 (24 to 98) | RR 0.32 (95% CI 0.16 to 0.65) | 342 (3 studies) | ⊕⊕⊝⊝ |
| Quality of life | No data reported on quality of life | ||||
| Adverse effects | Adverse effects were reported in 3 studies: 1 study of bevacizumab plus PRP compared with PRP alone and followed up to 3 months (61 participants); 1 study of ranibizumab compared with saline (both groups received PRP if indicated) and followed up to 4 months (261 participants); 1 study of ranibizumab plus PRP compared with PRP alone and followed up to 12 months (31 participants)
| ||||
| *The basis for the assumed risk (e.g. the median control group risk across studies) is provided in footnotes. The corresponding risk (and its 95% confidence interval) is based on the assumed risk in the comparison group and the relative effect of the intervention (and its 95% CI). GRADE Working Group grades of evidence | |||||
| 1 Downgraded for risk of bias (‐1) (study at high risk of selective reporting bias) imprecision (‐1) (wide CIs) and indirectness (‐1) (study reported gain/loss of ≥ 2 lines at 3 months only). 3 Downgraded for risk of bias (‐1) (2 studies at high risk of bias in ≥ 1 domain) and downgraded for indirectness (‐1) (no study reported at 12 months). | |||||
| Bevacizumab before or during vitrectomy compared with vitrectomy alone | |||||
| Patient or population: people undergoing vitrectomy for PDR Settings: hospital Intervention: bevacizumab before or during vitrectomy Comparison: vitrectomy alone or vitrectomy with sham injection | |||||
| Outcomes | Illustrative comparative risks* (95% CI) | Relative effect | No of participants | Quality of the evidence | |
| Assumed risk | Corresponding risk | ||||
| Surgery | Anti‐VEGF plus surgery | ||||
| Loss of ≥ 3 lines of ETDRS visual acuity Follow‐up: 12 months | 60 per 1000 | 29 per 1000 | RR 0.49 | 94 | ⊕⊕⊝⊝ |
| Gain of ≥ 3 lines of ETDRS visual acuity Follow‐up: 12 months | 500 per 1000 | 810 per 1000 | RR 1.62 | 94 | ⊕⊕⊝⊝ |
| Visual acuity logMAR Follow‐up: 12 months | The mean visual acuity ranged across control groups from | The mean visual acuity in the intervention groups was | ‐ | 335 | ⊕⊕⊝⊝ |
| Regression of PDR (as measured by area of fluorescein leakage) Follow‐up: 12 months | No data reported on regression of PDR | ||||
| Presence of vitreous/pre‐retinal haemorrhage Follow‐up: 12 months | 500 per 1000 | 150 per 1000 (90 to 260) | RR 0.30 (0.18 to 0.52) | 393 (7 studies) | ⊕⊕⊝⊝ |
| Quality of life | No data reported on quality of life | ||||
| Adverse effects | Neovascular glaucoma: RR 2.33 (95% CI 0.28 to 19.17; 1 RCT, 368 participants) Retinal detachment: RR 0.56 (95% CI 0.11 to 2.86; 3 RCTs, 182 participants) Cataract: RR 0.68 (95% CI 0.38 to 1.23; 2 RCTs, 137 participants) Raised intraocular pressure: RR 0.31 (95% CI 0.01 to 7.47; 1 RCT, 68 participants) Myocardial infarction: no events in 2 trials (175 participants) Cerebrovascular accident: no events in 2 trials (175 participants) Endophthalmitis: none of the studies reported endophthalmitis Arterial hypertension: none of the studies reported arterial hypertension Pain: none of the studies reported pain | ||||
| *The basis for the assumed risk (e.g. the median control group risk across studies) is provided in footnotes. The corresponding risk (and its 95% confidence interval) is based on the assumed risk in the comparison group and the relative effect of the intervention (and its 95% CI). | |||||
| GRADE Working Group grades of evidence | |||||
| 1 Downgraded for imprecision (‐1) (wide CIs) and downgraded for indirectness (‐1) (only 1 trial reported at 12 months and only 1 (other) trial reported loss of ≥ 3 lines). 3Downgraded for risk of bias (‐1) (2 studies at high risk of bias in ≥ 1 domains) and downgraded for inconsistency (‐1) (I2 = 66%). 4 Downgraded for risk of bias (‐1) (2 studies at high risk of bias in ≥ 1 domains, 3 studies at unclear risk of bias in ≥ 3 domains) and downgraded for indirectness (‐1) (only 1 study reported at 12 months). | |||||
Background
Description of the condition
Introduction and epidemiology
Diabetic retinopathy (DR) is a vascular disorder involving the retina that is characterised by increased vascular permeability, retinal ischaemia and oedema, and formation of new vessels (neovascularisation) (Carmeliet 2004). DR produces visual impairment that can progress to blindness. It is a complication of both types of diabetes mellitus (DM), type 1 and type 2. DR may develop before a diagnosis of diabetes is made, such that one in five people with type 2 DM has retinopathy at the time of diagnosis. More than 60% of people with type 2 DM and almost all people with type 1 DM develop DR during the first 20 years of the disease (ADA 2006).
A person with diabetes has a three‐fold increased risk of blindness compared with the general population (Hayward 2002). In one study conducted by Moss et al., the incidence of blindness 10 years after the onset of DM was 1.8% in people with type 1 DM, 4.0% in people with insulin‐treated type 2 DM, and 4.8% in people with non‐insulin treated type 2 DM (Moss 1994). In the same study, the incidence of visual impairment at 10 years was 9.4% in people with type 1 DM, 37.2% in people with insulin‐treated type 2 DM, and 23.9% in people with non‐insulin treated type 2 DM. In the USA, in 2002, 17% of blindness was attributed to DR (Resnikoff 2004).
The principal risk factors for developing DR are the duration of DM and the severity of hyperglycaemia (Davis 1998; Klein 1988; UKPDSG 1998a; Van Leiden 2003). Other risk factors are age (in type 1 DM) (Klein 1984), hypertension (Klein 1989; Klein 2002a; UKPDSG 1998b), nephropathy (Mathiesen 1995), hypercholesterolaemia (Chew 1996; Klein 2002b; Van Leiden 2002), abdominal obesity and high body mass index (Van Leiden 2003), anaemia (Davis 1998), pregnancy (Klein 1990), age at onset (Kullberg 2002), smoking and ethnicity (Moss 1996).
Presentation and diagnosis
DR is clinically characterised by a progressive loss of visual acuity (acuteness or clearness of vision). The retinal damage progresses sequentially from a mild non‐proliferative stage to a severe proliferative stage. Signs of non‐proliferative diabetic retinopathy (NPDR) include presence of microaneurysms, intraretinal haemorrhages, hard exudates (lipid deposits), vascular changes (such as beading and looping or segmentation of the veins), soft exudates or cotton wool spots (which result from the closure of small retinal arterioles), intraretinal microvascular abnormalities and retinal oedema.
There are two important NPDR clinical classification systems: the Early Treatment Diabetic Retinopathy (ETDR) study research group classification (ETDRSRG 1991a; ETDRSRG 1991b; Table 1) and the International Clinical Diabetic Retinopathy Disease Severity scale (ICDRDS; Wilkinson 2003; Table 2).
| Mild | Presence of at least 1 microaneurysm |
| Moderate | Haemorrhages or microaneurysms (or both) more than standard photo 2A, presence of soft exudates, venous beading, IRMA definitively present |
| Severe | Haemorrhages or microaneurysms (or both) more than standard photo 2A in all 4 quadrants, or venous beading in ≥ 2 quadrants, or IRMA more than standard photo 8A in at least 1 quadrant |
| Very severe | Any ≥ 2 of the changes seen in severe NPDR |
| Early PDR | Presence of new vessels |
| High‐risk PDR | Any of the following: NVD more than one‐third to one‐quarter disc diameter, NVD less than one‐third to one‐quarter disc diameter with vitreous or pre‐retinal haemorrhage, new vessels elsewhere with vitreous or pre‐retinal haemorrhage |
ETDRS: Early Treatment Diabetic Retinopathy Study; IRMA: intraretinal microaneurysm; NPDR: non‐proliferative diabetic retinopathy; NVD: new vessels at optic disc; PDR: proliferative diabetic retinopathy.
| Non‐apparent retinopathy | No abnormalities |
| Mild NPDR | Microaneurysms only |
| Moderate NPDR | More than just microaneurysms but less than severe NPDR |
| Severe NPDR | Any of the following: > 20 intraretinal haemorrhages in each of 4 quadrants; definite venous beading in 2 quadrants; prominent intraretinal microvascular abnormalities in 1 quadrant and no signs of proliferative retinopathy |
| Proliferative diabetic retinopathy | ≥ 1 of the following: neovascularisation, vitreous or pre‐retinal haemorrhage |
ICDRDS: International Clinical Diabetic Retinopathy Disease Severity scale; NPDR: non‐proliferative diabetic retinopathy.
Approximately 50% of people with very severe NPDR progress to proliferative diabetic retinopathy (PDR) within one year (ETDRSRG 1991c). PDR is characterised by neovascularisation, which starts in the retina but can grow and affect the vitreous. These new vessels are prone to bleeding, which results in vitreous haemorrhage and fibrosis, and may lead to vitreous or retinal detachments.
Description of the intervention
The treatment strategies for DR include 1. laser photocoagulation (DRSRG 1978; DRSRG 1981a; DRSRG 1981b; ETDRSRG 1985), 2. vitrectomy (DRVSRG 1985), and 3. pharmacotherapy to prevent both the retinal neovascularisation and the blood flow abnormalities affecting metabolic pathways. Generally, the drug is administered by intravitreal injection.
There are several lines of treatment including vascular endothelial growth factor (VEGF) inhibitors (anti‐VEGF). Some anti‐VEGFs are non‐selective, such as corticosteroids (Jaffe 2006; Martidis 2002; Nauck 1997), cyclo‐oxygenase inhibitors (Sennlaub 2003), and angiotensin‐converting enzyme (ACE) inhibitors (Gilbert 2000). Other anti‐VEGFs are selective, such as pegaptanib sodium (Adamis 2006; Cunningham 2005), and antibodies such as bevacizumab (Arevalo 2007; Avery 2006a; Avery 2006b; Chen 2006; Haritoglou 2006; Mason 2006; Scott 2007; Spaide 2006), and ranibizumab (Chun 2006), which cause regression of neovascularisation, macular oedema, or both.
How the intervention might work
VEGFs are present in the retinal pigment epithelium, pericytes and endothelial cells of the retina. VEGFs are released physiologically when ischaemia occurs and they stimulate the formation of new blood vessels. Hyperglycaemia induces chronic retinal hypoxia and leads to the over‐expression of VEGFs that stimulate the formation of neovascularisation (Bussolati 2001), and cause vascular disease in the retina.
Selective anti‐VEGF drugs inhibit only specific VEGF isoforms, pegaptanib (a modified oligonucleotide) inhibits only the VEGF 165 isoform. Bevacizumab and ranibizumab (a murine humanised monoclonal antibody fragment) inhibit all isoforms of VEGF‐A. Some studies showed that local intravitreal administration of these drugs may be useful in macular oedema and neovascularisation although anti‐VEGFs can produce local adverse effects (in 1.27% of cases) such as endophthalmitis (severe inflammation of the intraocular cavities usually caused by infection) (Shima 2008), and systemic adverse effects (in 1.5% of cases) such as acute elevation of systemic blood pressure or cerebrovascular accident (CVA) (Wu 2008).
Why it is important to do this review
Despite the standard of care given for the prevention and treatment of DR, it remains an important cause of vision loss. Due to this, new lines of treatment, such as with selective anti‐VEGF drugs, are being developed. Some of these anti‐VEGFs do not have authorisation to be used in DR and are prescribed as off‐label or compassionate‐use drugs, but the evidence that supports this practice has not been sufficiently determined. One Cochrane systematic review has been completed on diabetic macular oedema (DMO) (Virgili 2012). It is important to do a systematic review that clarifies the efficacy of the selective anti‐VEGFs in PDR. In addition, we examined the evidence from randomised controlled trials (RCT) on harms of such therapy.
Objectives
To assess the effectiveness and safety of anti‐VEGFs for PDR.
Methods
Criteria for considering studies for this review
Types of studies
We included RCTs without any date or language restrictions. We excluded studies that included DMO as part of the principal inclusion from the review because this has been assessed in the Cochrane review by Virgili 2012.
Types of participants
We included trials in adults (aged 18 years and over) with proliferative DR. We included participants with DR at baseline but the criteria to be selected in the studies was not based on having DMO.
There were two different patient groups with proliferative DR: people who were eligible for laser photocoagulation and people eligible for vitrectomy due to retinal haemorrhage. We judged that these two groups were sufficiently different that it did not make clinical sense to pool the results of these studies; thus, we have considered them separately. This was a post hoc decision and was not planned in our protocol.
Types of interventions
We included studies in which selective anti‐VEGFs were compared with another active treatment, sham treatment or no treatment. We also included studies that assessed the combination of anti‐VEGFs with other treatments, for example, photocoagulation.
Two different comparisons were made: anti‐VEGFs compared with panretinal photocoagulation (PRP) and anti‐VEGFs as an adjunct to vitrectomy compared with vitrectomy alone.
Types of outcome measures
Primary outcomes
Best‐corrected visual acuity at 12 months.
We used three measures:
-
loss of 3 or more lines of vision on the ETDRS visual acuity charts;
-
gain of 3 or more lines of vision on the ETDRS visual acuity charts.
This 3‐line change is equivalent to a doubling of the visual angle. For studies that did not use the ETDRS chart, we used the measure of visual acuity reported that corresponded most closely to a doubling of the visual angle.
We also considered mean visual acuity:
-
corrected visual acuity measured on a continuous scale (logMAR visual acuity or ETDRS letters).
Secondary outcomes
-
Regression of PDR (i.e. regression of neovascularisation to an inactive stage as defined with fluorescein angiography (absence of leakage) or clinical examination (fibrotic new vessels and absence of haemorrhage from new vessels) or any validated DR staging system, such as ETDRS or ICRDS scale). We measured regression sustained at least three months after the last injection.
-
Presence of microaneurysms.
-
Presence of vitreous or pre‐retinal haemorrhage.
-
Need for laser photocoagulation.
-
Need for vitrectomy.
-
People with any ocular or systemic adverse outcomes.
-
DMO.
-
Quality of life measures in any validated scale.
-
Adverse effects.
Search methods for identification of studies
Electronic searches
We searched CENTRAL (which contains the Cochrane Eyes and Vision Group Trials Register) (2014, Issue 3), Ovid MEDLINE, Ovid MEDLINE In‐Process and Other Non‐Indexed Citations, Ovid MEDLINE Daily, Ovid OLDMEDLINE (January 1946 to April 2014), EMBASE (January 1980 to April 2014), the metaRegister of Controlled Trials (mRCT) (www.controlled‐trials.com), ClinicalTrials.gov (www.clinicaltrials.gov) and the World Health Organization (WHO) International Clinical Trials Registry Platform (ICTRP) (www.who.int/ictrp/search/en). We did not use any date or language restrictions in the electronic searches for trials. We last searched the electronic databases on 28 April 2014.
See: Appendices for details of search strategies for CENTRAL (Appendix 1), MEDLINE (Appendix 2), EMBASE (Appendix 3), mRCT (Appendix 4), ClinicalTrials.gov (Appendix 5) and the ICTRP (Appendix 6).
Searching other resources
We looked for other published systematic reviews in this area as a source of additional RCTs. We reviewed the reference lists of the identified clinical trials. When necessary, we contacted study authors to obtain more information regarding their published trials.
Data collection and analysis
Selection of studies
Two authors (MJM, and JAC or CHF or JRE) independently assessed the eligibility of the studies identified in the search. When there were disagreements, a third author (AMC) evaluated the study independently and discussed it with the remainder of the team.
We graded the eligible studies as included or excluded. We contacted three study authors to clarify secondary publications of the main clinical trial (Cho 2010; Ernst 2012; Ramos Filho 2011).
Data extraction and management
Two authors (MJM, and JAC or JRE) collected data independently on a previously tested standardised form. The collected information recorded the risk of bias, characteristics of participants in the study, characteristics of the intervention and control groups, and outcome characteristics of each group of participants. Two review authors (MJM and JRE) entered the data into Review Manager 5.3 (RevMan 2014).
We contacted two authors to obtain information about missing data (Farahvash 2011; Rizzo 2008).
When visual acuity was measured using the ETDRS chart but reported in letters rather than logMAR score, we converted to logMAR score using the following formula: (85‐mean letter score) * 0.02 and for the standard deviation (SD) (letter score * 0.02) (Ferris 1982).
Assessment of risk of bias in included studies
Two authors (MJM, and JAC or JRE) assessed the risk of bias of the included studies, specifically examining the randomisation method (sequence generation and allocation concealment); whether the intervention was blinded to the participants, investigators and outcome assessors; incomplete outcome data; selective outcome reporting and percentage of losses to follow‐up. We also considered whether the number of post‐randomisation losses and exclusions had been made explicit. Once this information was gathered, the authors classified each study into one of the three levels of risk of bias: low, unclear or high risk of bias. We followed the criteria specified in Chapter 8 of the Cochrane Handbook for Systematic Reviews of Interventions (Higgins 2011).
Measures of treatment effect
We considered the following effect measures for each study: risk ratios (RR) for dichotomous variables and mean differences (MD) for continuous variables. We calculated 95% confidence interval (CI).
Unit of analysis issues
The unit of analysis was the eye; most studies included one eye per person. We excluded from the analysis exclusively within‐person studies (trials where the fellow eye was used as a control) (Ernst 2012; Mirshahi 2008; Preti 2014), but we included studies with a low percentage of participants with fellow eye used as a control (Ahn 2011; Cho 2010; Di Lauro 2010; Ergur 2009; Sohn 2012).
Dealing with missing data
We contacted study authors to obtain further information. Our main analysis has been an 'available‐case analysis', analysing data as provided in the individual studies.
Assessment of heterogeneity
We examined the characteristics of each study to detect clinical heterogeneity. We conducted an analysis to detect the presence of heterogeneity. We regarded an I2 statistic between 50% and 75% as substantial heterogeneity and an I2 statistic between 75% and 100% considerable statistical heterogeneity, and we studied sources of heterogeneity. When heterogeneity was more than 75%, we did not pool the studies.
Assessment of reporting biases
In accordance with Chapter 10 of the Cochrane Handbook for Systematic Reviews of Interventions (Sterne 2011), we did not assess whether the review was subject to publication bias by using a funnel plot because the number of clinical trials identified for inclusion in the meta‐analyses was fewer than 10.
Data synthesis
We determined the pooled effect estimate for each outcome through a meta‐analysis of the individual study effect measures using a random‐effects model (DerSimonian 1986), unless there were three trials or fewer in which case we used a fixed‐effect model.
We performed statistical analysis using Review Manager 5 (RevMan 2014).
Subgroup analysis and investigation of heterogeneity
We compared the effect of treatment according to type of anti‐VEGF agent, that is, pegaptanib, ranibizumab and bevacizumab.
Sensitivity analysis
We compared random‐effects models and fixed‐effect models for those analyses that had three or more trials.
We compared the results of high risk of bias trials (i.e. high risk of bias in one or more domains) and low risk trials (i.e. not high risk in any domain) for those analyses that had more than two trials contributing to the analysis and at least one trial in each high risk/low risk group.
'Summary of findings' table
We prepared two 'Summary of findings' tables, including assessment of the overall quality of the evidence for each outcome using the GRADE scheme (GRADEpro 2014).
Results
Description of studies
See: Characteristics of included studies; Characteristics of excluded studies.
Results of the search
The electronic searches yielded 3400 references (Figure 1). After removing duplicates, we screened 2774 records and obtained the full‐text reports of 52 potentially relevant publications pertaining to 42 studies. We included 18 studies (Ahmadieh 2009; Ahn 2011; Cheema 2009; Cho 2010; Di Lauro 2010; DRCR.Net 2013; El‐Batarny 2008; Ergur 2009; Ernst 2012; Farahvash 2011; González 2009; Mirshahi 2008; Modarres 2009; Preti 2014; Ramos Filho 2011; Rizzo 2008; Sohn 2012; Zaman 2013), and excluded 19 studies (Arimura 2009; Fulda 2010; Genovesi‐Ebert 2007; Gonzalez 2006; Hattori 2010; Huang 2009; Ip 2012; Jiang 2009; Jorge 2006; Lanzagorta‐Aresti 2009; López‐López 2012; Michaelides 2010; Minnella 2008; Scott 2008; Shin 2009; Stergiou 2007; Tonello 2008; Yeh 2009; Zhou 2010). We have included five ongoing studies and will assess the data when results become available.

Results from searching for studies for inclusion in the review.
We contacted authors to obtain additional information (Cho 2010; Ernst 2012; Farahvash 2011; Ramos Filho 2011; Rizzo 2008). Three authors responded to our questions (Ernst 2012; Farahvash 2011; Ramos Filho 2011).
Included studies
Overall, we included data on 1005 participants from 18 RCTs in the review. Forty‐three per cent of participants were women and 57% were men, with a mean age of 56 years (range 44 to 71 years). The median number of participants per RCT was 40 (range 15 to 261).
Eight studies evaluated anti‐VEGF in people who needed PRP. In six of these studies, anti‐VEGF was combined with PRP and compared with PRP alone (Cho 2010; DRCR.Net 2013; Ergur 2009; Mirshahi 2008; Preti 2014; Ramos Filho 2011); two studies compared anti‐VEGF alone with PRP (Ernst 2012; González 2009). Five of these studies used bevacizumab (Cho 2010; Ergur 2009; Ernst 2012; Mirshahi 2008; Preti 2014); two studies used ranibizumab (DRCR.Net 2013; Ramos Filho 2011), and one study used pegaptanib (González 2009).
Nine studies evaluated anti‐VEGF as an adjunct to vitrectomy (Ahmadieh 2009; Ahn 2011; Di Lauro 2010; El‐Batarny 2008; Farahvash 2011; Modarres 2009; Rizzo 2008; Sohn 2012; Zaman 2013). All nine trials used bevacizumab.
One study evaluated bevacizumab applied during the course of cataract surgery to prevent progression of proliferative DR (Cheema 2009).
The primary outcome was visual acuity in five trials (Cho 2010; Ergur 2009; Ernst 2012; Preti 2014; Sohn 2012), incidence of vitreous haemorrhage in three trials (Ahmadieh 2009; Ahn 2011; Farahvash 2011), feasibility of the surgery in three trials (El‐Batarny 2008; Modarres 2009; Rizzo 2008), regression of PDR in two studies (González 2009; Mirshahi 2008), progression of DR and maculopathy in one trial (Cheema 2009), active neovascularisation in one trial (Ramos Filho 2011), cumulative probability of vitrectomy in one trial (DRCR.Net 2013), clearing of vitreous haemorrhage in one trial (Di Lauro 2010), severity of intraoperative bleeding in one trial (Farahvash 2011), and changes in contrast sensitivity in one trial (Preti 2014).
The median follow‐up of participants was six months (range 1 (Ahmadieh 2009) to 12 months (El‐Batarny 2008; Ernst 2012; Farahvash 2011)).
Only one trial specified the calculation of the sample size (DRCR.Net 2013). There was imbalance between groups at baseline in one trial (Sohn 2012). Participants in the control group were worse than the experimental group at baseline: two had visually significant cataract (one participant in each group), two had worsening ischaemia (control group), one had severe neovascular glaucoma (control group), and one had vitreous haemorrhage (control group).
Only five trials reported the sources of funding (DRCR.Net 2013; González 2009; Preti 2014; Ramos Filho 2011; Sohn 2012). One study was industry funded (González 2009), one study was funded by a mixture of government and industry (DRCR.Net 2013), and three studies were funded by government and non‐government organisations (Preti 2014; Ramos Filho 2011; Sohn 2012). The remaining studies did not report a funding source.
Excluded studies
We excluded 19 clinical trials (Arimura 2009; Fulda 2010; Genovesi‐Ebert 2007; Gonzalez 2006; Hattori 2010; Huang 2009; Ip 2012; Jiang 2009; Jorge 2006; Lanzagorta‐Aresti 2009; López‐López 2012; Michaelides 2010; Minnella 2008; Scott 2008; Shin 2009; Stergiou 2007; Tonello 2008; Yeh 2009; Zhou 2010). The Characteristics of excluded studies table shows the reasons for exclusion. Briefly, eight studies were prospective non‐randomised clinical trials (Fulda 2010; Genovesi‐Ebert 2007; Hattori 2010; Huang 2009; Jorge 2006; López‐López 2012; Minnella 2008; Yeh 2009), four studies were retrospective (Arimura 2009; Jiang 2009; Shin 2009; Stergiou 2007), four trials were in people with macular oedema (Gonzalez 2006; Ip 2012; Michaelides 2010; Zhou 2010), one study had methodological issues (Scott 2008), one trial was in non‐PDR (Lanzagorta‐Aresti 2009), and one trial was partially randomised (Tonello 2008).
Risk of bias in included studies
Figure 2 and Figure 3 show the risk of bias in included studies.
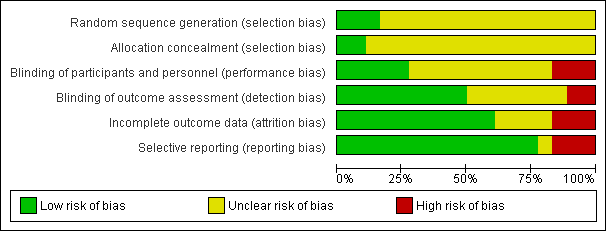
Risk of bias graph: review authors' judgements about each risk of bias item presented as percentages across all included studies.

Risk of bias summary: review authors' judgements about each risk of bias item for each included study.
Allocation
Three studies reported methods of sequence generation that we considered were low risk of bias with mention of computer‐generated random allocation lists (Ahmadieh 2009; González 2009), and use of random number tables (Rizzo 2008). The remaining studies did not report how they generated the allocation in enough detail to enable us to judge.
Only two studies reported adequate methods of allocation concealment. One study had a central online randomisation system (DRCR.Net 2013), and one study used sealed opaque envelopes (Ramos Filho 2011). The remainder of the studies did not report allocation.
Blinding
Five studies reported blinding of participants, personnel and outcome assessors, usually by means of a sham injection or procedure (Ahmadieh 2009; Di Lauro 2010; Mirshahi 2008; Sohn 2012), but in one study, both interventions were delivered by injection and these were identified by number only (DRCR.Net 2013). A further four studies reported blinding outcome assessors only (Cheema 2009; Farahvash 2011; Modarres 2009; Ramos Filho 2011). We judged three studies to be at high risk of bias for blinding because they were not blinded (open label) and the interventions were different (Ahn 2011; Ernst 2012; González 2009).
Incomplete outcome data
Most studies did not appear to have a problem with incomplete outcome data but, for some studies, it was not clearly reported (Di Lauro 2010; Modarres 2009; Preti 2014; Rizzo 2008), and three studies had relatively high loss to follow‐up so we judged them to be at high risk of attrition bias (Ahmadieh 2009; Ernst 2012; Ramos Filho 2011).
Selective reporting
For most studies, we considered selective outcome reporting was not a problem because they reported the main outcomes expected or mentioned them in the methods section of the paper. We judged three studies to be at high risk of bias for selective reporting because the outcomes were reported incompletely (Cho 2010), or differed to those stated in the protocol (Ernst 2012), or on the trials register (Preti 2014); for one study, this information was unclear (Rizzo 2008).
Effects of interventions
See: Summary of findings for the main comparison Anti‐VEGF with or without laser (panretinal photocoagulation; PRP) compared with PRP alone for proliferative diabetic retinopathy; Summary of findings 2 Bevacizumab before or during vitrectomy compared with vitrectomy alone
Comparison 1: anti‐vascular endothelial growth factor with or without panretinal photocoagulation versus panretinal photocoagulation alone
1.1 Loss of 3 or more lines of ETDRS visual acuity
One study reported loss of visual acuity measured as a dichotomous outcome (Cho 2010). The study reported a cut‐point of loss of 2 or more lines at three months and used intravitreal bevacizumab as an adjunct to PRP (injected one week before laser treatment) and compared with PRP alone.
Participants who received anti‐VEGF before PRP were less likely to lose visual acuity compared with participants who did not (RR 0.19, 95% CI 0.05 to 0.81; 61 participants).
1.2 Gain of 3 or more lines of ETDRS visual acuity
One study reported gain of visual acuity measured as a dichotomous outcome (Cho 2010). The study reported a cut‐point of loss of 2 or more lines at three months and used intravitreal bevacizumab as an adjunct to PRP (injected one week before laser treatment) and compared with PRP alone.
People who received anti‐VEGF were more likely to gain visual acuity but the CIs were wide and compatible with no effect (RR 6.78, 95% CI 0.37 to 125.95; 61 participants).
1.3 Mean visual acuity
Five trials contributed to the analyses of mean visual acuity. We planned to collect data on final visual acuity at follow‐up. Two studies reported change in visual acuity from baseline and we included this in the analysis (González 2009; Ramos Filho 2011).
Two of the trials used intravitreal bevacizumab (Cho 2010; Ergur 2009), one trial used intravitreal pegaptanib (González 2009), and two trials used ranibizumab (DRCR.Net 2013; Ramos Filho 2011). Three trials used bevacizumab as an adjunct to PRP (injected at the same time or up to three weeks before PRP) compared with PRP alone (Cho 2010; Ergur 2009; Ramos Filho 2011). One trial compared pegaptanib injected every six weeks for 30 weeks with treatment with PRP (González 2009). One trial compared three injections of ranibizumab at baseline, four and eight weeks with an injection of saline; both groups also received PRP (DRCR.Net 2013).
Mean visual acuity was reported at three months (Cho 2010), four months (DRCR.Net 2013), six months (Ergur 2009), nine months (González 2009), and 12 months (Ramos Filho 2011).
People who received anti‐VEGF on average had better visual acuity at follow‐up compared with people who received PRP alone (MD ‐0.07 logMAR, 95% CI ‐0.12 to ‐0.02; 373 participants; Analysis 1.1;Figure 4).
![Forest plot of comparison: 1 Anti‐vascular endothelial growth factor (anti‐VEGF) versus photocoagulation, outcome: 1.3 Visual acuity [logMAR].](/cdsr/doi/10.1002/14651858.CD008721.pub2/media/CDSR/CD008721/rel0002/CD008721/image_n/nCD008721-AFig-FIG04.png)
Forest plot of comparison: 1 Anti‐vascular endothelial growth factor (anti‐VEGF) versus photocoagulation, outcome: 1.3 Visual acuity [logMAR].
Overall, there was no evidence for heterogeneity (I2 = 0%) and no evidence for any difference according to type of anti‐VEGF (test for subgroup differences P value = 0.37).
1.4 Regression of proliferative diabetic retinopathy (dichotomous outcome)
None of the studies reported regression of PDR (dichotomous outcome).
1.5 Regression of proliferative diabetic retinopathy (mean area of fluorescein leakage)
People who received bevacizumab in addition to PRP had more regression of PDR, as measured by area of fluorescein leakage, at six months compared with people who had PRP alone (MD ‐8.13 mm2, 95% CI ‐10.94 to ‐5.32; 19 participants; Analysis 1.2; Ergur 2009).
People who received ranibizumab in addition to PRP had more regression of PDR, as measured by change in area of fluorescein leakage between baseline and 12 months, compared with people who had PRP alone; however, the size of the effect was smaller and the CIs were compatible with no effect or less regression (MD ‐1.0 mm2, 95% CI ‐5.3 to 3.3; 20 participants; Analysis 1.2; Ramos Filho 2011).
Overall, there was considerable heterogeneity (I2 = 86%) and we did not pool the data of the two studies. It was unclear whether or not the differences between the estimates reflected differences in the interventions or comparators, length of follow‐up or some other attributes of these studies. Intravitreal bevacizumab (1.25 mg) was injected 20 days before three sessions of PRP and compared with PRP alone (Ergur 2009). Ranibizumab 0.5 mg was injected 60 minutes before PRP and compared with PRP alone (Ramos Filho 2011).
1.6 Presence of microaneurysms
None of the studies reported presence of microaneurysms.
1.7 Presence of vitreous or pre‐retinal haemorrhage
Three trials reported on the presence of vitreous or pre‐retinal haemorrhage. One of these trials used intravitreal bevacizumab (Cho 2010), one trial used intravitreal pegaptanib (González 2009), and one trial used ranibizumab (DRCR.Net 2013). Bevacizumab was used as an adjunct to PRP (injected at the same time or up to one week before PRP) and compared with PRP alone (Cho 2010). Pegaptanib was injected every six weeks for 30 weeks and compared with treatment with PRP (González 2009). Three injections of ranibizumab at baseline, four and eight weeks were compared with an injection of saline; both groups also received PRP (DRCR.Net 2013).
People who received anti‐VEGF were less likely to present with vitreous or pre‐retinal haemorrhage compared with people that received PRP (overall pooled RR 0.32, 95% CI 0.16 to 0.65; 342 participants; Analysis 1.3).
Overall there was no evidence for heterogeneity (I2 = 0%) and no evidence of any difference according to type of anti‐VEGF (test for subgroup differences P value = 0.67).
1.8 Need for laser photocoagulation
None of the studies reported need for laser photocoagulation.
1.9 Need for vitrectomy
We only found one relevant trial that reported need for vitrectomy (DRCR.Net 2013). Eyes with vitreous haemorrhage due to PDR that received ranibizumab were less likely to need vitrectomy by four months compared with eyes that received saline but the CIs were wide and compatible with no effect or increased risk of need for vitrectomy (RR 0.74, 95% CI 0.40 to 1.36; 261 participants).
1.10 Diabetic macular oedema
One trial reported DMO at six months (Ergur 2009). People who received bevacizumab were less likely to develop DMO but the CIs were wide and compatible with no effect or reduced risk of developing DMO (RR 0.14, 95% CI 0.01 to 2.45; 30 participants).
1.11 Quality of life
No studies reported quality of life.
1.12 Adverse effects
One study of bevacizumab (Cho 2010), and two of ranibizumab (DRCR.Net 2013; Ramos Filho 2011) reported adverse events. See Analysis 1.4.
Neovascular glaucoma
One trial reported neovascular glaucoma (DRCR.Net 2013). One person in each arm of the study developed neovascular glaucoma (RR 1.09, 95% CI 0.07 to 17.21; 261 participants).
Retinal detachment
One trial reported retinal detachment (DRCR.Net 2013). Similar numbers of people developed retinal detachment in the ranibizumab and saline groups (10/125 with ranibizumab versus 11/136 with saline; RR 0.99, 95% CI 0.44 to 2.25; 261 participants).
Cataract
One trial reported cataract (Cho 2010). People who received anti‐VEGF were less likely to develop cataract compared with people who did not receive anti‐VEGF, but the CIs were wide and compatible with no effect or increased risk of cataract (RR 0.32, 95% CI 0.01 to 7.63; 61 participants).
Raised intraocular pressure
Two trials reported increase of intraocular pressure (IOP) (322 participants) (DRCR.Net 2013; Cho 2010).
People who received bevacizumab were less likely to have developed increased IOP at three months compared with people who did not receive anti‐VEGF, but the CIs were wide and compatible with no effect or increased risk of increased IOP (RR 0.11, 95% CI 0.01 to 1.92; 61 participants; Cho 2010).
The risk of raised IOP was similar between the eyes that received ranibizumab and eyes that received saline (RR 0.92, 95% CI 0.49 to 1.70; 261 participants; DRCR.Net 2013).
Cerebrovascular accident
Two trials reported CVA (DRCR.Net 2013; Cho 2010). The two trials reported only one case of CVA in the anti‐VEGF group in DRCR.Net 2013 (RR 3.26, 95% CI 0.13 to 79.34; 322 participants).
Endophthalmitis
One trial reported endophthalmitis (DRCR.Net 2013). There was only one case of endophthalmitis, which was in the saline group (RR 0.36, 95% CI 0.01 to 8.82; 261 participants).
Arterial hypertension
One trial reported arterial hypertension (DRCR.Net 2013). People who received anti‐VEGF were less likely to develop arterial hypertension compared with people who did not receive anti‐VEGF, but the CIs were wide and compatible with no effect or increased risk of arterial hypertension (RR 0.47, 95% CI 0.12 to 1.76; 261 participants).
Pain
One trial reported pain, which was measured on a 100‐mm visual analogue scale (Ramos Filho 2011). People receiving ranibizumab intravitreal injection reported a mean pain score of 4.7 (SD 8.4), which was much lower than people receiving PRP who reported a mean pain score of 60.8 (SD 29.2). This gave an MD of ‐56.1 (95% CI ‐71.9 to ‐40.3; 31 participants) in favour of ranibizumab intravitreal injection.
Comparison 2: anti‐vascular endothelial growth factor with vitrectomy compared with vitrectomy alone
Nine trials investigated the use of anti‐VEGF with vitrectomy. All of these studies used bevacizumab.
Three of these studies used a sham injection in addition to vitrectomy in the control group (Ahmadieh 2009; Di Lauro 2010; Sohn 2012), in the other six trials the control intervention was vitrectomy alone.
2.1 Loss of 3 or more lines of ETDRS visual acuity
Three studies reported loss of visual acuity measured as a dichotomous outcome. One of the studies used the cut‐point loss of 3 or more lines (Sohn 2012); but the other two studies reported a "deterioration", which was not defined (El‐Batarny 2008; Zaman 2013). All studies used intravitreal bevacizumab as an adjunct to vitrectomy (injected three to seven days before) and compared it with vitrectomy alone or vitrectomy plus sham injection.
People receiving bevacizumab before vitrectomy were less likely to lose vision, but the CIs were wide and compatible with no effect or increased risk of losing vision (RR 0.49, 95% CI 0.08 to 3.14; 94 participants; I2 = 0%) (Analysis 2.1).
2.2 Gain of 3 or more lines of ETDRS visual acuity
Three studies reported gain of visual acuity measured as a dichotomous outcome. One of the studies used the cut‐point gain of 3 or more lines (Sohn 2012); but the other two studies reported "improvement", which was not defined (El‐Batarny 2008; Zaman 2013). All studies used intravitreal bevacizumab as an adjunct to vitrectomy (injected three to seven days before) and compared it with vitrectomy alone or vitrectomy plus sham injection.
People who received bevacizumab before vitrectomy were more likely to gain visual acuity compared with people that received vitrectomy alone (RR 1.62, 95% CI 1.20 to 2.17; 94 participants; Analysis 2.2). There was inconsistency in the results of the individual trials (I2 = 73%) with the RR varying from 1.08 to 3.0, but as all effects were in the same direction we presented a pooled estimate.
2.3 Mean visual acuity
Six trials reported mean visual acuity (Ahmadieh 2009; Ahn 2011; Di Lauro 2010; El‐Batarny 2008; Modarres 2009; Sohn 2012).
On average, people receiving bevacizumab before or during vitrectomy had better vision at follow‐up (between 2 and 3 lines better), but the CIs were wide and compatible with no effect of treatment (MD ‐0.24 logMAR, 95% CI ‐0.50 to 0.01; 335 participants; 6 studies; Analysis 2.3; Figure 5).
![Forest plot of comparison: 2 Anti‐vascular endothelial growth factor (anti‐VEGF) plus surgery versus surgery alone or surgery plus sham or placebo, outcome: 2.3 Visual acuity [logMAR].](/cdsr/doi/10.1002/14651858.CD008721.pub2/media/CDSR/CD008721/rel0002/CD008721/image_n/nCD008721-AFig-FIG05.png)
Forest plot of comparison: 2 Anti‐vascular endothelial growth factor (anti‐VEGF) plus surgery versus surgery alone or surgery plus sham or placebo, outcome: 2.3 Visual acuity [logMAR].
Overall there was substantial heterogeneity (I2 = 67%) but most of the studies found in favour of bevacizumab.
2.4 Regression of proliferative diabetic retinopathy
None of the studies reported regression of PDR.
2.5 Regression of proliferative diabetic retinopathy (mean area of fluorescein leakage)
None of the studies reported regression of PDR (mean area of fluorescein leakage).
2.6 Presence of microaneurysms
None of the studies reported presence of microaneurysms.
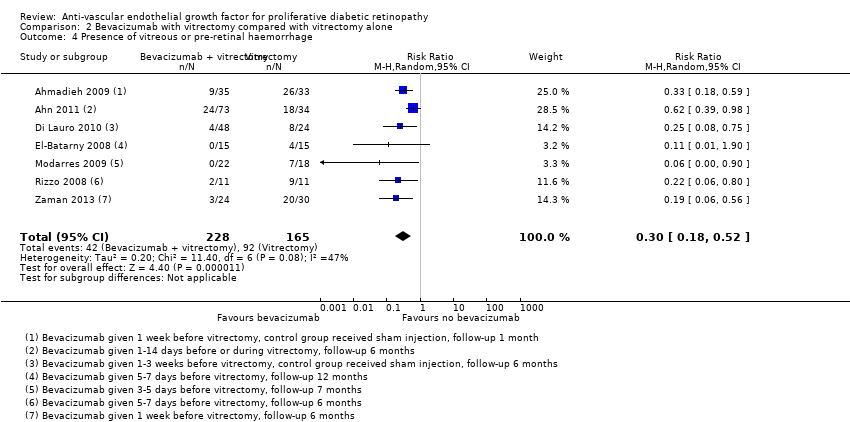
2.7 Presence of vitreous or pre‐retinal haemorrhage
Seven trials reported presence of vitreous or pre‐retinal haemorrhage (Ahmadieh 2009; Ahn 2011; Di Lauro 2010; El‐Batarny 2008; Modarres 2009; Rizzo 2008; Zaman 2013). All trials used intravitreal bevacizumab as an adjunct to vitrectomy (injected perioperatively or up to three weeks before, or both) and compared it with vitrectomy alone or vitrectomy plus sham injection.
People who received bevacizumab before or during vitrectomy were less likely to have vitreous or pre‐retinal haemorrhage at follow‐up compared with people who had vitrectomy alone (overall pooled RR 0.30, 95% CI 0.18 to 0.52; 393 participants; Analysis 2.4). Overall there was some heterogeneity (I2 = 47%).
2.8 Need for laser photocoagulation
None of the studies reported need for laser photocoagulation.
2.9 Need for vitrectomy
Need for vitrectomy was not relevant, as participants had vitrectomy.
2.10 Diabetic macular oedema
None of the studies reported DMO.
2.11 Quality of life
None of the studies reported quality of life.
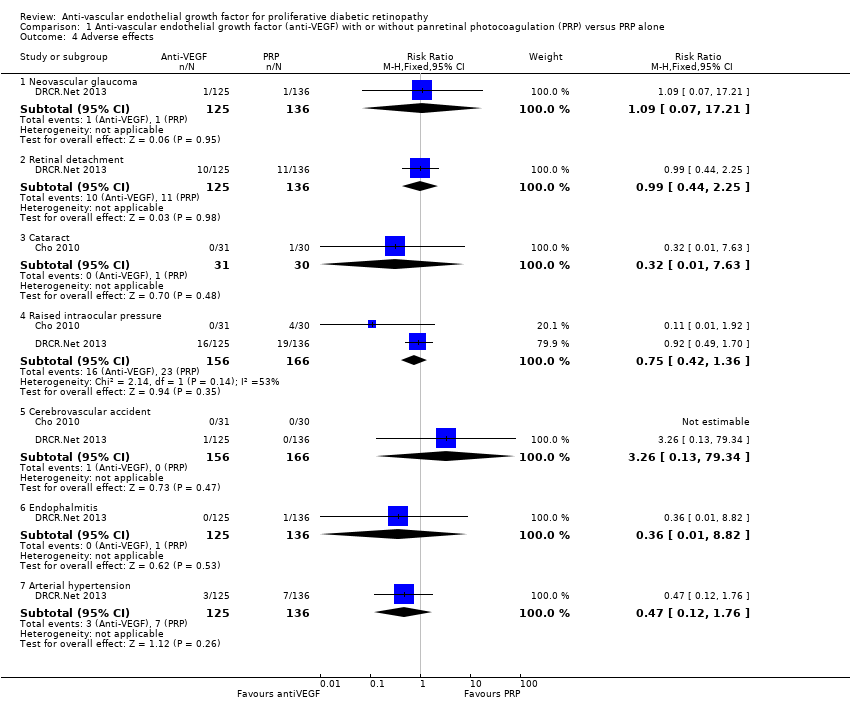
2.13 Adverse effects
See Analysis 2.5.
Neovascular glaucoma
One trial reported neovascular glaucoma (Ahn 2011). People who received anti‐VEGF were more likely to develop neovascular glaucoma compared with people who did not receive anti‐VEGF, but the CIs were wide and compatible with no effect or reduced risk of neovascular glaucoma (RR 2.33, 95% CI 0.28 to 19.17; 107 participants).
Retinal detachment
Three trials reported retinal detachment (Ahn 2011; Farahvash 2011; Modarres 2009). People who received anti‐VEGF were less likely to develop retinal detachment compared with people who did not receive anti‐VEGF, but the CIs were wide and compatible with no effect or reduced risk of retinal detachment (RR 0.56, 95% CI 0.11 to 2.86; 182 participants; I2 = 0%).
Cataract
Two trials reported cataract (Ahn 2011; El‐Batarny 2008). People who received anti‐VEGF were less likely to develop cataract compared with people who did not receive anti‐VEGF, but the CIs were wide and compatible with no effect or increased risk of cataract (RR 0.68, 95% CI 0.38 to 1.23; 137 participants; I2 = 0%).
Raised intraocular pressure
One trial reported IOP (Ahmadieh 2009). People who received anti‐VEGF were less likely to develop increased IOP compared with people who did not receive anti‐VEGF, but the CIs were wide and compatible with no effect or increased risk of increased IOP (RR 0.31, 95% CI 0.01 to 7.47; 68 participants).
Myocardial infarction
Two trials reported myocardial infarction (MI) (Ahmadieh 2009; Ahn 2011). There were no events in these trials (175 participants).
Cerebrovascular accident
Two trials reported CVA (Ahmadieh 2009; Ahn 2011). There were no events (175 participants).
Endophthalmitis
None of the studies reported endophthalmitis.
Arterial hypertension
None of the studies reported arterial hypertension.
Pain
None of the studies reported pain.
Comparison 3: anti‐vascular endothelial growth factor with cataract surgery compared with cataract surgery alone
Only one trial considered the use of anti‐VEGF (bevacizumab) for PDR at the time of cataract surgery in 88 eyes with DR (Cheema 2009).
At six months after surgery, there was little difference in visual acuity. The mean logMAR acuity in the bevacizumab group was 0.57 (SD 0.47) compared with a mean visual acuity in the non‐bevacizumab group of 0.56 (SD 0.48) (MD 0.01, 95% CI ‐0.22 to 0.24). Twenty of 35 people in the bevacizumab group required further laser treatment compared with 16/33 people of the non‐bevacizumab group (RR 1.18, 95% CI 0.75 to 1.86).
None of the other outcomes was reported.
Sensitivity analysis: random‐effects models versus fixed‐effect models
Choice of model did not affect the conclusions with the exception of analysis 2.3 (mean visual acuity in trials of bevacizumab with vitrectomy). The 95% CIs of the pooled effect estimate from the fixed‐effect model did not include zero (null value).
| Analysis | Measure of effect in random‐effects models (95% CI) | Measure of effect in fixed‐effect models |
| MD ‐0.07 logMAR (‐0.12 to ‐0.02) | MD ‐0.07 logMAR (‐0.12 to ‐0.02) | |
| MD ‐0.24 logMAR (‐0.50 to 0.01) | MD ‐0.19 logMAR (‐0.32 to ‐0.06) | |
| RR 0.30 (0.18 to 0.52) | RR 0.32 (0.24 to 0.45) |
CI: confidence intervals; MD: mean difference; RR: risk ratio.
Sensitivity analysis: low risk of bias versus high risk of bias
For Analysis 1.1 and Analysis 2.3 (mean visual acuity) there was little difference between the estimates according to risk of bias in studies. For Analysis 1.3, it was difficult to interpret, as there was only one low risk of bias trial and there may be other differences between this study and the other studies. For Analysis 2.4, there was a difference between the low risk of bias and high risk of bias trials but it was not in the anticipated direction (i.e. the low risk of bias trials appeared to demonstrate a larger effect). However, with only two RCTs in the high risk of bias group, this result must be interpreted cautiously.
| Analysis | Measure of effect in studies at low or unclear risk of bias in all domains (95% CI) | Measure of effect in studies at high risk of bias in ≥ 1 domains (95% CI) |
| MD ‐0.10 logMAR (‐0.24 to 0.05); 2 RCTs | MD ‐0.06 logMAR (‐0.12 to ‐0.01); 3 RCTs | |
| RR 0.38 (0.18 to 0.81); 1 RCT | RR 0.14 (0.02 to 1.08); 2 RCTs | |
| MD ‐0.29 logMAR (‐0.47 to ‐0.11); 4 RCTs | MD ‐0.20 logMAR (‐0.87 to 0.48); 2 RCTs | |
| RR 0.20 (0.10 to 0.37); 5 RCTs | RR 0.46 (0.25 to 0.87); 2 RCTs |
CI: confidence intervals; MD: mean difference; RCT: randomised controlled trial; RR: risk ratio.
Discussion
Summary of main results
The aim of this review was to evaluate the effectiveness and safety of anti‐VEGF in PDR. We included 18 RCTs with 1005 participants that needed laser or surgical treatment for PDR or the complications of PDR.
People receiving anti‐VEGF in association with laser or surgical (vitrectomy) treatment for PDR were less likely to lose vision and more likely to gain vision and on average had better visual acuity at follow‐up. They were less likely to have progression of DR and less likely to experience vitreous or pre‐retinal haemorrhage. The size of the effects were of the same order of magnitude for use of anti‐VEGF associated with both laser and surgical treatment. There was only one relatively small and inconclusive trial of use of anti‐VEGF at the time of cataract surgery in people with DR.
Overall completeness and applicability of evidence
Participants included in the review presented PDR that needed PRP (eight from 18 RCTs) or complications such as vitreous haemorrhage (nine from 18 RCTs) or cataracts that needed surgery (one from 18 RCTs). The median follow‐up was six months.
Few studies have been included that assessed our primary outcome (gain or loss of 3 or more lines of ETDRS). The effects of regression of vascular proliferation were poorly reported, and quality of life was not mentioned. Furthermore, the monitoring of participants was less than one year in most studies. However, there was a sufficient number of studies that calculated visual acuity in logMAR (13 RCTs and 811 eyes) and presented data about vitreous or pre‐retinal haemorrhage (10 RCTs and 735 eyes).
The number of RCTs was variable between anti‐VEGFs, and bevacizumab (15 RCTs) was the most evaluated, followed by ranibizumab (two RCTs) and pegaptanib (one RCT). Although the level of assessment of these drugs was not the same, in the overall analysis there was no significant differences between subgroups in visual acuity and vitreous or pre‐retinal haemorrhage.
Our pre‐specified outcomes were for 12 months' follow‐up. Only two of the 18 included studies followed up to 12 months. We did not find any evidence that the size of the effect was related to length of follow‐up (data not shown) but ideally, longer follow‐up would have been available.
We found five ongoing RCTs that, in the future, may resolve doubts about the efficacy and safety of these drugs for PDR (Characteristics of ongoing studies).
Quality of the evidence
The overall quality of evidence was low or very low in this review. For the main outcome of best‐corrected visual acuity at 12 months, we downgraded the quality of the evidence to 'very low' because it was an indirect assessment. In fact, no study reported loss/gain of 3 or more lines at 12 months. Two studies reported at three months, one of these studies reported loss/gain of 2 or more lines and one study reported loss/gain of 3 or more lines; two studies reported "deterioration", which was not defined, one at six months and one at 12 months. Imprecise estimates of visual benefit were also a reason for downgrading evidence on the primary outcome expressions.
For other outcomes, we downgraded the quality of the evidence because seven RCTs had high risk of bias. The high risk of bias was due to not blinding the interventions (Ahn 2011; Ernst 2012; González 2009), attrition bias (Ahmadieh 2009; Ernst 2012; Ramos Filho 2011), and selective reporting (Ahmadieh 2009; Cho 2010; Preti 2014). Furthermore, only one trial specified the calculation of the sample size (DRCR.Net 2013), and there was imbalance between groups at baseline in one trial (Sohn 2012), and participants of the control group were worse than the participants of the experimental group at baseline.
Finally, for some outcomes, the results of the individual studies were heterogeneous and, although we provided a pooled estimate, we downgraded for inconsistency.
Potential biases in the review process
This review has methodological strengths, as it has been successful in obtaining information from trial investigators. Although not all have responded, most investigators have done so. We have also made an exhaustive search of clinical trials (including those in progress), and have assessed the risk of bias and extracted data in a duplicate way.
However, this review is limited by the quality of RCTs, which included a low number of participants and presented unclear or high risk of bias. Furthermore, three studies were not included in efficacy analysis because the fellow eye was used as a control group (Ernst 2012; Mirshahi 2008; Preti 2014).
We made some modifications to the protocol (Differences between protocol and review), but did not consider that these changes will have introduced bias.
Agreements and disagreements with other studies or reviews
As far as we know, there are no systematic reviews that have assessed overall anti‐VEGFs for PDR. We found two systematic reviews that assessed anti‐VEGF as adjuvant of vitrectomy for PDR (Zhang 2013; Smith 2011). Zhang 2013 included eight RCTs that assessed efficacy and safety of bevacizumab in the short‐term (less than one month). The pooled results showed significant benefits of bevacizumab in overall surgical time, less intraoperative bleeding and less recurrent haemorrhage within the first month. The Cochrane systematic review, Smith 2011, included four RCTs, but the results of studies were not pooled due to methodological issues. However, the authors concluded that bevacizumab may reduce the incidence of early postoperative vitreous cavity haemorrhage.
Our review has included not only studies about complications of DR that required surgery, but also those trying to treat vascular proliferation. For these reasons, our systematic review has presented a larger number of included studies and participants. The results point in the same direction as Zhang 2013. However, the quality of the evidence was low or very low and these results must be treated with caution.

Results from searching for studies for inclusion in the review.

Risk of bias graph: review authors' judgements about each risk of bias item presented as percentages across all included studies.

Risk of bias summary: review authors' judgements about each risk of bias item for each included study.
![Forest plot of comparison: 1 Anti‐vascular endothelial growth factor (anti‐VEGF) versus photocoagulation, outcome: 1.3 Visual acuity [logMAR].](/es/cdsr/doi/10.1002/14651858.CD008721.pub2/media/CDSR/CD008721/rel0002/CD008721/image_n/nCD008721-AFig-FIG04.png)
Forest plot of comparison: 1 Anti‐vascular endothelial growth factor (anti‐VEGF) versus photocoagulation, outcome: 1.3 Visual acuity [logMAR].
![Forest plot of comparison: 2 Anti‐vascular endothelial growth factor (anti‐VEGF) plus surgery versus surgery alone or surgery plus sham or placebo, outcome: 2.3 Visual acuity [logMAR].](/es/cdsr/doi/10.1002/14651858.CD008721.pub2/media/CDSR/CD008721/rel0002/CD008721/image_n/nCD008721-AFig-FIG05.png)
Forest plot of comparison: 2 Anti‐vascular endothelial growth factor (anti‐VEGF) plus surgery versus surgery alone or surgery plus sham or placebo, outcome: 2.3 Visual acuity [logMAR].

Comparison 1 Anti‐vascular endothelial growth factor (anti‐VEGF) with or without panretinal photocoagulation (PRP) versus PRP alone, Outcome 1 Visual acuity.

Comparison 1 Anti‐vascular endothelial growth factor (anti‐VEGF) with or without panretinal photocoagulation (PRP) versus PRP alone, Outcome 2 Regression of proliferative diabetic retinopathy.

Comparison 1 Anti‐vascular endothelial growth factor (anti‐VEGF) with or without panretinal photocoagulation (PRP) versus PRP alone, Outcome 3 Presence of vitreous or pre‐retinal haemorrhage.
Comparison 1 Anti‐vascular endothelial growth factor (anti‐VEGF) with or without panretinal photocoagulation (PRP) versus PRP alone, Outcome 4 Adverse effects.

Comparison 2 Bevacizumab with vitrectomy compared with vitrectomy alone, Outcome 1 Loss of 3 or more lines of ETDRS visual acuity.

Comparison 2 Bevacizumab with vitrectomy compared with vitrectomy alone, Outcome 2 Gain of 3 or more lines of ETDRS visual acuity.

Comparison 2 Bevacizumab with vitrectomy compared with vitrectomy alone, Outcome 3 Visual acuity.
Comparison 2 Bevacizumab with vitrectomy compared with vitrectomy alone, Outcome 4 Presence of vitreous or pre‐retinal haemorrhage.

Comparison 2 Bevacizumab with vitrectomy compared with vitrectomy alone, Outcome 5 Adverse effects.
| Anti‐VEGF with or without laser (panretinal photocoagulation; PRP) compared with PRP alone for proliferative diabetic retinopathy | |||||
| Patient or population: people with PDR Settings: hospital Intervention: anti‐VEGF with or without PRP Comparison: PRP | |||||
| Outcomes | Illustrative comparative risks* (95% CI) | Relative effect | No of participants | Quality of the evidence | |
| Assumed risk | Corresponding risk | ||||
| PRP | Anti‐VEGF with or without PRP | ||||
| Loss of ≥ 3 lines of ETDRS visual acuity | 300 per 1000 | 57 per 1000 (15 to 243) | RR 0.19 (0.05 to 0.81) | 61 (1 study) | ⊕⊝⊝⊝ |
| Gain of ≥ 3 lines of ETDRS visual acuity | 10 per 1000 | 68 per 1000 (4 to 1260) | RR 6.78 (0.37 to 125.95) | 61 (1 study) | ⊕⊕⊝⊝ |
| Visual acuity (logMAR scale value of 0 = 6/6 vision, higher score = worse vision) Follow‐up: 12 months | The mean visual acuity ranged across control groups from | The mean visual acuity in the intervention groups was | ‐ | 373 (5 studies) | ⊕⊕⊝⊝ |
| Regression of proliferative diabetic retinopathy (as measured by area of fluorescein leakage) Follow‐up: 12 months | In 1 trial, people who received bevacizumab in addition to PRP had more regression of PDR, as measured by area of fluorescein leakage at 6 months compared with people who had PRP alone (MD ‐8.13 mm2, 95% CI ‐10.94 mm2 to ‐5.32 mm2, 19 participants). In another trial, people who received ranibizumab in addition to PRP had more regression of PDR, as measured by change in area of fluorescein leakage between baseline and 12 months compared with people who had PRP alone, however, the size of the effect was smaller and the CIs were compatible with no effect, or less regression (MD ‐1.0 mm2, 95% CI ‐5.3 mm2 to 3.3 mm2, 20 participants) | ||||
| Presence of vitreous/pre‐retinal haemorrhage Follow‐up: 12 months | 150 per 1000 | 48 per 1000 (24 to 98) | RR 0.32 (95% CI 0.16 to 0.65) | 342 (3 studies) | ⊕⊕⊝⊝ |
| Quality of life | No data reported on quality of life | ||||
| Adverse effects | Adverse effects were reported in 3 studies: 1 study of bevacizumab plus PRP compared with PRP alone and followed up to 3 months (61 participants); 1 study of ranibizumab compared with saline (both groups received PRP if indicated) and followed up to 4 months (261 participants); 1 study of ranibizumab plus PRP compared with PRP alone and followed up to 12 months (31 participants)
| ||||
| *The basis for the assumed risk (e.g. the median control group risk across studies) is provided in footnotes. The corresponding risk (and its 95% confidence interval) is based on the assumed risk in the comparison group and the relative effect of the intervention (and its 95% CI). GRADE Working Group grades of evidence | |||||
| 1 Downgraded for risk of bias (‐1) (study at high risk of selective reporting bias) imprecision (‐1) (wide CIs) and indirectness (‐1) (study reported gain/loss of ≥ 2 lines at 3 months only). 3 Downgraded for risk of bias (‐1) (2 studies at high risk of bias in ≥ 1 domain) and downgraded for indirectness (‐1) (no study reported at 12 months). | |||||
| Bevacizumab before or during vitrectomy compared with vitrectomy alone | |||||
| Patient or population: people undergoing vitrectomy for PDR Settings: hospital Intervention: bevacizumab before or during vitrectomy Comparison: vitrectomy alone or vitrectomy with sham injection | |||||
| Outcomes | Illustrative comparative risks* (95% CI) | Relative effect | No of participants | Quality of the evidence | |
| Assumed risk | Corresponding risk | ||||
| Surgery | Anti‐VEGF plus surgery | ||||
| Loss of ≥ 3 lines of ETDRS visual acuity Follow‐up: 12 months | 60 per 1000 | 29 per 1000 | RR 0.49 | 94 | ⊕⊕⊝⊝ |
| Gain of ≥ 3 lines of ETDRS visual acuity Follow‐up: 12 months | 500 per 1000 | 810 per 1000 | RR 1.62 | 94 | ⊕⊕⊝⊝ |
| Visual acuity logMAR Follow‐up: 12 months | The mean visual acuity ranged across control groups from | The mean visual acuity in the intervention groups was | ‐ | 335 | ⊕⊕⊝⊝ |
| Regression of PDR (as measured by area of fluorescein leakage) Follow‐up: 12 months | No data reported on regression of PDR | ||||
| Presence of vitreous/pre‐retinal haemorrhage Follow‐up: 12 months | 500 per 1000 | 150 per 1000 (90 to 260) | RR 0.30 (0.18 to 0.52) | 393 (7 studies) | ⊕⊕⊝⊝ |
| Quality of life | No data reported on quality of life | ||||
| Adverse effects | Neovascular glaucoma: RR 2.33 (95% CI 0.28 to 19.17; 1 RCT, 368 participants) Retinal detachment: RR 0.56 (95% CI 0.11 to 2.86; 3 RCTs, 182 participants) Cataract: RR 0.68 (95% CI 0.38 to 1.23; 2 RCTs, 137 participants) Raised intraocular pressure: RR 0.31 (95% CI 0.01 to 7.47; 1 RCT, 68 participants) Myocardial infarction: no events in 2 trials (175 participants) Cerebrovascular accident: no events in 2 trials (175 participants) Endophthalmitis: none of the studies reported endophthalmitis Arterial hypertension: none of the studies reported arterial hypertension Pain: none of the studies reported pain | ||||
| *The basis for the assumed risk (e.g. the median control group risk across studies) is provided in footnotes. The corresponding risk (and its 95% confidence interval) is based on the assumed risk in the comparison group and the relative effect of the intervention (and its 95% CI). | |||||
| GRADE Working Group grades of evidence | |||||
| 1 Downgraded for imprecision (‐1) (wide CIs) and downgraded for indirectness (‐1) (only 1 trial reported at 12 months and only 1 (other) trial reported loss of ≥ 3 lines). 3Downgraded for risk of bias (‐1) (2 studies at high risk of bias in ≥ 1 domains) and downgraded for inconsistency (‐1) (I2 = 66%). 4 Downgraded for risk of bias (‐1) (2 studies at high risk of bias in ≥ 1 domains, 3 studies at unclear risk of bias in ≥ 3 domains) and downgraded for indirectness (‐1) (only 1 study reported at 12 months). | |||||
| Mild | Presence of at least 1 microaneurysm |
| Moderate | Haemorrhages or microaneurysms (or both) more than standard photo 2A, presence of soft exudates, venous beading, IRMA definitively present |
| Severe | Haemorrhages or microaneurysms (or both) more than standard photo 2A in all 4 quadrants, or venous beading in ≥ 2 quadrants, or IRMA more than standard photo 8A in at least 1 quadrant |
| Very severe | Any ≥ 2 of the changes seen in severe NPDR |
| Early PDR | Presence of new vessels |
| High‐risk PDR | Any of the following: NVD more than one‐third to one‐quarter disc diameter, NVD less than one‐third to one‐quarter disc diameter with vitreous or pre‐retinal haemorrhage, new vessels elsewhere with vitreous or pre‐retinal haemorrhage |
| ETDRS: Early Treatment Diabetic Retinopathy Study; IRMA: intraretinal microaneurysm; NPDR: non‐proliferative diabetic retinopathy; NVD: new vessels at optic disc; PDR: proliferative diabetic retinopathy. | |
| Non‐apparent retinopathy | No abnormalities |
| Mild NPDR | Microaneurysms only |
| Moderate NPDR | More than just microaneurysms but less than severe NPDR |
| Severe NPDR | Any of the following: > 20 intraretinal haemorrhages in each of 4 quadrants; definite venous beading in 2 quadrants; prominent intraretinal microvascular abnormalities in 1 quadrant and no signs of proliferative retinopathy |
| Proliferative diabetic retinopathy | ≥ 1 of the following: neovascularisation, vitreous or pre‐retinal haemorrhage |
| ICDRDS: International Clinical Diabetic Retinopathy Disease Severity scale; NPDR: non‐proliferative diabetic retinopathy. | |
| Outcome or subgroup title | No. of studies | No. of participants | Statistical method | Effect size |
| 1 Visual acuity Show forest plot | 5 | 373 | Mean Difference (IV, Random, 95% CI) | ‐0.07 [‐0.12, ‐0.02] |
| 1.1 Pegaptanib | 1 | 16 | Mean Difference (IV, Random, 95% CI) | ‐0.06 [‐0.22, 0.10] |
| 1.2 Bevacizumab | 2 | 80 | Mean Difference (IV, Random, 95% CI) | ‐0.01 [‐0.11, 0.09] |
| 1.3 Ranibizumab | 2 | 277 | Mean Difference (IV, Random, 95% CI) | ‐0.10 [‐0.16, ‐0.03] |
| 2 Regression of proliferative diabetic retinopathy Show forest plot | 2 | Mean Difference (IV, Fixed, 95% CI) | Totals not selected | |
| 3 Presence of vitreous or pre‐retinal haemorrhage Show forest plot | 3 | 342 | Risk Ratio (M‐H, Fixed, 95% CI) | 0.32 [0.16, 0.65] |
| 3.1 Bevacizumab | 1 | 61 | Risk Ratio (M‐H, Fixed, 95% CI) | 0.11 [0.01, 1.92] |
| 3.2 Pegaptanib | 1 | 20 | Risk Ratio (M‐H, Fixed, 95% CI) | 0.2 [0.01, 3.70] |
| 3.3 Ranibizumab versus control | 1 | 261 | Risk Ratio (M‐H, Fixed, 95% CI) | 0.38 [0.18, 0.81] |
| 4 Adverse effects Show forest plot | 2 | Risk Ratio (M‐H, Fixed, 95% CI) | Subtotals only | |
| 4.1 Neovascular glaucoma | 1 | 261 | Risk Ratio (M‐H, Fixed, 95% CI) | 1.09 [0.07, 17.21] |
| 4.2 Retinal detachment | 1 | 261 | Risk Ratio (M‐H, Fixed, 95% CI) | 0.99 [0.44, 2.25] |
| 4.3 Cataract | 1 | 61 | Risk Ratio (M‐H, Fixed, 95% CI) | 0.32 [0.01, 7.63] |
| 4.4 Raised intraocular pressure | 2 | 322 | Risk Ratio (M‐H, Fixed, 95% CI) | 0.75 [0.42, 1.36] |
| 4.5 Cerebrovascular accident | 2 | 322 | Risk Ratio (M‐H, Fixed, 95% CI) | 3.26 [0.13, 79.34] |
| 4.6 Endophalmitis | 1 | 261 | Risk Ratio (M‐H, Fixed, 95% CI) | 0.36 [0.01, 8.82] |
| 4.7 Arterial hypertension | 1 | 261 | Risk Ratio (M‐H, Fixed, 95% CI) | 0.47 [0.12, 1.76] |
| Outcome or subgroup title | No. of studies | No. of participants | Statistical method | Effect size |
| 1 Loss of 3 or more lines of ETDRS visual acuity Show forest plot | 3 | 94 | Risk Ratio (M‐H, Fixed, 95% CI) | 0.49 [0.08, 3.14] |
| 2 Gain of 3 or more lines of ETDRS visual acuity Show forest plot | 3 | 94 | Risk Ratio (M‐H, Fixed, 95% CI) | 1.62 [1.20, 2.17] |
| 3 Visual acuity Show forest plot | 6 | 335 | Mean Difference (IV, Random, 95% CI) | ‐0.24 [‐0.50, 0.01] |
| 4 Presence of vitreous or pre‐retinal haemorrhage Show forest plot | 7 | 393 | Risk Ratio (M‐H, Random, 95% CI) | 0.30 [0.18, 0.52] |
| 5 Adverse effects Show forest plot | 5 | Risk Ratio (M‐H, Random, 95% CI) | Subtotals only | |
| 5.1 Neovascular glaucoma | 1 | 107 | Risk Ratio (M‐H, Random, 95% CI) | 2.33 [0.28, 19.17] |
| 5.2 Retinal detachment | 3 | 182 | Risk Ratio (M‐H, Random, 95% CI) | 0.56 [0.11, 2.86] |
| 5.3 Cataract | 2 | 137 | Risk Ratio (M‐H, Random, 95% CI) | 0.68 [0.38, 1.23] |
| 5.4 Raised intraocular pressure | 1 | 68 | Risk Ratio (M‐H, Random, 95% CI) | 0.31 [0.01, 7.47] |
| 5.5 Myocardial infarction | 2 | 175 | Risk Ratio (M‐H, Random, 95% CI) | 0.0 [0.0, 0.0] |
| 5.6 Cerebrovascular accident | 2 | 175 | Risk Ratio (M‐H, Random, 95% CI) | 0.0 [0.0, 0.0] |
| 5.7 Arterial hypertension | 0 | 0 | Risk Ratio (M‐H, Random, 95% CI) | 0.0 [0.0, 0.0] |