Cabestrillo con incisión simple para la incontinencia urinaria en mujeres
Información
- DOI:
- https://doi.org/10.1002/14651858.CD008709.pub3Copiar DOI

- Base de datos:
-
- Cochrane Database of Systematic Reviews
- Versión publicada:
-
- 26 julio 2017see what's new
- Tipo:
-
- Intervention
- Etapa:
-
- Review
- Grupo Editorial Cochrane:
-
Grupo Cochrane de Incontinencia
- Copyright:
-
- Copyright © 2017 The Cochrane Collaboration. Published by John Wiley & Sons, Ltd.
Cifras del artículo
Altmetric:
Citado por:
Autores
Contributions of authors
Arjun Nambiar wrote the text of the main review. He performed the initial screening of studies for inclusion, assessment of methodological quality of included trials, data extraction and analysis of results.
June D Cody made significant input to writing of the final review, including writing the risk of bias section. She performed confirmatory screening of studies for inclusion, assessment of methodological quality, data extraction and analysis of the results.
Stephen T Jeffery wrote the original protocol and incorporated comments from co‐authors. He performed screening of studies for inclusion, assessment of methodological quality and data extraction. He also performed confirmatory analysis of the results.
Stephen T Jeffery and Arjun Nambiar were responsible for clinical input for the review. June D Cody provided methodological input.
For the July 2017 addition of the BECs to this review: Patricia Aluko was responsible for the entire BECs‐related work on this review, i.e. she ran the search for studies, screened the search results, extracted data from relevant studies, revised any existing economics‐related text, added the BECs‐related text, and responded to any peer referee comments. All authors had the opportunity to comment on the revised review.
Sources of support
Internal sources
-
No sources of support supplied
External sources
-
National Institute for Health Research (NIHR), UK.
This project was supported by the National Institute for Health Research, via Cochrane Infrastructure funding to the Cochrane Incontinence Group. The views and opinions expressed therein are those of the authors and do not necessarily reflect those of the Systematic Reviews Programme, NIHR, NHS or the Department of Health. The National Institute for Health Research (NIHR) is the largest single funder of the Cochrane Incontinence Group.
-
National Institute for Health Research, UK.
This project, to add Brief Economic Commentaries to our surgery for UI in women reviews, was supported by the National Institute for Health Research (NIHR), via the Cochrane Review Incentive Scheme 2016, to the Cochrane Incontinence Group. The views and opinions expressed therein are those of the authors and do not necessarily reflect those of the Systematic Reviews Programme, NIHR, NHS or the Department of Health.
Declarations of interest
Arjun Nambiar: June 2014: has received travel and educational grants from Pfizer, Astellas and GSK. July 2017: has received educational grants towards travel and accommodation for attending conferences and meetings from the following pharmaceutical companies: Ferring and Takeda; he is also a member of the EAU guideline panel on Urinary Incontinence.
June D Cody: June 2014 and July 2017: has no conflicts of interest to declare.
Stephen T Jeffery: June 2014: is a speaker for Johnson and Johnson (Women’s Health and Urology) and Bard Medical and is part of a randomised trial on Contasure Needleless. He has received honoraria and travel and educational grants from Bard, Johnson and Johnson and Boston Scientific. July 2017: Has received support from Boston Scientific for support for travel to meetings for the study or other purposes and outside the submitted work has received travel support and honoraria from Boston Scientific and received payment for lectures from Pfizer (on complications of sling surgery) and from Boston Scientific for a lecture at a symposium at an IUGA annual meeting. He has received speaker's fees for Aspen.
Patricia Aluko: July 2017: This project, to add Brief Economic Commentaries to our 'Surgery for UI in women' reviews, was supported by the National Institute for Health Research (NIHR), via the Cochrane Review Incentive Scheme 2016, to the Cochrane Incontinence Group. The views and opinions expressed therein are those of the authors and do not necessarily reflect those of the Systematic Reviews Programme, NIHR, NHS or the Department of Health.
Acknowledgements
We thank Sheila Wallace for her efficiency and professionalism in conducting the literature search.
We thank Cathryn Glazener for her input and help with arbitration of disagreements.
We would like to acknowledge Peter de Jong, Zeelha Abdool, Frans van Wijk, Vincent Lucente and Miles Murphy for their contributions to the original protocol.
Version history
| Published | Title | Stage | Authors | Version |
| 2023 Oct 27 | Single‐incision sling operations for urinary incontinence in women | Review | Emily Carter, Eugenie E Johnson, Madeleine Still, Aalya S Al-Assaf, Andrew Bryant, Patricia Aluko, Stephen T Jeffery, Arjun Nambiar | |
| 2017 Jul 26 | Single‐incision sling operations for urinary incontinence in women | Review | Arjun Nambiar, June D Cody, Stephen T Jeffery, Patricia Aluko | |
| 2014 Jun 01 | Single‐incision sling operations for urinary incontinence in women | Review | Arjun Nambiar, June D Cody, Stephen T Jeffery | |
| 2010 Sep 08 | Single‐incision sling operations for urinary incontinence in women | Protocol | Stephen T Jeffery, Peter De Jong, Zeelha Abdool, Frans Van Wijk, Vincent Lucente, Miles Murphy | |
Differences between protocol and review
The original protocol stated that trials in which concomitant surgery was performed (e.g. genitourinary prolapse repair) would be excluded. However it was found that a number of trials included, or were unclear about the inclusion of, women undergoing concomitant prolapse surgery, and on further discussion the review authors believed that not including these trials could represent a source of bias. Concomitant stress incontinence and prolapse are common problems that are frequently corrected simultaneously at surgery; therefore we believed it was important to assess single‐incision slings in this clinically relevant scenario. When appropriate, sensitivity analyses were conducted, excluding those trials in which concomitant surgery was performed.
The review authors decided not to carry out assessment of bias due to selective outcome reporting.
We did not include qualitative studies in this review.
Sensitivity analyses were performed when it was thought that differences in duration of follow‐up may represent a source of bias.
Although subgroup analysis was planned in the Protocol, not enough information was available to allow this to be carried out in the review: this may be incorporated in future versions.
July 2017 update: We have added Brief Economic Commentaries (BECs) to all of our 'Surgery for UI in women' Cochrane Reviews. We have revised the economic elements throughout the review; if incorrect, we have stripped them out. We have added new economics‐related text. This involved revisions to the Background section, Methods section, e.g. search section referring to added Appendix, Discussion section, Abstract and Plain Language Summary. We have added an appendix with details of the economics searches. The Conclusions section of the review has not changed. The rest of the review has not changed.
Keywords
MeSH
Medical Subject Headings (MeSH) Keywords
Medical Subject Headings Check Words
Female; Humans;
PICO
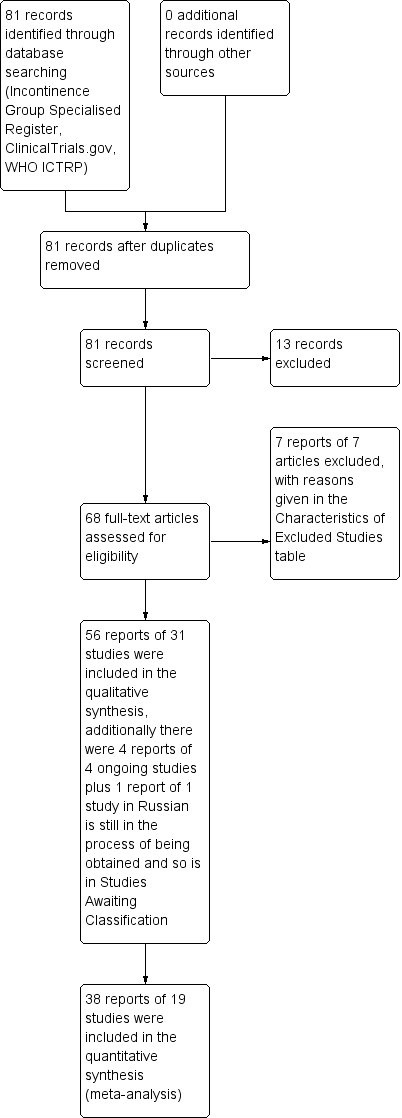
PRISMA study flow diagram.

Risk of bias graph: review authors' judgements about each risk of bias item presented as percentages across all included studies.
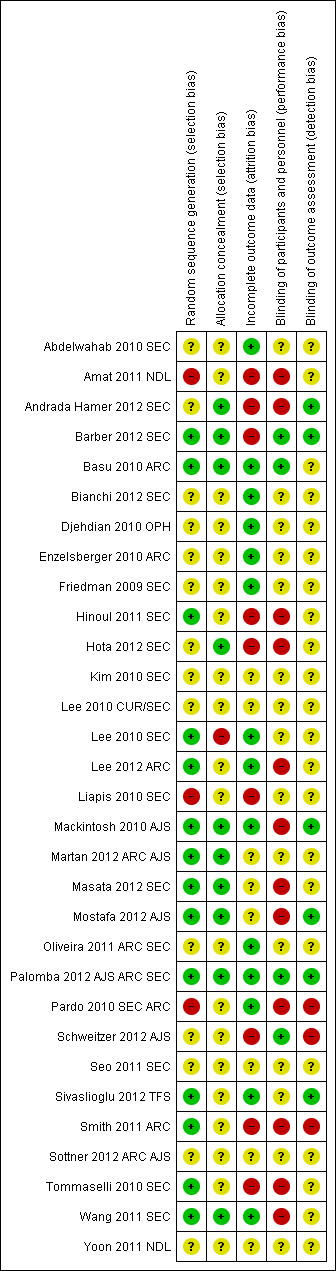
Risk of bias summary: review authors' judgements about each risk of bias item for each included study.
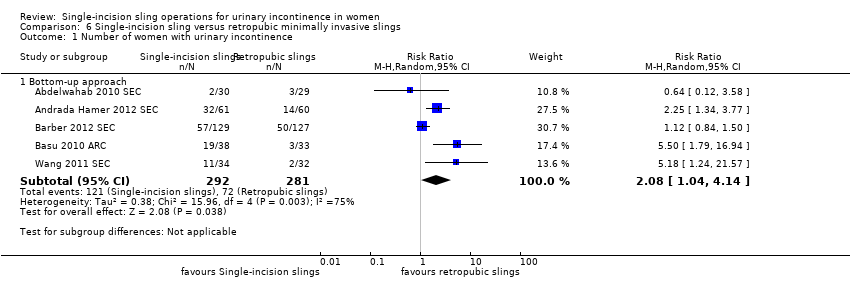
Comparison 6 Single‐incision sling versus retropubic minimally invasive slings, Outcome 1 Number of women with urinary incontinence.

Comparison 6 Single‐incision sling versus retropubic minimally invasive slings, Outcome 2 Number of women with no improvement.
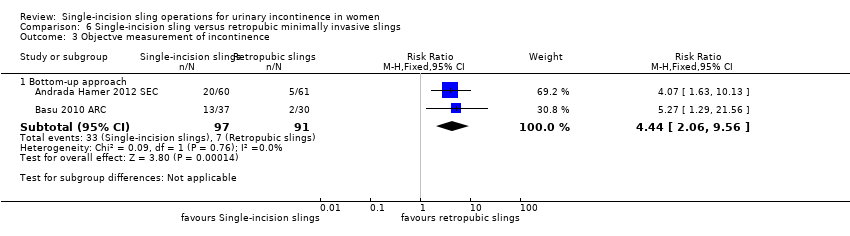
Comparison 6 Single‐incision sling versus retropubic minimally invasive slings, Outcome 3 Objectve measurement of incontinence.
Comparison 6 Single‐incision sling versus retropubic minimally invasive slings, Outcome 4 Condition‐specific health measures.
Comparison 6 Single‐incision sling versus retropubic minimally invasive slings, Outcome 5 Duration of operation (in minutes).
Comparison 6 Single‐incision sling versus retropubic minimally invasive slings, Outcome 6 Operative blood loss.

Comparison 6 Single‐incision sling versus retropubic minimally invasive slings, Outcome 7 Length of in‐patient stay.

Comparison 6 Single‐incision sling versus retropubic minimally invasive slings, Outcome 8 Major vascular or visceral injury.

Comparison 6 Single‐incision sling versus retropubic minimally invasive slings, Outcome 9 Vaginal wall perforation.

Comparison 6 Single‐incision sling versus retropubic minimally invasive slings, Outcome 10 Bladder or urethral perforation.
Comparison 6 Single‐incision sling versus retropubic minimally invasive slings, Outcome 11 Urinary retention and need for catheterisation.

Comparison 6 Single‐incision sling versus retropubic minimally invasive slings, Outcome 12 Infection related to use of synthetic mesh.
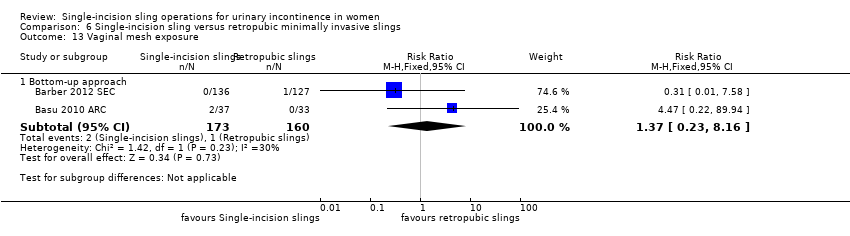
Comparison 6 Single‐incision sling versus retropubic minimally invasive slings, Outcome 13 Vaginal mesh exposure.

Comparison 6 Single‐incision sling versus retropubic minimally invasive slings, Outcome 14 Mesh extrusion into the bladder or urethra.

Comparison 6 Single‐incision sling versus retropubic minimally invasive slings, Outcome 15 Long‐term pain or discomfort.

Comparison 6 Single‐incision sling versus retropubic minimally invasive slings, Outcome 16 Dyspareunia.
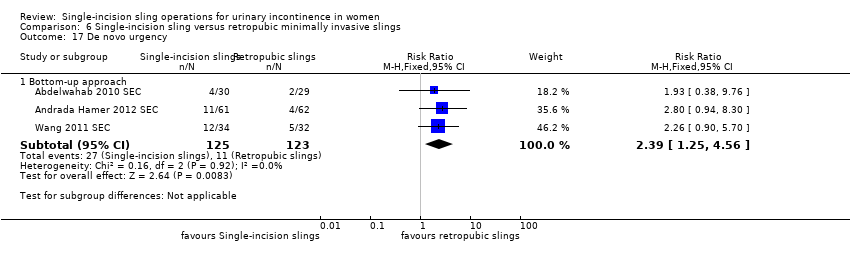
Comparison 6 Single‐incision sling versus retropubic minimally invasive slings, Outcome 17 De novo urgency.

Comparison 6 Single‐incision sling versus retropubic minimally invasive slings, Outcome 18 New‐onset detrusor overactivity.

Comparison 6 Single‐incision sling versus retropubic minimally invasive slings, Outcome 19 Repeat stress incontinence surgery.
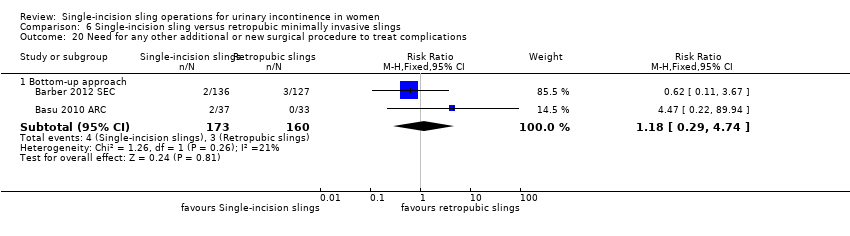
Comparison 6 Single‐incision sling versus retropubic minimally invasive slings, Outcome 20 Need for any other additional or new surgical procedure to treat complications.
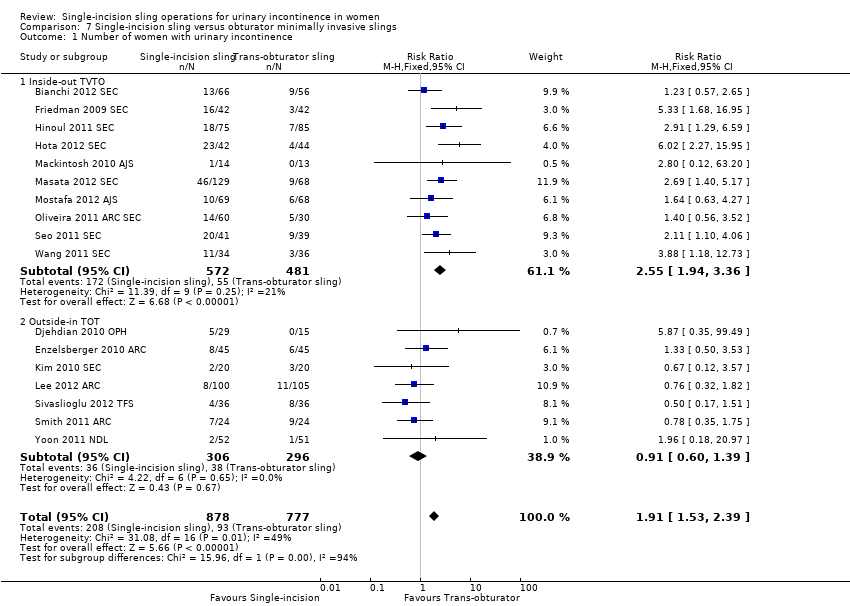
Comparison 7 Single‐incision sling versus obturator minimally invasive slings, Outcome 1 Number of women with urinary incontinence.
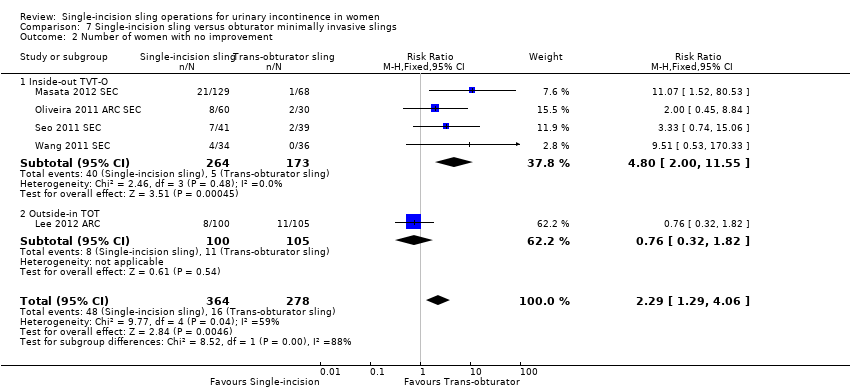
Comparison 7 Single‐incision sling versus obturator minimally invasive slings, Outcome 2 Number of women with no improvement.

Comparison 7 Single‐incision sling versus obturator minimally invasive slings, Outcome 3 Objective measurement of incontinence.

Comparison 7 Single‐incision sling versus obturator minimally invasive slings, Outcome 4 Incontinence episodes.

Comparison 7 Single‐incision sling versus obturator minimally invasive slings, Outcome 5 Pad test (weights).
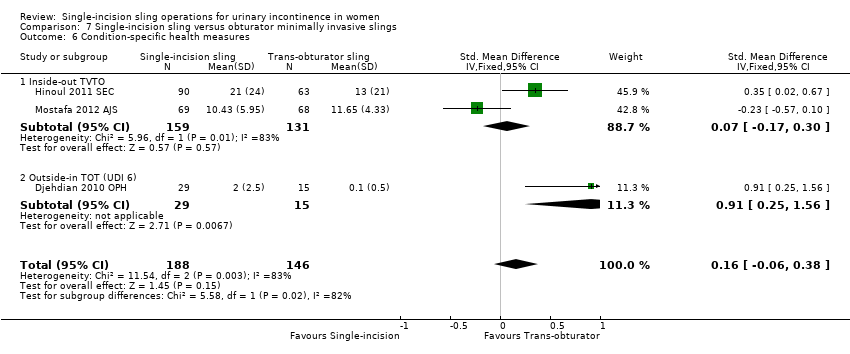
Comparison 7 Single‐incision sling versus obturator minimally invasive slings, Outcome 6 Condition‐specific health measures.
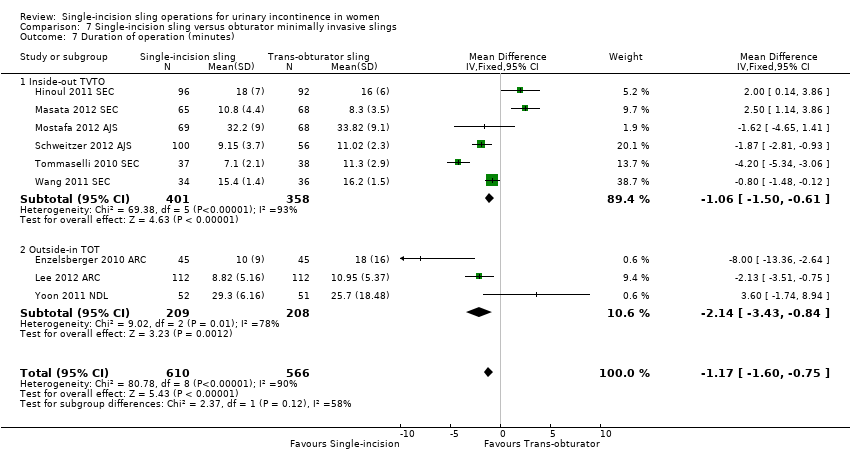
Comparison 7 Single‐incision sling versus obturator minimally invasive slings, Outcome 7 Duration of operation (minutes).

Comparison 7 Single‐incision sling versus obturator minimally invasive slings, Outcome 8 Operative blood loss (mL).
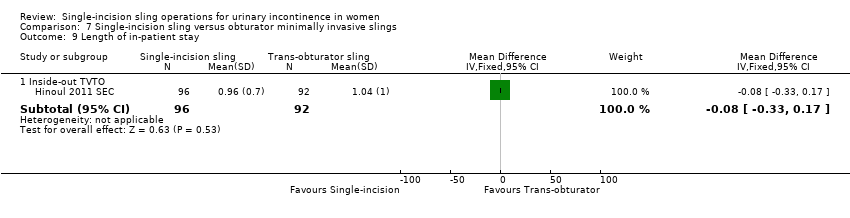
Comparison 7 Single‐incision sling versus obturator minimally invasive slings, Outcome 9 Length of in‐patient stay.

Comparison 7 Single‐incision sling versus obturator minimally invasive slings, Outcome 10 Major vascular or visceral injury.
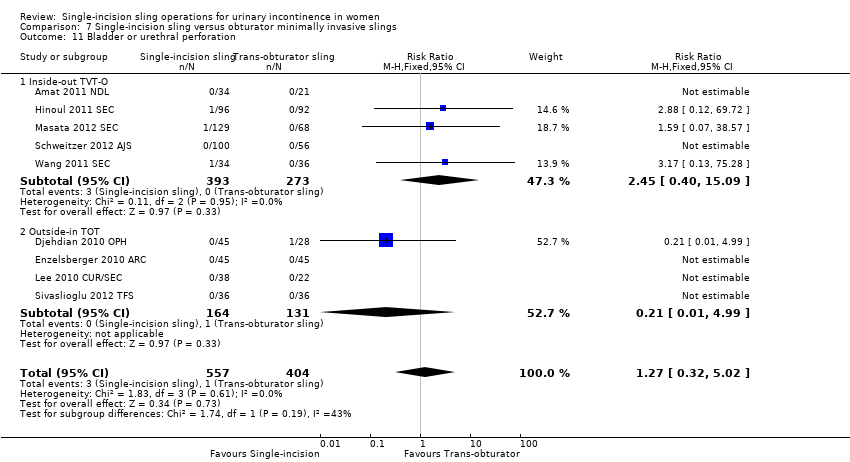
Comparison 7 Single‐incision sling versus obturator minimally invasive slings, Outcome 11 Bladder or urethral perforation.
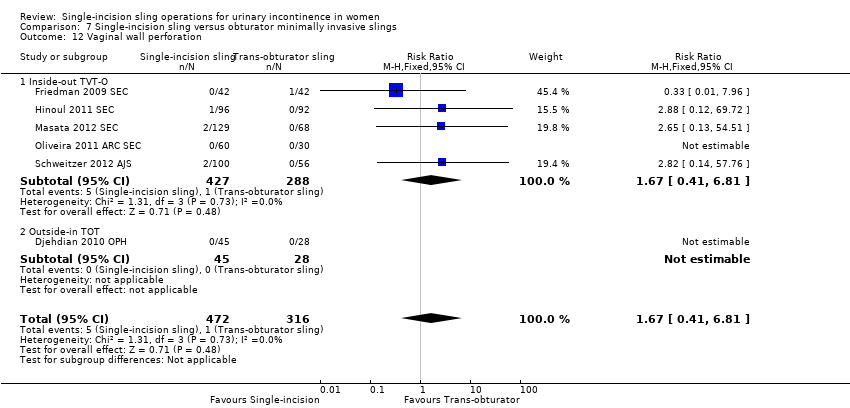
Comparison 7 Single‐incision sling versus obturator minimally invasive slings, Outcome 12 Vaginal wall perforation.

Comparison 7 Single‐incision sling versus obturator minimally invasive slings, Outcome 13 Urinary retention and need for catheterisation.
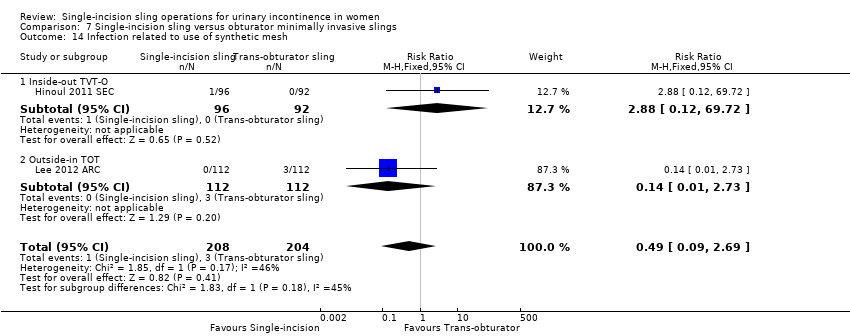
Comparison 7 Single‐incision sling versus obturator minimally invasive slings, Outcome 14 Infection related to use of synthetic mesh.

Comparison 7 Single‐incision sling versus obturator minimally invasive slings, Outcome 15 Vaginal mesh exposure.
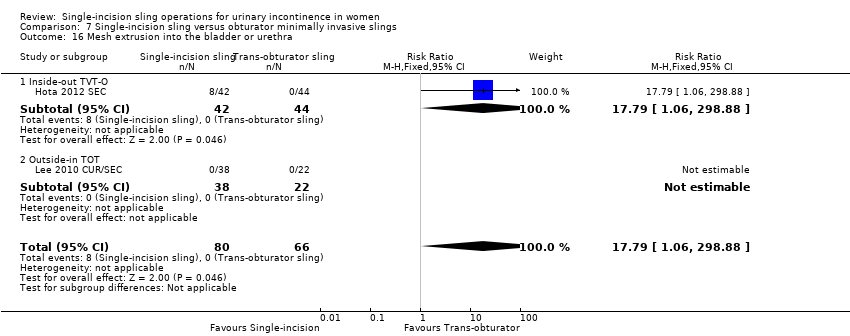
Comparison 7 Single‐incision sling versus obturator minimally invasive slings, Outcome 16 Mesh extrusion into the bladder or urethra.
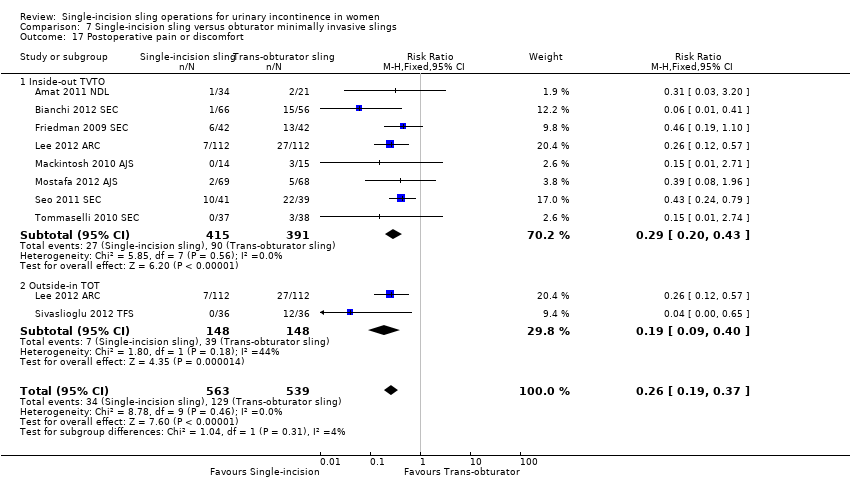
Comparison 7 Single‐incision sling versus obturator minimally invasive slings, Outcome 17 Postoperative pain or discomfort.
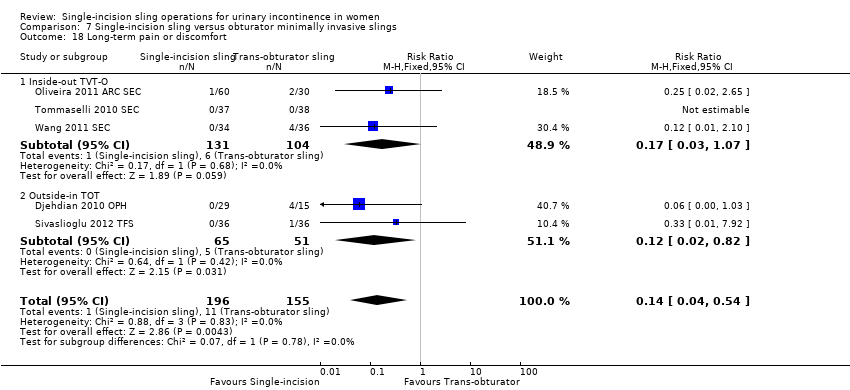
Comparison 7 Single‐incision sling versus obturator minimally invasive slings, Outcome 18 Long‐term pain or discomfort.
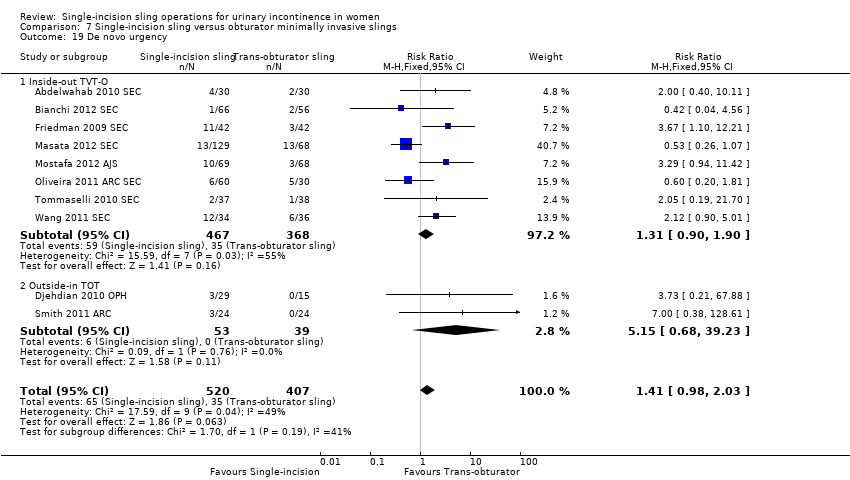
Comparison 7 Single‐incision sling versus obturator minimally invasive slings, Outcome 19 De novo urgency.

Comparison 7 Single‐incision sling versus obturator minimally invasive slings, Outcome 20 Repeat stress incontinence surgery.
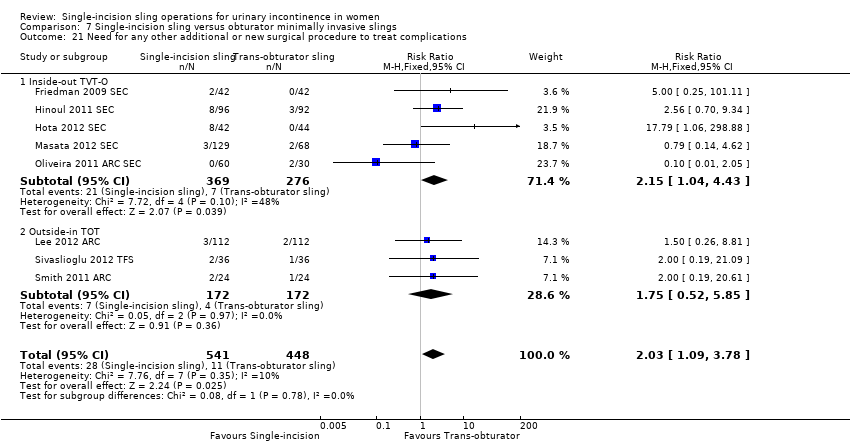
Comparison 7 Single‐incision sling versus obturator minimally invasive slings, Outcome 21 Need for any other additional or new surgical procedure to treat complications.

Comparison 8 One single‐incision sling versus another, Outcome 1 Number of women with urinary incontinence.
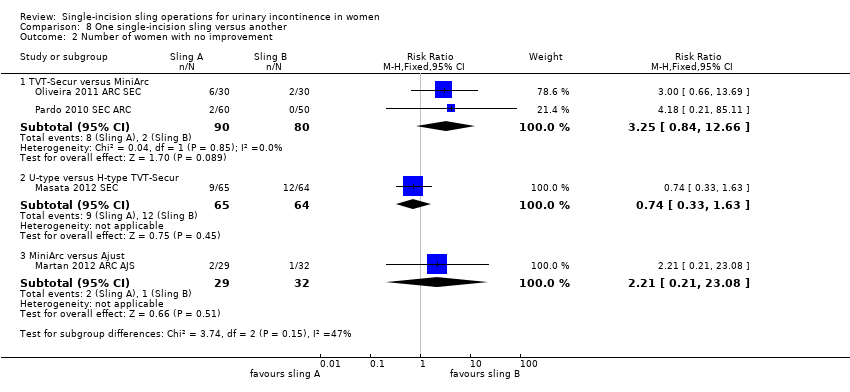
Comparison 8 One single‐incision sling versus another, Outcome 2 Number of women with no improvement.
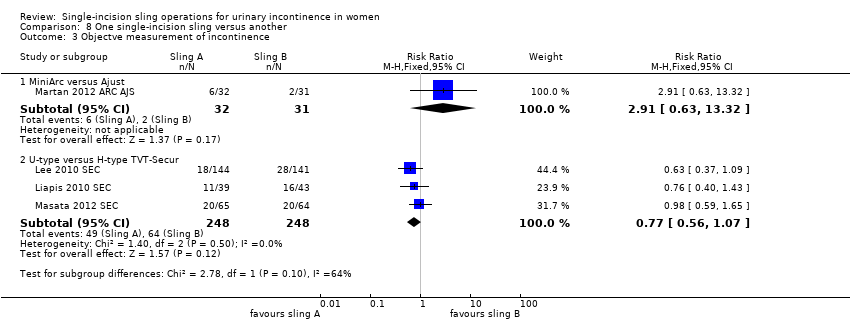
Comparison 8 One single‐incision sling versus another, Outcome 3 Objectve measurement of incontinence.
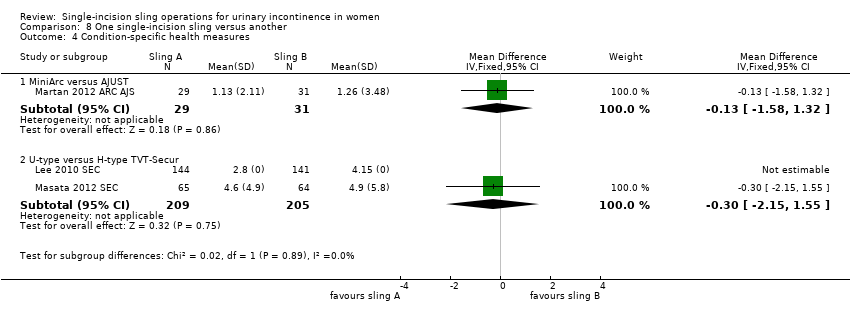
Comparison 8 One single‐incision sling versus another, Outcome 4 Condition‐specific health measures.

Comparison 8 One single‐incision sling versus another, Outcome 5 Duration of operation (minutes).
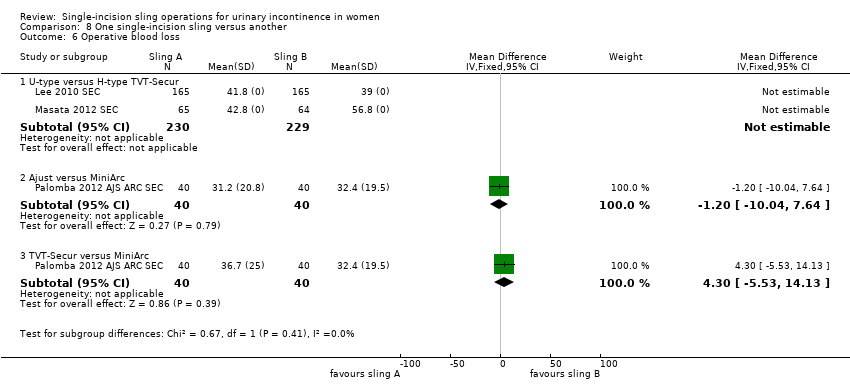
Comparison 8 One single‐incision sling versus another, Outcome 6 Operative blood loss.

Comparison 8 One single‐incision sling versus another, Outcome 7 Major vascular or visceral injury.

Comparison 8 One single‐incision sling versus another, Outcome 8 Bladder or urethral perforation.

Comparison 8 One single‐incision sling versus another, Outcome 9 Vaginal wall perforation.

Comparison 8 One single‐incision sling versus another, Outcome 10 Urinary retention and need for catheterisation.
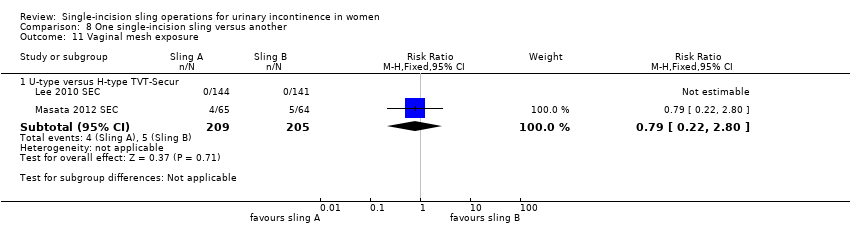
Comparison 8 One single‐incision sling versus another, Outcome 11 Vaginal mesh exposure.

Comparison 8 One single‐incision sling versus another, Outcome 12 Postoperative pain or discomfort.
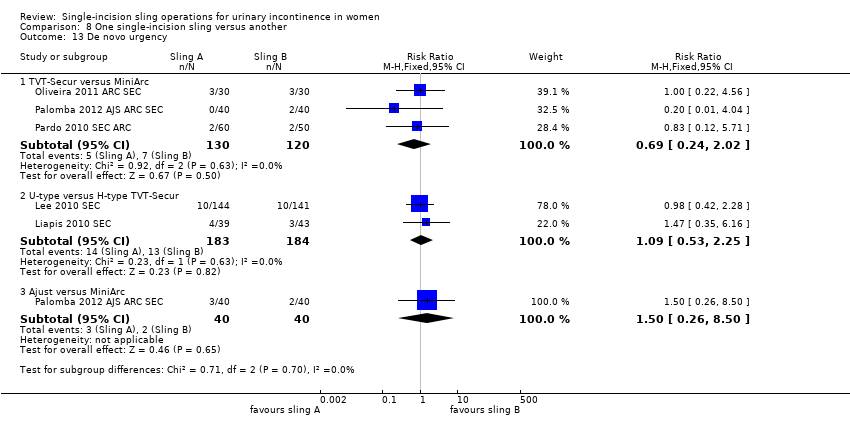
Comparison 8 One single‐incision sling versus another, Outcome 13 De novo urgency.
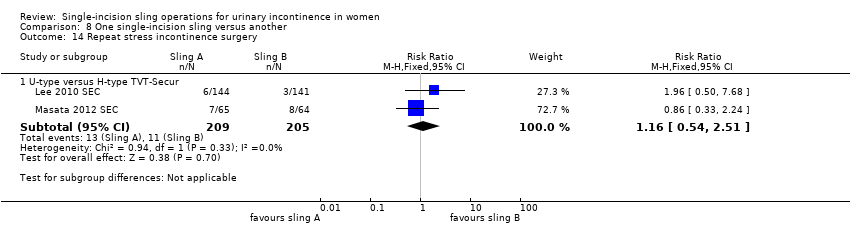
Comparison 8 One single‐incision sling versus another, Outcome 14 Repeat stress incontinence surgery.

Comparison 8 One single‐incision sling versus another, Outcome 15 Need for any other additional or new surgical procedure to treat complications.
| Outcome or subgroup title | No. of studies | No. of participants | Statistical method | Effect size |
| 1 Number of women with urinary incontinence Show forest plot | 5 | Risk Ratio (M‐H, Random, 95% CI) | Subtotals only | |
| 1.1 Bottom‐up approach | 5 | 573 | Risk Ratio (M‐H, Random, 95% CI) | 2.08 [1.04, 4.14] |
| 2 Number of women with no improvement Show forest plot | 3 | Risk Ratio (M‐H, Fixed, 95% CI) | Subtotals only | |
| 2.1 Bottom‐up approach | 3 | 246 | Risk Ratio (M‐H, Fixed, 95% CI) | 1.38 [0.55, 3.46] |
| 3 Objectve measurement of incontinence Show forest plot | 2 | Risk Ratio (M‐H, Fixed, 95% CI) | Subtotals only | |
| 3.1 Bottom‐up approach | 2 | 188 | Risk Ratio (M‐H, Fixed, 95% CI) | 4.44 [2.06, 9.56] |
| 4 Condition‐specific health measures Show forest plot | 1 | Mean Difference (IV, Fixed, 95% CI) | Totals not selected | |
| 4.1 Bottom‐up approach | 1 | Mean Difference (IV, Fixed, 95% CI) | 0.0 [0.0, 0.0] | |
| 5 Duration of operation (in minutes) Show forest plot | 3 | Mean Difference (IV, Random, 95% CI) | Subtotals only | |
| 5.1 Bottom‐up approach | 3 | 386 | Mean Difference (IV, Random, 95% CI) | ‐17.33 [‐32.09, ‐2.57] |
| 6 Operative blood loss Show forest plot | 1 | Mean Difference (IV, Fixed, 95% CI) | Totals not selected | |
| 6.1 Bottom‐up approach | 1 | Mean Difference (IV, Fixed, 95% CI) | 0.0 [0.0, 0.0] | |
| 7 Length of in‐patient stay Show forest plot | 1 | Mean Difference (IV, Fixed, 95% CI) | Totals not selected | |
| 7.1 Bottom‐up approach | 1 | Mean Difference (IV, Fixed, 95% CI) | 0.0 [0.0, 0.0] | |
| 8 Major vascular or visceral injury Show forest plot | 1 | Risk Ratio (M‐H, Fixed, 95% CI) | Totals not selected | |
| 8.1 Bottom‐up approach | 1 | Risk Ratio (M‐H, Fixed, 95% CI) | 0.0 [0.0, 0.0] | |
| 9 Vaginal wall perforation Show forest plot | 2 | Risk Ratio (M‐H, Fixed, 95% CI) | Totals not selected | |
| 9.1 Bottom‐up approach | 2 | Risk Ratio (M‐H, Fixed, 95% CI) | 0.0 [0.0, 0.0] | |
| 10 Bladder or urethral perforation Show forest plot | 4 | Risk Ratio (M‐H, Fixed, 95% CI) | Subtotals only | |
| 10.1 Bottom‐up approach | 4 | 532 | Risk Ratio (M‐H, Fixed, 95% CI) | 0.45 [0.15, 1.38] |
| 11 Urinary retention and need for catheterisation Show forest plot | 5 | Risk Ratio (M‐H, Fixed, 95% CI) | Subtotals only | |
| 11.1 Bottom‐up approach | 5 | 578 | Risk Ratio (M‐H, Fixed, 95% CI) | 0.87 [0.38, 1.99] |
| 12 Infection related to use of synthetic mesh Show forest plot | 1 | Risk Ratio (M‐H, Fixed, 95% CI) | Subtotals only | |
| 12.1 Bottom‐up approach | 1 | 50 | Risk Ratio (M‐H, Fixed, 95% CI) | 2.0 [0.22, 17.89] |
| 13 Vaginal mesh exposure Show forest plot | 2 | Risk Ratio (M‐H, Fixed, 95% CI) | Subtotals only | |
| 13.1 Bottom‐up approach | 2 | 333 | Risk Ratio (M‐H, Fixed, 95% CI) | 1.37 [0.23, 8.16] |
| 14 Mesh extrusion into the bladder or urethra Show forest plot | 3 | Risk Ratio (M‐H, Fixed, 95% CI) | Subtotals only | |
| 14.1 Bottom‐up approach | 3 | 445 | Risk Ratio (M‐H, Fixed, 95% CI) | 0.76 [0.19, 3.01] |
| 15 Long‐term pain or discomfort Show forest plot | 2 | 329 | Odds Ratio (M‐H, Fixed, 95% CI) | 0.0 [0.0, 0.0] |
| 15.1 Bottom‐up approach | 2 | 329 | Odds Ratio (M‐H, Fixed, 95% CI) | 0.0 [0.0, 0.0] |
| 16 Dyspareunia Show forest plot | 1 | Risk Ratio (M‐H, Fixed, 95% CI) | Subtotals only | |
| 16.1 Bottom‐up approach | 1 | 59 | Risk Ratio (M‐H, Fixed, 95% CI) | 2.9 [0.32, 26.30] |
| 17 De novo urgency Show forest plot | 3 | Risk Ratio (M‐H, Fixed, 95% CI) | Subtotals only | |
| 17.1 Bottom‐up approach | 3 | 248 | Risk Ratio (M‐H, Fixed, 95% CI) | 2.39 [1.25, 4.56] |
| 18 New‐onset detrusor overactivity Show forest plot | 1 | Risk Ratio (M‐H, Fixed, 95% CI) | Subtotals only | |
| 18.1 Bottom‐up approach | 1 | 70 | Risk Ratio (M‐H, Fixed, 95% CI) | 0.89 [0.13, 5.98] |
| 19 Repeat stress incontinence surgery Show forest plot | 2 | Risk Ratio (M‐H, Fixed, 95% CI) | Subtotals only | |
| 19.1 Bottom‐up approach | 2 | 333 | Risk Ratio (M‐H, Fixed, 95% CI) | 2.34 [0.79, 6.92] |
| 20 Need for any other additional or new surgical procedure to treat complications Show forest plot | 2 | Risk Ratio (M‐H, Fixed, 95% CI) | Subtotals only | |
| 20.1 Bottom‐up approach | 2 | 333 | Risk Ratio (M‐H, Fixed, 95% CI) | 1.18 [0.29, 4.74] |
| Outcome or subgroup title | No. of studies | No. of participants | Statistical method | Effect size |
| 1 Number of women with urinary incontinence Show forest plot | 17 | 1655 | Risk Ratio (M‐H, Fixed, 95% CI) | 1.91 [1.53, 2.39] |
| 1.1 Inside‐out TVTO | 10 | 1053 | Risk Ratio (M‐H, Fixed, 95% CI) | 2.55 [1.94, 3.36] |
| 1.2 Outside‐in TOT | 7 | 602 | Risk Ratio (M‐H, Fixed, 95% CI) | 0.91 [0.60, 1.39] |
| 2 Number of women with no improvement Show forest plot | 5 | 642 | Risk Ratio (M‐H, Fixed, 95% CI) | 2.29 [1.29, 4.06] |
| 2.1 Inside‐out TVT‐O | 4 | 437 | Risk Ratio (M‐H, Fixed, 95% CI) | 4.80 [2.00, 11.55] |
| 2.2 Outside‐in TOT | 1 | 205 | Risk Ratio (M‐H, Fixed, 95% CI) | 0.76 [0.32, 1.82] |
| 3 Objective measurement of incontinence Show forest plot | 12 | 1198 | Risk Ratio (M‐H, Fixed, 95% CI) | 1.88 [1.49, 2.36] |
| 3.1 Inside‐out TVT‐O | 7 | 804 | Risk Ratio (M‐H, Fixed, 95% CI) | 2.91 [2.00, 4.25] |
| 3.2 Outside‐in TOT | 5 | 394 | Risk Ratio (M‐H, Fixed, 95% CI) | 1.18 [0.90, 1.55] |
| 4 Incontinence episodes Show forest plot | 1 | Mean Difference (IV, Fixed, 95% CI) | Totals not selected | |
| 4.1 Outside‐in TOT | 1 | Mean Difference (IV, Fixed, 95% CI) | 0.0 [0.0, 0.0] | |
| 5 Pad test (weights) Show forest plot | 2 | Mean Difference (IV, Fixed, 95% CI) | Subtotals only | |
| 5.1 Outside‐in TOT | 2 | 268 | Mean Difference (IV, Fixed, 95% CI) | ‐1.64 [‐6.24, 2.96] |
| 6 Condition‐specific health measures Show forest plot | 3 | 334 | Std. Mean Difference (IV, Fixed, 95% CI) | 0.16 [‐0.06, 0.38] |
| 6.1 Inside‐out TVTO | 2 | 290 | Std. Mean Difference (IV, Fixed, 95% CI) | 0.07 [‐0.17, 0.30] |
| 6.2 Outside‐in TOT (UDI 6) | 1 | 44 | Std. Mean Difference (IV, Fixed, 95% CI) | 0.91 [0.25, 1.56] |
| 7 Duration of operation (minutes) Show forest plot | 9 | 1176 | Mean Difference (IV, Fixed, 95% CI) | ‐1.17 [‐1.60, ‐0.75] |
| 7.1 Inside‐out TVTO | 6 | 759 | Mean Difference (IV, Fixed, 95% CI) | ‐1.06 [‐1.50, ‐0.61] |
| 7.2 Outside‐in TOT | 3 | 417 | Mean Difference (IV, Fixed, 95% CI) | ‐2.14 [‐3.43, ‐0.84] |
| 8 Operative blood loss (mL) Show forest plot | 2 | Mean Difference (IV, Fixed, 95% CI) | Subtotals only | |
| 8.1 Inside‐out TVTO | 2 | 320 | Mean Difference (IV, Fixed, 95% CI) | 18.79 [3.70, 33.88] |
| 9 Length of in‐patient stay Show forest plot | 1 | Mean Difference (IV, Fixed, 95% CI) | Subtotals only | |
| 9.1 Inside‐out TVTO | 1 | 188 | Mean Difference (IV, Fixed, 95% CI) | ‐0.08 [‐0.33, 0.17] |
| 10 Major vascular or visceral injury Show forest plot | 3 | Risk Ratio (M‐H, Fixed, 95% CI) | Subtotals only | |
| 10.1 Inside‐out TVT‐O | 3 | 460 | Risk Ratio (M‐H, Fixed, 95% CI) | 1.40 [0.28, 6.89] |
| 11 Bladder or urethral perforation Show forest plot | 9 | 961 | Risk Ratio (M‐H, Fixed, 95% CI) | 1.27 [0.32, 5.02] |
| 11.1 Inside‐out TVT‐O | 5 | 666 | Risk Ratio (M‐H, Fixed, 95% CI) | 2.45 [0.40, 15.09] |
| 11.2 Outside‐in TOT | 4 | 295 | Risk Ratio (M‐H, Fixed, 95% CI) | 0.21 [0.01, 4.99] |
| 12 Vaginal wall perforation Show forest plot | 6 | 788 | Risk Ratio (M‐H, Fixed, 95% CI) | 1.67 [0.41, 6.81] |
| 12.1 Inside‐out TVT‐O | 5 | 715 | Risk Ratio (M‐H, Fixed, 95% CI) | 1.67 [0.41, 6.81] |
| 12.2 Outside‐in TOT | 1 | 73 | Risk Ratio (M‐H, Fixed, 95% CI) | 0.0 [0.0, 0.0] |
| 13 Urinary retention and need for catheterisation Show forest plot | 15 | 1477 | Risk Ratio (M‐H, Random, 95% CI) | 0.57 [0.28, 1.15] |
| 13.1 Inside‐out TVTO | 10 | 996 | Risk Ratio (M‐H, Random, 95% CI) | 0.72 [0.34, 1.52] |
| 13.2 Outside‐in TOT | 5 | 481 | Risk Ratio (M‐H, Random, 95% CI) | 0.51 [0.08, 3.44] |
| 14 Infection related to use of synthetic mesh Show forest plot | 2 | 412 | Risk Ratio (M‐H, Fixed, 95% CI) | 0.49 [0.09, 2.69] |
| 14.1 Inside‐out TVT‐O | 1 | 188 | Risk Ratio (M‐H, Fixed, 95% CI) | 2.88 [0.12, 69.72] |
| 14.2 Outside‐in TOT | 1 | 224 | Risk Ratio (M‐H, Fixed, 95% CI) | 0.14 [0.01, 2.73] |
| 15 Vaginal mesh exposure Show forest plot | 9 | 819 | Risk Ratio (M‐H, Fixed, 95% CI) | 2.59 [1.21, 5.56] |
| 15.1 Inside‐out TVT‐O | 5 | 562 | Risk Ratio (M‐H, Fixed, 95% CI) | 3.75 [1.42, 9.86] |
| 15.2 Outside‐in TOT | 4 | 257 | Risk Ratio (M‐H, Fixed, 95% CI) | 1.07 [0.27, 4.28] |
| 16 Mesh extrusion into the bladder or urethra Show forest plot | 2 | 146 | Risk Ratio (M‐H, Fixed, 95% CI) | 17.79 [1.06, 298.88] |
| 16.1 Inside‐out TVT‐O | 1 | 86 | Risk Ratio (M‐H, Fixed, 95% CI) | 17.79 [1.06, 298.88] |
| 16.2 Outside‐in TOT | 1 | 60 | Risk Ratio (M‐H, Fixed, 95% CI) | 0.0 [0.0, 0.0] |
| 17 Postoperative pain or discomfort Show forest plot | 9 | 1102 | Risk Ratio (M‐H, Fixed, 95% CI) | 0.26 [0.19, 0.37] |
| 17.1 Inside‐out TVTO | 8 | 806 | Risk Ratio (M‐H, Fixed, 95% CI) | 0.29 [0.20, 0.43] |
| 17.2 Outside‐in TOT | 2 | 296 | Risk Ratio (M‐H, Fixed, 95% CI) | 0.19 [0.09, 0.40] |
| 18 Long‐term pain or discomfort Show forest plot | 5 | 351 | Risk Ratio (M‐H, Fixed, 95% CI) | 0.14 [0.04, 0.54] |
| 18.1 Inside‐out TVT‐O | 3 | 235 | Risk Ratio (M‐H, Fixed, 95% CI) | 0.17 [0.03, 1.07] |
| 18.2 Outside‐in TOT | 2 | 116 | Risk Ratio (M‐H, Fixed, 95% CI) | 0.12 [0.02, 0.82] |
| 19 De novo urgency Show forest plot | 10 | 927 | Risk Ratio (M‐H, Fixed, 95% CI) | 1.41 [0.98, 2.03] |
| 19.1 Inside‐out TVT‐O | 8 | 835 | Risk Ratio (M‐H, Fixed, 95% CI) | 1.31 [0.90, 1.90] |
| 19.2 Outside‐in TOT | 2 | 92 | Risk Ratio (M‐H, Fixed, 95% CI) | 5.15 [0.68, 39.23] |
| 20 Repeat stress incontinence surgery Show forest plot | 6 | 764 | Risk Ratio (M‐H, Fixed, 95% CI) | 3.09 [1.48, 6.49] |
| 20.1 Inside‐out TVT‐O | 3 | 420 | Risk Ratio (M‐H, Fixed, 95% CI) | 5.86 [2.00, 17.21] |
| 20.2 Outside‐in TOT | 3 | 344 | Risk Ratio (M‐H, Fixed, 95% CI) | 1.0 [0.31, 3.18] |
| 21 Need for any other additional or new surgical procedure to treat complications Show forest plot | 8 | 989 | Risk Ratio (M‐H, Fixed, 95% CI) | 2.03 [1.09, 3.78] |
| 21.1 Inside‐out TVT‐O | 5 | 645 | Risk Ratio (M‐H, Fixed, 95% CI) | 2.15 [1.04, 4.43] |
| 21.2 Outside‐in TOT | 3 | 344 | Risk Ratio (M‐H, Fixed, 95% CI) | 1.75 [0.52, 5.85] |
| Outcome or subgroup title | No. of studies | No. of participants | Statistical method | Effect size |
| 1 Number of women with urinary incontinence Show forest plot | 6 | Risk Ratio (M‐H, Fixed, 95% CI) | Subtotals only | |
| 1.1 TVT‐SECUR versus MiniArc | 2 | 170 | Risk Ratio (M‐H, Fixed, 95% CI) | 1.11 [0.95, 1.29] |
| 1.2 U‐type versus H‐type TVT‐Secur | 3 | 496 | Risk Ratio (M‐H, Fixed, 95% CI) | 1.04 [0.78, 1.40] |
| 1.3 MiniArc versus Ajust | 1 | 63 | Risk Ratio (M‐H, Fixed, 95% CI) | 2.91 [0.63, 13.32] |
| 2 Number of women with no improvement Show forest plot | 4 | Risk Ratio (M‐H, Fixed, 95% CI) | Subtotals only | |
| 2.1 TVT‐Secur versus MiniArc | 2 | 170 | Risk Ratio (M‐H, Fixed, 95% CI) | 3.25 [0.84, 12.66] |
| 2.2 U‐type versus H‐type TVT‐Secur | 1 | 129 | Risk Ratio (M‐H, Fixed, 95% CI) | 0.74 [0.33, 1.63] |
| 2.3 MiniArc versus Ajust | 1 | 61 | Risk Ratio (M‐H, Fixed, 95% CI) | 2.21 [0.21, 23.08] |
| 3 Objectve measurement of incontinence Show forest plot | 4 | Risk Ratio (M‐H, Fixed, 95% CI) | Subtotals only | |
| 3.1 MiniArc versus Ajust | 1 | 63 | Risk Ratio (M‐H, Fixed, 95% CI) | 2.91 [0.63, 13.32] |
| 3.2 U‐type versus H‐type TVT‐Secur | 3 | 496 | Risk Ratio (M‐H, Fixed, 95% CI) | 0.77 [0.56, 1.07] |
| 4 Condition‐specific health measures Show forest plot | 3 | Mean Difference (IV, Fixed, 95% CI) | Subtotals only | |
| 4.1 MiniArc versus AJUST | 1 | 60 | Mean Difference (IV, Fixed, 95% CI) | ‐0.13 [‐1.58, 1.32] |
| 4.2 U‐type versus H‐type TVT‐Secur | 2 | 414 | Mean Difference (IV, Fixed, 95% CI) | ‐0.30 [‐2.15, 1.55] |
| 5 Duration of operation (minutes) Show forest plot | 2 | Mean Difference (IV, Fixed, 95% CI) | Subtotals only | |
| 5.1 TVT‐Secur versus MiniArc | 2 | 190 | Mean Difference (IV, Fixed, 95% CI) | 1.70 [‐4.11, 7.51] |
| 5.2 Ajust versus MiniArc | 1 | 80 | Mean Difference (IV, Fixed, 95% CI) | 1.20 [‐4.67, 7.07] |
| 6 Operative blood loss Show forest plot | 3 | Mean Difference (IV, Fixed, 95% CI) | Subtotals only | |
| 6.1 U‐type versus H‐type TVT‐Secur | 2 | 459 | Mean Difference (IV, Fixed, 95% CI) | 0.0 [0.0, 0.0] |
| 6.2 Ajust versus MiniArc | 1 | 80 | Mean Difference (IV, Fixed, 95% CI) | ‐1.20 [‐10.04, 7.64] |
| 6.3 TVT‐Secur versus MiniArc | 1 | 80 | Mean Difference (IV, Fixed, 95% CI) | 4.30 [‐5.53, 14.13] |
| 7 Major vascular or visceral injury Show forest plot | 2 | Risk Ratio (M‐H, Fixed, 95% CI) | Subtotals only | |
| 7.1 U‐type versus H‐type TVT‐Secur | 2 | 459 | Risk Ratio (M‐H, Fixed, 95% CI) | 0.25 [0.03, 2.19] |
| 8 Bladder or urethral perforation Show forest plot | 3 | Risk Ratio (M‐H, Fixed, 95% CI) | Subtotals only | |
| 8.1 U‐type versus H‐type TVT‐Secur | 2 | 459 | Risk Ratio (M‐H, Fixed, 95% CI) | 0.33 [0.01, 7.91] |
| 8.2 TVT‐Secur versus MiniArc | 1 | 110 | Risk Ratio (M‐H, Fixed, 95% CI) | 4.18 [0.21, 85.11] |
| 9 Vaginal wall perforation Show forest plot | 2 | Risk Ratio (M‐H, Fixed, 95% CI) | Totals not selected | |
| 9.1 TVT‐S versus MiniArc | 1 | Risk Ratio (M‐H, Fixed, 95% CI) | 0.0 [0.0, 0.0] | |
| 9.2 U‐type versus H‐type TVT‐Secur | 1 | Risk Ratio (M‐H, Fixed, 95% CI) | 0.0 [0.0, 0.0] | |
| 10 Urinary retention and need for catheterisation Show forest plot | 4 | Risk Ratio (M‐H, Fixed, 95% CI) | Subtotals only | |
| 10.1 TVT‐Secur versus MiniArc | 3 | 250 | Risk Ratio (M‐H, Fixed, 95% CI) | 2.05 [0.47, 8.95] |
| 10.2 U‐type versus H‐type TVT‐Secur | 1 | 330 | Risk Ratio (M‐H, Fixed, 95% CI) | 0.67 [0.11, 3.94] |
| 10.3 Ajust versus MiniArc | 1 | 80 | Risk Ratio (M‐H, Fixed, 95% CI) | 5.0 [0.25, 100.97] |
| 11 Vaginal mesh exposure Show forest plot | 2 | Risk Ratio (M‐H, Fixed, 95% CI) | Subtotals only | |
| 11.1 U‐type versus H‐type TVT‐Secur | 2 | 414 | Risk Ratio (M‐H, Fixed, 95% CI) | 0.79 [0.22, 2.80] |
| 12 Postoperative pain or discomfort Show forest plot | 1 | Mean Difference (IV, Fixed, 95% CI) | Totals not selected | |
| 12.1 Ajust versus MiniArc | 1 | Mean Difference (IV, Fixed, 95% CI) | 0.0 [0.0, 0.0] | |
| 12.2 TVT‐Secur versus MiniArc | 1 | Mean Difference (IV, Fixed, 95% CI) | 0.0 [0.0, 0.0] | |
| 13 De novo urgency Show forest plot | 5 | Risk Ratio (M‐H, Fixed, 95% CI) | Subtotals only | |
| 13.1 TVT‐Secur versus MiniArc | 3 | 250 | Risk Ratio (M‐H, Fixed, 95% CI) | 0.69 [0.24, 2.02] |
| 13.2 U‐type versus H‐type TVT‐Secur | 2 | 367 | Risk Ratio (M‐H, Fixed, 95% CI) | 1.09 [0.53, 2.25] |
| 13.3 Ajust versus MiniArc | 1 | 80 | Risk Ratio (M‐H, Fixed, 95% CI) | 1.5 [0.26, 8.50] |
| 14 Repeat stress incontinence surgery Show forest plot | 2 | Risk Ratio (M‐H, Fixed, 95% CI) | Subtotals only | |
| 14.1 U‐type versus H‐type TVT‐Secur | 2 | 414 | Risk Ratio (M‐H, Fixed, 95% CI) | 1.16 [0.54, 2.51] |
| 15 Need for any other additional or new surgical procedure to treat complications Show forest plot | 3 | Risk Ratio (M‐H, Fixed, 95% CI) | Subtotals only | |
| 15.1 U‐type versus H‐type TVT‐Secur | 2 | 414 | Risk Ratio (M‐H, Fixed, 95% CI) | 0.27 [0.04, 1.61] |
| 15.2 TVT‐Secur vs Mini‐Arc | 1 | 110 | Risk Ratio (M‐H, Fixed, 95% CI) | 1.67 [0.16, 17.85] |