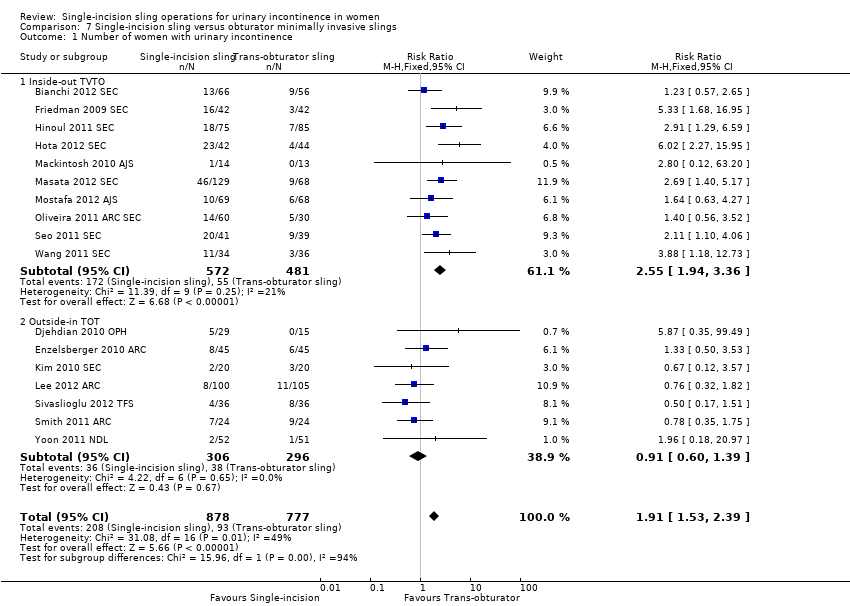
| 1 Number of women with urinary incontinence Show forest plot | 17 | 1655 | Risk Ratio (M‐H, Fixed, 95% CI) | 1.91 [1.53, 2.39] |
|
| 1.1 Inside‐out TVTO | 10 | 1053 | Risk Ratio (M‐H, Fixed, 95% CI) | 2.55 [1.94, 3.36] |
| 1.2 Outside‐in TOT | 7 | 602 | Risk Ratio (M‐H, Fixed, 95% CI) | 0.91 [0.60, 1.39] |
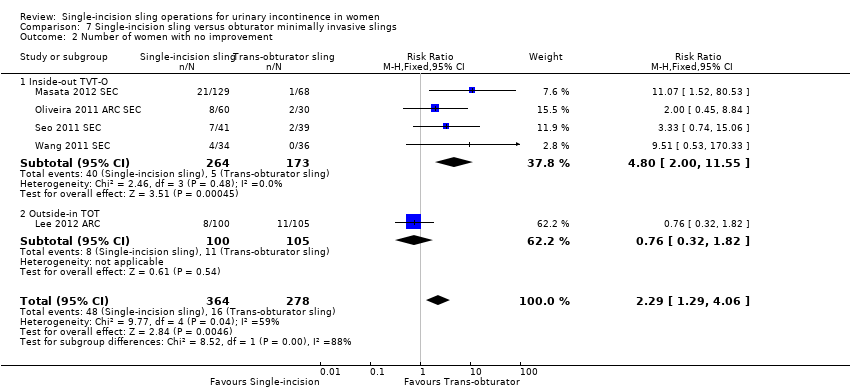
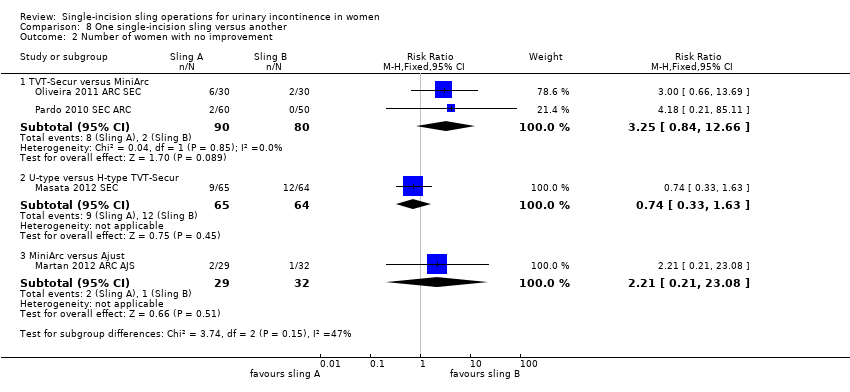
| 2 Number of women with no improvement Show forest plot | 5 | 642 | Risk Ratio (M‐H, Fixed, 95% CI) | 2.29 [1.29, 4.06] |
|
| 2.1 Inside‐out TVT‐O | 4 | 437 | Risk Ratio (M‐H, Fixed, 95% CI) | 4.80 [2.00, 11.55] |
| 2.2 Outside‐in TOT | 1 | 205 | Risk Ratio (M‐H, Fixed, 95% CI) | 0.76 [0.32, 1.82] |
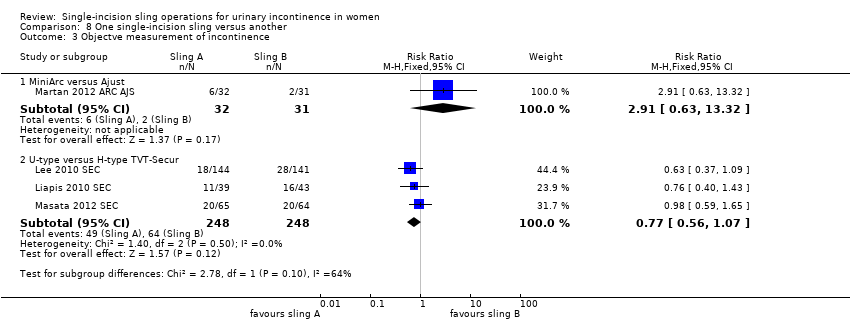
| 3 Objective measurement of incontinence Show forest plot | 12 | 1198 | Risk Ratio (M‐H, Fixed, 95% CI) | 1.88 [1.49, 2.36] |
|
| 3.1 Inside‐out TVT‐O | 7 | 804 | Risk Ratio (M‐H, Fixed, 95% CI) | 2.91 [2.00, 4.25] |
| 3.2 Outside‐in TOT | 5 | 394 | Risk Ratio (M‐H, Fixed, 95% CI) | 1.18 [0.90, 1.55] |
| 4 Incontinence episodes Show forest plot | 1 | | Mean Difference (IV, Fixed, 95% CI) | Totals not selected |
|
| 4.1 Outside‐in TOT | 1 | | Mean Difference (IV, Fixed, 95% CI) | 0.0 [0.0, 0.0] |
| 5 Pad test (weights) Show forest plot | 2 | | Mean Difference (IV, Fixed, 95% CI) | Subtotals only |
|
| 5.1 Outside‐in TOT | 2 | 268 | Mean Difference (IV, Fixed, 95% CI) | ‐1.64 [‐6.24, 2.96] |
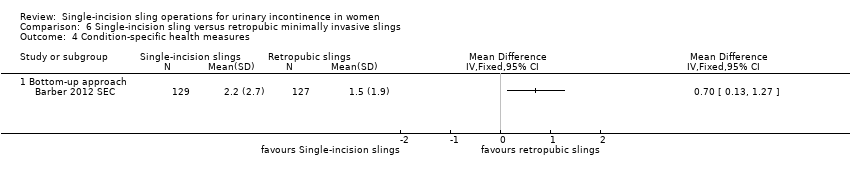
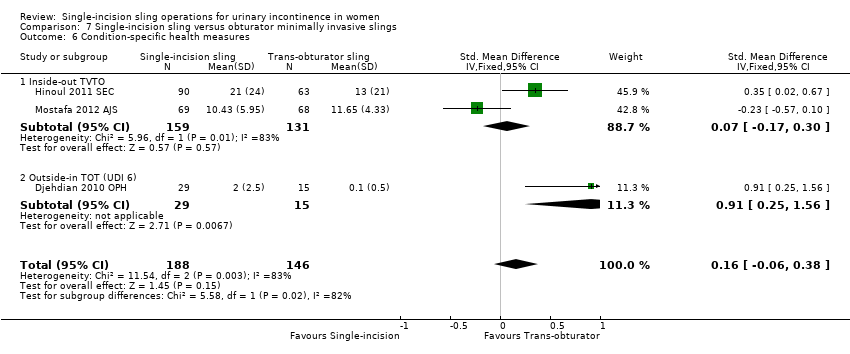
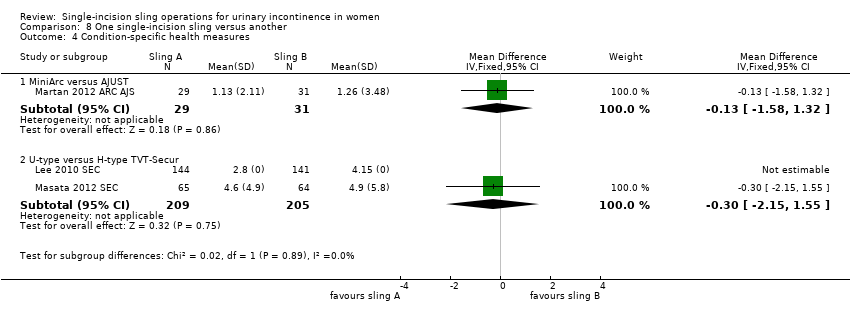
| 6 Condition‐specific health measures Show forest plot | 3 | 334 | Std. Mean Difference (IV, Fixed, 95% CI) | 0.16 [‐0.06, 0.38] |
|
| 6.1 Inside‐out TVTO | 2 | 290 | Std. Mean Difference (IV, Fixed, 95% CI) | 0.07 [‐0.17, 0.30] |
| 6.2 Outside‐in TOT (UDI 6) | 1 | 44 | Std. Mean Difference (IV, Fixed, 95% CI) | 0.91 [0.25, 1.56] |
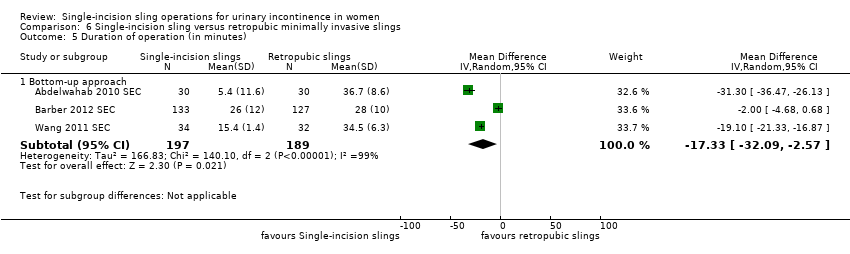
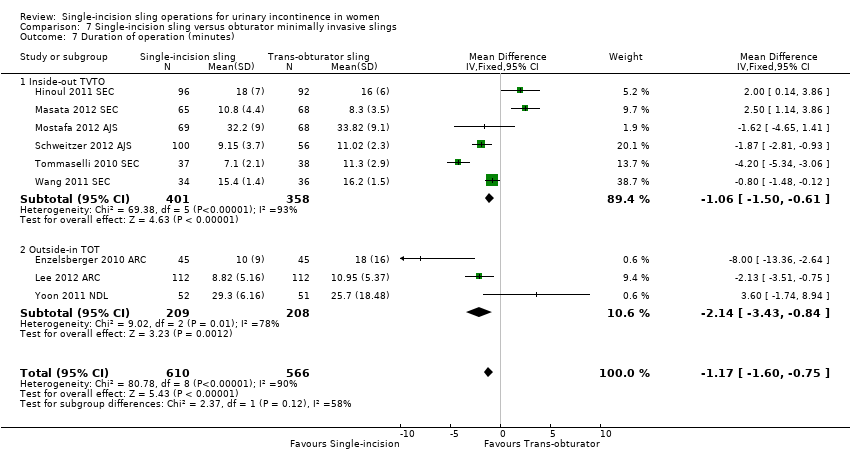
| 7 Duration of operation (minutes) Show forest plot | 9 | 1176 | Mean Difference (IV, Fixed, 95% CI) | ‐1.17 [‐1.60, ‐0.75] |
|
| 7.1 Inside‐out TVTO | 6 | 759 | Mean Difference (IV, Fixed, 95% CI) | ‐1.06 [‐1.50, ‐0.61] |
| 7.2 Outside‐in TOT | 3 | 417 | Mean Difference (IV, Fixed, 95% CI) | ‐2.14 [‐3.43, ‐0.84] |
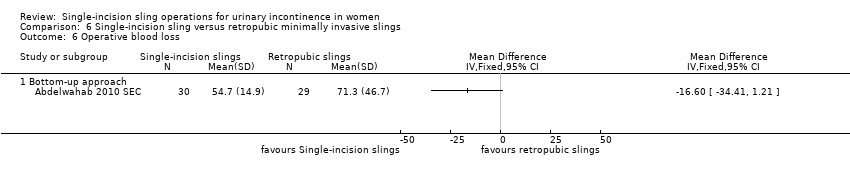
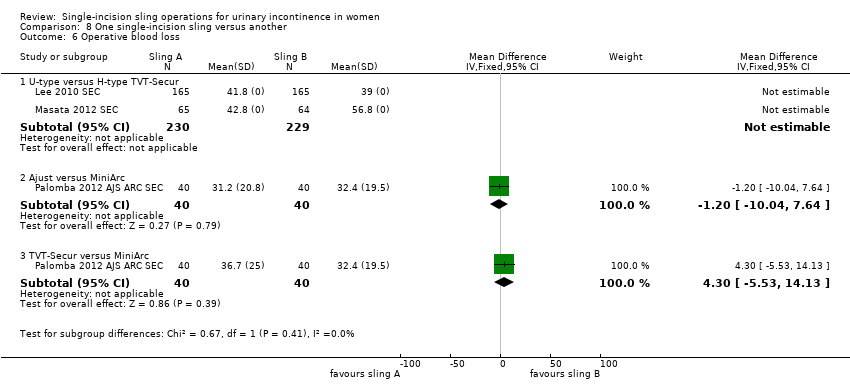
| 8 Operative blood loss (mL) Show forest plot | 2 | | Mean Difference (IV, Fixed, 95% CI) | Subtotals only |
|
| 8.1 Inside‐out TVTO | 2 | 320 | Mean Difference (IV, Fixed, 95% CI) | 18.79 [3.70, 33.88] |
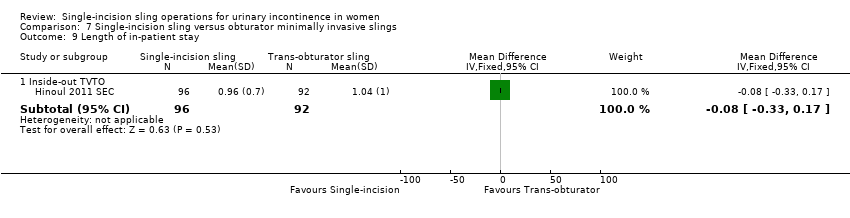
| 9 Length of in‐patient stay Show forest plot | 1 | | Mean Difference (IV, Fixed, 95% CI) | Subtotals only |
|
| 9.1 Inside‐out TVTO | 1 | 188 | Mean Difference (IV, Fixed, 95% CI) | ‐0.08 [‐0.33, 0.17] |
| 10 Major vascular or visceral injury Show forest plot | 3 | | Risk Ratio (M‐H, Fixed, 95% CI) | Subtotals only |
|
| 10.1 Inside‐out TVT‐O | 3 | 460 | Risk Ratio (M‐H, Fixed, 95% CI) | 1.40 [0.28, 6.89] |
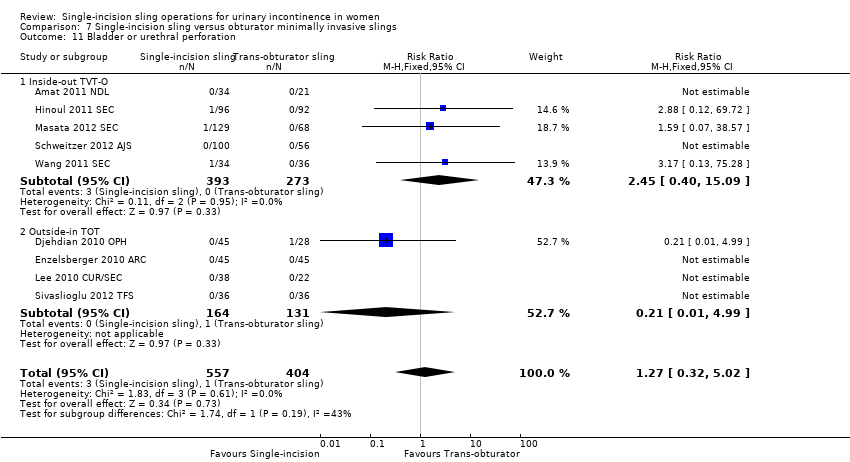
| 11 Bladder or urethral perforation Show forest plot | 9 | 961 | Risk Ratio (M‐H, Fixed, 95% CI) | 1.27 [0.32, 5.02] |
|
| 11.1 Inside‐out TVT‐O | 5 | 666 | Risk Ratio (M‐H, Fixed, 95% CI) | 2.45 [0.40, 15.09] |
| 11.2 Outside‐in TOT | 4 | 295 | Risk Ratio (M‐H, Fixed, 95% CI) | 0.21 [0.01, 4.99] |
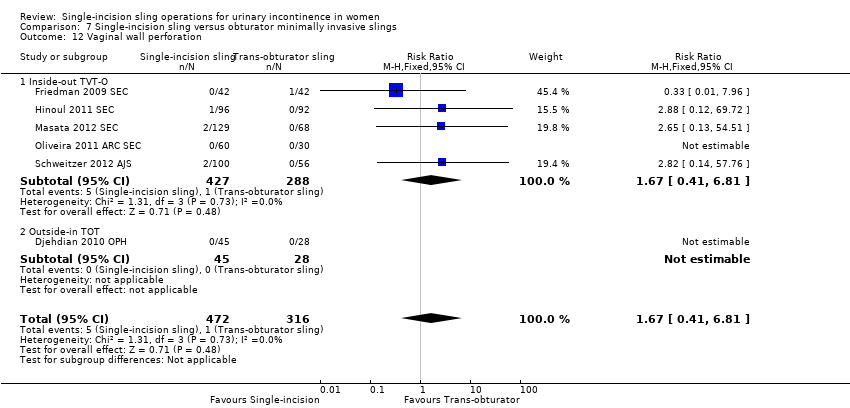
| 12 Vaginal wall perforation Show forest plot | 6 | 788 | Risk Ratio (M‐H, Fixed, 95% CI) | 1.67 [0.41, 6.81] |
|
| 12.1 Inside‐out TVT‐O | 5 | 715 | Risk Ratio (M‐H, Fixed, 95% CI) | 1.67 [0.41, 6.81] |
| 12.2 Outside‐in TOT | 1 | 73 | Risk Ratio (M‐H, Fixed, 95% CI) | 0.0 [0.0, 0.0] |
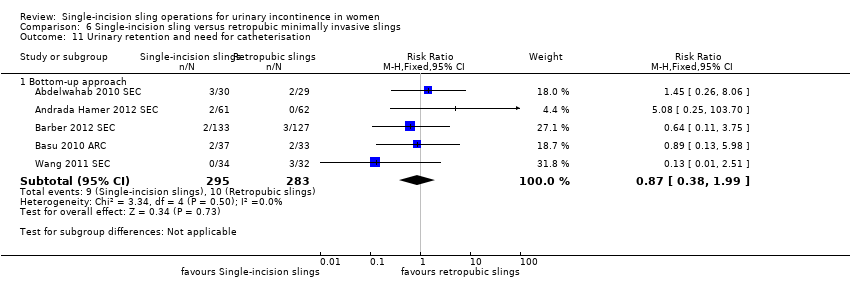
| 13 Urinary retention and need for catheterisation Show forest plot | 15 | 1477 | Risk Ratio (M‐H, Random, 95% CI) | 0.57 [0.28, 1.15] |
|
| 13.1 Inside‐out TVTO | 10 | 996 | Risk Ratio (M‐H, Random, 95% CI) | 0.72 [0.34, 1.52] |
| 13.2 Outside‐in TOT | 5 | 481 | Risk Ratio (M‐H, Random, 95% CI) | 0.51 [0.08, 3.44] |
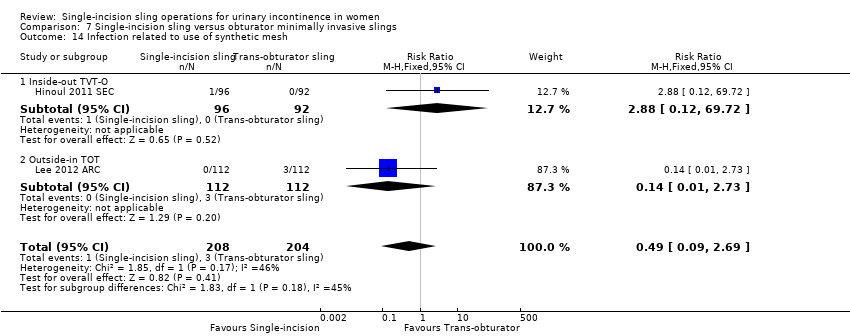
| 14 Infection related to use of synthetic mesh Show forest plot | 2 | 412 | Risk Ratio (M‐H, Fixed, 95% CI) | 0.49 [0.09, 2.69] |
|
| 14.1 Inside‐out TVT‐O | 1 | 188 | Risk Ratio (M‐H, Fixed, 95% CI) | 2.88 [0.12, 69.72] |
| 14.2 Outside‐in TOT | 1 | 224 | Risk Ratio (M‐H, Fixed, 95% CI) | 0.14 [0.01, 2.73] |
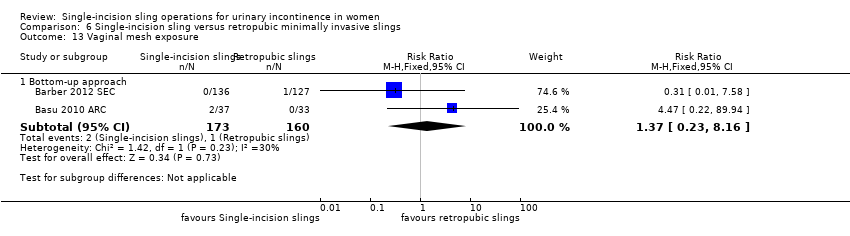
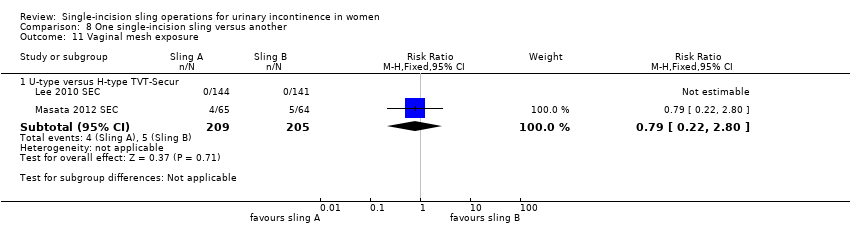
| 15 Vaginal mesh exposure Show forest plot | 9 | 819 | Risk Ratio (M‐H, Fixed, 95% CI) | 2.59 [1.21, 5.56] |
|
| 15.1 Inside‐out TVT‐O | 5 | 562 | Risk Ratio (M‐H, Fixed, 95% CI) | 3.75 [1.42, 9.86] |
| 15.2 Outside‐in TOT | 4 | 257 | Risk Ratio (M‐H, Fixed, 95% CI) | 1.07 [0.27, 4.28] |
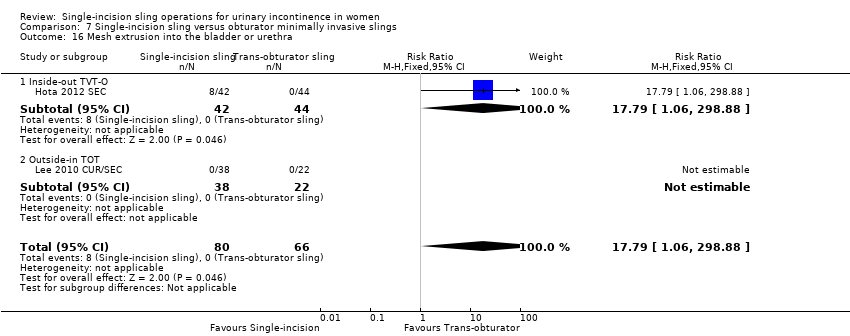
| 16 Mesh extrusion into the bladder or urethra Show forest plot | 2 | 146 | Risk Ratio (M‐H, Fixed, 95% CI) | 17.79 [1.06, 298.88] |
|
| 16.1 Inside‐out TVT‐O | 1 | 86 | Risk Ratio (M‐H, Fixed, 95% CI) | 17.79 [1.06, 298.88] |
| 16.2 Outside‐in TOT | 1 | 60 | Risk Ratio (M‐H, Fixed, 95% CI) | 0.0 [0.0, 0.0] |
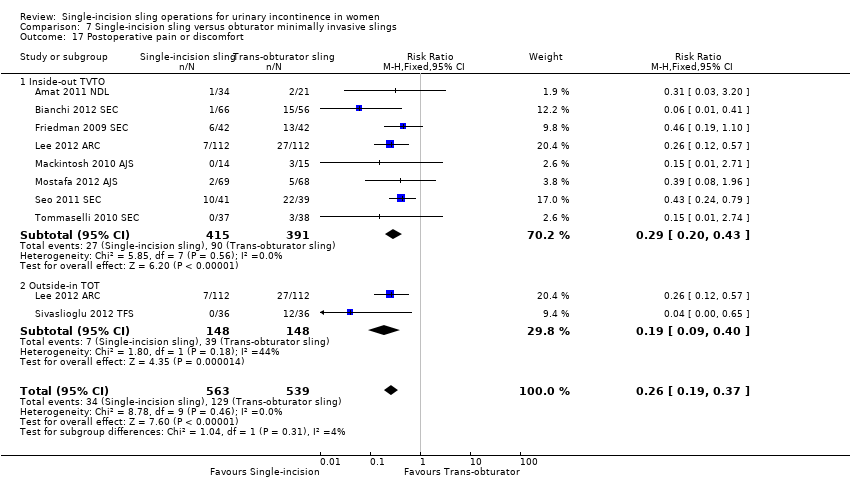
| 17 Postoperative pain or discomfort Show forest plot | 9 | 1102 | Risk Ratio (M‐H, Fixed, 95% CI) | 0.26 [0.19, 0.37] |
|
| 17.1 Inside‐out TVTO | 8 | 806 | Risk Ratio (M‐H, Fixed, 95% CI) | 0.29 [0.20, 0.43] |
| 17.2 Outside‐in TOT | 2 | 296 | Risk Ratio (M‐H, Fixed, 95% CI) | 0.19 [0.09, 0.40] |
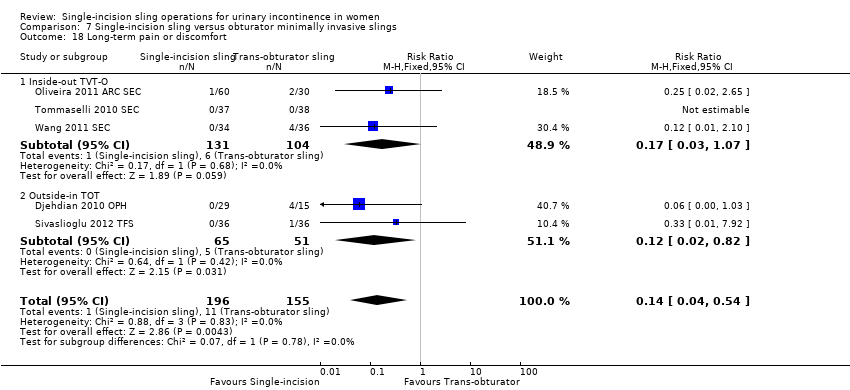
| 18 Long‐term pain or discomfort Show forest plot | 5 | 351 | Risk Ratio (M‐H, Fixed, 95% CI) | 0.14 [0.04, 0.54] |
|
| 18.1 Inside‐out TVT‐O | 3 | 235 | Risk Ratio (M‐H, Fixed, 95% CI) | 0.17 [0.03, 1.07] |
| 18.2 Outside‐in TOT | 2 | 116 | Risk Ratio (M‐H, Fixed, 95% CI) | 0.12 [0.02, 0.82] |
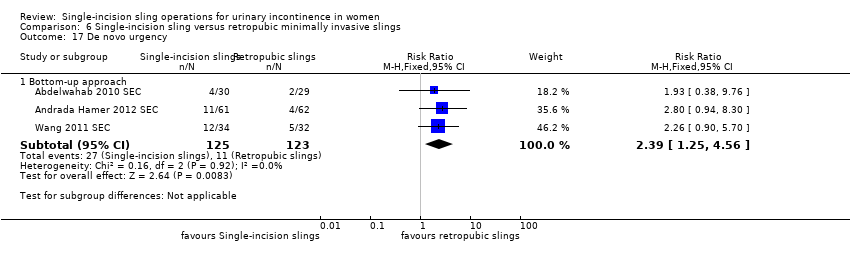
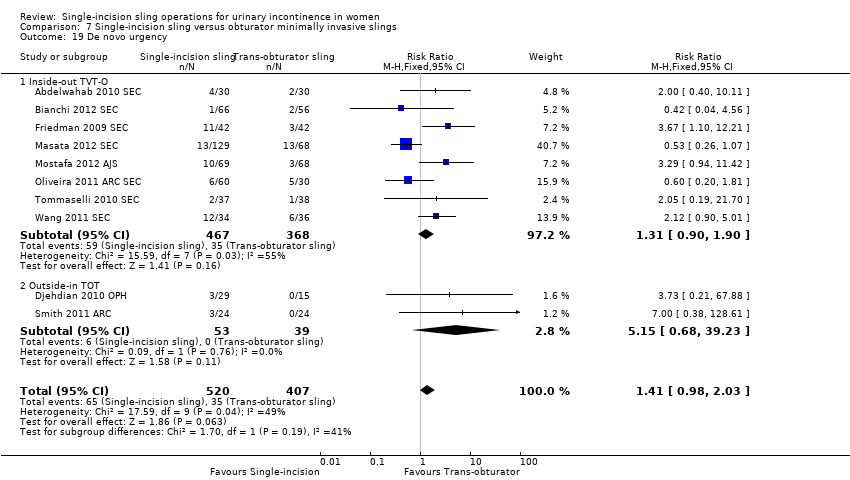
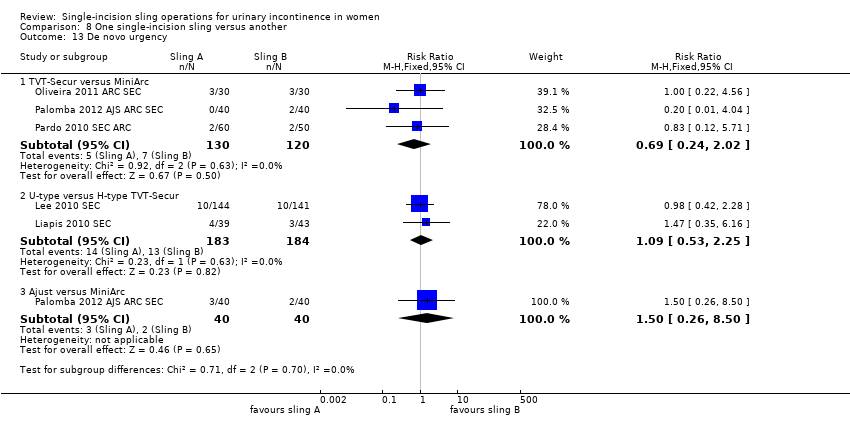
| 19 De novo urgency Show forest plot | 10 | 927 | Risk Ratio (M‐H, Fixed, 95% CI) | 1.41 [0.98, 2.03] |
|
| 19.1 Inside‐out TVT‐O | 8 | 835 | Risk Ratio (M‐H, Fixed, 95% CI) | 1.31 [0.90, 1.90] |
| 19.2 Outside‐in TOT | 2 | 92 | Risk Ratio (M‐H, Fixed, 95% CI) | 5.15 [0.68, 39.23] |
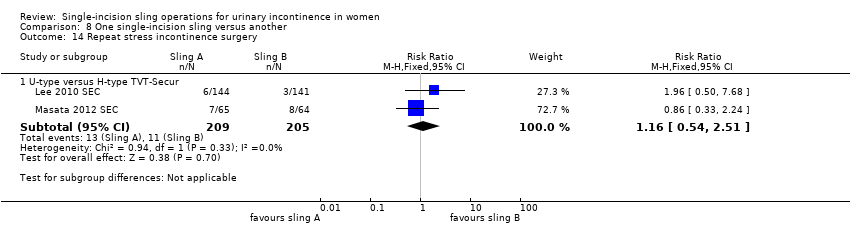
| 20 Repeat stress incontinence surgery Show forest plot | 6 | 764 | Risk Ratio (M‐H, Fixed, 95% CI) | 3.09 [1.48, 6.49] |
|
| 20.1 Inside‐out TVT‐O | 3 | 420 | Risk Ratio (M‐H, Fixed, 95% CI) | 5.86 [2.00, 17.21] |
| 20.2 Outside‐in TOT | 3 | 344 | Risk Ratio (M‐H, Fixed, 95% CI) | 1.0 [0.31, 3.18] |
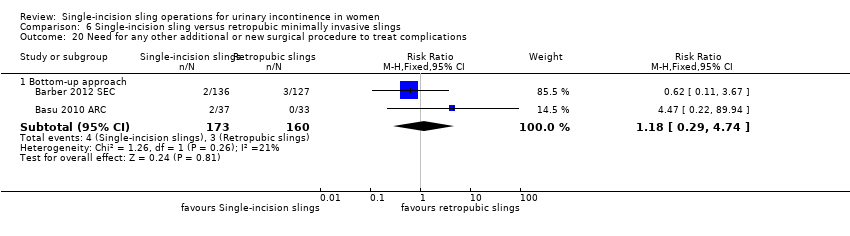
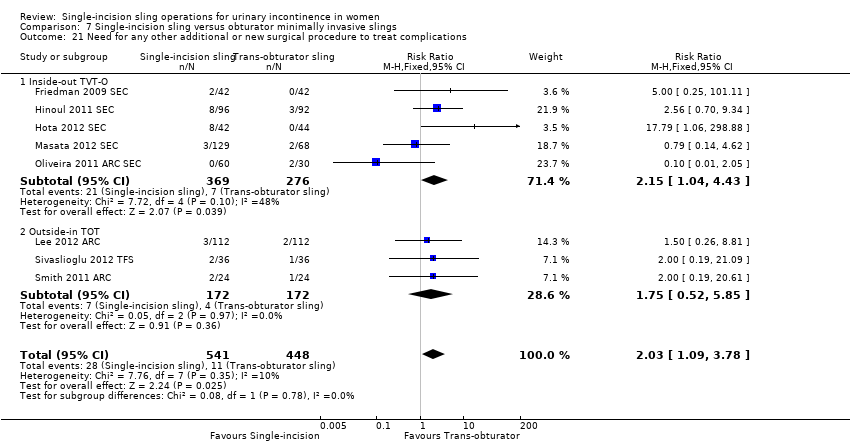
| 21 Need for any other additional or new surgical procedure to treat complications Show forest plot | 8 | 989 | Risk Ratio (M‐H, Fixed, 95% CI) | 2.03 [1.09, 3.78] |
|
| 21.1 Inside‐out TVT‐O | 5 | 645 | Risk Ratio (M‐H, Fixed, 95% CI) | 2.15 [1.04, 4.43] |
| 21.2 Outside‐in TOT | 3 | 344 | Risk Ratio (M‐H, Fixed, 95% CI) | 1.75 [0.52, 5.85] |