Administración de suplementos de vitamina A durante el embarazo para mejorar los resultados maternos y neonatales
Información
- DOI:
- https://doi.org/10.1002/14651858.CD008666.pub3Copiar DOI

- Base de datos:
-
- Cochrane Database of Systematic Reviews
- Versión publicada:
-
- 27 octubre 2015see what's new
- Tipo:
-
- Intervention
- Etapa:
-
- Review
- Grupo Editorial Cochrane:
-
Grupo Cochrane de Embarazo y parto
- Copyright:
-
- Copyright © 2016 The Cochrane Collaboration. Published by John Wiley & Sons, Ltd.
Cifras del artículo
Altmetric:
Citado por:
Autores
Contributions of authors
M McCauley and M Othman carried out the data extraction, which was checked by N van den Broek and L Dou. L Dou performed the statistical analysis and contributed to the text of the review. This review was written by M McCauley, adapted from the original protocol for van den Broek 2010 and reviewed at draft and final manuscript by N van den Broek.
Sources of support
Internal sources
-
Liverpool School of Tropical Medicine, UK.
-
HRP‐UNDP/UNFPA/WHO/World Bank Special Programme in Human Reproduction, Geneva, Switzerland.
-
Department of Obstetrics and Gynaecology, University of Geneva, Switzerland.
External sources
-
UNDP/UNFPA/UNICEF/WHO/World Bank Special Programme of Research, Development and Research Training in Human Reproduction (HRP), Department of Reproductive Health and Research (RHR), World Health Organization, Switzerland.
-
The Evidence and Programme Guidance Unit, Department of Nutrition for Health and Development, World Health Organization, Switzerland.
Declarations of interest
N van den Broek is an investigator in the included trial van den Broek 2006 and did not perform any assessment or data extraction for this trial.
Acknowledgements
Lisa Hurt, on behalf of the ObaapaVitA trial team, for providing additional data about the Kirkwood 2010 trial.
We thank Erika Ota for her help with the 2015 update. Erika Ota's work was financially supported by the UNDP/UNFPA/UNICEF/WHO/World Bank Special Programme of Research, Development and Research Training in Human Reproduction (HRP), Department of Reproductive Health and Research (RHR), World Health Organization. The named authors alone are responsible for the views expressed in this publication.
This project was supported by the National Institute for Health Research, via Cochrane Infrastructure funding to Cochrane Pregnancy and Childbirth. The views and opinions expressed therein are those of the authors and do not necessarily reflect those of the Systematic Reviews Programme, NIHR, NHS or the Department of Health.
Version history
| Published | Title | Stage | Authors | Version |
| 2015 Oct 27 | Vitamin A supplementation during pregnancy for maternal and newborn outcomes | Review | Mary E McCauley, Nynke van den Broek, Lixia Dou, Mohammad Othman | |
| 2010 Nov 10 | Vitamin A supplementation during pregnancy for maternal and newborn outcomes | Review | Nynke van den Broek, Lixia Dou, Mohammad Othman, James P Neilson, Simon Gates, A Metin Gülmezoglu | |
| 2010 Sep 08 | Vitamin A supplementation during pregnancy for maternal and newborn outcomes | Protocol | Nynke van den Broek, Lixia Dou, Mohammad Othman, James P Neilson, A Metin Gülmezoglu | |
Differences between protocol and review
Methods updated to current standard text of Cochrane Pregnancy and Childbirth. 'Summary of findings' tables have been incorporated for the 2015 update.
Keywords
MeSH
Medical Subject Headings (MeSH) Keywords
- Anemia [prevention & control];
- Infant Mortality;
- Maternal Mortality;
- Night Blindness [drug therapy];
- Pregnancy Complications [*drug therapy];
- Pregnancy Complications, Infectious [drug therapy];
- Vitamin A [*administration & dosage];
- Vitamin A Deficiency [*drug therapy];
- Vitamins [*administration & dosage];
Medical Subject Headings Check Words
Female; Humans; Infant; Infant, Newborn; Pregnancy;
PICO

'Risk of bias' graph: review authors' judgements about each risk of bias item presented as percentages across all included studies.

'Risk of bias' summary: review authors' judgements about each risk of bias item for each included study.

Comparison 1 Vitamin A alone versus placebo or no treatment, Outcome 1 Maternal mortality.

Comparison 1 Vitamin A alone versus placebo or no treatment, Outcome 2 Perinatal mortality.
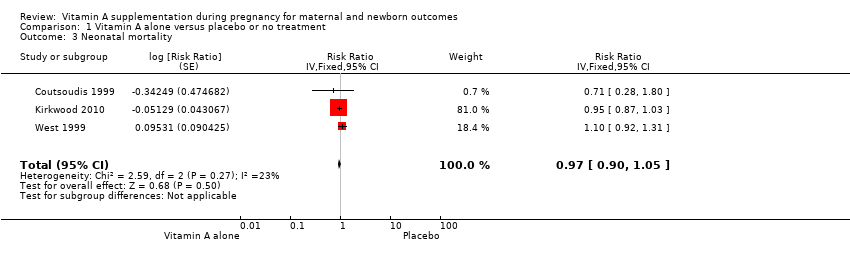
Comparison 1 Vitamin A alone versus placebo or no treatment, Outcome 3 Neonatal mortality.
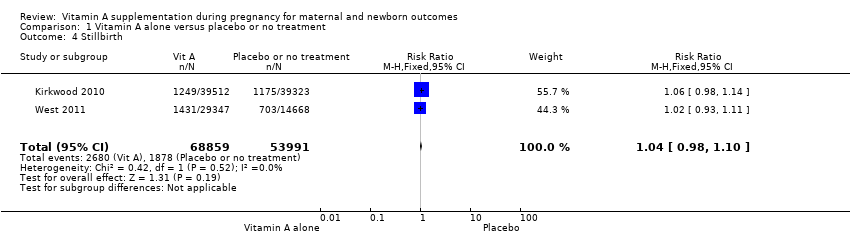
Comparison 1 Vitamin A alone versus placebo or no treatment, Outcome 4 Stillbirth.

Comparison 1 Vitamin A alone versus placebo or no treatment, Outcome 5 Maternal anaemia.
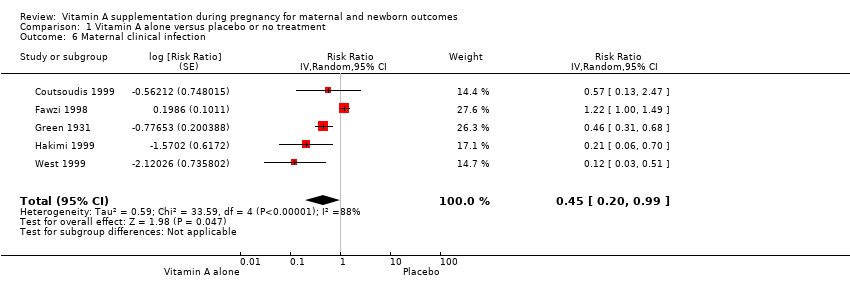
Comparison 1 Vitamin A alone versus placebo or no treatment, Outcome 6 Maternal clinical infection.
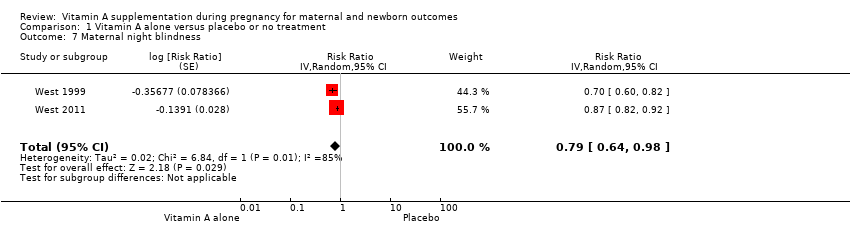
Comparison 1 Vitamin A alone versus placebo or no treatment, Outcome 7 Maternal night blindness.

Comparison 1 Vitamin A alone versus placebo or no treatment, Outcome 8 Preterm birth.

Comparison 1 Vitamin A alone versus placebo or no treatment, Outcome 9 Neonatal anaemia.

Comparison 1 Vitamin A alone versus placebo or no treatment, Outcome 12 Low birthweight.

Comparison 2 Vitamin A alone versus micronutrient supplement without vitamin A, Outcome 6 Maternal clinical infection.

Comparison 3 Vitamin A with other micronutrients versus micronutrient supplements without vitamin A, Outcome 2 Perinatal mortality.

Comparison 3 Vitamin A with other micronutrients versus micronutrient supplements without vitamin A, Outcome 3 Neonatal mortality.

Comparison 3 Vitamin A with other micronutrients versus micronutrient supplements without vitamin A, Outcome 4 Stillbirth.

Comparison 3 Vitamin A with other micronutrients versus micronutrient supplements without vitamin A, Outcome 5 Maternal anaemia.
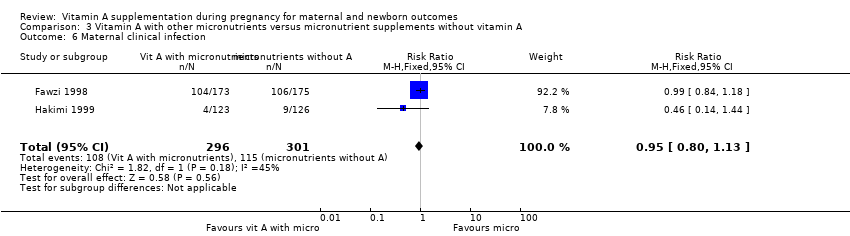
Comparison 3 Vitamin A with other micronutrients versus micronutrient supplements without vitamin A, Outcome 6 Maternal clinical infection.

Comparison 3 Vitamin A with other micronutrients versus micronutrient supplements without vitamin A, Outcome 8 Preterm birth.

Comparison 3 Vitamin A with other micronutrients versus micronutrient supplements without vitamin A, Outcome 9 Neonatal anaemia.
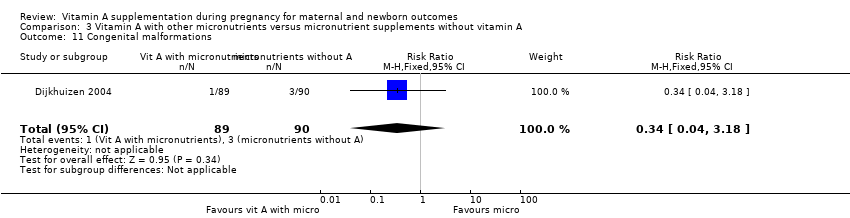
Comparison 3 Vitamin A with other micronutrients versus micronutrient supplements without vitamin A, Outcome 11 Congenital malformations.

Comparison 3 Vitamin A with other micronutrients versus micronutrient supplements without vitamin A, Outcome 12 Low birthweight.
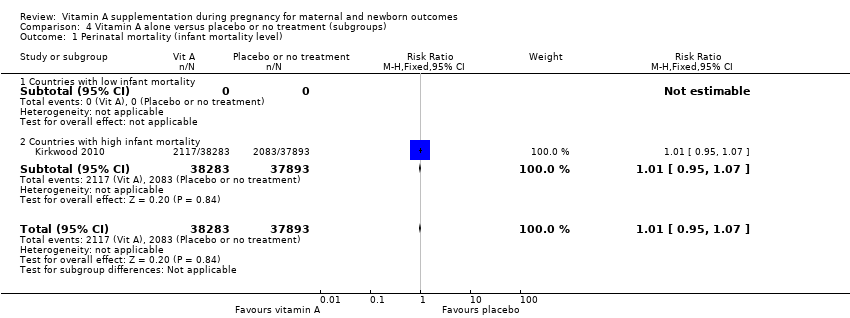
Comparison 4 Vitamin A alone versus placebo or no treatment (subgroups), Outcome 1 Perinatal mortality (infant mortality level).

Comparison 4 Vitamin A alone versus placebo or no treatment (subgroups), Outcome 2 Maternal mortality (infant mortality level).

Comparison 4 Vitamin A alone versus placebo or no treatment (subgroups), Outcome 3 Maternal mortality (maternal mortality level).

Comparison 4 Vitamin A alone versus placebo or no treatment (subgroups), Outcome 4 Perinatal mortality (maternal mortality level).

Comparison 4 Vitamin A alone versus placebo or no treatment (subgroups), Outcome 5 Maternal mortality (prevalence of vitamin A deficiency).

Comparison 4 Vitamin A alone versus placebo or no treatment (subgroups), Outcome 6 Perinatal mortality (prevalence of vitamin A deficiency).

Comparison 4 Vitamin A alone versus placebo or no treatment (subgroups), Outcome 7 Maternal mortality (prevalence of HIV in the general population).

Comparison 4 Vitamin A alone versus placebo or no treatment (subgroups), Outcome 8 Perinatal mortality (prevalence of HIV in the general population).

Comparison 4 Vitamin A alone versus placebo or no treatment (subgroups), Outcome 9 Maternal mortality (dose).
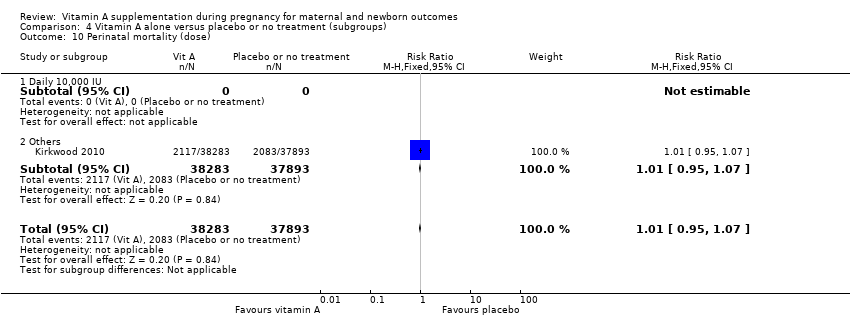
Comparison 4 Vitamin A alone versus placebo or no treatment (subgroups), Outcome 10 Perinatal mortality (dose).

Comparison 4 Vitamin A alone versus placebo or no treatment (subgroups), Outcome 11 Maternal mortality (regimen).
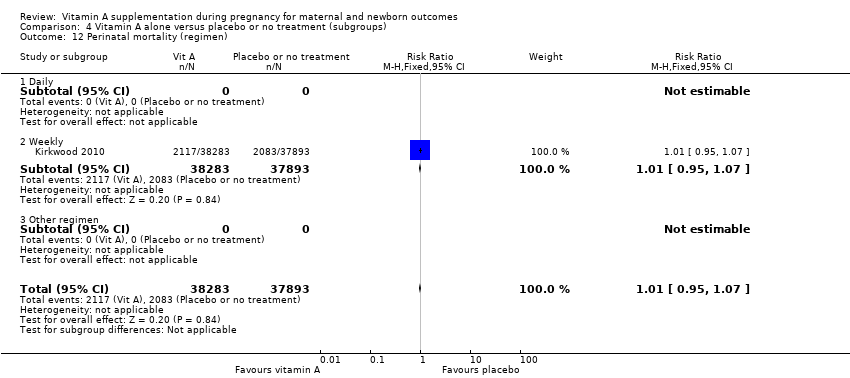
Comparison 4 Vitamin A alone versus placebo or no treatment (subgroups), Outcome 12 Perinatal mortality (regimen).
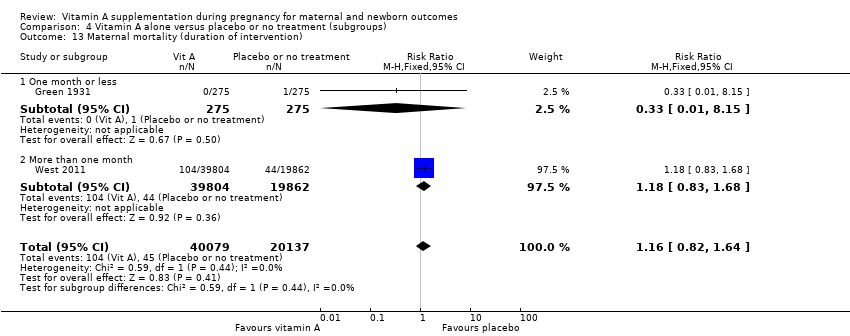
Comparison 4 Vitamin A alone versus placebo or no treatment (subgroups), Outcome 13 Maternal mortality (duration of intervention).

Comparison 4 Vitamin A alone versus placebo or no treatment (subgroups), Outcome 15 Maternal mortality (trimester of pregnancy).

Comparison 4 Vitamin A alone versus placebo or no treatment (subgroups), Outcome 16 Perinatal mortality (trimester of pregnancy).

Comparison 4 Vitamin A alone versus placebo or no treatment (subgroups), Outcome 17 Maternal mortality (randomisation).
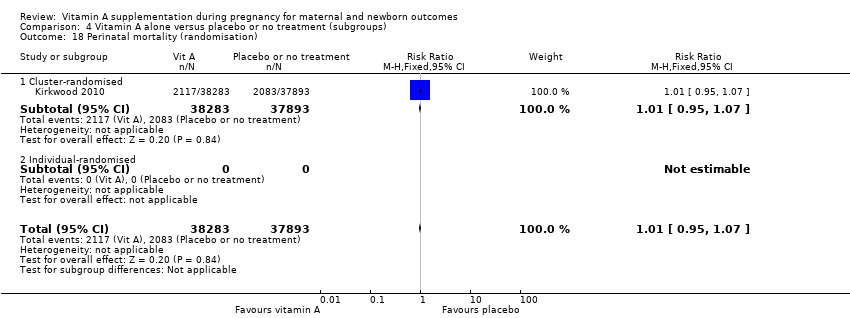
Comparison 4 Vitamin A alone versus placebo or no treatment (subgroups), Outcome 18 Perinatal mortality (randomisation).

Comparison 6 Vitamin A with other micronutrients versus micronutrient supplements without vitamin A (subgroups), Outcome 2 Perinatal mortality (infant mortality level).
Comparison 6 Vitamin A with other micronutrients versus micronutrient supplements without vitamin A (subgroups), Outcome 4 Perinatal mortality (maternal mortality level).

Comparison 6 Vitamin A with other micronutrients versus micronutrient supplements without vitamin A (subgroups), Outcome 5 Maternal mortality (prevalence of vitamin A deficiency).

Comparison 6 Vitamin A with other micronutrients versus micronutrient supplements without vitamin A (subgroups), Outcome 6 Perinatal mortality (prevalence of vitamin A deficiency).

Comparison 6 Vitamin A with other micronutrients versus micronutrient supplements without vitamin A (subgroups), Outcome 8 Perinatal mortality (prevalence of HIV in the general population).
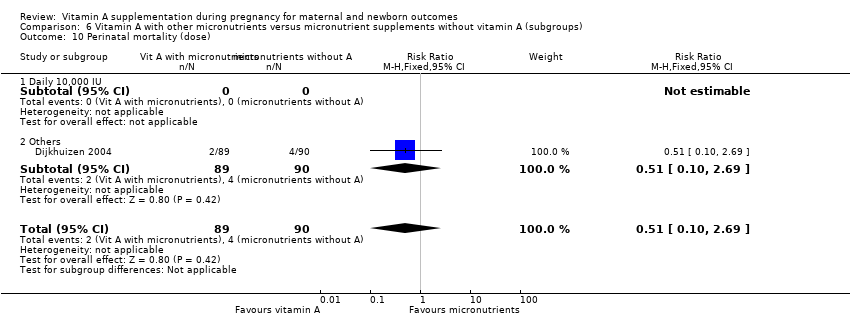
Comparison 6 Vitamin A with other micronutrients versus micronutrient supplements without vitamin A (subgroups), Outcome 10 Perinatal mortality (dose).
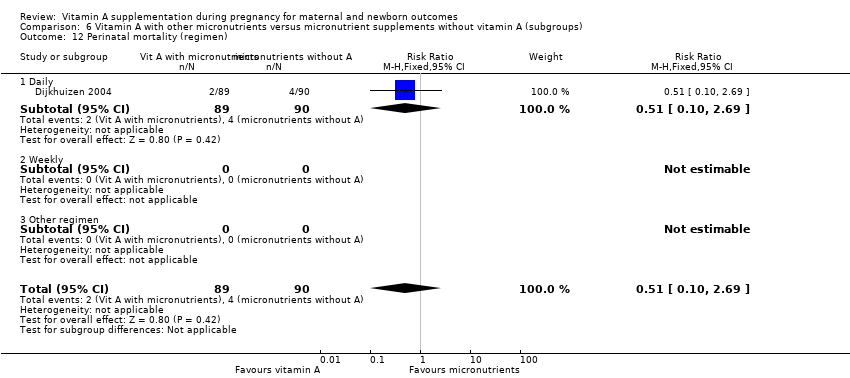
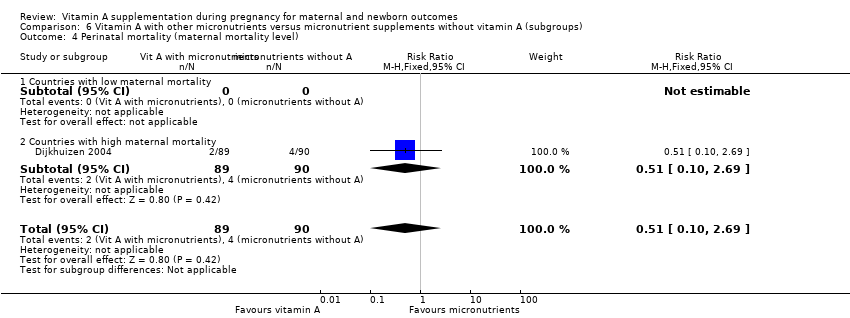
Comparison 6 Vitamin A with other micronutrients versus micronutrient supplements without vitamin A (subgroups), Outcome 12 Perinatal mortality (regimen).
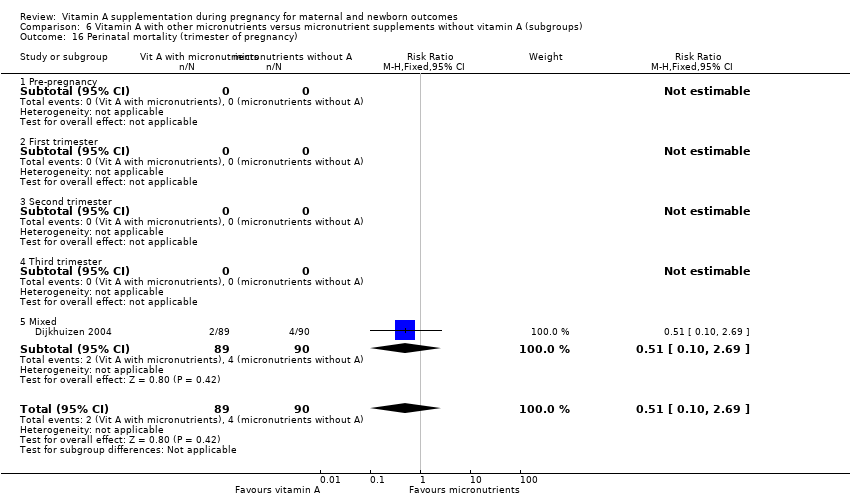
Comparison 6 Vitamin A with other micronutrients versus micronutrient supplements without vitamin A (subgroups), Outcome 16 Perinatal mortality (trimester of pregnancy).

Comparison 6 Vitamin A with other micronutrients versus micronutrient supplements without vitamin A (subgroups), Outcome 18 Perinatal mortality (randomisation).
| Vitamin A alone versus placebo or no treatment | ||||||
| Patient or population: Pregnant women | ||||||
| Outcomes | Anticipated absolute effects* (95% CI) | Relative effect | № of participants | Quality of the evidence | Comments | |
| Risk with placebo or no treatment | Risk with vitamin A alone | |||||
| Maternal mortality | Study population | RR 0.88 | 154,039 | ⊕⊕⊕⊕ | Inverse variance. | |
| 5 per 1000 | 5 per 1000 (4 to 7) | |||||
| Perinatal mortality | Study population | RR 1.01 | 76,176 | ⊕⊕⊕⊕ | Inverse variance. | |
| 54 per 1000 | 54 per 1000 (51 to 57) | |||||
| Maternal anaemia | Study population | RR 0.64 | 15,649 | ⊕⊕⊕⊝ | Inverse variance. | |
| 191 per 1000 | 122 per 1000 (82 to 180) | |||||
| Maternal clinical infection | Study population | RR 0.45 | 17,313 | ⊕⊕⊝⊝ | Inverse variance. | |
| 18 per 1000 | 8 per 1000 (4 to 18) | |||||
| Preterm birth | Study population | RR 0.98 | 48,007 | ⊕⊕⊕⊕ | ||
| 249 per 1000 | 244 per 1000 | |||||
| Moderate | ||||||
| 190 per 1000 | 186 per 1000 | |||||
| *The risk in the intervention group (and its 95% confidence interval) is based on the assumed risk in the comparison group and the relative effect of the intervention (and its 95% CI). | ||||||
| GRADE Working Group grades of evidence | ||||||
| 1 The authors considered that the pooled effect estimate was not biased by the design of the studies or their analysis of data. Following correspondence received from the trialists for Kirkwood 2010, the loss to follow‐up for this study was 8%: the data from this study are not at risk of attrition bias. 2 Statistical Heterogeneity (I² > 60%). 3 Most studies contributing data had design limitations. | ||||||
| Combination vitamin A and micronutrients for maternal and newborn mortality and morbidity | ||||||
| Patient or population: Pregnant women | ||||||
| Outcomes | Anticipated absolute effects* (95% CI) | Relative effect | № of participants | Quality of the evidence | Comments | |
| Risk with micronutrient supplements without vitamin A | Risk with vitamin A with other micronutrients | |||||
| Maternal mortality | Study population | not estimable | (0 studies) | See comment | No study reported results for this outcome. | |
| not pooled | not pooled | |||||
| Perinatal mortality | Study population | RR 0.51 | 179 | ⊕⊕⊝⊝ | ||
| 44 per 1000 | 23 per 1000 | |||||
| Moderate | ||||||
| 44 per 1000 | 23 per 1000 | |||||
| Maternal anaemia | Study population | RR 0.86 | 706 | ⊕⊕⊝⊝ | ||
| 269 per 1000 | 231 per 1000 | |||||
| Moderate | ||||||
| 346 per 1000 | 298 per 1000 | |||||
| Maternal clinical infection | Study population | RR 0.95 | 597 | ⊕⊕⊝⊝ | ||
| 382 per 1000 | 363 per 1000 | |||||
| Moderate | ||||||
| 339 per 1000 | 322 per 1000 | |||||
| Preterm birth | Study population | RR 0.39 | 136 | ⊕⊕⊝⊝ | ||
| 75 per 1000 | 29 per 1000 | |||||
| Moderate | ||||||
| 75 per 1000 | 29 per 1000 | |||||
| *The risk in the intervention group (and its 95% confidence interval) is based on the assumed risk in the comparison group and the relative effect of the intervention (and its 95% CI). | ||||||
| GRADE Working Group grades of evidence | ||||||
| 1 Wide confidence interval crossing the line of no effect, few events & small sample size. 2 Wide confidence interval crossing the line of no effect & small sample size. | ||||||
| Retinol supplementation in mcg | Vitamin A in IU |
| 1 | 3.33 |
| 2 | 6.66 |
| 3 | 9.99 |
| IU: international units | |
| Serum retinol mcg/dL | Serum retinol mc mol/L |
| 10 | 0.35 |
| 20 | 0.7 |
| 30 | 1.05 |
| Outcome or subgroup title | No. of studies | No. of participants | Statistical method | Effect size |
| 1 Maternal mortality Show forest plot | 4 | Risk Ratio (Random, 95% CI) | 0.88 [0.65, 1.20] | |
| 2 Perinatal mortality Show forest plot | 1 | Risk Ratio (Fixed, 95% CI) | 1.01 [0.95, 1.07] | |
| 3 Neonatal mortality Show forest plot | 3 | Risk Ratio (Fixed, 95% CI) | 0.97 [0.90, 1.05] | |
| 4 Stillbirth Show forest plot | 2 | 122850 | Risk Ratio (M‐H, Fixed, 95% CI) | 1.04 [0.98, 1.10] |
| 5 Maternal anaemia Show forest plot | 3 | Risk Ratio (Random, 95% CI) | 0.64 [0.43, 0.94] | |
| 6 Maternal clinical infection Show forest plot | 5 | Risk Ratio (Random, 95% CI) | 0.45 [0.20, 0.99] | |
| 7 Maternal night blindness Show forest plot | 2 | Risk Ratio (Random, 95% CI) | 0.79 [0.64, 0.98] | |
| 8 Preterm birth Show forest plot | 5 | 40137 | Risk Ratio (M‐H, Fixed, 95% CI) | 0.98 [0.94, 1.01] |
| 9 Neonatal anaemia Show forest plot | 1 | 406 | Risk Ratio (M‐H, Fixed, 95% CI) | 0.99 [0.92, 1.08] |
| 10 Neonatal clinical infection | 0 | 0 | Risk Ratio (M‐H, Fixed, 95% CI) | 0.0 [0.0, 0.0] |
| 11 Congenital malformations | 0 | 0 | Risk Ratio (M‐H, Fixed, 95% CI) | 0.0 [0.0, 0.0] |
| 12 Low birthweight Show forest plot | 4 | 14599 | Risk Ratio (M‐H, Random, 95% CI) | 1.02 [0.89, 1.16] |
| Outcome or subgroup title | No. of studies | No. of participants | Statistical method | Effect size |
| 1 Maternal mortality | 0 | 0 | Risk Ratio (M‐H, Fixed, 95% CI) | 0.0 [0.0, 0.0] |
| 2 Perinatal mortality | 0 | 0 | Risk Ratio (M‐H, Fixed, 95% CI) | 0.0 [0.0, 0.0] |
| 3 Neonatal mortality | 0 | 0 | Risk Ratio (M‐H, Fixed, 95% CI) | 0.0 [0.0, 0.0] |
| 4 Stillbirth | 0 | 0 | Risk Ratio (M‐H, Fixed, 95% CI) | 0.0 [0.0, 0.0] |
| 5 Maternal anaemia | 0 | 0 | Risk Ratio (M‐H, Fixed, 95% CI) | 0.0 [0.0, 0.0] |
| 6 Maternal clinical infection Show forest plot | 2 | 591 | Risk Ratio (M‐H, Fixed, 95% CI) | 0.99 [0.83, 1.18] |
| 7 Maternal night blindness | 0 | 0 | Risk Ratio (M‐H, Fixed, 95% CI) | 0.0 [0.0, 0.0] |
| 8 Preterm birth | 0 | 0 | Risk Ratio (M‐H, Fixed, 95% CI) | 0.0 [0.0, 0.0] |
| 9 Neonatal anaemia | 0 | 0 | Risk Ratio (M‐H, Fixed, 95% CI) | 0.0 [0.0, 0.0] |
| 10 Neonatal clinical infection | 0 | 0 | Risk Ratio (M‐H, Fixed, 95% CI) | 0.0 [0.0, 0.0] |
| 11 Congenital malformations | 0 | 0 | Risk Ratio (M‐H, Fixed, 95% CI) | 0.0 [0.0, 0.0] |
| 12 Low birthweight | 0 | 0 | Risk Ratio (M‐H, Fixed, 95% CI) | 0.0 [0.0, 0.0] |
| Outcome or subgroup title | No. of studies | No. of participants | Statistical method | Effect size |
| 1 Maternal mortality | 0 | 0 | Risk Ratio (M‐H, Fixed, 95% CI) | 0.0 [0.0, 0.0] |
| 2 Perinatal mortality Show forest plot | 1 | 179 | Risk Ratio (M‐H, Fixed, 95% CI) | 0.51 [0.10, 2.69] |
| 3 Neonatal mortality Show forest plot | 1 | 594 | Risk Ratio (M‐H, Fixed, 95% CI) | 0.65 [0.32, 1.31] |
| 4 Stillbirth Show forest plot | 2 | 866 | Risk Ratio (M‐H, Fixed, 95% CI) | 1.41 [0.57, 3.47] |
| 5 Maternal anaemia Show forest plot | 3 | 706 | Risk Ratio (M‐H, Fixed, 95% CI) | 0.86 [0.68, 1.09] |
| 6 Maternal clinical infection Show forest plot | 2 | 597 | Risk Ratio (M‐H, Fixed, 95% CI) | 0.95 [0.80, 1.13] |
| 7 Maternal night blindness | 0 | 0 | Risk Ratio (M‐H, Fixed, 95% CI) | 0.0 [0.0, 0.0] |
| 8 Preterm birth Show forest plot | 1 | 136 | Risk Ratio (M‐H, Fixed, 95% CI) | 0.39 [0.08, 1.93] |
| 9 Neonatal anaemia Show forest plot | 2 | 1052 | Risk Ratio (M‐H, Random, 95% CI) | 0.75 [0.38, 1.51] |
| 10 Neonatal clinical infection | 0 | 0 | Risk Ratio (M‐H, Fixed, 95% CI) | 0.0 [0.0, 0.0] |
| 11 Congenital malformations Show forest plot | 1 | 179 | Risk Ratio (M‐H, Fixed, 95% CI) | 0.34 [0.04, 3.18] |
| 12 Low birthweight Show forest plot | 1 | 594 | Risk Ratio (M‐H, Fixed, 95% CI) | 0.67 [0.47, 0.96] |
| Outcome or subgroup title | No. of studies | No. of participants | Statistical method | Effect size |
| 1 Perinatal mortality (infant mortality level) Show forest plot | 1 | 76176 | Risk Ratio (M‐H, Fixed, 95% CI) | 1.01 [0.95, 1.07] |
| 1.1 Countries with low infant mortality | 0 | 0 | Risk Ratio (M‐H, Fixed, 95% CI) | 0.0 [0.0, 0.0] |
| 1.2 Countries with high infant mortality | 1 | 76176 | Risk Ratio (M‐H, Fixed, 95% CI) | 1.01 [0.95, 1.07] |
| 2 Maternal mortality (infant mortality level) Show forest plot | 4 | Risk Ratio (Random, 95% CI) | 0.88 [0.65, 1.20] | |
| 2.1 Countries with low infant mortality | 1 | Risk Ratio (Random, 95% CI) | 0.33 [0.01, 9.44] | |
| 2.2 Countries with high infant mortality | 3 | Risk Ratio (Random, 95% CI) | 0.89 [0.64, 1.23] | |
| 3 Maternal mortality (maternal mortality level) Show forest plot | 4 | 161240 | Risk Ratio (M‐H, Fixed, 95% CI) | 0.91 [0.76, 1.08] |
| 3.1 Countries with low maternal mortality | 1 | 550 | Risk Ratio (M‐H, Fixed, 95% CI) | 0.33 [0.01, 8.15] |
| 3.2 Countries with high maternal mortality | 3 | 160690 | Risk Ratio (M‐H, Fixed, 95% CI) | 0.91 [0.76, 1.08] |
| 4 Perinatal mortality (maternal mortality level) Show forest plot | 1 | 73743 | Risk Ratio (M‐H, Fixed, 95% CI) | 0.95 [0.88, 1.03] |
| 4.1 Countries with low maternal mortality | 0 | 0 | Risk Ratio (M‐H, Fixed, 95% CI) | 0.0 [0.0, 0.0] |
| 4.2 Countries with high maternal mortality | 1 | 73743 | Risk Ratio (M‐H, Fixed, 95% CI) | 0.95 [0.88, 1.03] |
| 5 Maternal mortality (prevalence of vitamin A deficiency) Show forest plot | 4 | 161240 | Risk Ratio (M‐H, Random, 95% CI) | 0.87 [0.64, 1.20] |
| 5.1 Low prevalence of vitamin A deficiency | 1 | 550 | Risk Ratio (M‐H, Random, 95% CI) | 0.33 [0.01, 8.15] |
| 5.2 High prevalence of vitamin A deficiency | 3 | 160690 | Risk Ratio (M‐H, Random, 95% CI) | 0.88 [0.63, 1.23] |
| 6 Perinatal mortality (prevalence of vitamin A deficiency) Show forest plot | 1 | 76176 | Risk Ratio (M‐H, Fixed, 95% CI) | 1.01 [0.95, 1.07] |
| 6.1 Low prevalence of vitamin A deficiency | 0 | 0 | Risk Ratio (M‐H, Fixed, 95% CI) | 0.0 [0.0, 0.0] |
| 6.2 High prevalence of vitamin A deficiency | 1 | 76176 | Risk Ratio (M‐H, Fixed, 95% CI) | 1.01 [0.95, 1.07] |
| 7 Maternal mortality (prevalence of HIV in the general population) Show forest plot | 4 | 161240 | Risk Ratio (M‐H, Random, 95% CI) | 0.87 [0.64, 1.20] |
| 7.1 Countries with low HIV prevalence | 4 | 161240 | Risk Ratio (M‐H, Random, 95% CI) | 0.87 [0.64, 1.20] |
| 7.2 Countries with high HIV prevalence | 0 | 0 | Risk Ratio (M‐H, Random, 95% CI) | 0.0 [0.0, 0.0] |
| 8 Perinatal mortality (prevalence of HIV in the general population) Show forest plot | 1 | 76176 | Risk Ratio (M‐H, Fixed, 95% CI) | 1.01 [0.95, 1.07] |
| 8.1 Countries with low HIV prevalence | 1 | 76176 | Risk Ratio (M‐H, Fixed, 95% CI) | 1.01 [0.95, 1.07] |
| 8.2 Countries with high HIV prevalence | 0 | 0 | Risk Ratio (M‐H, Fixed, 95% CI) | 0.0 [0.0, 0.0] |
| 9 Maternal mortality (dose) Show forest plot | 3 | 160690 | Risk Ratio (M‐H, Random, 95% CI) | 0.88 [0.63, 1.23] |
| 9.1 Daily 10,000 IU | 0 | 0 | Risk Ratio (M‐H, Random, 95% CI) | 0.0 [0.0, 0.0] |
| 9.2 Others | 3 | 160690 | Risk Ratio (M‐H, Random, 95% CI) | 0.88 [0.63, 1.23] |
| 10 Perinatal mortality (dose) Show forest plot | 1 | 76176 | Risk Ratio (M‐H, Fixed, 95% CI) | 1.01 [0.95, 1.07] |
| 10.1 Daily 10,000 IU | 0 | 0 | Risk Ratio (M‐H, Fixed, 95% CI) | 0.0 [0.0, 0.0] |
| 10.2 Others | 1 | 76176 | Risk Ratio (M‐H, Fixed, 95% CI) | 1.01 [0.95, 1.07] |
| 11 Maternal mortality (regimen) Show forest plot | 4 | 161240 | Risk Ratio (M‐H, Random, 95% CI) | 0.87 [0.64, 1.20] |
| 11.1 Daily | 1 | 550 | Risk Ratio (M‐H, Random, 95% CI) | 0.33 [0.01, 8.15] |
| 11.2 Weekly | 3 | 160690 | Risk Ratio (M‐H, Random, 95% CI) | 0.88 [0.63, 1.23] |
| 11.3 Other regimen | 0 | 0 | Risk Ratio (M‐H, Random, 95% CI) | 0.0 [0.0, 0.0] |
| 12 Perinatal mortality (regimen) Show forest plot | 1 | 76176 | Risk Ratio (M‐H, Fixed, 95% CI) | 1.01 [0.95, 1.07] |
| 12.1 Daily | 0 | 0 | Risk Ratio (M‐H, Fixed, 95% CI) | 0.0 [0.0, 0.0] |
| 12.2 Weekly | 1 | 76176 | Risk Ratio (M‐H, Fixed, 95% CI) | 1.01 [0.95, 1.07] |
| 12.3 Other regimen | 0 | 0 | Risk Ratio (M‐H, Fixed, 95% CI) | 0.0 [0.0, 0.0] |
| 13 Maternal mortality (duration of intervention) Show forest plot | 2 | 60216 | Risk Ratio (M‐H, Fixed, 95% CI) | 1.16 [0.82, 1.64] |
| 13.1 One month or less | 1 | 550 | Risk Ratio (M‐H, Fixed, 95% CI) | 0.33 [0.01, 8.15] |
| 13.2 More than one month | 1 | 59666 | Risk Ratio (M‐H, Fixed, 95% CI) | 1.18 [0.83, 1.68] |
| 14 Perinatal mortality (duration of intervention) | 0 | 0 | Risk Ratio (M‐H, Fixed, 95% CI) | 0.0 [0.0, 0.0] |
| 15 Maternal mortality (trimester of pregnancy) Show forest plot | 4 | 161240 | Risk Ratio (M‐H, Random, 95% CI) | 0.87 [0.64, 1.20] |
| 15.1 Pre‐pregnancy | 2 | 101024 | Risk Ratio (M‐H, Random, 95% CI) | 0.77 [0.50, 1.17] |
| 15.2 First trimester | 1 | 59666 | Risk Ratio (M‐H, Random, 95% CI) | 1.18 [0.83, 1.68] |
| 15.3 Second trimester | 0 | 0 | Risk Ratio (M‐H, Random, 95% CI) | 0.0 [0.0, 0.0] |
| 15.4 Third trimester | 1 | 550 | Risk Ratio (M‐H, Random, 95% CI) | 0.33 [0.01, 8.15] |
| 15.5 Mixed | 0 | 0 | Risk Ratio (M‐H, Random, 95% CI) | 0.0 [0.0, 0.0] |
| 16 Perinatal mortality (trimester of pregnancy) Show forest plot | 1 | 76176 | Risk Ratio (M‐H, Fixed, 95% CI) | 1.01 [0.95, 1.07] |
| 16.1 Pre‐pregnancy | 1 | 76176 | Risk Ratio (M‐H, Fixed, 95% CI) | 1.01 [0.95, 1.07] |
| 16.2 First trimester | 0 | 0 | Risk Ratio (M‐H, Fixed, 95% CI) | 0.0 [0.0, 0.0] |
| 16.3 Second trimester | 0 | 0 | Risk Ratio (M‐H, Fixed, 95% CI) | 0.0 [0.0, 0.0] |
| 16.4 Third trimester | 0 | 0 | Risk Ratio (M‐H, Fixed, 95% CI) | 0.0 [0.0, 0.0] |
| 16.5 Mixed | 0 | 0 | Risk Ratio (M‐H, Fixed, 95% CI) | 0.0 [0.0, 0.0] |
| 17 Maternal mortality (randomisation) Show forest plot | 3 | 160690 | Risk Ratio (M‐H, Random, 95% CI) | 0.88 [0.63, 1.23] |
| 17.1 Cluster‐randomised | 3 | 160690 | Risk Ratio (M‐H, Random, 95% CI) | 0.88 [0.63, 1.23] |
| 17.2 Individual‐randomised | 0 | 0 | Risk Ratio (M‐H, Random, 95% CI) | 0.0 [0.0, 0.0] |
| 18 Perinatal mortality (randomisation) Show forest plot | 1 | 76176 | Risk Ratio (M‐H, Fixed, 95% CI) | 1.01 [0.95, 1.07] |
| 18.1 Cluster‐randomised | 1 | 76176 | Risk Ratio (M‐H, Fixed, 95% CI) | 1.01 [0.95, 1.07] |
| 18.2 Individual‐randomised | 0 | 0 | Risk Ratio (M‐H, Fixed, 95% CI) | 0.0 [0.0, 0.0] |
| Outcome or subgroup title | No. of studies | No. of participants | Statistical method | Effect size |
| 1 Maternal mortality (infant mortality level) | 0 | 0 | Risk Ratio (M‐H, Fixed, 95% CI) | 0.0 [0.0, 0.0] |
| 1.1 Countries with low infant mortality | 0 | 0 | Risk Ratio (M‐H, Fixed, 95% CI) | 0.0 [0.0, 0.0] |
| 1.2 Countries with high infant mortality | 0 | 0 | Risk Ratio (M‐H, Fixed, 95% CI) | 0.0 [0.0, 0.0] |
| 2 Perinatal mortality (infant mortality level) | 0 | 0 | Risk Ratio (M‐H, Fixed, 95% CI) | 0.0 [0.0, 0.0] |
| 2.1 Countries with low infant mortality | 0 | 0 | Risk Ratio (M‐H, Fixed, 95% CI) | 0.0 [0.0, 0.0] |
| 2.2 Countries with high infant mortality | 0 | 0 | Risk Ratio (M‐H, Fixed, 95% CI) | 0.0 [0.0, 0.0] |
| 3 Maternal mortality (maternal mortality level) | 0 | 0 | Risk Ratio (M‐H, Fixed, 95% CI) | 0.0 [0.0, 0.0] |
| 3.1 Countries with low maternal mortality | 0 | 0 | Risk Ratio (M‐H, Fixed, 95% CI) | 0.0 [0.0, 0.0] |
| 3.2 Countries with high maternal mortality | 0 | 0 | Risk Ratio (M‐H, Fixed, 95% CI) | 0.0 [0.0, 0.0] |
| 4 Perinatal mortality (maternal mortality level) | 0 | 0 | Risk Ratio (M‐H, Fixed, 95% CI) | 0.0 [0.0, 0.0] |
| 4.1 Countries with low maternal mortality | 0 | 0 | Risk Ratio (M‐H, Fixed, 95% CI) | 0.0 [0.0, 0.0] |
| 4.2 Countries with high maternal mortality | 0 | 0 | Risk Ratio (M‐H, Fixed, 95% CI) | 0.0 [0.0, 0.0] |
| 5 Maternal mortality (prevalence of vitamin A deficiency) | 0 | 0 | Risk Ratio (M‐H, Fixed, 95% CI) | 0.0 [0.0, 0.0] |
| 5.1 Low prevalence of vitamin A deficiency | 0 | 0 | Risk Ratio (M‐H, Fixed, 95% CI) | 0.0 [0.0, 0.0] |
| 5.2 High prevalence of vitamin A deficiency | 0 | 0 | Risk Ratio (M‐H, Fixed, 95% CI) | 0.0 [0.0, 0.0] |
| 6 Perinatal mortality (prevalence of vitamin A deficiency) | 0 | 0 | Risk Ratio (M‐H, Fixed, 95% CI) | 0.0 [0.0, 0.0] |
| 6.1 Low prevalence of vitamin A deficiency | 0 | 0 | Risk Ratio (M‐H, Fixed, 95% CI) | 0.0 [0.0, 0.0] |
| 6.2 High prevalence of vitamin A deficiency | 0 | 0 | Risk Ratio (M‐H, Fixed, 95% CI) | 0.0 [0.0, 0.0] |
| 7 Maternal mortality (prevalence of HIV in the general population) | 0 | 0 | Risk Ratio (M‐H, Fixed, 95% CI) | 0.0 [0.0, 0.0] |
| 7.1 Countries with low HIV prevalence | 0 | 0 | Risk Ratio (M‐H, Fixed, 95% CI) | 0.0 [0.0, 0.0] |
| 7.2 Countries with high HIV prevalence | 0 | 0 | Risk Ratio (M‐H, Fixed, 95% CI) | 0.0 [0.0, 0.0] |
| 8 Perinatal mortality (prevalence of HIV in the general population) | 0 | 0 | Risk Ratio (M‐H, Fixed, 95% CI) | 0.0 [0.0, 0.0] |
| 8.1 Countries with low HIV prevalence | 0 | 0 | Risk Ratio (M‐H, Fixed, 95% CI) | 0.0 [0.0, 0.0] |
| 8.2 Countries with high HIV prevalence | 0 | 0 | Risk Ratio (M‐H, Fixed, 95% CI) | 0.0 [0.0, 0.0] |
| 9 Maternal mortality (dose) | 0 | 0 | Risk Ratio (M‐H, Fixed, 95% CI) | 0.0 [0.0, 0.0] |
| 9.1 Daily 10,000 IU | 0 | 0 | Risk Ratio (M‐H, Fixed, 95% CI) | 0.0 [0.0, 0.0] |
| 9.2 Others | 0 | 0 | Risk Ratio (M‐H, Fixed, 95% CI) | 0.0 [0.0, 0.0] |
| 10 Perinatal mortality (dose) | 0 | 0 | Risk Ratio (M‐H, Fixed, 95% CI) | 0.0 [0.0, 0.0] |
| 10.1 Daily 10,000 IU | 0 | 0 | Risk Ratio (M‐H, Fixed, 95% CI) | 0.0 [0.0, 0.0] |
| 10.2 Others | 0 | 0 | Risk Ratio (M‐H, Fixed, 95% CI) | 0.0 [0.0, 0.0] |
| 11 Maternal mortality (regimen) | 0 | 0 | Risk Ratio (M‐H, Fixed, 95% CI) | 0.0 [0.0, 0.0] |
| 11.1 Daily | 0 | 0 | Risk Ratio (M‐H, Fixed, 95% CI) | 0.0 [0.0, 0.0] |
| 11.2 Weekly | 0 | 0 | Risk Ratio (M‐H, Fixed, 95% CI) | 0.0 [0.0, 0.0] |
| 11.3 Other regimen | 0 | 0 | Risk Ratio (M‐H, Fixed, 95% CI) | 0.0 [0.0, 0.0] |
| 12 Perinatal mortality (regimen) | 0 | 0 | Risk Ratio (M‐H, Fixed, 95% CI) | 0.0 [0.0, 0.0] |
| 12.1 Daily | 0 | 0 | Risk Ratio (M‐H, Fixed, 95% CI) | 0.0 [0.0, 0.0] |
| 12.2 Weekly | 0 | 0 | Risk Ratio (M‐H, Fixed, 95% CI) | 0.0 [0.0, 0.0] |
| 12.3 Other regimen | 0 | 0 | Risk Ratio (M‐H, Fixed, 95% CI) | 0.0 [0.0, 0.0] |
| 13 Maternal mortality (duration of intervention) | 0 | 0 | Risk Ratio (M‐H, Fixed, 95% CI) | 0.0 [0.0, 0.0] |
| 14 Perinatal mortality (duration of intervention) | 0 | 0 | Risk Ratio (M‐H, Fixed, 95% CI) | 0.0 [0.0, 0.0] |
| 15 Maternal mortality (trimester of pregnancy) | 0 | 0 | Risk Ratio (M‐H, Fixed, 95% CI) | 0.0 [0.0, 0.0] |
| 15.1 Pre‐pregnancy | 0 | 0 | Risk Ratio (M‐H, Fixed, 95% CI) | 0.0 [0.0, 0.0] |
| 15.2 First trimester | 0 | 0 | Risk Ratio (M‐H, Fixed, 95% CI) | 0.0 [0.0, 0.0] |
| 15.3 Second trimester | 0 | 0 | Risk Ratio (M‐H, Fixed, 95% CI) | 0.0 [0.0, 0.0] |
| 15.4 Third trimester | 0 | 0 | Risk Ratio (M‐H, Fixed, 95% CI) | 0.0 [0.0, 0.0] |
| 15.5 Mixed | 0 | 0 | Risk Ratio (M‐H, Fixed, 95% CI) | 0.0 [0.0, 0.0] |
| 16 Perinatal mortality (trimester of pregnancy) | 0 | 0 | Risk Ratio (M‐H, Fixed, 95% CI) | 0.0 [0.0, 0.0] |
| 16.1 Pre‐pregnancy | 0 | 0 | Risk Ratio (M‐H, Fixed, 95% CI) | 0.0 [0.0, 0.0] |
| 16.2 First trimester | 0 | 0 | Risk Ratio (M‐H, Fixed, 95% CI) | 0.0 [0.0, 0.0] |
| 16.3 Second trimester | 0 | 0 | Risk Ratio (M‐H, Fixed, 95% CI) | 0.0 [0.0, 0.0] |
| 16.4 Third trimester | 0 | 0 | Risk Ratio (M‐H, Fixed, 95% CI) | 0.0 [0.0, 0.0] |
| 16.5 Mixed | 0 | 0 | Risk Ratio (M‐H, Fixed, 95% CI) | 0.0 [0.0, 0.0] |
| 17 Maternal mortality (randomisation) | 0 | 0 | Risk Ratio (M‐H, Fixed, 95% CI) | 0.0 [0.0, 0.0] |
| 17.1 Cluster‐randomised | 0 | 0 | Risk Ratio (M‐H, Fixed, 95% CI) | 0.0 [0.0, 0.0] |
| 17.2 Individual‐randomised | 0 | 0 | Risk Ratio (M‐H, Fixed, 95% CI) | 0.0 [0.0, 0.0] |
| 18 Perinatal mortality (randomisation) | 0 | 0 | Risk Ratio (M‐H, Fixed, 95% CI) | 0.0 [0.0, 0.0] |
| 18.1 Cluster‐randomised | 0 | 0 | Risk Ratio (M‐H, Fixed, 95% CI) | 0.0 [0.0, 0.0] |
| 18.2 Individual‐randomised | 0 | 0 | Risk Ratio (M‐H, Fixed, 95% CI) | 0.0 [0.0, 0.0] |
| Outcome or subgroup title | No. of studies | No. of participants | Statistical method | Effect size |
| 1 Maternal mortality (infant mortality level) | 0 | 0 | Risk Ratio (M‐H, Fixed, 95% CI) | 0.0 [0.0, 0.0] |
| 1.1 Countries with low infant mortality | 0 | 0 | Risk Ratio (M‐H, Fixed, 95% CI) | 0.0 [0.0, 0.0] |
| 1.2 Countries with high infant mortality | 0 | 0 | Risk Ratio (M‐H, Fixed, 95% CI) | 0.0 [0.0, 0.0] |
| 2 Perinatal mortality (infant mortality level) Show forest plot | 1 | 179 | Risk Ratio (M‐H, Fixed, 95% CI) | 0.51 [0.10, 2.69] |
| 2.1 Countries with low infant mortality | 0 | 0 | Risk Ratio (M‐H, Fixed, 95% CI) | 0.0 [0.0, 0.0] |
| 2.2 Countries with high infant mortality | 1 | 179 | Risk Ratio (M‐H, Fixed, 95% CI) | 0.51 [0.10, 2.69] |
| 3 Maternal mortality (maternal mortality level) | 0 | 0 | Risk Ratio (M‐H, Fixed, 95% CI) | 0.0 [0.0, 0.0] |
| 3.1 Countries with low maternal mortality | 0 | 0 | Risk Ratio (M‐H, Fixed, 95% CI) | 0.0 [0.0, 0.0] |
| 3.2 Countries with high maternal mortality | 0 | 0 | Risk Ratio (M‐H, Fixed, 95% CI) | 0.0 [0.0, 0.0] |
| 4 Perinatal mortality (maternal mortality level) Show forest plot | 1 | 179 | Risk Ratio (M‐H, Fixed, 95% CI) | 0.51 [0.10, 2.69] |
| 4.1 Countries with low maternal mortality | 0 | 0 | Risk Ratio (M‐H, Fixed, 95% CI) | 0.0 [0.0, 0.0] |
| 4.2 Countries with high maternal mortality | 1 | 179 | Risk Ratio (M‐H, Fixed, 95% CI) | 0.51 [0.10, 2.69] |
| 5 Maternal mortality (prevalence of vitamin A deficiency) Show forest plot | 1 | 179 | Risk Ratio (M‐H, Fixed, 95% CI) | 0.51 [0.10, 2.69] |
| 5.1 Low prevalence of vitamin A deficiency | 0 | 0 | Risk Ratio (M‐H, Fixed, 95% CI) | 0.0 [0.0, 0.0] |
| 5.2 High prevalence of vitamin A deficiency | 1 | 179 | Risk Ratio (M‐H, Fixed, 95% CI) | 0.51 [0.10, 2.69] |
| 6 Perinatal mortality (prevalence of vitamin A deficiency) Show forest plot | 1 | 179 | Risk Ratio (M‐H, Fixed, 95% CI) | 0.51 [0.10, 2.69] |
| 6.1 Low prevalence of vitamin A deficiency | 1 | 179 | Risk Ratio (M‐H, Fixed, 95% CI) | 0.51 [0.10, 2.69] |
| 6.2 High prevalence of vitamin A deficiency | 0 | 0 | Risk Ratio (M‐H, Fixed, 95% CI) | 0.0 [0.0, 0.0] |
| 7 Maternal mortality (prevalence of HIV in the general population) | 0 | 0 | Risk Ratio (M‐H, Fixed, 95% CI) | 0.0 [0.0, 0.0] |
| 7.1 Countries with low HIV prevalence | 0 | 0 | Risk Ratio (M‐H, Fixed, 95% CI) | 0.0 [0.0, 0.0] |
| 7.2 Countries with high HIV prevalence | 0 | 0 | Risk Ratio (M‐H, Fixed, 95% CI) | 0.0 [0.0, 0.0] |
| 8 Perinatal mortality (prevalence of HIV in the general population) Show forest plot | 1 | 179 | Risk Ratio (M‐H, Fixed, 95% CI) | 0.51 [0.10, 2.69] |
| 8.1 Countries with low HIV prevalence | 1 | 179 | Risk Ratio (M‐H, Fixed, 95% CI) | 0.51 [0.10, 2.69] |
| 8.2 Countries with high HIV prevalence | 0 | 0 | Risk Ratio (M‐H, Fixed, 95% CI) | 0.0 [0.0, 0.0] |
| 9 Maternal mortality (dose) | 0 | 0 | Risk Ratio (M‐H, Fixed, 95% CI) | 0.0 [0.0, 0.0] |
| 9.1 Daily 10,000 IU | 0 | 0 | Risk Ratio (M‐H, Fixed, 95% CI) | 0.0 [0.0, 0.0] |
| 9.2 Others | 0 | 0 | Risk Ratio (M‐H, Fixed, 95% CI) | 0.0 [0.0, 0.0] |
| 10 Perinatal mortality (dose) Show forest plot | 1 | 179 | Risk Ratio (M‐H, Fixed, 95% CI) | 0.51 [0.10, 2.69] |
| 10.1 Daily 10,000 IU | 0 | 0 | Risk Ratio (M‐H, Fixed, 95% CI) | 0.0 [0.0, 0.0] |
| 10.2 Others | 1 | 179 | Risk Ratio (M‐H, Fixed, 95% CI) | 0.51 [0.10, 2.69] |
| 11 Maternal mortality (regimen) | 0 | 0 | Risk Ratio (M‐H, Fixed, 95% CI) | 0.0 [0.0, 0.0] |
| 11.1 Daily | 0 | 0 | Risk Ratio (M‐H, Fixed, 95% CI) | 0.0 [0.0, 0.0] |
| 11.2 Weekly | 0 | 0 | Risk Ratio (M‐H, Fixed, 95% CI) | 0.0 [0.0, 0.0] |
| 11.3 Other regimen | 0 | 0 | Risk Ratio (M‐H, Fixed, 95% CI) | 0.0 [0.0, 0.0] |
| 12 Perinatal mortality (regimen) Show forest plot | 1 | 179 | Risk Ratio (M‐H, Fixed, 95% CI) | 0.51 [0.10, 2.69] |
| 12.1 Daily | 1 | 179 | Risk Ratio (M‐H, Fixed, 95% CI) | 0.51 [0.10, 2.69] |
| 12.2 Weekly | 0 | 0 | Risk Ratio (M‐H, Fixed, 95% CI) | 0.0 [0.0, 0.0] |
| 12.3 Other regimen | 0 | 0 | Risk Ratio (M‐H, Fixed, 95% CI) | 0.0 [0.0, 0.0] |
| 13 Maternal mortality (duration of intervention) | 0 | 0 | Risk Ratio (M‐H, Fixed, 95% CI) | 0.0 [0.0, 0.0] |
| 14 Perinatal mortality (duration of intervention) | 0 | 0 | Risk Ratio (M‐H, Fixed, 95% CI) | 0.0 [0.0, 0.0] |
| 15 Maternal mortality (trimester of pregnancy) | 0 | 0 | Risk Ratio (M‐H, Fixed, 95% CI) | 0.0 [0.0, 0.0] |
| 15.1 Pre‐pregnancy | 0 | 0 | Risk Ratio (M‐H, Fixed, 95% CI) | 0.0 [0.0, 0.0] |
| 15.2 First trimester | 0 | 0 | Risk Ratio (M‐H, Fixed, 95% CI) | 0.0 [0.0, 0.0] |
| 15.3 Second trimester | 0 | 0 | Risk Ratio (M‐H, Fixed, 95% CI) | 0.0 [0.0, 0.0] |
| 15.4 Third trimester | 0 | 0 | Risk Ratio (M‐H, Fixed, 95% CI) | 0.0 [0.0, 0.0] |
| 15.5 Mixed | 0 | 0 | Risk Ratio (M‐H, Fixed, 95% CI) | 0.0 [0.0, 0.0] |
| 16 Perinatal mortality (trimester of pregnancy) Show forest plot | 1 | 179 | Risk Ratio (M‐H, Fixed, 95% CI) | 0.51 [0.10, 2.69] |
| 16.1 Pre‐pregnancy | 0 | 0 | Risk Ratio (M‐H, Fixed, 95% CI) | 0.0 [0.0, 0.0] |
| 16.2 First trimester | 0 | 0 | Risk Ratio (M‐H, Fixed, 95% CI) | 0.0 [0.0, 0.0] |
| 16.3 Second trimester | 0 | 0 | Risk Ratio (M‐H, Fixed, 95% CI) | 0.0 [0.0, 0.0] |
| 16.4 Third trimester | 0 | 0 | Risk Ratio (M‐H, Fixed, 95% CI) | 0.0 [0.0, 0.0] |
| 16.5 Mixed | 1 | 179 | Risk Ratio (M‐H, Fixed, 95% CI) | 0.51 [0.10, 2.69] |
| 17 Maternal mortality (randomisation) | 0 | 0 | Risk Ratio (M‐H, Fixed, 95% CI) | 0.0 [0.0, 0.0] |
| 17.1 Cluster‐randomised | 0 | 0 | Risk Ratio (M‐H, Fixed, 95% CI) | 0.0 [0.0, 0.0] |
| 17.2 Individual‐randomised | 0 | 0 | Risk Ratio (M‐H, Fixed, 95% CI) | 0.0 [0.0, 0.0] |
| 18 Perinatal mortality (randomisation) Show forest plot | 1 | 179 | Risk Ratio (M‐H, Fixed, 95% CI) | 0.51 [0.10, 2.69] |
| 18.1 Cluster‐randomised | 0 | 0 | Risk Ratio (M‐H, Fixed, 95% CI) | 0.0 [0.0, 0.0] |
| 18.2 Individual‐randomised | 1 | 179 | Risk Ratio (M‐H, Fixed, 95% CI) | 0.51 [0.10, 2.69] |