Incentivos para la prevención del hábito de fumar en niños y adolescentes
Información
- DOI:
- https://doi.org/10.1002/14651858.CD008645.pub3Copiar DOI

- Base de datos:
-
- Cochrane Database of Systematic Reviews
- Versión publicada:
-
- 06 junio 2017see what's new
- Tipo:
-
- Intervention
- Etapa:
-
- Review
- Grupo Editorial Cochrane:
-
Grupo Cochrane de Tabaquismo
- Copyright:
-
- Copyright © 2018 The Cochrane Collaboration. Published by John Wiley & Sons, Ltd.
Cifras del artículo
Altmetric:
Citado por:
Autores
Contributions of authors
Marita Hefler, with David Thomas, assessed the quality of the studies and risk of bias of the included studies. Marita Hefler prepared the first draft of the updated review and revisions.
Selma Liberato performed the reanalyses of data for this review and the meta‐analysis, assisted with the development of this review and provided critical comment and revision of the draft manuscript.
David Thomas conceived of this review. Together with Marita Hefler, he assessed the quality and risk of bias of the included studies
Sources of support
Internal sources
-
Marita Hefler, Australia.
Salary support received from Menzies School of Health Research.
-
Selma Liberato, Australia.
Salary support received from Menzies School of Health Research.
-
David P Thomas, Australia.
Salary support received from Menzies School of Health Research.
External sources
-
No sources of support supplied
Declarations of interest
None known
Acknowledgements
Vanessa Johnston was the first author of the first version of this review. She developed the search strategies, undertook the initial screening of retrieved records, extracted data from the eligible studies and (with David Thomas) assessed the quality of the studies and risk of bias of the included studies. She also prepared the first draft of the first version. We would like to thank Lindsay Stead of the Cochrane Addiction Group, who completed electronic searches for and pre‐screening of studies for possible inclusion in this review. We would also like to thank Stephanie Stucki for supplying additional data for this update.
Version history
| Published | Title | Stage | Authors | Version |
| 2017 Jun 06 | Incentives for preventing smoking in children and adolescents | Review | Marita Hefler, Selma C Liberato, David P Thomas | |
| 2012 Oct 17 | Incentives for preventing smoking in children and adolescents | Review | Vanessa Johnston, Selma Liberato, David Thomas | |
| 2010 Aug 04 | Incentives for preventing smoking in children and adolescents | Protocol | David Thomas, Vanessa Johnston | |
Differences between protocol and review
We have included a 'Summary of findings' table to this review update (2017).
Keywords
MeSH
Medical Subject Headings (MeSH) Keywords
Medical Subject Headings Check Words
Adolescent; Child; Humans;
PICO

PRISMA study flow diagram of search results
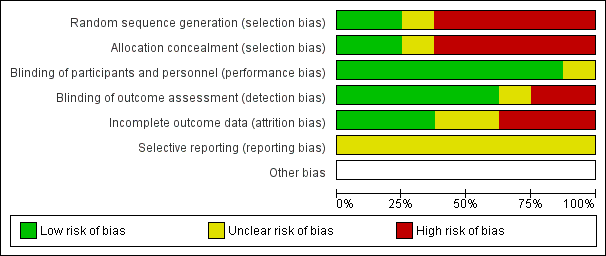
Risk of bias graph: review authors' judgements about each risk of bias item presented as percentages across all included studies
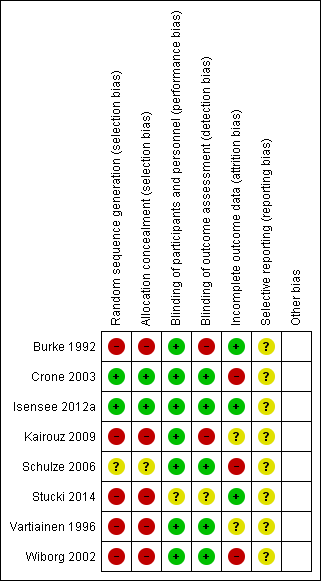
Risk of bias summary: review authors' judgements about each risk of bias item for each included study
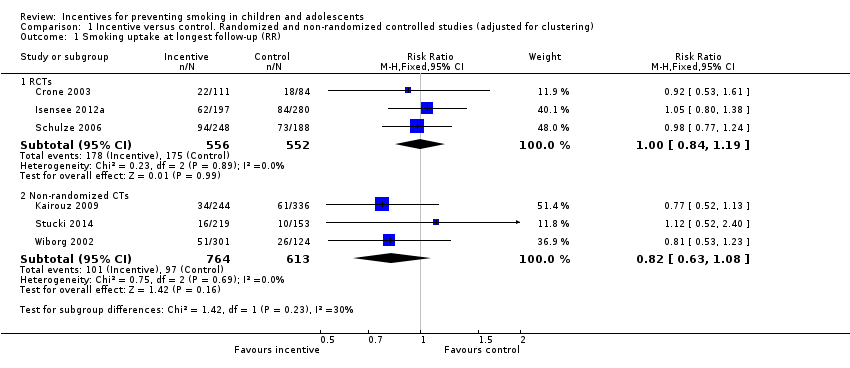
Comparison 1 Incentive versus control. Randomized and non‐randomized controlled studies (adjusted for clustering), Outcome 1 Smoking uptake at longest follow‐up (RR).
| Study | Number of non‐smokers at baseline | Number of smokers at endpoint who reported not smoking at baseline | Time point | Outcome | Biological criterion | Results | Secondary outcomes (dose response, cost, harms) |
| Crone 2003 | 556 intervention; 420 control (data from authors) | 112 intervention; 88 control
| 19 months | Smoking = current smoking, including daily/weekly/experimental | Not biochemically verified | Not reported at 19 months in published paper. Our reanalysis: RR 0.92 (95% CI 0.53 to 1.61) | Not reported |
| Isensee 2012a | 430 never‐ smokers in intervention; 610 never‐smokers in control (data from authors) | 136 intervention; 184 control | 19 months | Smoking = ever smoking, even just a puff | Not biochemically verified | From published paper: Authors reported that no group differences were found in the frequency of smoking initiation but data not presented in paper. Our reanalysis: RR 1.05 (95% CI 0.80 to 1.38) | Bullying (Hanewinkel 2010): "When compared with control classrooms on all three dependent variables – being victimised, active bullying or being isolated – the adjusted ORs indicated no significant differences at post‐test for any of the IGs [Intervention Groups]". |
| Schulze 2006 | 591 never‐smokers in intervention; 449 never‐smokers in control | 224 intervention; 173 control | 24 months | Smoking = current smoking, including irregular (less than weekly) smoking | Not biochemically verified | From published paper: 62.1% remained ‘never smoker’ in intervention group at follow‐up versus 61.4% in control group: OR 1.02 (0.83 to 1.24) adjusted for age, sex and school type.
Our reanalysis: RR 0.98 (95% CI 0.77 to 1.24) | Not reported |
Comparison 2 Results of included studies, Outcome 1 Results table: RCTs.
| Study | Number of non‐smokers at baseline | Number of smokers at endpoint who reported not smoking at baseline | Time point | Outcome | Biological criterion | Results | Secondary outcomes (dose response, cost, harms) | Comment |
| Burke 1992 | Not reported | Not reported | 18 months | Mean (SD) score of 5‐category self‐definition of smoking and 10‐category self‐reported frequency | Salivary thiocyanate (TCN) | From published paper: Mean TCN at follow‐up of pre‐intervention never‐smokers higher (560 mcg/mL, SD 403) versus control (514 mcg/mL, SD 424). Primary outcome for this review not available. | Not reported | |
| Kairouz 2009 | 664 intervention; 915 control | 93 intervention; 165 control | 10 ‐ 18 months | Smoking = ever smoking, even just a puff | Not biochemically verified | From published paper: OR 0.8 (0.5 to 1.1), adjusted for age, gender, school location, social deprivation index. Our reanalysis: RR 0.81 (95% CI 0.55 to1.20) | Intervention participants more likely than control participants to report that people “should not hang out with smokers” (14% versus 11%) and that they, themselves would “not want to be friends with a classmate who smokes” (28% versus 25%) | Concerns about misreporting of smoking status. Note large numbers of ever‐smokers at baseline then denying ever smoking at follow‐up. Stat sig more in intervention vs control (24% vs 16%) |
| Stucki 2014 | 544 intervention, 378 control | 39 intervention, 24 control | About 7 months | Smoking = any smoking in last 6 months, even just a puff and smoking during the previous month | Not biochemically verified | From published and additional data from authors. OR for decreased smoking prevalence 0.7, CI 0.5 to 1.0 | Increased smoking‐related knowledge b ‐1.0, P < 0.01 | |
| Vartiainen 1996 | Not reported and not available from authors | Not reported and not available from authors | 18 months | Smoking = daily smoking | Not biochemically verified | Reports only on the increase in prevalence of smoking from baseline to follow‐up. From baseline to longest follow‐up, increase by 10.8% points in Intervention group vs 11.2% points in control group: OR 1.25 (P = 0.15). Primary outcome for this review not available. | Not reported. Except in discussion – authors report "The social pressure created by the competition process was not greatly criticised in the pupils’ answers." | |
| Wiborg 2002 | 1215 intervention group; 502 control (data from authors) | 207 intervention; 107 control | 12 months | Smoking = 4 week prevalence of smoking | Not biochemically verified | From published paper: OR 1.36 (1.04 to 1.76), adjusted for age, sex, smoking status at baseline Our reanalysis: RR 0.81 (95% CI 0.53 to 1.23) | Cost benefit (Hoeflymayr 2008). Cost benefit ratio: economic modelling based on estimates of reduced smoking prevalence in Intervention group and models of assumed future smoking behaviour and cessation. Not based on prevention of initiation | |
Comparison 2 Results of included studies, Outcome 2 Results table: non‐randomized CTs.
| Smokefree Class Competitions (SFC) for preventing smoking uptake | |||||
| Patient or population: Children and adolescents aged 5 ‐ 18 years who were non‐smokers at baseline Settings: Schools in Germany, the Netherlands, Finland, Switzerland, Canada and the United States Intervention: Participation in SFC Comparison: No participation in SFC | |||||
| Outcomes | Illustrative comparative risks* (95% CI) | Relative effect | No of Participants Actual number/ effective number2 | Quality of the evidence | |
| Assumed risk1 | Corresponding risk | ||||
| Smoking uptake at longest follow‐up (RCTS) | 317 per 1000 | 320 per 1000 | RR 1.00 (0.84 to 1.19) | 3056/1108 (3) | Low3, 4 |
| Smoking uptake at longest follow‐up (Non‐RCTs) | 158 per 1000 | 132 per 1000 | RR 0.82 (0.63 to 1.08) | 4219/1377 (3) | Very low3, 5, 6 |
| *The basis for the assumed risk (e.g. the median control group risk across studies) is provided in footnotes. The corresponding risk (and its 95% confidence interval) is based on the assumed risk in the comparison group and the relative effect of the intervention (and its 95% CI). | |||||
| GRADE Working Group grades of evidence | |||||
| 1'Assumed risk' calculated as risk in control groups. | |||||
| Outcome or subgroup title | No. of studies | No. of participants | Statistical method | Effect size |
| 1 Smoking uptake at longest follow‐up (RR) Show forest plot | 6 | Risk Ratio (M‐H, Fixed, 95% CI) | Subtotals only | |
| 1.1 RCTs | 3 | 1108 | Risk Ratio (M‐H, Fixed, 95% CI) | 1.00 [0.84, 1.19] |
| 1.2 Non‐randomized CTs | 3 | 1377 | Risk Ratio (M‐H, Fixed, 95% CI) | 0.82 [0.63, 1.08] |
| Outcome or subgroup title | No. of studies | No. of participants | Statistical method | Effect size |
| 1 Results table: RCTs Show forest plot | Other data | No numeric data | ||
| 2 Results table: non‐randomized CTs Show forest plot | Other data | No numeric data | ||