| Burke 1992 | Not reported | Not reported | 18 months | Mean (SD) score of 5‐category self‐definition of smoking and 10‐category self‐reported frequency | Salivary thiocyanate (TCN) | From published paper: Mean TCN at follow‐up of pre‐intervention never‐smokers higher (560 mcg/mL, SD 403) versus control (514 mcg/mL, SD 424). Primary outcome for this review not available. | Not reported | |
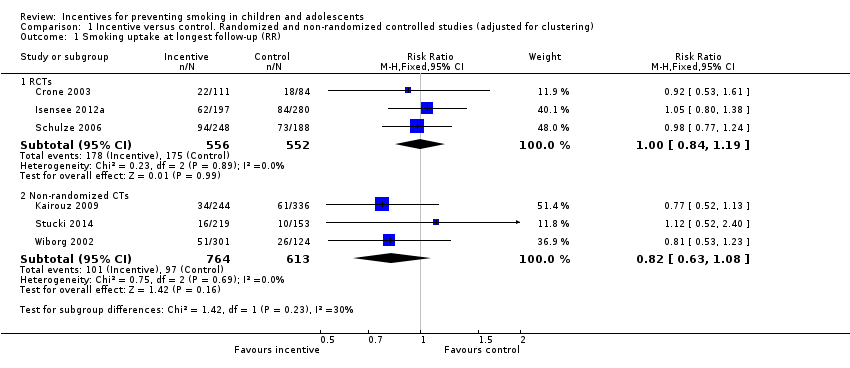
| Kairouz 2009 | 664 intervention; 915 control | 93 intervention; 165 control | 10 ‐ 18 months | Smoking = ever smoking, even just a puff | Not biochemically verified | From published paper: OR 0.8 (0.5 to 1.1), adjusted for age, gender, school location, social deprivation index. Our reanalysis: RR 0.81 (95% CI 0.55 to1.20) | Intervention participants more likely than control participants to report that people “should not hang out with smokers” (14% versus 11%) and that they, themselves would “not want to be friends with a classmate who smokes” (28% versus 25%) | Concerns about misreporting of smoking status. Note large numbers of ever‐smokers at baseline then denying ever smoking at follow‐up. Stat sig more in intervention vs control (24% vs 16%) |
| Stucki 2014 | 544 intervention, 378 control | 39 intervention, 24 control | About 7 months | Smoking = any smoking in last 6 months, even just a puff and smoking during the previous month | Not biochemically verified | From published and additional data from authors. OR for decreased smoking prevalence 0.7, CI 0.5 to 1.0 | Increased smoking‐related knowledge b ‐1.0, P < 0.01 | |
| Vartiainen 1996 | Not reported and not available from authors | Not reported and not available from authors | 18 months | Smoking = daily smoking | Not biochemically verified | Reports only on the increase in prevalence of smoking from baseline to follow‐up. From baseline to longest follow‐up, increase by 10.8% points in Intervention group vs 11.2% points in control group: OR 1.25 (P = 0.15). Primary outcome for this review not available. | Not reported. Except in discussion – authors report "The social pressure created by the competition process was not greatly criticised in the pupils’ answers." | |
| Wiborg 2002 | 1215 intervention group; 502 control (data from authors) | 207 intervention; 107 control | 12 months | Smoking = 4 week prevalence of smoking | Not biochemically verified | From published paper: OR 1.36 (1.04 to 1.76), adjusted for age, sex, smoking status at baseline Our reanalysis: RR 0.81 (95% CI 0.53 to 1.23) | Cost benefit (Hoeflymayr 2008). Cost benefit ratio: economic modelling based on estimates of reduced smoking prevalence in Intervention group and models of assumed future smoking behaviour and cessation. Not based on prevention of initiation | |