Scolaris Content Display Scolaris Content Display

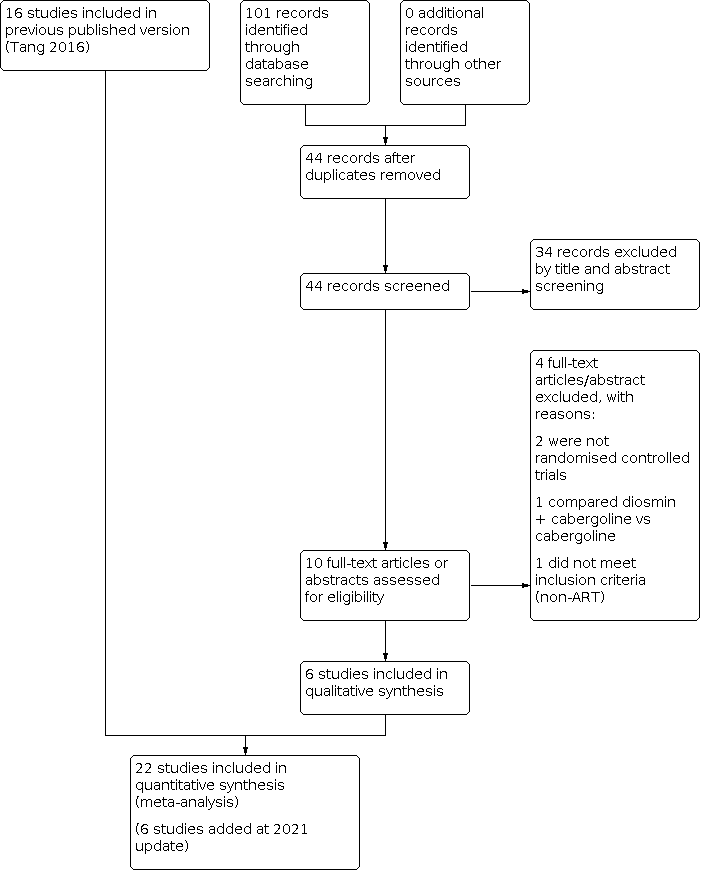
Study flow diagram search May 2020. ART: assisted reproduction technology.

Figuras y tablas -
Figure 1

Study flow diagram search May 2020. ART: assisted reproduction technology.

Risk of bias graph: review authors' judgements about each risk of bias item presented as percentages across all included studies.

Figuras y tablas -
Figure 2

Risk of bias graph: review authors' judgements about each risk of bias item presented as percentages across all included studies.

Risk of bias summary: review authors' judgements about each risk of bias item for each included study.

Figuras y tablas -
Figure 3

Risk of bias summary: review authors' judgements about each risk of bias item for each included study.

Forest plot of comparison 1: Dopamine agonist (without co‐intervention) versus placebo/no intervention, outcome: 1.1 moderate or severe ovarian hyperstimulation syndrome.

Figuras y tablas -
Figure 4

Forest plot of comparison 1: Dopamine agonist (without co‐intervention) versus placebo/no intervention, outcome: 1.1 moderate or severe ovarian hyperstimulation syndrome.

Forest plot of comparison: 2 Dopamine agonist plus co‐intervention versus co‐intervention, outcome: 2.1 Moderate or severe ovarian hyperstimulation syndrome.

Figuras y tablas -
Figure 5

Forest plot of comparison: 2 Dopamine agonist plus co‐intervention versus co‐intervention, outcome: 2.1 Moderate or severe ovarian hyperstimulation syndrome.

Funnel plot of comparison: 3 Dopamine agonist versus other active interventions, outcome: 3.1 Incidence of moderate or severe ovarian hyperstimulation syndrome (OHSS).

Figuras y tablas -
Figure 6

Funnel plot of comparison: 3 Dopamine agonist versus other active interventions, outcome: 3.1 Incidence of moderate or severe ovarian hyperstimulation syndrome (OHSS).

Forest plot of comparison 3: Cabergoline versus active interventions, outcome: 3.1 moderate or severe ovarian hyperstimulation syndrome.

Figuras y tablas -
Figure 7

Forest plot of comparison 3: Cabergoline versus active interventions, outcome: 3.1 moderate or severe ovarian hyperstimulation syndrome.

Comparison 1: Dopamine agonist versus placebo/no intervention, Outcome 1: Incidence of moderate or severe ovarian hyperstimulation syndrome (OHSS)

Figuras y tablas -
Analysis 1.1

Comparison 1: Dopamine agonist versus placebo/no intervention, Outcome 1: Incidence of moderate or severe ovarian hyperstimulation syndrome (OHSS)

Comparison 1: Dopamine agonist versus placebo/no intervention, Outcome 2: Subgroup analysis by severity of OHSS

Figuras y tablas -
Analysis 1.2

Comparison 1: Dopamine agonist versus placebo/no intervention, Outcome 2: Subgroup analysis by severity of OHSS

Comparison 1: Dopamine agonist versus placebo/no intervention, Outcome 3: Live birth rate

Figuras y tablas -
Analysis 1.3

Comparison 1: Dopamine agonist versus placebo/no intervention, Outcome 3: Live birth rate

Comparison 1: Dopamine agonist versus placebo/no intervention, Outcome 4: Clinical pregnancy rate

Figuras y tablas -
Analysis 1.4

Comparison 1: Dopamine agonist versus placebo/no intervention, Outcome 4: Clinical pregnancy rate

Comparison 1: Dopamine agonist versus placebo/no intervention, Outcome 5: Multiple pregnancy rate

Figuras y tablas -
Analysis 1.5

Comparison 1: Dopamine agonist versus placebo/no intervention, Outcome 5: Multiple pregnancy rate

Comparison 1: Dopamine agonist versus placebo/no intervention, Outcome 6: Miscarriage rate

Figuras y tablas -
Analysis 1.6

Comparison 1: Dopamine agonist versus placebo/no intervention, Outcome 6: Miscarriage rate

Comparison 1: Dopamine agonist versus placebo/no intervention, Outcome 7: Any other adverse events

Figuras y tablas -
Analysis 1.7

Comparison 1: Dopamine agonist versus placebo/no intervention, Outcome 7: Any other adverse events

Comparison 2: Dopamine agonist plus co‐intervention (DA+co‐int) versus co‐intervention (co‐int), Outcome 1: Incidence of moderate or severe ovarian hyperstimulation syndrome (OHSS)

Figuras y tablas -
Analysis 2.1

Comparison 2: Dopamine agonist plus co‐intervention (DA+co‐int) versus co‐intervention (co‐int), Outcome 1: Incidence of moderate or severe ovarian hyperstimulation syndrome (OHSS)

Comparison 2: Dopamine agonist plus co‐intervention (DA+co‐int) versus co‐intervention (co‐int), Outcome 2: Live birth rate

Figuras y tablas -
Analysis 2.2

Comparison 2: Dopamine agonist plus co‐intervention (DA+co‐int) versus co‐intervention (co‐int), Outcome 2: Live birth rate

Comparison 2: Dopamine agonist plus co‐intervention (DA+co‐int) versus co‐intervention (co‐int), Outcome 3: Clinical pregnancy rate

Figuras y tablas -
Analysis 2.3

Comparison 2: Dopamine agonist plus co‐intervention (DA+co‐int) versus co‐intervention (co‐int), Outcome 3: Clinical pregnancy rate

Comparison 2: Dopamine agonist plus co‐intervention (DA+co‐int) versus co‐intervention (co‐int), Outcome 4: Multiple pregnancy rate

Figuras y tablas -
Analysis 2.4

Comparison 2: Dopamine agonist plus co‐intervention (DA+co‐int) versus co‐intervention (co‐int), Outcome 4: Multiple pregnancy rate

Comparison 2: Dopamine agonist plus co‐intervention (DA+co‐int) versus co‐intervention (co‐int), Outcome 5: Miscarriage rate

Figuras y tablas -
Analysis 2.5

Comparison 2: Dopamine agonist plus co‐intervention (DA+co‐int) versus co‐intervention (co‐int), Outcome 5: Miscarriage rate

Comparison 2: Dopamine agonist plus co‐intervention (DA+co‐int) versus co‐intervention (co‐int), Outcome 6: Any other adverse events

Figuras y tablas -
Analysis 2.6

Comparison 2: Dopamine agonist plus co‐intervention (DA+co‐int) versus co‐intervention (co‐int), Outcome 6: Any other adverse events

Comparison 3: Dopamine agonist versus other active interventions, Outcome 1: Incidence of moderate or severe ovarian hyperstimulation syndrome (OHSS)

Figuras y tablas -
Analysis 3.1

Comparison 3: Dopamine agonist versus other active interventions, Outcome 1: Incidence of moderate or severe ovarian hyperstimulation syndrome (OHSS)

Comparison 3: Dopamine agonist versus other active interventions, Outcome 2: Live birth rate

Figuras y tablas -
Analysis 3.2

Comparison 3: Dopamine agonist versus other active interventions, Outcome 2: Live birth rate

Comparison 3: Dopamine agonist versus other active interventions, Outcome 3: Clinical pregnancy rate

Figuras y tablas -
Analysis 3.3

Comparison 3: Dopamine agonist versus other active interventions, Outcome 3: Clinical pregnancy rate

Comparison 3: Dopamine agonist versus other active interventions, Outcome 4: Multiple pregnancy rate

Figuras y tablas -
Analysis 3.4

Comparison 3: Dopamine agonist versus other active interventions, Outcome 4: Multiple pregnancy rate

Comparison 3: Dopamine agonist versus other active interventions, Outcome 5: Miscarriage rate

Figuras y tablas -
Analysis 3.5

Comparison 3: Dopamine agonist versus other active interventions, Outcome 5: Miscarriage rate

Comparison 3: Dopamine agonist versus other active interventions, Outcome 6: Any other adverse events

Figuras y tablas -
Analysis 3.6

Comparison 3: Dopamine agonist versus other active interventions, Outcome 6: Any other adverse events

Summary of findings 1. Dopamine agonist versus placebo/no intervention

Dopamine agonist vs placebo/no intervention

Patient or population: women of reproductive age undergoing any ART therapy

Settings: ART unit

Intervention: dopamine agonist

Comparison: placebo/no intervention

Outcomes

Anticipated absolute effects* (95% CI)

Relative effect
(95% CI)

No of participants
(studies)

Quality of the evidence
(GRADE)

Comments

Risk with placebo/no intervention

Risk with dopamine agonist

Incidence of moderate or severe OHSS

268 per 1000

105 per 1000
(78 to 139)

OR 0.32
(0.23 to 0.44)

1202
(10 RCTs)

⊕⊕⊕⊝
Moderatea

Live birth rate

324 per 1000

315 per 1000
(223 to 426)

OR 0.96
(0.60 to 1.55)

362
(3 RCTs)

⊕⊕⊝⊝
Lowa,b

Clinical pregnancy rate

307 per 1000

289 per 1000
(218 to 377)

OR 0.92
(0.63 to 1.37)

530
(5 RCTs)

⊕⊕⊝⊝
Lowa,b

Multiple pregnancy rate

50 per 1000

17 per 1000

(1 to 303)

OR 0.32

(0.01 to 8.26)

40
(1 RCT)

⊕⊝⊝⊝
Verylowa,b,c

Miscarriage rate

72 per 1000

49 per 1000

(15 to 151)

OR 0.66

(0.19 to 2.28)

168

(2 RCTs)

⊕⊕⊝⊝
Lowa,b

Any other adverse events

43 per 1000

168 per 1000

(62 to 381)

OR 4.54

(1.49 to 13.84)

264
(2 RCTs)

⊕⊝⊝⊝
Verylowa,b,d

*The risk in the intervention group (and its 95% confidence interval) is based on the assumed risk in the comparison group and the relative effect of the intervention (and its 95% CI).

ART: assisted reproductive technology; CI: confidence interval; OHSS: ovarian hyperstimulation syndrome; OR: odds ratio; RCT: randomised controlled trial.

GRADE Working Group grades of evidence
High quality: we are very confident that the true effect lies close to that of the estimate of the effect.
Moderate quality: we are moderately confident in the effect estimate: the true effect is likely to be close to the estimate of the effect, but there is a possibility that it is substantially different.
Low quality: our confidence in the effect estimate is limited: the true effect may be substantially different from the estimate of the effect.
Very low quality: we have very little confidence in the effect estimate: the true effect is likely to be substantially different from the estimate of effect.

aDowngraded one level for risk of bias associated with poor reporting of study methods.
bDowngraded one level for serious imprecision; total number of events fewer than 400.
cDowngraded one level for serious indirectness; single small study.
dDowngraded one level for imprecision; wide confidence intervals.

Figuras y tablas -
Summary of findings 1. Dopamine agonist versus placebo/no intervention
Summary of findings 2. Dopamine agonist plus co‐intervention versus co‐intervention

Dopamine agonist plus co‐intervention vs co‐intervention

Patient or population: women of reproductive age undergoing any ART therapy

Settings: ART unit

Intervention: dopamine agonist plus co‐intervention

Comparison: co‐intervention

Outcomes

Anticipated absolute effects* (95% CI)

Relative effect
(95% CI)

No of participants
(studies)

Quality of the evidence
(GRADE)

Comments

Risk with co‐intervention only

Risk with dopamine agonist plus co‐intervention

Incidence of moderate or severe OHSS

109 per 1000

55 per 1000

(33 to 93)

OR 0.48

(0.28 to 0.84)

748

(4 RCTs)

⊕⊕⊝⊝
Lowa,b

Live birth rate

380 per 1000

426 per 1000

(332 to 525)

OR 1.21

(0.81 to 1.80)

400

(2 studies)
 

⊕⊕⊝⊝
Lowa,b

Clinical pregnancy rate

443 per 1000

469 per 1000

(398 to 542)

OR 1.11

(0.83 to 1.49)

748

(4 studies)

⊕⊕⊝⊝
Lowa,b

Multiple pregnancy rate

12 per 1000

24 per 1000

(2 to 217)

OR 2.02

(0.18 to 22.77)

166

(1 study)

⊕⊝⊝⊝
Verylowa,b,c

Miscarriage rate

61 per 1000

41 per 1000

(19 to 85)

OR 0.65

(0.30 to 1.42)

548

(3 studies)

⊕⊕⊝⊝
Lowa,b
 

Any other adverse events

0 per 1000

0 per 1000

(0 to 0)

OR 3.03

(0.12 to 75.28)

366

(2 studies)

⊕⊝⊝⊝
Verylowa,b,d

*The risk in the intervention group (and its 95% confidence interval) is based on the assumed risk in the comparison group and the relative effect of the intervention (and its 95% CI).

ART: assisted reproductive technology; CI: confidence interval; OHSS: ovarian hyperstimulation syndrome; OR: odds ratio; RCT: randomised controlled trial.

GRADE Working Group grades of evidence
High quality: we are very confident that the true effect lies close to that of the estimate of the effect.
Moderate quality: we are moderately confident in the effect estimate: the true effect is likely to be close to the estimate of the effect, but there is a possibility that it is substantially different.
Low quality: our confidence in the effect estimate is limited: the true effect may be substantially different from the estimate of the effect.
Very low quality: we have very little confidence in the effect estimate: the true effect is likely to be substantially different from the estimate of effect.

aDowngraded one level for serious risk of bias associated with poor reporting of study methods.
bDowngraded one level for serious imprecision; total number of events fewer than 400.
cDowngraded one level for serious indirectness; single small study.
dDowngraded two levels for serious imprecision: wide confidence intervals.

Figuras y tablas -
Summary of findings 2. Dopamine agonist plus co‐intervention versus co‐intervention
Summary of findings 3. Dopamine agonist versus other active intervention

Dopamine agonist vs other active intervention

Patient or population: women of reproductive age undergoing any ART therapy

Settings: ART unit

Intervention: dopamine agonist

Comparison: other active intervention

Outcomes

Anticipated absolute effects* (95% CI)

Relative effect
(95% CI)

No of participants
(studies)

Quality of the evidence
(GRADE)

Comments

Risk with other active intervention

Risk with dopamine agonist

Incidence of moderate or severe OHSS

Cabergoline vs human albumin

432 per 1000

138 per 1000

(84 to 225)

OR 0.21

(0.12 to 0.38)

296
(3 RCTs)

⊕⊝⊝⊝
Verylowa,b,c

Cabergoline vs prednisolone

93 per 1000

27 per 1000

(5 to 120)

OR 0.27

(0.05 to 1.33)

150
(1 RCT)

⊕⊝⊝⊝
Verylowa,b,d

Cabergoline vs hydroxyethyl starch

67 per 1000

161 per 1000

(33 to 519)

OR 2.69

(0.48 to 15.10)

61
(1 RCT)

⊕⊝⊝⊝
Verylowa,b,d

Cabergoline vs coasting

125 per 1000

57 per 1000

(25 to 119)

OR 0.42

(0.18 to 0.95)

320
(3 RCTs)

⊕⊝⊝⊝
Verylowa,b,c

Cabergoline vs calcium infusion

60 per 1000

105 per 1000

(53 to 196)

OR 1.83

(0.88 to 3.81)

400
(2 RCTs)

⊕⊝⊝⊝
Very lowa,b,c

Cabergoline vs diosmin

120 per 1000

280 per 1000

(155 to 450)

OR 2.85

(1.35 to 6.00)

200
(1 RCT)

⊕⊝⊝⊝
Verylowa,b,d

Live birth rate

Cabergoline vs coasting or calcium infusion

395 per 1000

414 per 1000

(323 to 510)

OR 1.08

(0.73 to 1.59)

430
(2 RCTs)

⊕⊕⊝⊝
Lowa,b

Clinical pregnancy rate

Cabergoline vs human albumin, coasting, calcium infusion, or diosmin

432 per 1000

442 per 1000

(381 to 503)

OR 1.04

(0.81 to 1.33)

1060
(7 RCTs)

⊕⊕⊕⊝
Moderatea

Multiple pregnancy rate

Cabergoline vs human albumin, coasting, or diosmin

130 per 1000

115 per 1000

(66 to 192)

OR 0.87

(0.47 to 1.59)

400
(3 RCTs)

⊕⊕⊝⊝
Lowa,b

Miscarriage rate

Cabergoline vs human albumin, coasting, calcium infusion, or diosmin

79 per 1000

54 per 1000

(29 to 97)

OR 0.66

(0.35 to 1.25)

630
(4 RCTs)

⊕⊕⊝⊝
Lowa,b

Any other adverse events

Cabergoline vs calcium infusion

0 per 1000

0 per 1000

(0 to 0)

Not estimable

170

(1 RCT)

Not estimable

*The risk in the intervention group (and its 95% confidence interval) is based on the assumed risk in the comparison group and the relative effect of the intervention (and its 95% CI).

ART: assisted reproductive technology; CI: confidence interval; OHSS: ovarian hyperstimulation syndrome; OR: odds ratio; RCT: randomised controlled trial.

GRADE Working Group grades of evidence
High quality: we are very confident that the true effect lies close to that of the estimate of the effect.
Moderate quality: we are moderately confident in the effect estimate: the true effect is likely to be close to the estimate of the effect, but there is a possibility that it is substantially different.
Low quality: our confidence in the effect estimate is limited: the true effect may be substantially different from the estimate of the effect.
Very low quality: we have very little confidence in the effect estimate: the true effect is likely to be substantially different from the estimate of effect.

aDowngraded one level for risk of bias associated with poor reporting of study methods.
bDowngraded one level for serious imprecision; total number of events fewer than 400.
cDowngraded one level for serious inconsistency; I² greater than 50.
dDowngraded one level for serious indirectness; single small study.

Figuras y tablas -
Summary of findings 3. Dopamine agonist versus other active intervention
Comparison 1. Dopamine agonist versus placebo/no intervention

Outcome or subgroup title

No. of studies

No. of participants

Statistical method

Effect size

1.1 Incidence of moderate or severe ovarian hyperstimulation syndrome (OHSS) Show forest plot

10

1202

Odds Ratio (M‐H, Fixed, 95% CI)

0.32 [0.23, 0.44]

1.1.1 Cabergoline vs placebo/no treatment

7

701

Odds Ratio (M‐H, Fixed, 95% CI)

0.34 [0.23, 0.51]

1.1.2 Quinagolide vs placebo

2

454

Odds Ratio (M‐H, Fixed, 95% CI)

0.28 [0.15, 0.51]

1.1.3 Bromocriptine vs placebo (folic acid)

1

47

Odds Ratio (M‐H, Fixed, 95% CI)

0.29 [0.08, 1.14]

1.2 Subgroup analysis by severity of OHSS Show forest plot

9

Odds Ratio (M‐H, Fixed, 95% CI)

Subtotals only

1.2.1 Severe OHSS

9

930

Odds Ratio (M‐H, Fixed, 95% CI)

0.27 [0.14, 0.51]

1.2.2 Moderate OHSS

9

930

Odds Ratio (M‐H, Fixed, 95% CI)

0.46 [0.31, 0.68]

1.3 Live birth rate Show forest plot

3

362

Odds Ratio (M‐H, Fixed, 95% CI)

0.96 [0.60, 1.55]

1.3.1 Cabergoline vs placebo/no treatment

2

180

Odds Ratio (M‐H, Fixed, 95% CI)

0.91 [0.44, 1.87]

1.3.2 Quinagolide vs placebo/no treatment

1

182

Odds Ratio (M‐H, Fixed, 95% CI)

1.01 [0.53, 1.91]

1.4 Clinical pregnancy rate Show forest plot

5

530

Odds Ratio (M‐H, Fixed, 95% CI)

0.92 [0.63, 1.37]

1.4.1 Cabergoline vs placebo/no intervention

4

348

Odds Ratio (M‐H, Fixed, 95% CI)

1.00 [0.61, 1.64]

1.4.2 Quinagolide vs placebo/no treatment

1

182

Odds Ratio (M‐H, Fixed, 95% CI)

0.81 [0.43, 1.54]

1.5 Multiple pregnancy rate Show forest plot

1

40

Odds Ratio (M‐H, Fixed, 95% CI)

0.32 [0.01, 8.26]

1.5.1 Cabergoline vs placebo/no treatment

1

40

Odds Ratio (M‐H, Fixed, 95% CI)

0.32 [0.01, 8.26]

1.6 Miscarriage rate Show forest plot

2

Odds Ratio (M‐H, Fixed, 95% CI)

Subtotals only

1.6.1 Cabergoline vs placebo/no treatment

2

168

Odds Ratio (M‐H, Fixed, 95% CI)

0.66 [0.19, 2.28]

1.7 Any other adverse events Show forest plot

2

264

Odds Ratio (M‐H, Fixed, 95% CI)

4.54 [1.49, 13.84]

1.7.1 Cabergoline vs placebo/no treatment

1

82

Odds Ratio (M‐H, Fixed, 95% CI)

2.24 [0.62, 8.14]

1.7.2 Quinagolide vs placebo

1

182

Odds Ratio (M‐H, Fixed, 95% CI)

16.64 [0.98, 282.02]

Figuras y tablas -
Comparison 1. Dopamine agonist versus placebo/no intervention
Comparison 2. Dopamine agonist plus co‐intervention (DA+co‐int) versus co‐intervention (co‐int)

Outcome or subgroup title

No. of studies

No. of participants

Statistical method

Effect size

2.1 Incidence of moderate or severe ovarian hyperstimulation syndrome (OHSS) Show forest plot

4

748

Odds Ratio (M‐H, Fixed, 95% CI)

0.48 [0.28, 0.84]

2.1.1 Cabergoline + albumin vs albumin

1

166

Odds Ratio (M‐H, Fixed, 95% CI)

0.55 [0.23, 1.34]

2.1.2 Cabergoline + hydroxyethyl starch (HES) vs HES

2

382

Odds Ratio (M‐H, Fixed, 95% CI)

0.58 [0.26, 1.30]

2.1.3 Cabergoline + coasting vs coasting

1

200

Odds Ratio (M‐H, Fixed, 95% CI)

0.21 [0.04, 0.98]

2.2 Live birth rate Show forest plot

2

400

Odds Ratio (M‐H, Fixed, 95% CI)

1.21 [0.81, 1.80]

2.2.1 Cabergoline + HES vs HES

1

200

Odds Ratio (M‐H, Fixed, 95% CI)

1.04 [0.59, 1.86]

2.2.2 Cabergoline + coasting vs coasting

1

200

Odds Ratio (M‐H, Fixed, 95% CI)

1.38 [0.79, 2.42]

2.3 Clinical pregnancy rate Show forest plot

4

748

Odds Ratio (M‐H, Fixed, 95% CI)

1.11 [0.83, 1.49]

2.3.1 Cabergoline + albumin vs albumin

1

166

Odds Ratio (M‐H, Fixed, 95% CI)

1.05 [0.56, 1.96]

2.3.2 Cabergoline + HES vs HES

2

382

Odds Ratio (M‐H, Fixed, 95% CI)

0.98 [0.65, 1.47]

2.3.3 Cabergoline + coasting vs coasting

1

200

Odds Ratio (M‐H, Fixed, 95% CI)

1.49 [0.86, 2.61]

2.4 Multiple pregnancy rate Show forest plot

1

166

Odds Ratio (M‐H, Fixed, 95% CI)

2.02 [0.18, 22.77]

2.4.1 Cabergoline + albumin vs albumin

1

166

Odds Ratio (M‐H, Fixed, 95% CI)

2.02 [0.18, 22.77]

2.5 Miscarriage rate Show forest plot

3

548

Odds Ratio (M‐H, Fixed, 95% CI)

0.65 [0.30, 1.42]

2.5.1 Cabergoline + albumin vs albumin

1

166

Odds Ratio (M‐H, Fixed, 95% CI)

0.33 [0.03, 3.19]

2.5.2 Cabergoline + HES vs HES

2

382

Odds Ratio (M‐H, Fixed, 95% CI)

0.73 [0.31, 1.68]

2.6 Any other adverse events Show forest plot

2

366

Odds Ratio (M‐H, Fixed, 95% CI)

3.03 [0.12, 75.28]

2.6.1 Cabergoline + albumin vs albumin

1

166

Odds Ratio (M‐H, Fixed, 95% CI)

Not estimable

2.6.2 Cabergoline + HES vs HES

1

200

Odds Ratio (M‐H, Fixed, 95% CI)

3.03 [0.12, 75.28]

Figuras y tablas -
Comparison 2. Dopamine agonist plus co‐intervention (DA+co‐int) versus co‐intervention (co‐int)
Comparison 3. Dopamine agonist versus other active interventions

Outcome or subgroup title

No. of studies

No. of participants

Statistical method

Effect size

3.1 Incidence of moderate or severe ovarian hyperstimulation syndrome (OHSS) Show forest plot

10

Odds Ratio (M‐H, Fixed, 95% CI)

Subtotals only

3.1.1 Cabergoline vs human albumin

3

296

Odds Ratio (M‐H, Fixed, 95% CI)

0.21 [0.12, 0.38]

3.1.2 Cabergoline vs prednisolone

1

150

Odds Ratio (M‐H, Fixed, 95% CI)

0.27 [0.05, 1.33]

3.1.3 Cabergoline vs hydroxyethyl starch (HES)

1

61

Odds Ratio (M‐H, Fixed, 95% CI)

2.69 [0.48, 15.10]

3.1.4 Cabergoline vs coasting

3

320

Odds Ratio (M‐H, Fixed, 95% CI)

0.42 [0.18, 0.95]

3.1.5 Cabergoline vs calcium infusion

2

400

Odds Ratio (M‐H, Fixed, 95% CI)

1.83 [0.88, 3.81]

3.1.6 Cabergoline vs diosmin

1

200

Odds Ratio (M‐H, Fixed, 95% CI)

2.85 [1.35, 6.00]

3.2 Live birth rate Show forest plot

2

430

Odds Ratio (M‐H, Fixed, 95% CI)

1.08 [0.73, 1.59]

3.2.1 Cabergoline vs coasting

1

200

Odds Ratio (M‐H, Fixed, 95% CI)

1.04 [0.59, 1.83]

3.2.2 Cabergoline vs calcium infusion

1

230

Odds Ratio (M‐H, Fixed, 95% CI)

1.11 [0.66, 1.89]

3.3 Clinical pregnancy rate Show forest plot

7

1060

Odds Ratio (M‐H, Fixed, 95% CI)

1.04 [0.81, 1.33]

3.3.1 Cabergoline vs human albumin

1

140

Odds Ratio (M‐H, Fixed, 95% CI)

0.68 [0.33, 1.38]

3.3.2 Cabergoline vs coasting

3

320

Odds Ratio (M‐H, Fixed, 95% CI)

1.46 [0.92, 2.32]

3.3.3 Cabergoline vs calcium infusion

2

400

Odds Ratio (M‐H, Fixed, 95% CI)

1.00 [0.67, 1.49]

3.3.4 Cabergoline vs diosmin

1

200

Odds Ratio (M‐H, Fixed, 95% CI)

0.89 [0.51, 1.55]

3.4 Multiple pregnancy rate Show forest plot

3

400

Odds Ratio (M‐H, Fixed, 95% CI)

0.87 [0.47, 1.59]

3.4.1 Cabergoline vs human albumin

1

140

Odds Ratio (M‐H, Fixed, 95% CI)

0.58 [0.13, 2.54]

3.4.2 Cabergoline vs coasting

1

60

Odds Ratio (M‐H, Fixed, 95% CI)

5.35 [0.25, 116.31]

3.4.3 Cabergoline vs diosmin

1

200

Odds Ratio (M‐H, Fixed, 95% CI)

0.83 [0.41, 1.67]

3.5 Miscarriage rate Show forest plot

4

630

Odds Ratio (M‐H, Fixed, 95% CI)

0.66 [0.35, 1.25]

3.5.1 Cabergoline vs human albumin

1

140

Odds Ratio (M‐H, Fixed, 95% CI)

0.32 [0.03, 3.19]

3.5.2 Cabergoline vs coasting

1

60

Odds Ratio (M‐H, Fixed, 95% CI)

0.19 [0.01, 4.06]

3.5.3 Cabergoline vs calcium infusion

1

230

Odds Ratio (M‐H, Fixed, 95% CI)

0.63 [0.27, 1.48]

3.5.4 Cabergoline vs diosmin

1

200

Odds Ratio (M‐H, Fixed, 95% CI)

1.21 [0.36, 4.11]

3.6 Any other adverse events Show forest plot

1

Odds Ratio (M‐H, Fixed, 95% CI)

Subtotals only

3.6.1 Cabergoline vs calcium infusion

1

170

Odds Ratio (M‐H, Fixed, 95% CI)

Not estimable

Figuras y tablas -
Comparison 3. Dopamine agonist versus other active interventions