Agonistas dopaminérgicos para la prevención del síndrome de hiperestimulación ovárica
Información
- DOI:
- https://doi.org/10.1002/14651858.CD008605.pub3Copiar DOI

- Base de datos:
-
- Cochrane Database of Systematic Reviews
- Versión publicada:
-
- 30 noviembre 2016see what's new
- Tipo:
-
- Intervention
- Etapa:
-
- Review
- Grupo Editorial Cochrane:
-
Grupo Cochrane de Ginecología y fertilidad
- Copyright:
-
- Copyright © 2016 The Cochrane Collaboration. Published by John Wiley & Sons, Ltd.
Cifras del artículo
Altmetric:
Citado por:
Autores
Contributions of authors
HT: proposed the original title, drafted the protocol and review, selected studies, extracted data, assessed studies, analysed and interpreted data, and updated the review.
SM: proposed the 2016 title change and update, drafted the updated review, selected studies, extracted data, assessed studies, and analysed and interpreted data.
SZ: co‐drafted the protocol and review.
RH: assisted in drafting the protocol and original review, and drafting of the updated review.
Sources of support
Internal sources
-
Peking University Third Hospital, China.
Peking University Third Hospital
-
King Edward Memorial Hospital, Australia, Australia.
King Edward Memorial Hospital
-
The University of Western Australia, King Edward Memorial Hospital and Fertility Specialists of Western Australia, Australia.
The University of Western Australia, King Edward Memorial Hospital and Fertility Specialists of Western Australia
External sources
-
No sources of support supplied
Declarations of interest
RH is part owner and shareholder of an in vitro fertilisation (IVF) company; he has received travel grants and honoraria from pharmaceutical manufacturers of gonadotrophins and is on the medical advisory board of pharmaceutical companies that manufacture gonadotrophins.
Acknowledgements
We acknowledge the Cochrane Gynaecology and Fertility Group (formerly MDSG), especially the Information Specialist, Marian Showell, and Managing Editors, Helen Nagels and Editor Jane Marjoribanks. Thanks to Dr Amr Salah, Dr Farnaz Sohrabvand, Dr Wellington Martins, Dr Irina Fetisova and Dr Rutvij Dalal for providing more detailed information on several trials.
The authors of the 2016 update thank Dr Tamara Hunter, Dr Yongfang Hu and Dr Xiaoyan Sheng for their contributions to previous versions of this review.
Version history
| Published | Title | Stage | Authors | Version |
| 2021 Apr 14 | Dopamine agonists for preventing ovarian hyperstimulation syndrome | Review | Huilin Tang, Selma M. Mourad, Aihua Wang, Suo-Di Zhai, Roger J Hart | |
| 2016 Nov 30 | Dopamine agonists for preventing ovarian hyperstimulation syndrome | Review | Huilin Tang, Selma Mourad, Suo‐Di Zhai, Roger J Hart | |
| 2012 Feb 15 | Cabergoline for preventing ovarian hyperstimulation syndrome | Review | Huilin Tang, Tamara Hunter, Yongfang Hu, Suo‐Di Zhai, Xiaoyan Sheng, Roger J Hart | |
| 2010 Jul 07 | Cabergoline for preventing ovarian hyperstimulation syndrome | Protocol | Huilin Tang, Tamara Hunter, Yongfang Hu, Suo‐Di Zhai, Xiaoyan Sheng, Roger J Hart | |
Differences between protocol and review
2016 update: we amended the protocol to broaden the scope of the review from "cabergoline" to "dopamine agonists" as the studied intervention. We changed the search strategies, inclusion criteria and title of the review accordingly.
Methods: changed Review authors for selection of studies or data extraction and management.
Subgroups: added subgroups by type of dopamine agonist.
Sensitivity analysis: added sensitivity analyses by excluding trials with high risk of bias and by using a random‐effects model.
Subgroup analysis on route of administration of drugs could not be performed as all dopamine agonists were administered orally.
Subgroup analysis on number of embryos transferred could not be performed as the RCTs did not provide these data.
Subgroup analyses on duration of treatment were not performed due to varied duration among the trials, which might result in only one included trial.
Keywords
MeSH
Medical Subject Headings (MeSH) Keywords
- Abortion, Spontaneous [prevention & control];
- Administration, Oral;
- Aminoquinolines [therapeutic use];
- Bromocriptine [therapeutic use];
- Cabergoline [therapeutic use];
- Dopamine Agonists [administration & dosage, *therapeutic use];
- Ergolines [therapeutic use];
- *Fertilization in Vitro;
- Live Birth [epidemiology];
- Ovarian Hyperstimulation Syndrome [epidemiology, *prevention & control];
- Placebos [therapeutic use];
- Pregnancy Rate;
- Randomized Controlled Trials as Topic;
- Sperm Injections, Intracytoplasmic;
Medical Subject Headings Check Words
Female; Humans; Pregnancy;
PICO

Study flow diagram search August 2016.

Risk of bias graph: review authors' judgements about each risk of bias item presented as percentages across all included studies.

Risk of bias summary: review authors' judgements about each risk of bias item for each included study.

Forest plot of comparison 1: Dopamine agonist (without co‐intervention) versus placebo/no intervention, outcome: 1.1 moderate or severe ovarian hyperstimulation syndrome.
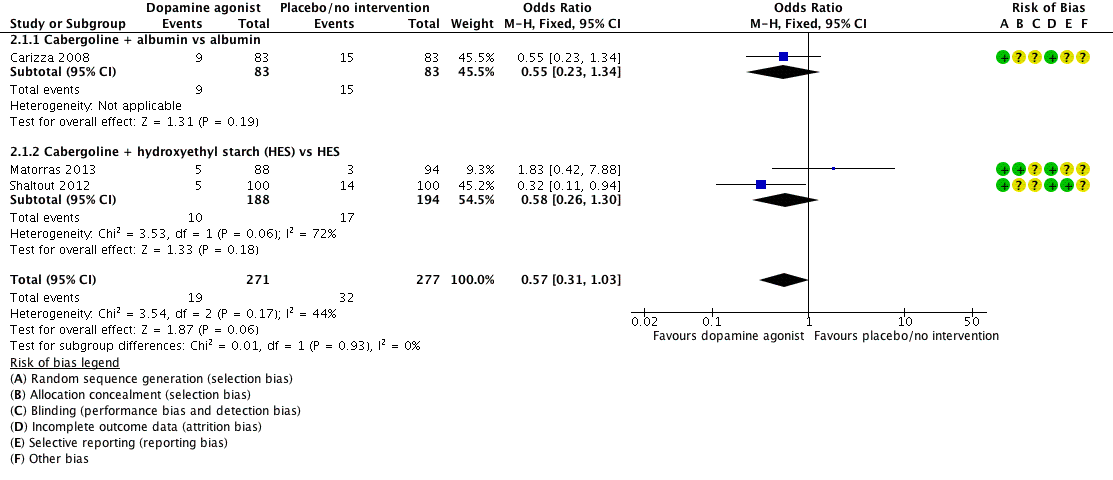
Forest plot of comparison: 2 Dopamine agonist plus co‐intervention versus co‐intervention, outcome: 2.1 Moderate or severe ovarian hyperstimulation syndrome.
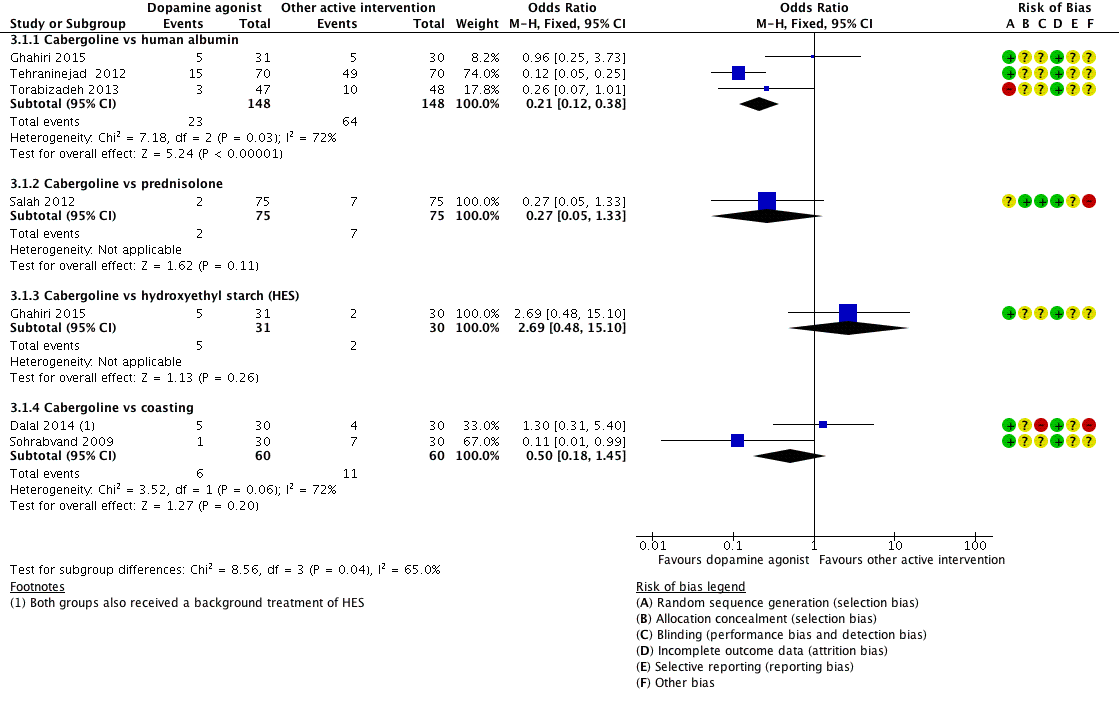
Forest plot of comparison 3: Cabergoline versus active interventions, outcome: 3.1 moderate or severe ovarian hyperstimulation syndrome.

Comparison 1 Dopamine agonist versus placebo/no intervention, Outcome 1 Moderate or severe ovarian hyperstimulation syndrome (OHSS).

Comparison 1 Dopamine agonist versus placebo/no intervention, Outcome 2 Subgroup analysis by severity of OHSS.

Comparison 1 Dopamine agonist versus placebo/no intervention, Outcome 3 Live birth.

Comparison 1 Dopamine agonist versus placebo/no intervention, Outcome 4 Clinical pregnancy rate.

Comparison 1 Dopamine agonist versus placebo/no intervention, Outcome 5 Multiple pregnancy.

Comparison 1 Dopamine agonist versus placebo/no intervention, Outcome 6 Miscarriage.
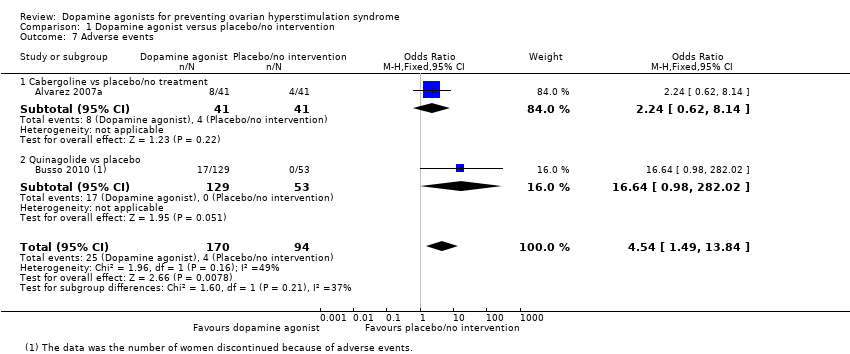
Comparison 1 Dopamine agonist versus placebo/no intervention, Outcome 7 Adverse events.
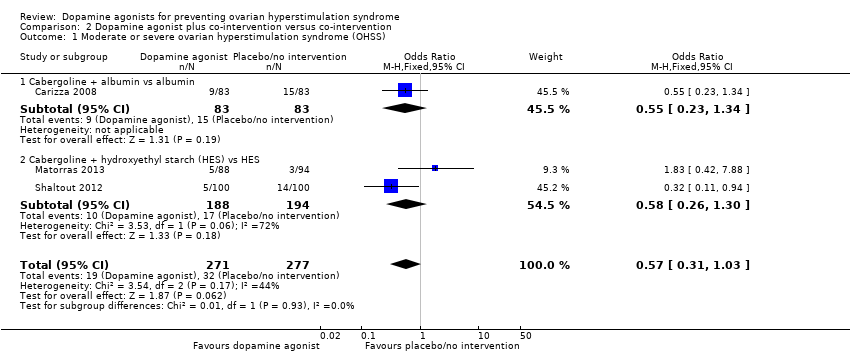
Comparison 2 Dopamine agonist plus co‐intervention versus co‐intervention, Outcome 1 Moderate or severe ovarian hyperstimulation syndrome (OHSS).
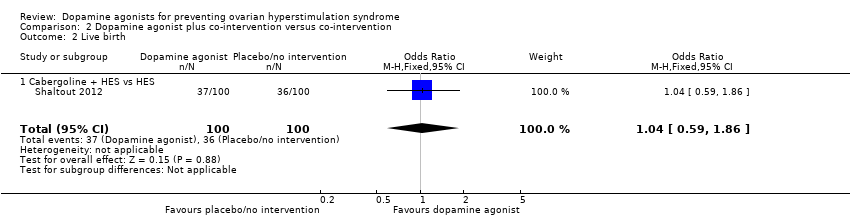
Comparison 2 Dopamine agonist plus co‐intervention versus co‐intervention, Outcome 2 Live birth.

Comparison 2 Dopamine agonist plus co‐intervention versus co‐intervention, Outcome 3 Clinical pregnancy rate.
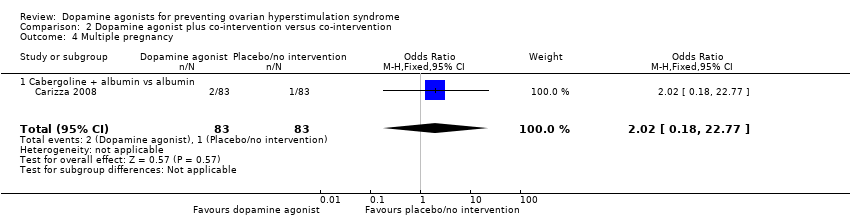
Comparison 2 Dopamine agonist plus co‐intervention versus co‐intervention, Outcome 4 Multiple pregnancy.
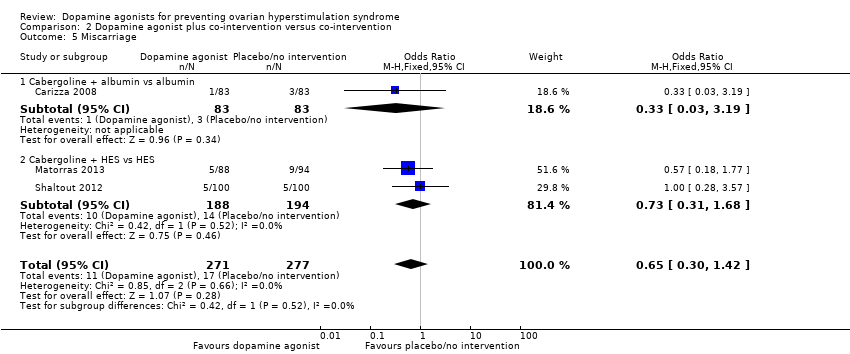
Comparison 2 Dopamine agonist plus co‐intervention versus co‐intervention, Outcome 5 Miscarriage.

Comparison 2 Dopamine agonist plus co‐intervention versus co‐intervention, Outcome 6 Adverse events.

Comparison 3 Dopamine agonist versus active interventions, Outcome 1 Moderate or severe ovarian hyperstimulation syndrome (OHSS).
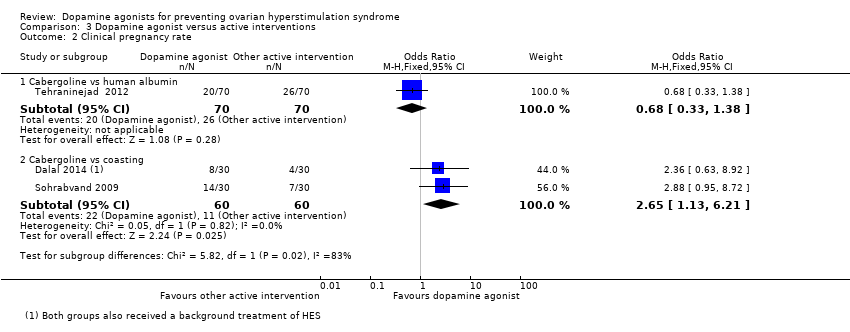
Comparison 3 Dopamine agonist versus active interventions, Outcome 2 Clinical pregnancy rate.
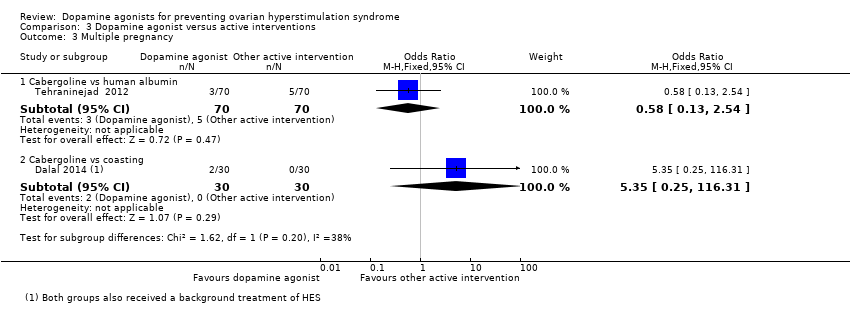
Comparison 3 Dopamine agonist versus active interventions, Outcome 3 Multiple pregnancy.

Comparison 3 Dopamine agonist versus active interventions, Outcome 4 Miscarriage.
| Dopamine agonist vs placebo/no intervention | ||||||
| Patient or population: women of reproductive age undergoing any ART therapy Settings: ART unit Intervention: dopamine agonist Comparison: placebo/no intervention | ||||||
| Outcomes | Anticipated absolute effects* (95% CI) | Relative effect | No of participants | Quality of the evidence | Comments | |
| Risk with placebo/no intervention | Risk with dopamine agonist | |||||
| Incidence of moderate or severe OHSS | 286 per 1000 | 97 per 1000 (71 to 135) | OR 0.27 (0.19 to 0.39) | 1022 (8 studies) | ⊕⊕⊕⊝ | ‐ |
| Live birth rate | 509 per 1000 | 512 per 1000 (355 to 665) | OR 1.01 (0.53 to 1.91) | 182 | ⊕⊕⊝⊝ | |
| Clinical pregnancy rate | 401 per 1000 | 352 per 1000 (266 to 450) | OR 0.81 (0.54 to 1.22) | 432 (4 studies) | ⊕⊕⊕⊝ | |
| Multiple pregnancy | 50 per 1000 | 17 per 1000 (1 to 303) | OR 0.32 (0.01 to 8.26) | 40 | ⊕⊝⊝⊝ | |
| Miscarriage pregnancy rate | 72 per 1000 | 49 per 1000 (15 to 151) | OR 0.66 (0.19 to 2.28) | 168 (2 studies) | ⊕⊕⊝⊝ | |
| Adverse events | 43 per 1000 | 168 per 1000 (62 to 381) | OR 4.54 (1.49 to 13.84) | 264 | ⊕⊝⊝⊝ | |
| *The risk in the intervention group (and its 95% confidence interval) is based on the assumed risk in the comparison group and the relative effect of the intervention (and its 95% CI). ART: assisted reproductive technology; CI: confidence interval; OHSS: ovarian hyperstimulation syndrome; OR: odds ratio. | ||||||
| GRADE Working Group grades of evidence | ||||||
| 1 Downgraded one level for serious risk of bias associated with poor reporting of study methods. 2 Downgraded one level for serious risk of imprecision: confidence interval compatible with benefit in either arm or with no difference between the groups. 3 Downgraded two levels for very serious risk of imprecision: only one event. 4 Downgraded one level for serious risk of imprecision: only 10 events. 5 Downgraded one level for serious risk of imprecision: only 29 events. | ||||||
| Outcome or subgroup title | No. of studies | No. of participants | Statistical method | Effect size |
| 1 Moderate or severe ovarian hyperstimulation syndrome (OHSS) Show forest plot | 8 | 1022 | Odds Ratio (M‐H, Fixed, 95% CI) | 0.27 [0.19, 0.39] |
| 1.1 Cabergoline vs placebo/no treatment | 5 | 521 | Odds Ratio (M‐H, Fixed, 95% CI) | 0.26 [0.16, 0.42] |
| 1.2 Quinagolide vs placebo | 2 | 454 | Odds Ratio (M‐H, Fixed, 95% CI) | 0.28 [0.15, 0.51] |
| 1.3 Bromocriptine vs placebo (folic acid) | 1 | 47 | Odds Ratio (M‐H, Fixed, 95% CI) | 0.29 [0.08, 1.14] |
| 2 Subgroup analysis by severity of OHSS Show forest plot | 7 | Odds Ratio (M‐H, Fixed, 95% CI) | Subtotals only | |
| 2.1 Severe OHSS | 7 | 750 | Odds Ratio (M‐H, Fixed, 95% CI) | 0.28 [0.14, 0.56] |
| 2.2 Moderate OHSS | 7 | 750 | Odds Ratio (M‐H, Fixed, 95% CI) | 0.37 [0.24, 0.57] |
| 3 Live birth Show forest plot | 1 | 182 | Odds Ratio (M‐H, Fixed, 95% CI) | 1.01 [0.53, 1.91] |
| 3.1 Quinagolide vs placebo | 1 | 182 | Odds Ratio (M‐H, Fixed, 95% CI) | 1.01 [0.53, 1.91] |
| 4 Clinical pregnancy rate Show forest plot | 4 | 432 | Odds Ratio (M‐H, Fixed, 95% CI) | 0.81 [0.54, 1.22] |
| 4.1 Cabergoline vs no intervention | 3 | 250 | Odds Ratio (M‐H, Fixed, 95% CI) | 0.81 [0.48, 1.38] |
| 4.2 Quinagolide vs placebo | 1 | 182 | Odds Ratio (M‐H, Fixed, 95% CI) | 0.81 [0.43, 1.54] |
| 5 Multiple pregnancy Show forest plot | 1 | 40 | Odds Ratio (M‐H, Fixed, 95% CI) | 0.32 [0.01, 8.26] |
| 5.1 Cabergoline vs placebo/no treatment | 1 | 40 | Odds Ratio (M‐H, Fixed, 95% CI) | 0.32 [0.01, 8.26] |
| 6 Miscarriage Show forest plot | 2 | Odds Ratio (M‐H, Fixed, 95% CI) | Subtotals only | |
| 6.1 Cabergoline vs placebo/no treatment | 2 | 168 | Odds Ratio (M‐H, Fixed, 95% CI) | 0.66 [0.19, 2.28] |
| 7 Adverse events Show forest plot | 2 | 264 | Odds Ratio (M‐H, Fixed, 95% CI) | 4.54 [1.49, 13.84] |
| 7.1 Cabergoline vs placebo/no treatment | 1 | 82 | Odds Ratio (M‐H, Fixed, 95% CI) | 2.24 [0.62, 8.14] |
| 7.2 Quinagolide vs placebo | 1 | 182 | Odds Ratio (M‐H, Fixed, 95% CI) | 16.64 [0.98, 282.02] |
| Outcome or subgroup title | No. of studies | No. of participants | Statistical method | Effect size |
| 1 Moderate or severe ovarian hyperstimulation syndrome (OHSS) Show forest plot | 3 | 548 | Odds Ratio (M‐H, Fixed, 95% CI) | 0.57 [0.31, 1.03] |
| 1.1 Cabergoline + albumin vs albumin | 1 | 166 | Odds Ratio (M‐H, Fixed, 95% CI) | 0.55 [0.23, 1.34] |
| 1.2 Cabergoline + hydroxyethyl starch (HES) vs HES | 2 | 382 | Odds Ratio (M‐H, Fixed, 95% CI) | 0.58 [0.26, 1.30] |
| 2 Live birth Show forest plot | 1 | 200 | Odds Ratio (M‐H, Fixed, 95% CI) | 1.04 [0.59, 1.86] |
| 2.1 Cabergoline + HES vs HES | 1 | 200 | Odds Ratio (M‐H, Fixed, 95% CI) | 1.04 [0.59, 1.86] |
| 3 Clinical pregnancy rate Show forest plot | 3 | 548 | Odds Ratio (M‐H, Fixed, 95% CI) | 1.0 [0.71, 1.40] |
| 3.1 Cabergoline + albumin vs albumin | 1 | 166 | Odds Ratio (M‐H, Fixed, 95% CI) | 1.05 [0.56, 1.96] |
| 3.2 Cabergoline + HES vs HES | 2 | 382 | Odds Ratio (M‐H, Fixed, 95% CI) | 0.98 [0.65, 1.47] |
| 4 Multiple pregnancy Show forest plot | 1 | 166 | Odds Ratio (M‐H, Fixed, 95% CI) | 2.02 [0.18, 22.77] |
| 4.1 Cabergoline + albumin vs albumin | 1 | 166 | Odds Ratio (M‐H, Fixed, 95% CI) | 2.02 [0.18, 22.77] |
| 5 Miscarriage Show forest plot | 3 | 548 | Odds Ratio (M‐H, Fixed, 95% CI) | 0.65 [0.30, 1.42] |
| 5.1 Cabergoline + albumin vs albumin | 1 | 166 | Odds Ratio (M‐H, Fixed, 95% CI) | 0.33 [0.03, 3.19] |
| 5.2 Cabergoline + HES vs HES | 2 | 382 | Odds Ratio (M‐H, Fixed, 95% CI) | 0.73 [0.31, 1.68] |
| 6 Adverse events Show forest plot | 2 | 366 | Odds Ratio (M‐H, Fixed, 95% CI) | 3.03 [0.12, 75.28] |
| 6.1 Cabergoline + albumin vs albumin | 1 | 166 | Odds Ratio (M‐H, Fixed, 95% CI) | 0.0 [0.0, 0.0] |
| 6.2 Cabergoline + HES vs HES | 1 | 200 | Odds Ratio (M‐H, Fixed, 95% CI) | 3.03 [0.12, 75.28] |
| Outcome or subgroup title | No. of studies | No. of participants | Statistical method | Effect size |
| 1 Moderate or severe ovarian hyperstimulation syndrome (OHSS) Show forest plot | 6 | Odds Ratio (M‐H, Fixed, 95% CI) | Subtotals only | |
| 1.1 Cabergoline vs human albumin | 3 | 296 | Odds Ratio (M‐H, Fixed, 95% CI) | 0.21 [0.12, 0.38] |
| 1.2 Cabergoline vs prednisolone | 1 | 150 | Odds Ratio (M‐H, Fixed, 95% CI) | 0.27 [0.05, 1.33] |
| 1.3 Cabergoline vs hydroxyethyl starch (HES) | 1 | 61 | Odds Ratio (M‐H, Fixed, 95% CI) | 2.69 [0.48, 15.10] |
| 1.4 Cabergoline vs coasting | 2 | 120 | Odds Ratio (M‐H, Fixed, 95% CI) | 0.50 [0.18, 1.45] |
| 2 Clinical pregnancy rate Show forest plot | 3 | Odds Ratio (M‐H, Fixed, 95% CI) | Subtotals only | |
| 2.1 Cabergoline vs human albumin | 1 | 140 | Odds Ratio (M‐H, Fixed, 95% CI) | 0.68 [0.33, 1.38] |
| 2.2 Cabergoline vs coasting | 2 | 120 | Odds Ratio (M‐H, Fixed, 95% CI) | 2.65 [1.13, 6.21] |
| 3 Multiple pregnancy Show forest plot | 2 | Odds Ratio (M‐H, Fixed, 95% CI) | Subtotals only | |
| 3.1 Cabergoline vs human albumin | 1 | 140 | Odds Ratio (M‐H, Fixed, 95% CI) | 0.58 [0.13, 2.54] |
| 3.2 Cabergoline vs coasting | 1 | 60 | Odds Ratio (M‐H, Fixed, 95% CI) | 5.35 [0.25, 116.31] |
| 4 Miscarriage Show forest plot | 2 | Odds Ratio (M‐H, Fixed, 95% CI) | Subtotals only | |
| 4.1 Cabergoline vs human albumin | 1 | 140 | Odds Ratio (M‐H, Fixed, 95% CI) | 0.32 [0.03, 3.19] |
| 4.2 Cabergoline vs coasting | 1 | 60 | Odds Ratio (M‐H, Fixed, 95% CI) | 0.19 [0.01, 4.06] |