Agonistas dopaminérgicos para la prevención del síndrome de hiperestimulación ovárica
Appendices
Appendix 1. Gynaecology and Fertility (formerly MDSG) search string
PROCITE Platform
From inception until 15 August 2016
Keywords CONTAINS "ovarian hyperstimulation syndrome " or "ovarian hyperstimulation" or "OHSS" or Title CONTAINS "ovarian hyperstimulation syndrome " or "ovarian hyperstimulation" or "OHSS"
AND
Keywords CONTAINS "cabergoline" or "Dopamine agonists" or "Dopamine" or "bromocriptine" or "quinagolide" or Title CONTAINS "cabergoline" or "Dopamine agonists" or "Dopamine" or "bromocriptine" or "quinagolide" (36 hits)
Appendix 2. CENTRAL search strategy
CRSO Web platform
from inception until 15 August 2016
#1 MESH DESCRIPTOR Ovarian Hyperstimulation Syndrome EXPLODE ALL TREES 163
#2 OHSS:TI,AB,KY 274
#3 (Ovar* adj2 Hyperstimulation):TI,AB,KY 902
#4 #1 OR #2 OR #3 968
#5 MESH DESCRIPTOR Ergolines EXPLODE ALL TREES 925
#6 Ergoline*:TI,AB,KY 237
#7 cabergoline:TI,AB,KY 171
#8 (Dostinex or Cabaser*):TI,AB,KY 4
#9 (Dopamine Agonist*):TI,AB,KY 937
#10 MESH DESCRIPTOR Dopamine Agonists EXPLODE ALL TREES 1449
#11 MESH DESCRIPTOR Bromocriptine EXPLODE ALL TREES 455
#12 Bromocriptine:TI,AB,KY 844
#13 quinagolide*:TI,AB,KY 17
#14 #5 OR #6 OR #7 OR #8 OR #9 OR #10 OR #11 OR #12 OR #13 2461
#15 #4 AND #14 38
Appendix 3. MEDLINE search strategy
OVID platform
From 1946 to 15 August 2016
1 exp Ovarian Hyperstimulation Syndrome/ (1962)
2 OHSS.tw. (1420)
3 (Ovar$ adj2 Hyperstimulation).tw. (4387)
4 or/1‐3 (4799)
5 exp Ergolines/ (20838)
6 cabergoline.tw. (1215)
7 Ergoline$.tw. (546)
8 (Dostinex or Cabaser$).tw. (13)
9 Dopamine Agonist$.tw. (6908)
10 exp Dopamine Agonists/ (27910)
11 exp Bromocriptine/ (6867)
12 Bromocriptine.tw. (6547)
13 quinagolide$.tw. (117)
14 or/5‐13 (43020)
15 4 and 14 (105)
16 randomized controlled trial.pt. (428367)
17 controlled clinical trial.pt. (91556)
18 randomized.ab. (366942)
19 placebo.tw. (182638)
20 clinical trials as topic.sh. (178949)
21 randomly.ab. (261578)
22 trial.ti. (160440)
23 (crossover or cross‐over or cross over).tw. (70771)
24 or/16‐23 (1085156)
25 (animals not (humans and animals)).sh. (4266646)
26 24 not 25 (999370)
27 26 and 15 (41)
Appendix 4. Embase search strategy
OVID platform
From 1974 to 15 August 2016
1 exp ovary hyperstimulation/ (7481)
2 (ovar$ adj2 hyperstimulation).tw. (6125)
3 OHSS.tw. (2299)
4 or/1‐3 (9268)
5 cabergoline.tw. (1762)
6 exp ergoline derivative/ (990)
7 ergoline$.tw. (638)
8 (Dostinex or Cabaser$).tw. (347)
9 exp dopamine receptor stimulating agent/ or exp cabergoline/ (172347)
10 (dopamine adj2 agent$).tw. (509)
11 (dopamine adj2 agonist$).tw. (12113)
12 quinagolide$.tw. (170)
13 exp bromocriptine/ (17941)
14 bromocriptine.tw. (7195)
15 or/5‐14 (174581)
16 Clinical Trial/ (862238)
17 Randomized Controlled Trial/ (413467)
18 exp randomization/ (71619)
19 Single Blind Procedure/ (22711)
20 Double Blind Procedure/ (130713)
21 Crossover Procedure/ (48263)
22 Placebo/ (279471)
23 Randomi?ed controlled trial$.tw. (141716)
24 Rct.tw. (21228)
25 random allocation.tw. (1552)
26 randomly allocated.tw. (25411)
27 allocated randomly.tw. (2146)
28 (allocated adj2 random).tw. (762)
29 Single blind$.tw. (17830)
30 Double blind$.tw. (164731)
31 ((treble or triple) adj blind$).tw. (580)
32 placebo$.tw. (237405)
33 prospective study/ (346790)
34 or/16‐33 (1604891)
35 case study/ (39627)
36 case report.tw. (312069)
37 abstract report/ or letter/ (969653)
38 or/35‐37 (1314128)
39 34 not 38 (1563365)
40 4 and 15 and 39 (97)
Appendix 5. PsycINFO search strategy
OVID platform
From 1806 to 15 August 2016
1 Ovarian Hyperstimulation Syndrome.tw. (4)
2 OHSS.tw. (6)
3 (Ovar$ adj2 Hyperstimulation).tw. (10)
4 or/1‐3 (14)
5 exp dopamine agonists/ (19735)
6 cabergoline.tw. (114)
7 Ergoline$.tw. (45)
8 (Dostinex or Cabaser$).tw. (2)
9 Dopamine Agonist$.tw. (2260)
10 Bromocriptine.tw. (660)
11 exp bromocriptine/ (292)
12 quinagolide$.tw. (5)
13 or/5‐12 (21063)
14 4 and 13 (0)
Appendix 6. CINAHL
EBSCO platform
From inception until 15 August 2016
| # | Query | Results |
| S14 | S4 AND S13 | 11 |
| S13 | S5 OR S6 OR S7 OR S8 OR S9 OR S10 OR S11 OR S12 | 1,805 |
| S12 | TX quinagolide* | 4 |
| S11 | TX Bromocriptine | 303 |
| S10 | (MM "Bromocriptine") | 97 |
| S9 | TX (Dostinex or Cabaser*) | 1 |
| S8 | TX cabergoline | 110 |
| S7 | TX Dopamine Agonist* | 1,487 |
| S6 | (MM "Dopamine Agonists+") | 822 |
| S5 | TX Ergoline* | 14 |
| S4 | S1 OR S2 OR S3 | 362 |
| S3 | TX (Ovar* N2 Hyperstimulation) | 352 |
| S2 | TX OHSS | 79 |
| S1 | (MM "Ovarian Hyperstimulation Syndrome") | 140 |
Appendix 7. ICTRP
Web platform
15 August 2016
OHSS AND dopamine OR cabergoline OR quinagolide OR bromocriptine (75 hits)
Appendix 8. Clinicaltrials.gov
Web platform
15 August 2016
OHSS AND dopamine OR cabergoline OR quinagolide OR bromocriptine (46 hits)
Appendix 9. PubMed
Web platform
15 August 2016
OHSS[Title/Abstract] AND (dopamine[Title/Abstract] OR cabergoline[Title/Abstract] OR quinagolide[Title/Abstract]) AND Clinical Trial[ptyp] (12 hits)
Appendix 10. Data extraction form
| General trial characteristics |
| First author Publish year Citation: Contact author detail: |
| Eligibility |
| 1. Is the study an RCT? 2. High‐risk Women? 3. How OHSS defined? 4. Administration of cabergoline? Decision: If all replies yes means include, otherwise exclude |
| Characteristics of the included studies |
| Risk of bias |
|
|
| Methods |
| Inclusion criteria: Exclusion criteria: |
| Participants |
| Total number: Diagnosis criteria: Age (mean ± SD): treat group vs control group: BMI (mean ± SD): treat group vs control group: Duration of infertility: Causes of infertility:
|
| Interventions |
| Treat group:(dose, administration of drug, duration of treatment) Control group (placebo or no intervention): |
| Outcomes |
|
|
| Results |
|
For each outcome of interest:
|
| Miscellaneous |
|
BMI: body mass index; OHSS: ovarian hyperstimulation syndrome; RCT: randomised controlled trial; SD: standard deviation. |

Study flow diagram search August 2016.

Risk of bias graph: review authors' judgements about each risk of bias item presented as percentages across all included studies.

Risk of bias summary: review authors' judgements about each risk of bias item for each included study.

Forest plot of comparison 1: Dopamine agonist (without co‐intervention) versus placebo/no intervention, outcome: 1.1 moderate or severe ovarian hyperstimulation syndrome.
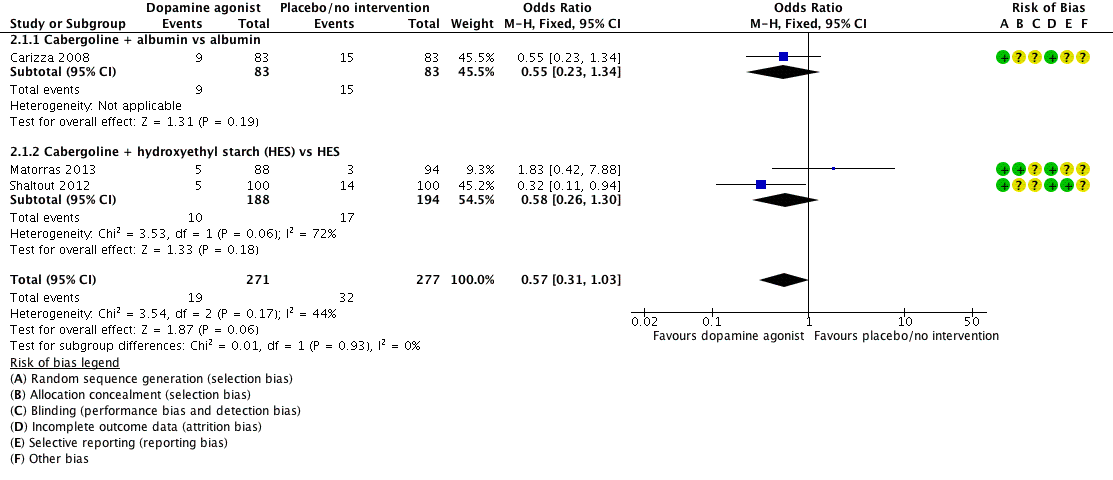
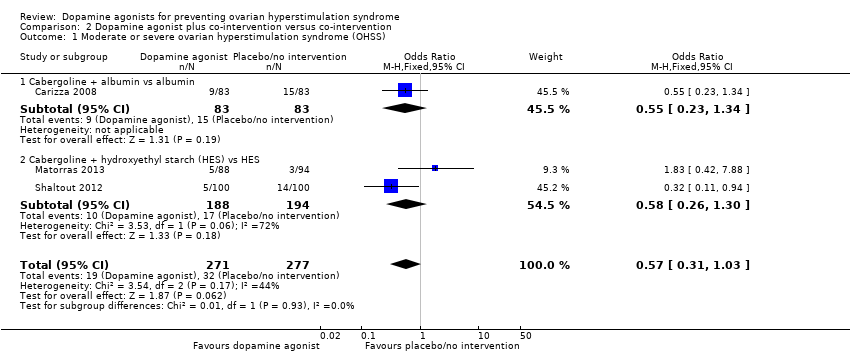
Forest plot of comparison: 2 Dopamine agonist plus co‐intervention versus co‐intervention, outcome: 2.1 Moderate or severe ovarian hyperstimulation syndrome.
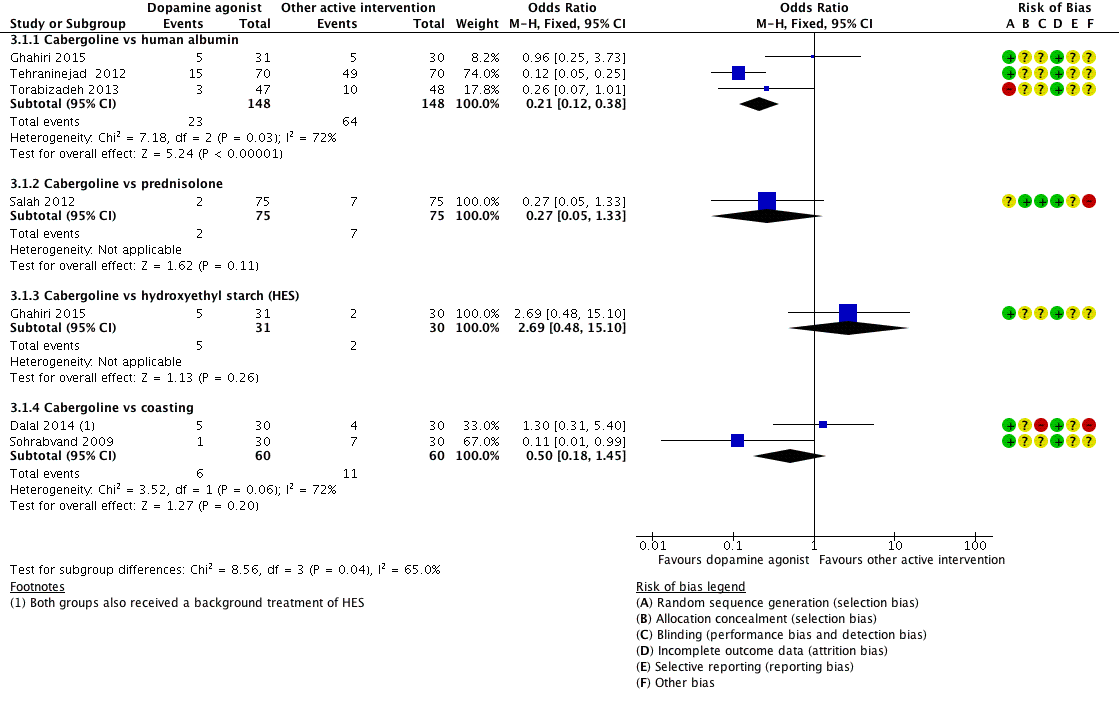
Forest plot of comparison 3: Cabergoline versus active interventions, outcome: 3.1 moderate or severe ovarian hyperstimulation syndrome.

Comparison 1 Dopamine agonist versus placebo/no intervention, Outcome 1 Moderate or severe ovarian hyperstimulation syndrome (OHSS).

Comparison 1 Dopamine agonist versus placebo/no intervention, Outcome 2 Subgroup analysis by severity of OHSS.

Comparison 1 Dopamine agonist versus placebo/no intervention, Outcome 3 Live birth.

Comparison 1 Dopamine agonist versus placebo/no intervention, Outcome 4 Clinical pregnancy rate.

Comparison 1 Dopamine agonist versus placebo/no intervention, Outcome 5 Multiple pregnancy.

Comparison 1 Dopamine agonist versus placebo/no intervention, Outcome 6 Miscarriage.
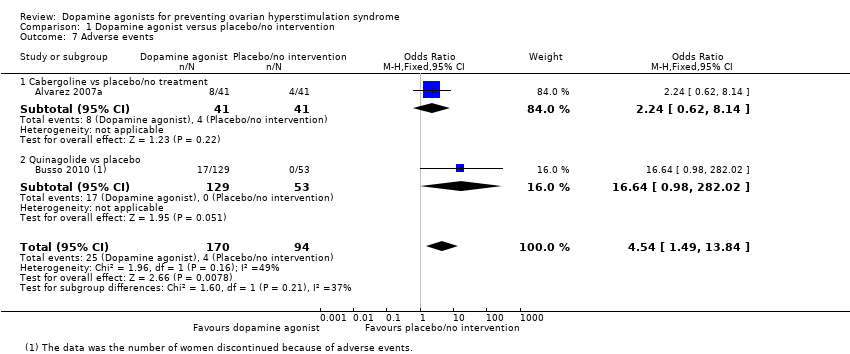
Comparison 1 Dopamine agonist versus placebo/no intervention, Outcome 7 Adverse events.
Comparison 2 Dopamine agonist plus co‐intervention versus co‐intervention, Outcome 1 Moderate or severe ovarian hyperstimulation syndrome (OHSS).
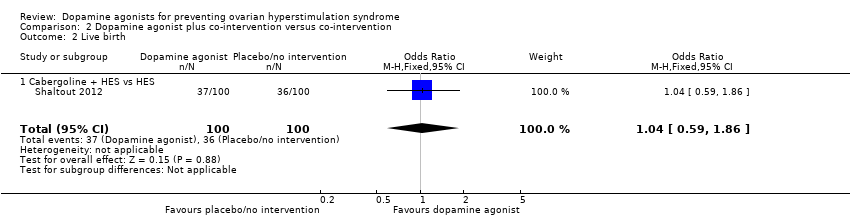
Comparison 2 Dopamine agonist plus co‐intervention versus co‐intervention, Outcome 2 Live birth.

Comparison 2 Dopamine agonist plus co‐intervention versus co‐intervention, Outcome 3 Clinical pregnancy rate.
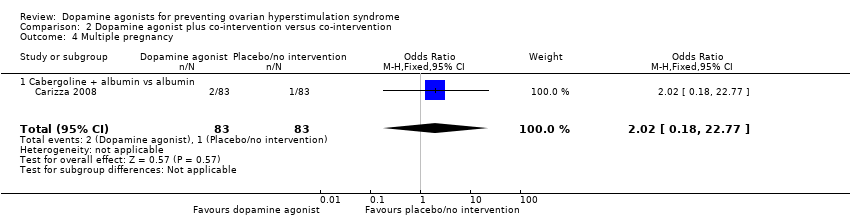
Comparison 2 Dopamine agonist plus co‐intervention versus co‐intervention, Outcome 4 Multiple pregnancy.
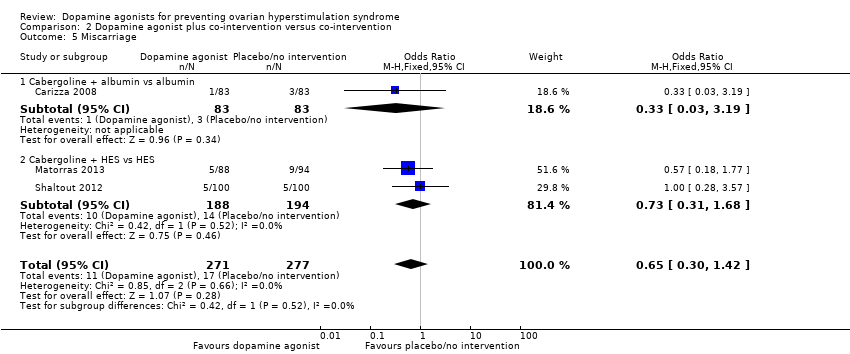
Comparison 2 Dopamine agonist plus co‐intervention versus co‐intervention, Outcome 5 Miscarriage.

Comparison 2 Dopamine agonist plus co‐intervention versus co‐intervention, Outcome 6 Adverse events.

Comparison 3 Dopamine agonist versus active interventions, Outcome 1 Moderate or severe ovarian hyperstimulation syndrome (OHSS).
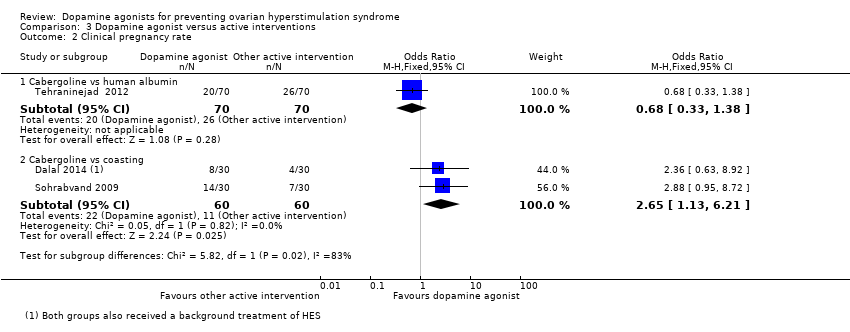
Comparison 3 Dopamine agonist versus active interventions, Outcome 2 Clinical pregnancy rate.
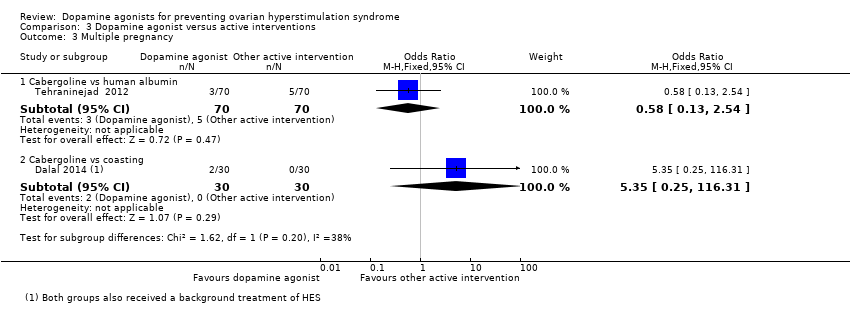
Comparison 3 Dopamine agonist versus active interventions, Outcome 3 Multiple pregnancy.

Comparison 3 Dopamine agonist versus active interventions, Outcome 4 Miscarriage.
| Dopamine agonist vs placebo/no intervention | ||||||
| Patient or population: women of reproductive age undergoing any ART therapy Settings: ART unit Intervention: dopamine agonist Comparison: placebo/no intervention | ||||||
| Outcomes | Anticipated absolute effects* (95% CI) | Relative effect | No of participants | Quality of the evidence | Comments | |
| Risk with placebo/no intervention | Risk with dopamine agonist | |||||
| Incidence of moderate or severe OHSS | 286 per 1000 | 97 per 1000 (71 to 135) | OR 0.27 (0.19 to 0.39) | 1022 (8 studies) | ⊕⊕⊕⊝ | ‐ |
| Live birth rate | 509 per 1000 | 512 per 1000 (355 to 665) | OR 1.01 (0.53 to 1.91) | 182 | ⊕⊕⊝⊝ | |
| Clinical pregnancy rate | 401 per 1000 | 352 per 1000 (266 to 450) | OR 0.81 (0.54 to 1.22) | 432 (4 studies) | ⊕⊕⊕⊝ | |
| Multiple pregnancy | 50 per 1000 | 17 per 1000 (1 to 303) | OR 0.32 (0.01 to 8.26) | 40 | ⊕⊝⊝⊝ | |
| Miscarriage pregnancy rate | 72 per 1000 | 49 per 1000 (15 to 151) | OR 0.66 (0.19 to 2.28) | 168 (2 studies) | ⊕⊕⊝⊝ | |
| Adverse events | 43 per 1000 | 168 per 1000 (62 to 381) | OR 4.54 (1.49 to 13.84) | 264 | ⊕⊝⊝⊝ | |
| *The risk in the intervention group (and its 95% confidence interval) is based on the assumed risk in the comparison group and the relative effect of the intervention (and its 95% CI). ART: assisted reproductive technology; CI: confidence interval; OHSS: ovarian hyperstimulation syndrome; OR: odds ratio. | ||||||
| GRADE Working Group grades of evidence | ||||||
| 1 Downgraded one level for serious risk of bias associated with poor reporting of study methods. 2 Downgraded one level for serious risk of imprecision: confidence interval compatible with benefit in either arm or with no difference between the groups. 3 Downgraded two levels for very serious risk of imprecision: only one event. 4 Downgraded one level for serious risk of imprecision: only 10 events. 5 Downgraded one level for serious risk of imprecision: only 29 events. | ||||||
| Outcome or subgroup title | No. of studies | No. of participants | Statistical method | Effect size |
| 1 Moderate or severe ovarian hyperstimulation syndrome (OHSS) Show forest plot | 8 | 1022 | Odds Ratio (M‐H, Fixed, 95% CI) | 0.27 [0.19, 0.39] |
| 1.1 Cabergoline vs placebo/no treatment | 5 | 521 | Odds Ratio (M‐H, Fixed, 95% CI) | 0.26 [0.16, 0.42] |
| 1.2 Quinagolide vs placebo | 2 | 454 | Odds Ratio (M‐H, Fixed, 95% CI) | 0.28 [0.15, 0.51] |
| 1.3 Bromocriptine vs placebo (folic acid) | 1 | 47 | Odds Ratio (M‐H, Fixed, 95% CI) | 0.29 [0.08, 1.14] |
| 2 Subgroup analysis by severity of OHSS Show forest plot | 7 | Odds Ratio (M‐H, Fixed, 95% CI) | Subtotals only | |
| 2.1 Severe OHSS | 7 | 750 | Odds Ratio (M‐H, Fixed, 95% CI) | 0.28 [0.14, 0.56] |
| 2.2 Moderate OHSS | 7 | 750 | Odds Ratio (M‐H, Fixed, 95% CI) | 0.37 [0.24, 0.57] |
| 3 Live birth Show forest plot | 1 | 182 | Odds Ratio (M‐H, Fixed, 95% CI) | 1.01 [0.53, 1.91] |
| 3.1 Quinagolide vs placebo | 1 | 182 | Odds Ratio (M‐H, Fixed, 95% CI) | 1.01 [0.53, 1.91] |
| 4 Clinical pregnancy rate Show forest plot | 4 | 432 | Odds Ratio (M‐H, Fixed, 95% CI) | 0.81 [0.54, 1.22] |
| 4.1 Cabergoline vs no intervention | 3 | 250 | Odds Ratio (M‐H, Fixed, 95% CI) | 0.81 [0.48, 1.38] |
| 4.2 Quinagolide vs placebo | 1 | 182 | Odds Ratio (M‐H, Fixed, 95% CI) | 0.81 [0.43, 1.54] |
| 5 Multiple pregnancy Show forest plot | 1 | 40 | Odds Ratio (M‐H, Fixed, 95% CI) | 0.32 [0.01, 8.26] |
| 5.1 Cabergoline vs placebo/no treatment | 1 | 40 | Odds Ratio (M‐H, Fixed, 95% CI) | 0.32 [0.01, 8.26] |
| 6 Miscarriage Show forest plot | 2 | Odds Ratio (M‐H, Fixed, 95% CI) | Subtotals only | |
| 6.1 Cabergoline vs placebo/no treatment | 2 | 168 | Odds Ratio (M‐H, Fixed, 95% CI) | 0.66 [0.19, 2.28] |
| 7 Adverse events Show forest plot | 2 | 264 | Odds Ratio (M‐H, Fixed, 95% CI) | 4.54 [1.49, 13.84] |
| 7.1 Cabergoline vs placebo/no treatment | 1 | 82 | Odds Ratio (M‐H, Fixed, 95% CI) | 2.24 [0.62, 8.14] |
| 7.2 Quinagolide vs placebo | 1 | 182 | Odds Ratio (M‐H, Fixed, 95% CI) | 16.64 [0.98, 282.02] |
| Outcome or subgroup title | No. of studies | No. of participants | Statistical method | Effect size |
| 1 Moderate or severe ovarian hyperstimulation syndrome (OHSS) Show forest plot | 3 | 548 | Odds Ratio (M‐H, Fixed, 95% CI) | 0.57 [0.31, 1.03] |
| 1.1 Cabergoline + albumin vs albumin | 1 | 166 | Odds Ratio (M‐H, Fixed, 95% CI) | 0.55 [0.23, 1.34] |
| 1.2 Cabergoline + hydroxyethyl starch (HES) vs HES | 2 | 382 | Odds Ratio (M‐H, Fixed, 95% CI) | 0.58 [0.26, 1.30] |
| 2 Live birth Show forest plot | 1 | 200 | Odds Ratio (M‐H, Fixed, 95% CI) | 1.04 [0.59, 1.86] |
| 2.1 Cabergoline + HES vs HES | 1 | 200 | Odds Ratio (M‐H, Fixed, 95% CI) | 1.04 [0.59, 1.86] |
| 3 Clinical pregnancy rate Show forest plot | 3 | 548 | Odds Ratio (M‐H, Fixed, 95% CI) | 1.0 [0.71, 1.40] |
| 3.1 Cabergoline + albumin vs albumin | 1 | 166 | Odds Ratio (M‐H, Fixed, 95% CI) | 1.05 [0.56, 1.96] |
| 3.2 Cabergoline + HES vs HES | 2 | 382 | Odds Ratio (M‐H, Fixed, 95% CI) | 0.98 [0.65, 1.47] |
| 4 Multiple pregnancy Show forest plot | 1 | 166 | Odds Ratio (M‐H, Fixed, 95% CI) | 2.02 [0.18, 22.77] |
| 4.1 Cabergoline + albumin vs albumin | 1 | 166 | Odds Ratio (M‐H, Fixed, 95% CI) | 2.02 [0.18, 22.77] |
| 5 Miscarriage Show forest plot | 3 | 548 | Odds Ratio (M‐H, Fixed, 95% CI) | 0.65 [0.30, 1.42] |
| 5.1 Cabergoline + albumin vs albumin | 1 | 166 | Odds Ratio (M‐H, Fixed, 95% CI) | 0.33 [0.03, 3.19] |
| 5.2 Cabergoline + HES vs HES | 2 | 382 | Odds Ratio (M‐H, Fixed, 95% CI) | 0.73 [0.31, 1.68] |
| 6 Adverse events Show forest plot | 2 | 366 | Odds Ratio (M‐H, Fixed, 95% CI) | 3.03 [0.12, 75.28] |
| 6.1 Cabergoline + albumin vs albumin | 1 | 166 | Odds Ratio (M‐H, Fixed, 95% CI) | 0.0 [0.0, 0.0] |
| 6.2 Cabergoline + HES vs HES | 1 | 200 | Odds Ratio (M‐H, Fixed, 95% CI) | 3.03 [0.12, 75.28] |
| Outcome or subgroup title | No. of studies | No. of participants | Statistical method | Effect size |
| 1 Moderate or severe ovarian hyperstimulation syndrome (OHSS) Show forest plot | 6 | Odds Ratio (M‐H, Fixed, 95% CI) | Subtotals only | |
| 1.1 Cabergoline vs human albumin | 3 | 296 | Odds Ratio (M‐H, Fixed, 95% CI) | 0.21 [0.12, 0.38] |
| 1.2 Cabergoline vs prednisolone | 1 | 150 | Odds Ratio (M‐H, Fixed, 95% CI) | 0.27 [0.05, 1.33] |
| 1.3 Cabergoline vs hydroxyethyl starch (HES) | 1 | 61 | Odds Ratio (M‐H, Fixed, 95% CI) | 2.69 [0.48, 15.10] |
| 1.4 Cabergoline vs coasting | 2 | 120 | Odds Ratio (M‐H, Fixed, 95% CI) | 0.50 [0.18, 1.45] |
| 2 Clinical pregnancy rate Show forest plot | 3 | Odds Ratio (M‐H, Fixed, 95% CI) | Subtotals only | |
| 2.1 Cabergoline vs human albumin | 1 | 140 | Odds Ratio (M‐H, Fixed, 95% CI) | 0.68 [0.33, 1.38] |
| 2.2 Cabergoline vs coasting | 2 | 120 | Odds Ratio (M‐H, Fixed, 95% CI) | 2.65 [1.13, 6.21] |
| 3 Multiple pregnancy Show forest plot | 2 | Odds Ratio (M‐H, Fixed, 95% CI) | Subtotals only | |
| 3.1 Cabergoline vs human albumin | 1 | 140 | Odds Ratio (M‐H, Fixed, 95% CI) | 0.58 [0.13, 2.54] |
| 3.2 Cabergoline vs coasting | 1 | 60 | Odds Ratio (M‐H, Fixed, 95% CI) | 5.35 [0.25, 116.31] |
| 4 Miscarriage Show forest plot | 2 | Odds Ratio (M‐H, Fixed, 95% CI) | Subtotals only | |
| 4.1 Cabergoline vs human albumin | 1 | 140 | Odds Ratio (M‐H, Fixed, 95% CI) | 0.32 [0.03, 3.19] |
| 4.2 Cabergoline vs coasting | 1 | 60 | Odds Ratio (M‐H, Fixed, 95% CI) | 0.19 [0.01, 4.06] |