Citología versus prueba de HPV para el cribado del cáncer de cuello de útero en la población general
Información
- DOI:
- https://doi.org/10.1002/14651858.CD008587.pub2Copiar DOI

- Base de datos:
-
- Cochrane Database of Systematic Reviews
- Versión publicada:
-
- 10 agosto 2017see what's new
- Tipo:
-
- Diagnostic
- Etapa:
-
- Review
- Grupo Editorial Cochrane:
-
Grupo Cochrane de Cáncer ginecológico, neurooncología y otros cánceres
- Copyright:
-
- Copyright © 2018 The Cochrane Collaboration. Published by John Wiley & Sons, Ltd.
Cifras del artículo
Altmetric:
Citado por:
Autores
Contributions of authors
G Koliopoulos: article search, data extraction, assessment of methodological quality, data analysis, drafting the review
V Nyawira Nyaga: data analysis
A Bryant: data analysis, drafting the review
N Santesso: article search, commented critically, drafted plain language summary and SoF table
P Martin‐Hirsch: assessment of methodological quality, drafting the review
RA Mustafa: data analysis
H Schünemann: commented critically
E Paraskevaidis: conception and design, commented critically
M Arbyn: data extraction, data analysis, drafting the review
Sources of support
Internal sources
-
None, Other.
External sources
-
Cochrane Gynaecological, Neuro‐oncology and Orphan Cancers, Bath, UK.
-
Department of Health, UK.
-
NHS Cochrane Collaboration programme Grant Scheme CPG‐506
-
-
European Commission (DG Sanco, Luxembourg) through the ECCG project, Luxembourg.
-
Belgian Foundation Against Cancer, Brussels, Belgium.
-
IWT (Institute for the Promotion of Innovation by Science and Technology in Flanders), Brussels, Belgium.
project number 060081
-
FP7 Programme of DG Research of the European Commisssion (though the COHEAHR Network, Grant nr 603019), Belgium.
Financial support of M Arbyn
Declarations of interest
G Koliopoulos: no conflict of interest and no financial support for the development of this review
V Nyawira Nyaga: no conflict of interest and no financial support for the development of this review
A Bryant: no conflict of interest and no financial support for the development of this review
N Santesso: no conflict of interest and no financial support for the development of this review
P Martin‐Hirsch: no conflict of interest and no financial support for the development of this review
RA Mustafa: no conflict of interest and no financial support for the development of this review
H Schünemann: no conflict of interest and no financial support for the development of this review
E Paraskevaidis: no conflict of interest and no financial support for the development of this review
M Arbyn: is supported by 1) European Commission (DG Sanco, Luxembourg) through the ECCG project (European Cooperation on Development and Implementation of Cancer Screening and Prevention Guidelines, IARC, Lyon, France) and the CoheaHr Project [603019], co‐ordinated by the Free University Medical Center of Amsterdam; 2) Belgian Foundation Against Cancer, Brussels, Belgium; 3) Belgian Cancer Centre, Brussels, Belgium; and 4) IWT (Institute for the Promotion of Innovation by Science and Technology in Flanders, project number 060081), Brussels, Belgium.
Acknowledgements
This project was supported by the National Institute for Health Research (NIHR), via Cochrane infrastructure funding to the Cochrane Gynaecological, Neuro‐oncology and Orphan Cancers Group. The views and opinions expressed therein are those of the review authors and do not necessarily reflect those of the Systematic Reviews Programme, the NIHR, the NHS, or the Department of Health.
We thank Jo Morrison, Gail Quinn, Clare Jess and Jane Hayes of the Cochrane Gynaecological, Neuro‐oncology and Orphan Cancers editorial team for their contribution to the editorial process. We thank the peer reviewers for their many helpful suggestions.
Version history
| Published | Title | Stage | Authors | Version |
| 2017 Aug 10 | Cytology versus HPV testing for cervical cancer screening in the general population | Review | George Koliopoulos, Victoria N Nyaga, Nancy Santesso, Andrew Bryant, Pierre PL Martin‐Hirsch, Reem A Mustafa, Holger Schünemann, Evangelos Paraskevaidis, Marc Arbyn | |
| 2010 Jul 07 | Cytology versus HPV testing for cervical cancer screening in the general population | Protocol | George Koliopoulos, Marc Arbyn, Pierre PL Martin‐Hirsch, Maria Kyrgiou, Walter JP Prendiville, Evangelos Paraskevaidis | |
Differences between protocol and review
The final review included only studies written in the English language.
Keywords
MeSH
Medical Subject Headings (MeSH) Keywords
- Early Detection of Cancer [methods];
- Papillomavirus Infections [*diagnosis];
- Polymerase Chain Reaction;
- Precancerous Conditions [*diagnosis, pathology, virology];
- Sensitivity and Specificity;
- Uterine Cervical Dysplasia [*diagnosis, pathology, virology];
- Uterine Cervical Neoplasms [*diagnosis, pathology, virology];
- Vaginal Smears [methods];
Medical Subject Headings Check Words
Adult; Aged; Female; Humans; Middle Aged;

Study flow diagram detailing the number of the initially retrieved articles and consequent exclusions
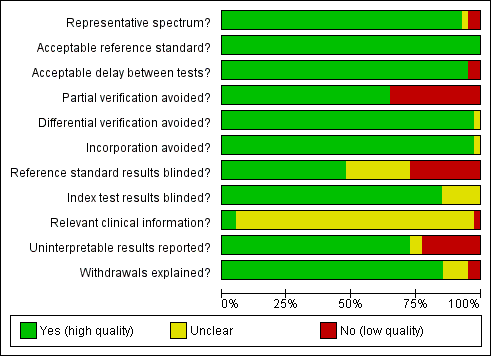
Methodological quality graph: review authors' judgements about each methodological quality item presented as percentages across all included studies
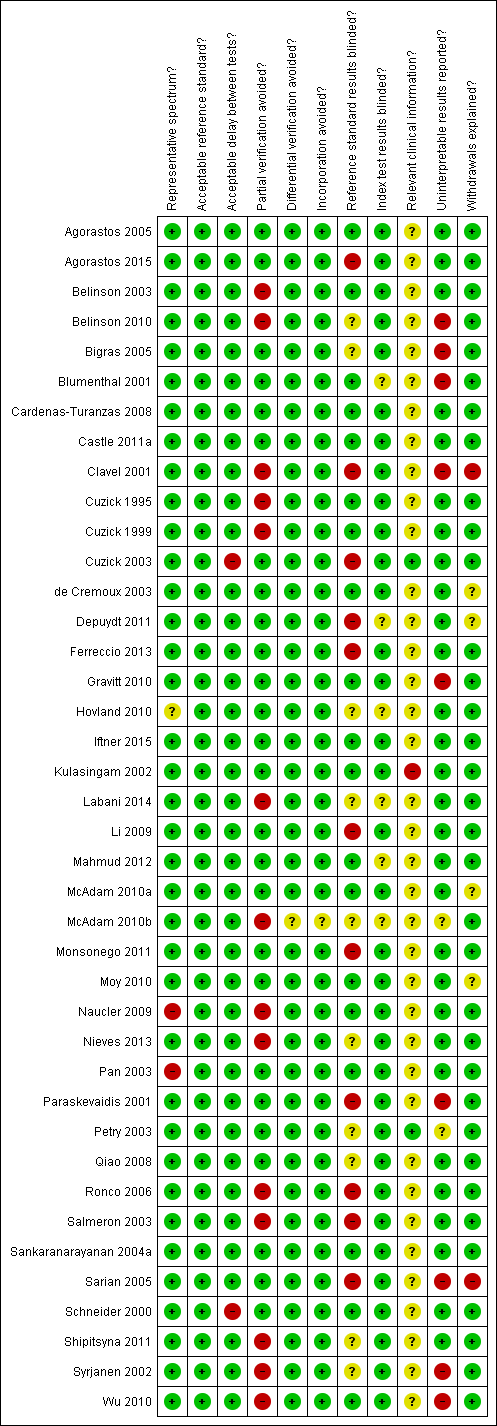
Methodological quality summary: review authors' judgements about each methodological quality item for each included study
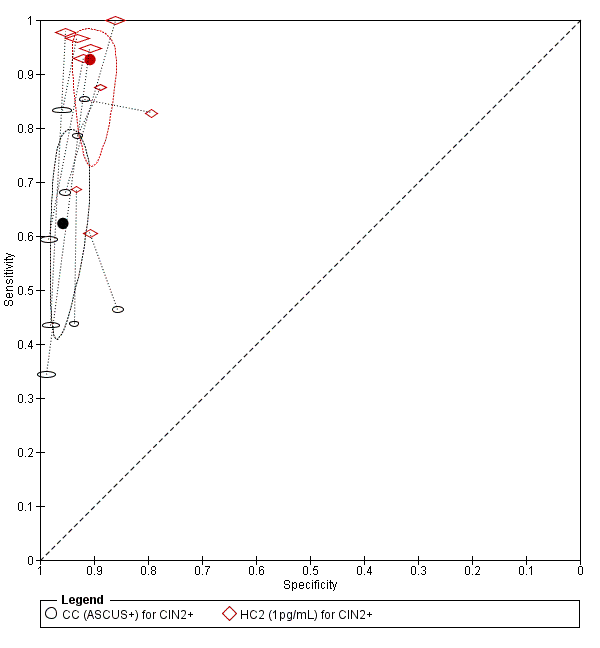
Summary ROC plot of 2 tests for detection of CIN 2+ (verified with histology): Conventional Cytology (ASCUS+) and HPV testing with hybrid capture 2 (1pg/mL). The black and red solid circles correspond to the summary estimates of sensitivity and specificity, and are shown with a 95% confidence region.

Summary ROC plot of 2 tests for detection of CIN 3+ (verified with histology): Conventional Cytology (CC) (ASCUS+) and HPV testing with hybrid capture (HC) 2 (1pg/mL). The black and red solid circles correspond to the summary estimates of sensitivity and specificity, and are shown with a 95% confidence region.

Summary ROC plot of 2 tests for detection of CIN 2+ (verified with histology): Conventional Cytology (CC) (LSIL+) and HPV testing with hybrid capture (HC) 2 (1pg/mL). The black and red solid circles correspond to the summary estimates of sensitivity and specificity, and are shown with a 95% confidence region.
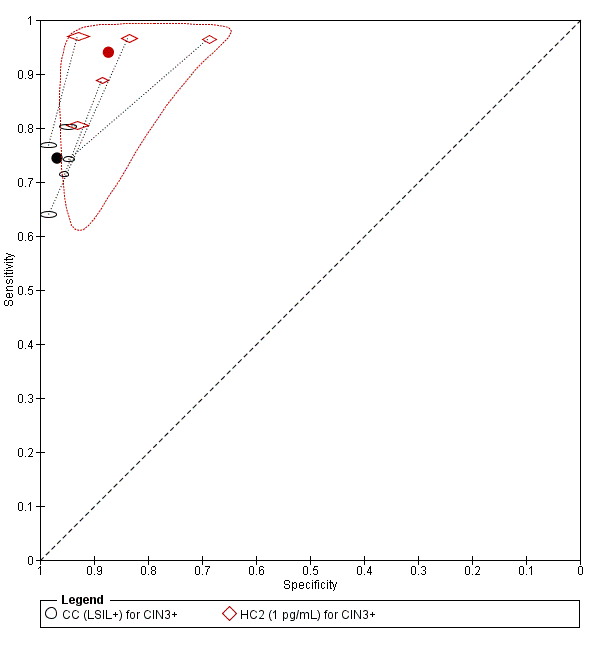
Summary ROC plot of 2 tests for detection of CIN 3+ (verified with histology): Conventional Cytology (CC) (LSIL+) and HPV testing with hybrid capture (HC) (1pg/mL). The black and red solid circles correspond to the summary estimates of sensitivity and specificity, and are shown with a 95% confidence region.

Summary ROC plot of 2 tests for detection of CIN 2+ (verified with histology): Liquid Based Cytology (LBC) (ASCUS+) and HPV testing with hybrid capture (HC) 2 (1pg/mL). The black and red solid circles correspond to the summary estimates of sensitivity and specificity, and are shown with a 95% confidence region.

Summary ROC plot of 2 tests for detection of CIN 3+ (verified with histology): Liquid Based Cytology (LBC) (ASCUS+) and HPV testing with hybrid capture (HC) 2 (1pg/mL). The black and red solid circles correspond to the summary estimates of sensitivity and specificity, and are shown with a 95% confidence region.

Summary ROC plot of 2 tests for detection of CIN 2+ (verified with histology): Liquid Based Cytology (LBC) (LSIL+) and HPV testing by hybrid capture (HC) 2 (1pg/mL). The black and red solid circles correspond to the summary estimates of sensitivity and specificity, and are shown with a 95% confidence region.

CC (ASCUS+) for CIN2+.
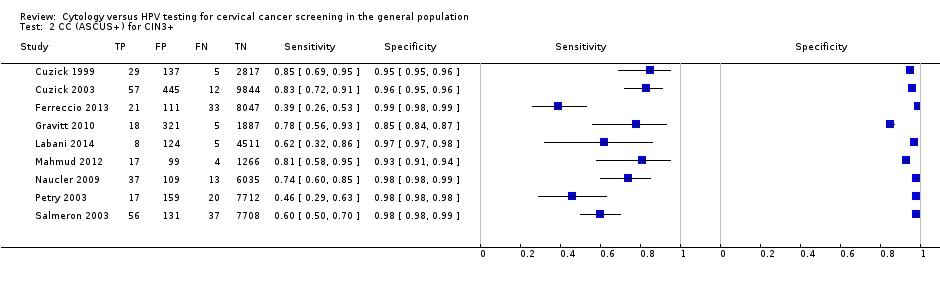
CC (ASCUS+) for CIN3+.
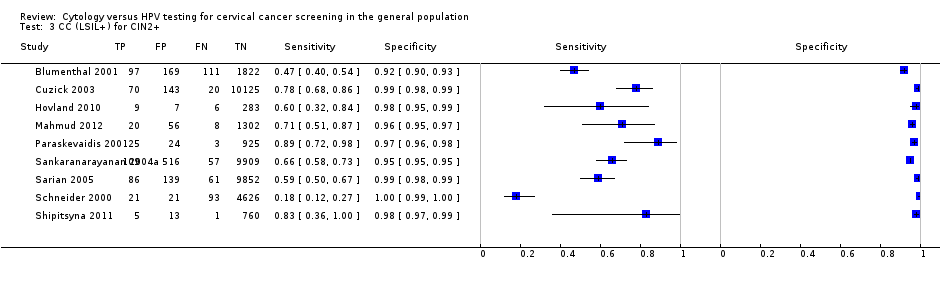
CC (LSIL+) for CIN2+.
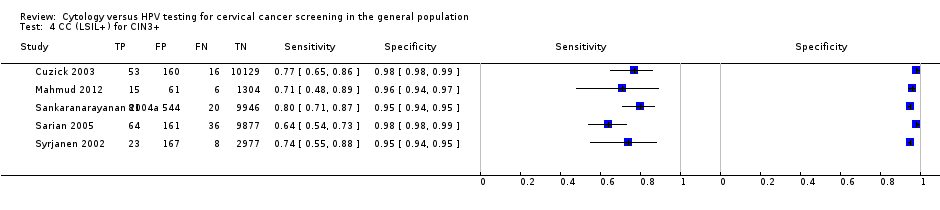
CC (LSIL+) for CIN3+.
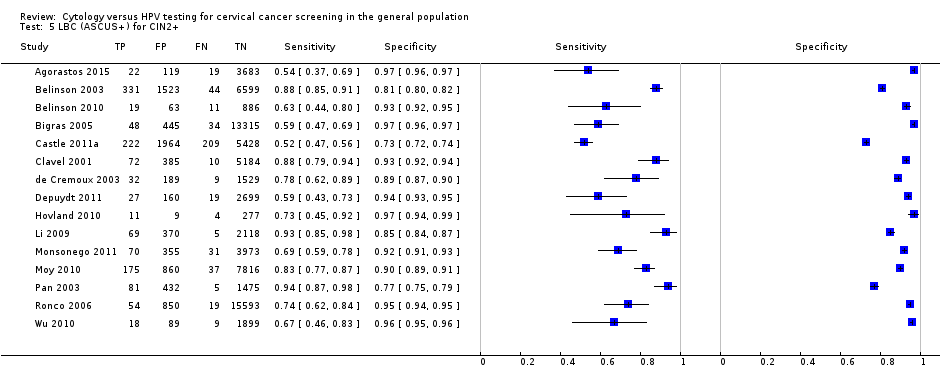
LBC (ASCUS+) for CIN2+.

LBC (ASCUS+) for CIN3+.
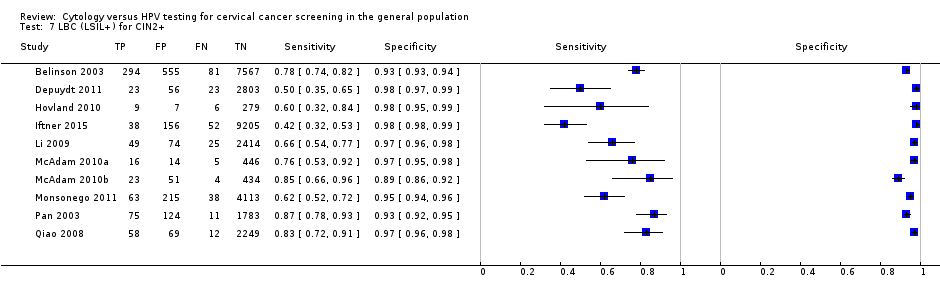
LBC (LSIL+) for CIN2+.
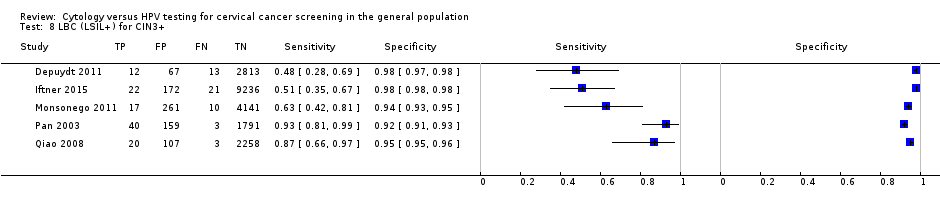
LBC (LSIL+) for CIN3+.

HC2 (1pg/mL) for CIN2+.

HC2 (1 pg/mL) for CIN3+.

HC2 (2 pg/mL) for CIN2+.

HC2 (2 pg/mL) for CIN3+.
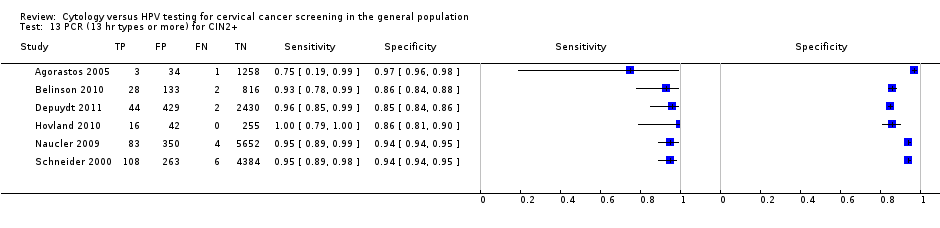
PCR (13 hr types or more) for CIN2+.
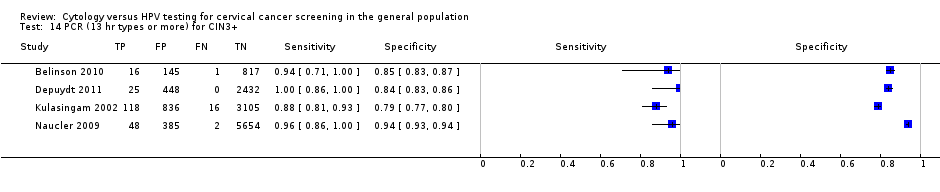
PCR (13 hr types or more) for CIN3+.

PCR (10‐11 hr types) for CIN2+.

PCR (10‐11 hr types) for CIN3+.

Aptima for CIN2+.
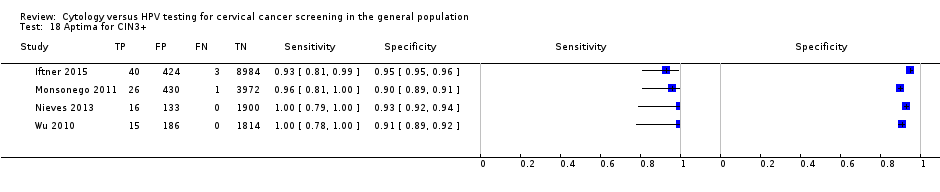
Aptima for CIN3+.

PCR (4 hr types) for CIN2+.
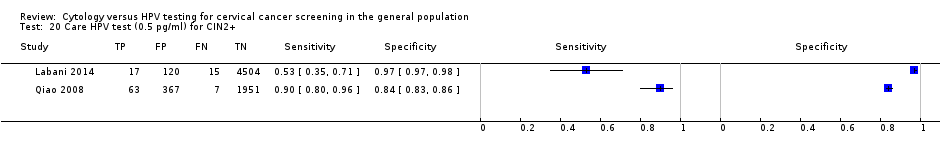
Care HPV test (0.5 pg/ml) for CIN2+.
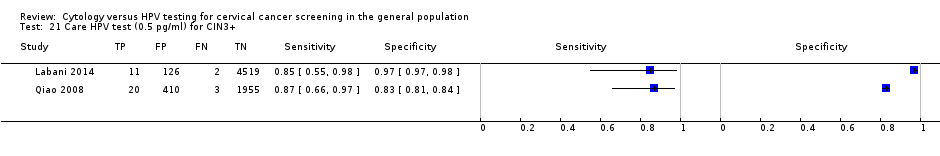
Care HPV test (0.5 pg/ml) for CIN3+.


NASBA (5 types) for CIN2+.

NASBA (9 types) for CIN2+.

HC2+4 (1 pg/ml) for CIN2+.

HC2+4 (1 pg/ml) for CIN3+.

HC2 (1pg/mL) for CIN2+ no verification bias.

CC or LBC (ASCUS+) for CIN2+ no verification bias.

HC2 (1pg/mL) for CIN2+ women >30.
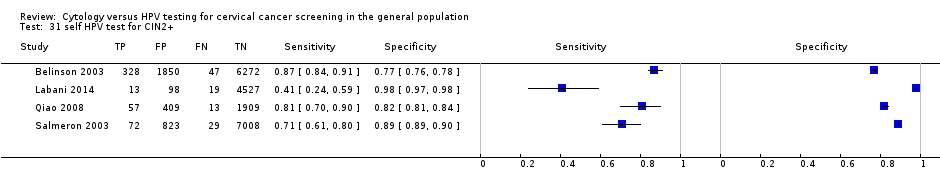
self HPV test for CIN2+.
| Human papillomavirus (HPV) compared to Papanicolaou (Pap) test for detection of cervical intraepithelial neoplasia (CIN 2+) in asymptomatic women | |||||
| Patient or population: adult asymptomatic women Settings: outpatient screening programmes New Test: HPV, HC2 test Cut‐off value: 1 pg/mL Comparison Test: Pap, liquid‐based cytology (LBC) test Cut‐off value: atypical squamous cells of undetermined significance (ASCUS) Reference Test: a colposcopy exam with or without biopsy as clinically indicated | |||||
| HPV | 138,230 women | Pooled sensitivity | 89.9% (88.6 to 91.1%) | Pooled specificity | 89.9% (89.7 to 90.0%) |
| Pap | 82,003 women | Pooled sensitivity | 72.9% (70.7 to 75%) | Pooled specificity | 90.3% (90.1 to 90.5%) |
| Test results | Number of results per 1000 women tested | Quality of the evidence | Comments | ||
| Prevalence of CIN 2+, 2%1 | |||||
| HPV | Pap | ||||
| True positives (TP) | 18 (18 to 18) | 15 (14 to 15) | ⊕⊕⊕⊝ | Women will be correctly classified and will receive further confirmatory testing or treatment | |
| TP absolute difference | 3 more | ||||
| False negatives (FN) | 2 (2 to 2) | 5 (5 to 6) | Women will be falsely reassured that they do not have CIN 2+, and the potentially beneficial treatment may be missed or will be delayed | ||
| FN absolute difference | 3 fewer | ||||
| True negatives (TN) | 881 (879 to 882) | 885 (883 to 887) | ⊕⊕⊕⊕ | Women will be correctly reassured that they do not have CIN 2+ | |
| TN absolute difference | 4 fewer | ||||
| False positives (FP) | 99 (98 to 101) | 95 (93 to 97) | Women will likely receive unnecessary further testing and possibly also unnecessary treatment; additionally further testing and unnecessary treatment may lead to adverse effects and use of resources without any health benefits | ||
| FP absolute difference | 4 more | ||||
| CI: Confidence interval; HPV human papillomavirus; Pap: Papanicolaou test, CIN: cervical intraepithelial neoplasia | |||||
| GRADE Working Group grades of evidence | |||||
| 1 Prevalence of 2% (20 women out of 1000) was assumed to be the average prevalence of cervical intraepithelial neoplasia 2+ in non HIV asymptomatic women. | |||||
| Test | Disease threshold | studies | Pooled sensitivity (95% CI) | Pooled specificity (95% CI) |
| CC (ASCUS+) | CIN 2+ | 16 | 65.87% (54.94 to 75.33) | 96.28% (94.72 to 97.39) |
| LBC (ASCUS+) | CIN 2+ | 15 | 75.51% (66.57 to 82.68) | 91.85% (88.43 to 94.32) |
| CC (LSIL+) | CIN 2+ | 9 | 62.84% (46.79‐76.50) | 97.73% (96.09‐98.70) |
| LBC (LSIL+) | CIN 2+ | 10 | 70.33% (59.73 to 79.11) | 96.20% (94.57 to 97.36) |
| HC2 (1 pg/mL) | CIN 2+ | 25 | 92.60% (99.45 to 95.30) | 89.30% (87.03 to 91.20) |
| PCR (> 12 types) | CIN 2+ | 6 | 95.13% (89.50 to 97.84) | 91.89% (83.79 to 96.13) |
| APTIMA | CIN 2+ | 3 | 92.66% (31.77 to 99.71) | 93.31% (47.30 to 99.54) |
| CC (ASCUS+) | CIN 3+ | 9 | 70.27% (57.87 to 80.30) | 96.67% (94.56 to 98.00) |
| LBC (ASCUS+) | CIN 3+ | 13 | 75.97% (64.72 to 84.49) | 91.19% (87.21 to 94.01) |
| CC (LSIL+) | CIN 3+ | 5 | 74.43% (67.81 to 80.10) | 96.86% (94.87 to 98.10) |
| LBC (LSIL+) | CIN 3+ | 5 | 71.91% (51.68 to 86.00) | 96.05% (93.53 to 97.60) |
| HC2 (1 pg/mL) | CIN 3+ | 19 | 96.50% (94.00 to 97.90) | 89.20% (86.70 to 91.30) |
| PCR (> 12 types) | CIN 3+ | 4 | 93.57% (69.90 to 98.91) | 86.49% (68.16 to 95.04) |
| APTIMA | CIN 3+ | 4 | 96.04% (72.91 to 99.54) | 92.80% (86.15 to 96.39) |
| Tests with fewer than three studies are not included in the table. | ||||
| Comparison | Disease threshold | Relative sensitivity (95% CI) | Relative specificity (95% CI) | Studies | Analysis number |
| HC2 vs CC (ASCUS+) | CIN 2+ | 1.52 (1.24 to 1.86) | 0.94 (0.92 to 0.96) | 9 | 1 |
| HC2 vs CC (ASCUS+) | CIN 3+ | 1.46 (1.12 to 1.91) | 0.95 (0.93 to 0.9) | 6 | 2 |
| PCR (> 12 types) vs CC (ASCUS+) | CIN 2+ | 1.37 (0.58 to 3.21) | 0.95 (0.76 to 1.19) | 3 | 5 |
| HC2 vs CC (LSIL+) | CIN 2+ | 1.28 (1.15 to 1.41) | 0.91 (0.87 to 0.95) | 6 | 7 |
| HC2 vs CC (LSIL+) | CIN 3+ | 1.22 (1.12 to 1.32) | 0.91 (0.87 to 0.95) | 5 | 8 |
| HC2 vs LBC (ASCUS+) | CIN 2+ | 1.18 (1.10 to 1.26) | 0.96 (0.95 to 0.97) | 10 | 11 |
| HC2 vs LBC (ASCUS+) | CIN 3+ | 1.17 (1.05 to 1.30) | 0.96 (0.95 to 0.98) | 8 | 12 |
| PCR (> 12 types) vs LBC (ASCUS+) | CIN 2+ | 1.53 (0.53 to 4.44) | 0.90 (0.89 to 0.92) | 3 | 15 |
| PCR (> 12 types) vs LBC (ASCUS+) | CIN 3+ | 1.47 (0.64 to 3.35) | 0.94 (0.8 to 1.09) | 3 | 16 |
| HC2 vs LBC (LSIL+) | CIN 2+ | 1.35 (1.19 to 1.53) | 0.92 (0.89 to 0.95) | 8 | 17 |
| HC2 vs LBC (LSIL+) | CIN 3+ | 1.30 (0.86 to 1.96) | 0.92 (0.8 to 1.00) | 4 | 18 |
| APTIMA vs LBC (ASCUS+) | CIN 3+ | 1.30 (0.49 to 3.41) | 0.98 (0.93 to 1.04) | 3 | 22 |
| Comparisons with fewer than three studies are not included in the table | |||||
| Comparison | Studies | Disease threshold | Relative sensitivity (95% CI) | Relative specificity (95% CI) |
| Age > 30 vs any age | 17 vs 20 | CIN 2+ | 1.13 (1.03 to 1.25) | 1.01 (0.98 to 1.04) |
| 13 vs 14 | CIN 3+ | 1.10 (1.02 to 1.19) | 1.04 (1.00 to 1.08) | |
| Increased vs low risk of verification bias | 17 vs 20 | CIN 2+ | 1.05 (0.95 to 1.16) | 1.00 (0.97 to 1.04) |
| 12 vs 15 | CIN 3+ | 1.09 (1.01 to 1.18) | 1.00 (0.96 to 1.05) | |
| High‐income vs middle‐/low‐income countries | 21 vs 16 | CIN 2+ | 1.01 (0.91 to 1.12) | 1.03 (1.00 to 1.07) |
| 13 vs 14 | CIN 3+ | 0.94 (0.87 to 1.02) | 1.01 (0.96 to 1.05) | |
| Assessed by bivariate random‐effects meta‐analysis including one covariate each time. | ||||
| Test | No. of studies | No. of participants |
| 1 CC (ASCUS+) for CIN2+ Show forest plot | 16 | 61099 |
| 2 CC (ASCUS+) for CIN3+ Show forest plot | 9 | 51857 |
| 3 CC (LSIL+) for CIN2+ Show forest plot | 9 | 41494 |
| 4 CC (LSIL+) for CIN3+ Show forest plot | 5 | 35648 |
| 5 LBC (ASCUS+) for CIN2+ Show forest plot | 15 | 82003 |
| 6 LBC (ASCUS+) for CIN3+ Show forest plot | 13 | 71919 |
| 7 LBC (LSIL+) for CIN2+ Show forest plot | 10 | 33519 |
| 8 LBC (LSIL+) for CIN3+ Show forest plot | 5 | 21166 |
| 9 HC2 (1pg/mL) for CIN2+ Show forest plot | 25 | 138230 |
| 10 HC2 (1 pg/mL) for CIN3+ Show forest plot | 19 | 120380 |
| 11 HC2 (2 pg/mL) for CIN2+ Show forest plot | 2 | 26768 |
| 12 HC2 (2 pg/mL) for CIN3+ Show forest plot | 2 | 26768 |
| 13 PCR (13 hr types or more) for CIN2+ Show forest plot | 6 | 16343 |
| 14 PCR (13 hr types or more) for CIN3+ Show forest plot | 4 | 14048 |
| 15 PCR (10‐11 hr types) for CIN2+ Show forest plot | 2 | 3965 |
| 16 PCR (10‐11 hr types) for CIN3+ Show forest plot | 1 | 2988 |
| 17 Aptima for CIN2+ Show forest plot | 3 | 15895 |
| 18 Aptima for CIN3+ Show forest plot | 4 | 17944 |
| 19 PCR (4 hr types) for CIN2+ Show forest plot | 1 | 1985 |
| 20 Care HPV test (0.5 pg/ml) for CIN2+ Show forest plot | 2 | 7044 |
| 21 Care HPV test (0.5 pg/ml) for CIN3+ Show forest plot | 2 | 7046 |
| 22 Cobas for CIN2+ Show forest plot | 2 | 11666 |
| 23 Cobas for CIN3+ Show forest plot | 2 | 11666 |
| 24 NASBA (5 types) for CIN2+ Show forest plot | 1 | 313 |
| 25 NASBA (9 types) for CIN2+ Show forest plot | 1 | 313 |
| 26 HC2+4 (1 pg/ml) for CIN2+ Show forest plot | 1 | 1352 |
| 27 HC2+4 (1 pg/ml) for CIN3+ Show forest plot | 1 | 1352 |
| 28 HC2 (1pg/mL) for CIN2+ no verification bias Show forest plot | 12 | 53013 |
| 29 CC or LBC (ASCUS+) for CIN2+ no verification bias Show forest plot | 8 | 31341 |
| 30 HC2 (1pg/mL) for CIN2+ women >30 Show forest plot | 13 | 69334 |
| 31 self HPV test for CIN2+ Show forest plot | 4 | 23474 |