Contenido relacionado
Revisiones y protocolos relacionados
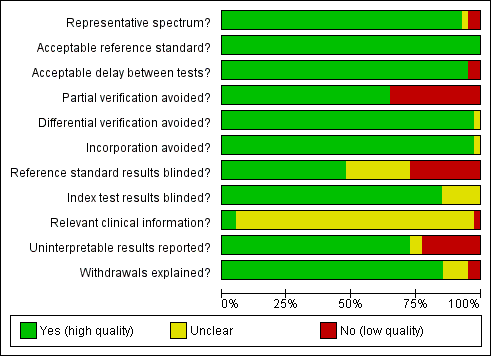
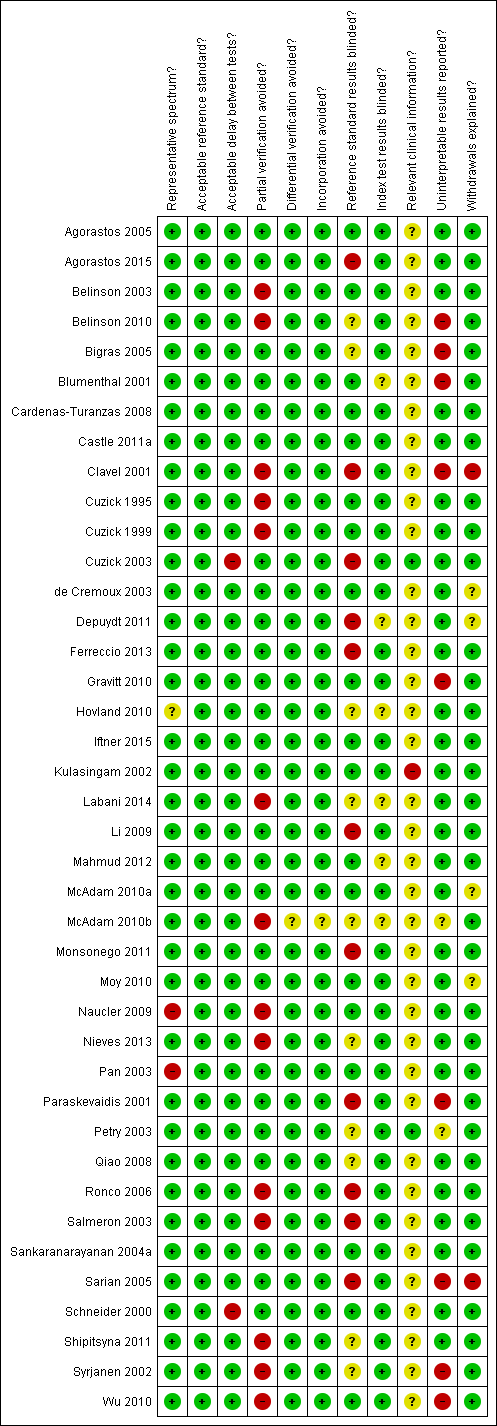
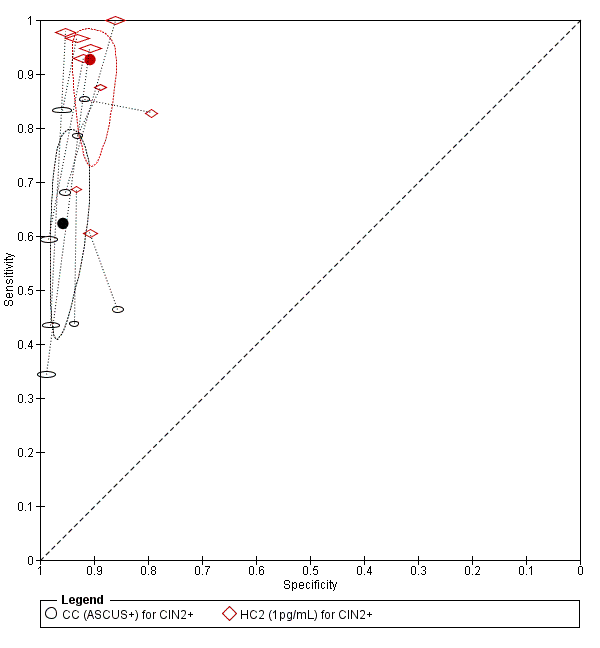
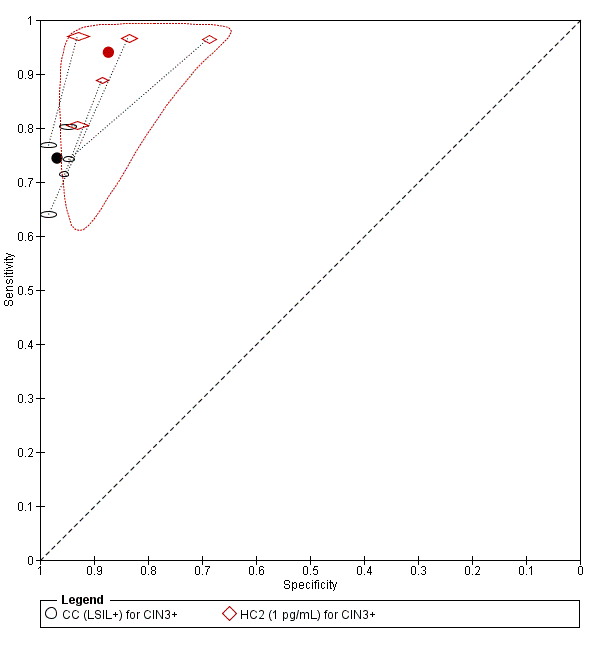
Marc Arbyn, Jolien Roelens, Cindy Simoens, Frank Buntinx, Evangelos Paraskevaidis, Pierre PL Martin-Hirsch, Walter J Prendiville | 28 marzo 2013
Esther van der Heijden, Alberto D Lopes, Andrew Bryant, Ruud Bekkers, Khadra Galaal | 6 enero 2015
Maria Kyrgioua, Ilkka Kallialaa, Anita Mitra, Christina Fotopoulou, Sadaf Ghaem-Maghami, Pierre PL Martin-Hirsch, Margaret Cruickshank, Marc Arbyna, Evangelos Paraskevaidisa | 26 enero 2017
Marc Arbyna, Lan Xua, Cindy Simoens, Pierre PL Martin‐Hirsch | 9 mayo 2018
Mario Cruciani, Carlo Mengoli, Rosemary Barnes, J Peter Donnelly, Juergen Loeffler, Brian L Jones, Lena Klingspor, Johan Maertens, Charles O Morton, Lewis P White | 3 septiembre 2019
Ali Kucukmetin, Ioannis Biliatis, Raj Naik, Andrew Bryant | 1 octubre 2013
Hanna Bergman, Brian S Buckley, Gemma Villanueva, Jennifer Petkovic, Chantelle Garritty, Vittoria Lutje, Alina Ximena Riveros‐Balta, Nicola Low, Nicholas Henschke | 22 noviembre 2019
Chumnan Kietpeerakool, Bandit Chumworathayi, Jadsada Thinkhamrop, Butsakorn Ussahgij, Pisake Lumbiganon | 21 enero 2017
George U Eleje, Ahizechukwu C Eke, Gabriel O Igberase, Anthony O Igwegbe, Lydia I Eleje | 19 marzo 2019
Nithya DG Ratnavelu, Andrew P Brown, Susan Mallett, Rob JPM Scholten, Amit Patel, Christina Founta, Khadra Galaal, Paul Cross, Raj Naik | 1 marzo 2016
Respuestas clínicas Cochrane
Jane Burch, Mohammed R Houda | 8 agosto 2020
Jane Burch, Mohammed R Houda | 8 agosto 2020