Citologija naspram HPV testiranja za probir na rak vrata maternice u općoj populaciji
Appendices
Appendix 1. Search strategy
MEDLINE (Pubmed):
((Uterine Cervical Neoplasms [MeSH Terms] OR Uterine Cervical Dysplasia [MeSH Terms] OR Cervical Intraepithelial Neoplasia [MeSH Terms] OR ((cervix [tw] OR cervical [tw] OR cervico* [tw]) AND (cancer* [tw] OR carcinoma OR adenocarcinoma OR neoplas* [tw] OR dysplas* [tw] OR dyskaryos* [tw] OR squamous [tw] OR CIN [tw] OR CINII* [tw] OR CIN2* [tw] OR CINIII* [tw] OR CIN3* [tw] OR SIL [tw] OR HSIL [tw] OR H‐SIL [tw] OR LSIL [tw] OR L‐SIL [tw] OR ASCUS [tw] OR AS‐CUS [tw])))
AND
(papillomaviridae [MeSH:NoExp] OR alphapapillomavirus [MeSH Terms] OR “DNA, viral” [MeSH Terms] OR Papillomavirus Infections [MeSH Terms] OR Tumor Virus Infections [MeSH Terms] OR “Cervix Uteri/virology” [MeSH Terms] OR HPV [tw] OR “human papillomavirus” [tw] OR papillomaviridae [tw] OR PCR OR “hybrid capture*” [tw] OR HC2 [tw] OR HCII [tw] OR “HC 2” [tw] OR “HC II” [tw] OR ((viral [tw] OR virolog* [tw]) AND (DNA [tw])))
AND
(Vaginal smears [MeSH Terms] OR Cytodiagnosis [MeSH Terms] OR Cell Transformation, Viral [MeSH Terms] OR Cytopathogenic Effect, Viral [MeSH Terms] OR ((pap [tw] OR papanicolaou [tw] OR vagina* [tw] OR cervical [tw] OR cervix [tw] OR cervico* [tw] OR cytolog* [tw]) AND (smear* OR test [tw] OR tests [tw] OR testing [tw] OR tested [tw] OR swab* OR scrap*))))
Embase (Ovid):
-
exp uterine cervix tumor/
-
exp uterine cervix dysplasia/
-
exp uterine cervix carcinoma in situ/
-
(cervi$ adj3 (cancer or carcinoma or adenocarcinoma or neoplasm$ or dysplas$ or dyskaryo$ or or squamous or CIN$ or HSIL or LSIL or ASCUS).mp.
-
or/1‐4
-
papillomaviridae/
-
exp alphapapillomavirus/
-
exp DNA, viral/
-
exp Papillomavirus Infections/
-
exp Tumor Virus Infections/
-
exp uterine cervix
-
HPV.mp.
-
human papillomavirus.mp.
-
papillomaviridae.mp.
-
PCR.mp.
-
hybrid capture$.mp.
-
HC2.mp.
-
HCII.mp.
-
HC 2.mp.
-
HC II.mp.
-
((viral or virology$) adj3 DNA).mp.
-
or/6‐21
-
exp Vaginal smears/
-
exp Cytodiagnosis/
-
exp Cell Transformation, Viral/
-
exp Cytopathogenic Effect, Viral/
-
((pap or papanicolaou or vagina$ or cervical or cervix or cervico$ or cytology$) adj3 (smear$ or test or tests or testing or tested or swab$ or scrap$)).mp.
-
or/ 23‐27
-
5 and 22 and 28
Appendix 2. Quality Assessment of Diagnostic test Accuracy Studies (QUADAS) items
-
Item 1 of the QUADAS tool (representative spectrum of participants) will be scored as 'yes' if the tests are done on a representative population of women attending cervical cancer screening within the age range 20‐70 not being followed up for cervical abnormalities. The item will be scored as 'no' if the majority of the population is outside this range and 'unclear' if there is not sufficient information. Studies with a case‐control design would score 'no' but they are excluded anyway from this review.
-
Item 2 of the QUADAS tool (selection criteria clearly described) will not be used as suggested in Chapter 9 of the Cochrane Handbook for Diagnostic Test Accuracy ReviewsReitsma 2009.
-
Item 3 of the QUADAS tool (acceptable reference standard) will be scored as 'yes' if the reference standard used is colposcopy with directed biopsies as minimum, or better yet by histological examination of the whole excised transformation zone. The item will be scored 'no' if the reference standard used is colposcopy alone without histology, and 'unclear' if there is not sufficient information.
-
Item 4 of the QUADAS tool (acceptable delay between tests) will be scored as 'yes' if the total interval between cytology, human papillomavirus (HPV) testing and verification with the reference standard was less than 12 weeks, as the status of the condition is unlikely to change within this time period. The item will be scored 'no' if the interval was equal to or more than 12 weeks, and 'unclear' if there is not sufficient information.
-
Item 5 of the QUADAS tool (partial verification avoided) will be scored as 'yes' if all women or at least a random sample of all women tested with cytology or HPV testing had disease status verification by the reference standard (colposcopy with directed biopsies) or when all women being positive for at least one screen test were verified together with a random sample of women being negative for all screen tests . The item will be scored 'no' if the selection of women who will receive verification is influenced by the results of the screening tests (i.e. if all screen‐positives are verified and not all screen‐negatives). The item will be scored as 'unclear' if there is not sufficient information.
-
Item 6 of the QUADAS tool (differential verification avoided) will be scored as 'yes' if all women who had disease status verification, had this done by the same method. The item will be scored 'no' if the method of verification differed between groups of participants, and 'unclear' if there is not sufficient information.
-
Item 7 of the QUADAS tool (incorporation avoided) will be scored as 'yes' if the reference standard used for disease status verification is not composed in any part by cervical cytology or HPV testing. A reference standard such as colposcopy would score 'yes'. If cytology is used as a reference standard the item will be scored as 'no', and 'unclear' if there is not sufficient information
-
Item 8 of the QUADAS tool (sufficient index test description) will not be used as suggested in Chapter 9 of the Cochrane Handbook for Diagnostic Test Accuracy ReviewsReitsma 2009.
-
Item 9 of the QUADAS tool (sufficient reference standard description) will not be used as suggested in Chapter 9 of the Cochrane Handbook for Diagnostic Test Accuracy ReviewsReitsma 2009.
-
Item 10 of the QUADAS tool (index test results blinded) will be scored as 'yes' if the cytologists and the technicians interpreting the Pap smear and the HPV test were not aware of the colposcopy/biopsy results. The item will be scored 'no' if they were made aware of the reference standard results prior to the interpretation of the screening tests, and 'unclear' if there is not sufficient information given in the text.
-
Item 11 of the QUADAS tool (reference standard results blinded) will be scored as 'yes' if the colposcopists and the pathologists were not aware of the cytology and HPV test results when interpreting the results of the reference standard. The item will be scored 'no' if either was aware of the screening test results (which is the case in clinical practice), and 'unclear' if there is not sufficient information in the text.
-
Item 12 of the QUADAS tool (relevant clinical information) will be scored as 'yes' if the cytologist was aware of the woman's basic history (age, symptoms, previous cervical surgery). If the cytologist was not aware the item will be scored 'no', and if this information is not given in the text it will be scored 'unclear'.
-
Item 13 of the QUADAS tool (un‐interpretable results reported) will be scored as 'yes' if the numbers of inadequate cytology and HPV test results are given. It will be scored 'no' if the numbers of inadequate tests are not given, and 'unclear' if it is not certain whether all test results have been reported.
-
Item 14 of the QUADAS tool (withdrawals explained) will be scored as 'yes' if it is clear what happened to all participants who entered the study, including the withdrawals. The item will be scored 'no' if it is not explained why no outcome could be obtained for some women, and if it is not clear whether all participants who entered the study were accounted for it will be scored 'unclear'.

Study flow diagram detailing the number of the initially retrieved articles and consequent exclusions
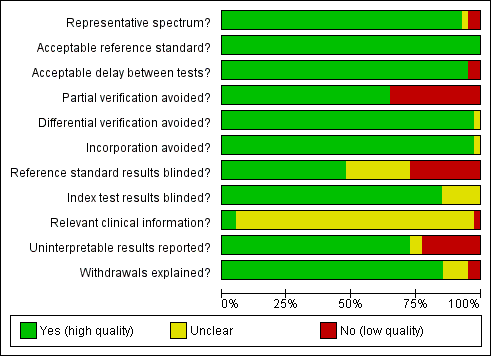
Methodological quality graph: review authors' judgements about each methodological quality item presented as percentages across all included studies
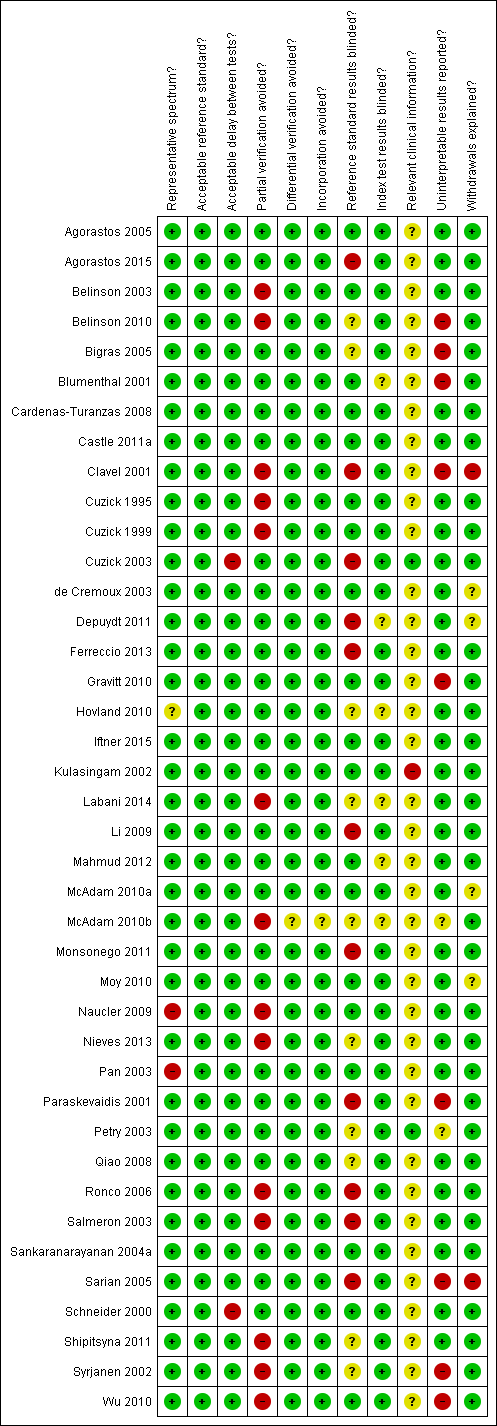
Methodological quality summary: review authors' judgements about each methodological quality item for each included study
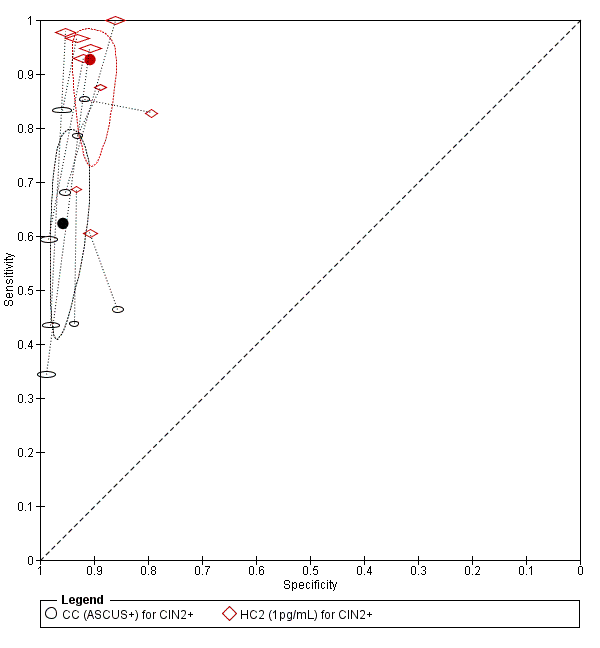
Summary ROC plot of 2 tests for detection of CIN 2+ (verified with histology): Conventional Cytology (ASCUS+) and HPV testing with hybrid capture 2 (1pg/mL). The black and red solid circles correspond to the summary estimates of sensitivity and specificity, and are shown with a 95% confidence region.

Summary ROC plot of 2 tests for detection of CIN 3+ (verified with histology): Conventional Cytology (CC) (ASCUS+) and HPV testing with hybrid capture (HC) 2 (1pg/mL). The black and red solid circles correspond to the summary estimates of sensitivity and specificity, and are shown with a 95% confidence region.

Summary ROC plot of 2 tests for detection of CIN 2+ (verified with histology): Conventional Cytology (CC) (LSIL+) and HPV testing with hybrid capture (HC) 2 (1pg/mL). The black and red solid circles correspond to the summary estimates of sensitivity and specificity, and are shown with a 95% confidence region.
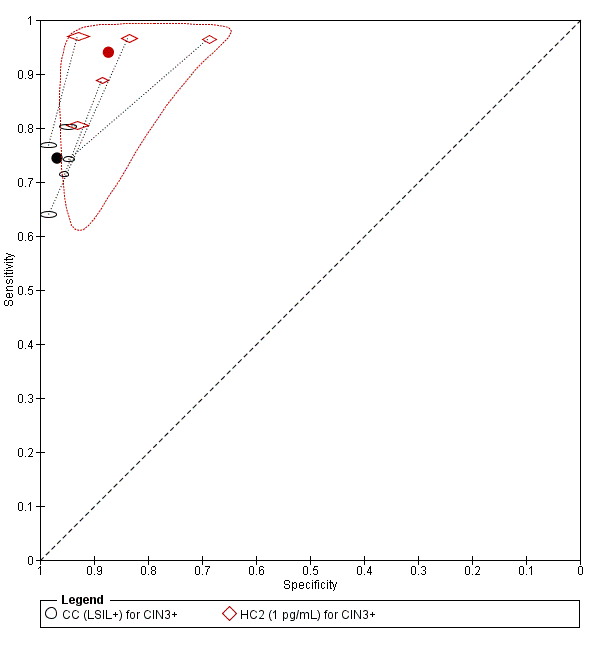
Summary ROC plot of 2 tests for detection of CIN 3+ (verified with histology): Conventional Cytology (CC) (LSIL+) and HPV testing with hybrid capture (HC) (1pg/mL). The black and red solid circles correspond to the summary estimates of sensitivity and specificity, and are shown with a 95% confidence region.

Summary ROC plot of 2 tests for detection of CIN 2+ (verified with histology): Liquid Based Cytology (LBC) (ASCUS+) and HPV testing with hybrid capture (HC) 2 (1pg/mL). The black and red solid circles correspond to the summary estimates of sensitivity and specificity, and are shown with a 95% confidence region.

Summary ROC plot of 2 tests for detection of CIN 3+ (verified with histology): Liquid Based Cytology (LBC) (ASCUS+) and HPV testing with hybrid capture (HC) 2 (1pg/mL). The black and red solid circles correspond to the summary estimates of sensitivity and specificity, and are shown with a 95% confidence region.

Summary ROC plot of 2 tests for detection of CIN 2+ (verified with histology): Liquid Based Cytology (LBC) (LSIL+) and HPV testing by hybrid capture (HC) 2 (1pg/mL). The black and red solid circles correspond to the summary estimates of sensitivity and specificity, and are shown with a 95% confidence region.

CC (ASCUS+) for CIN2+.
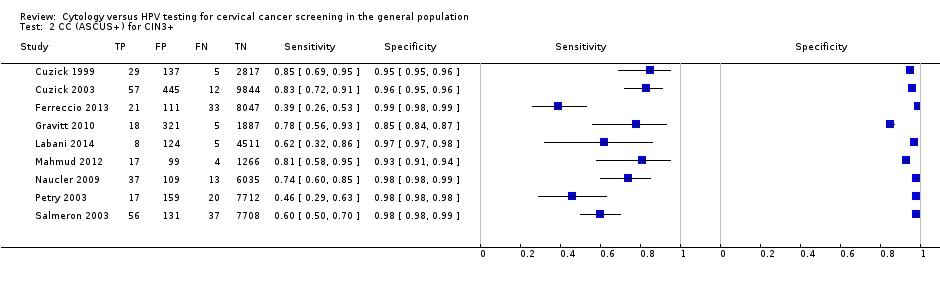
CC (ASCUS+) for CIN3+.
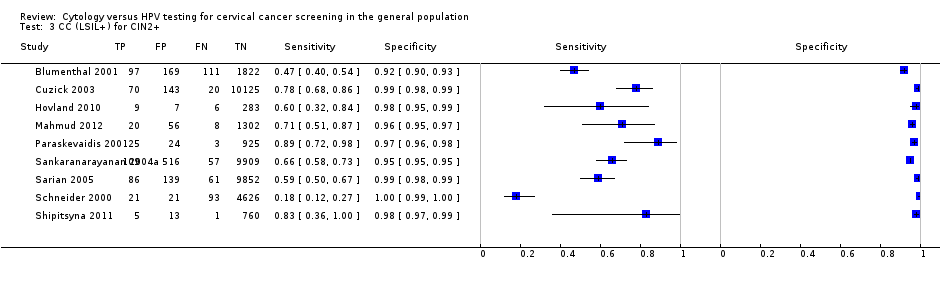
CC (LSIL+) for CIN2+.
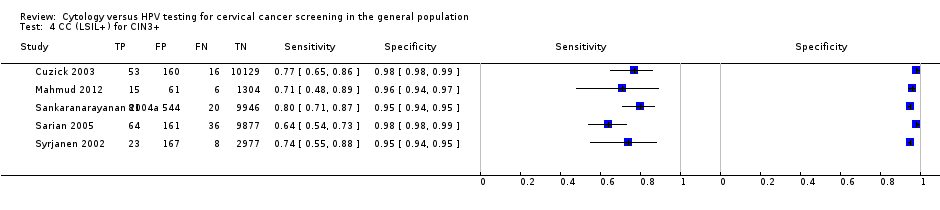
CC (LSIL+) for CIN3+.
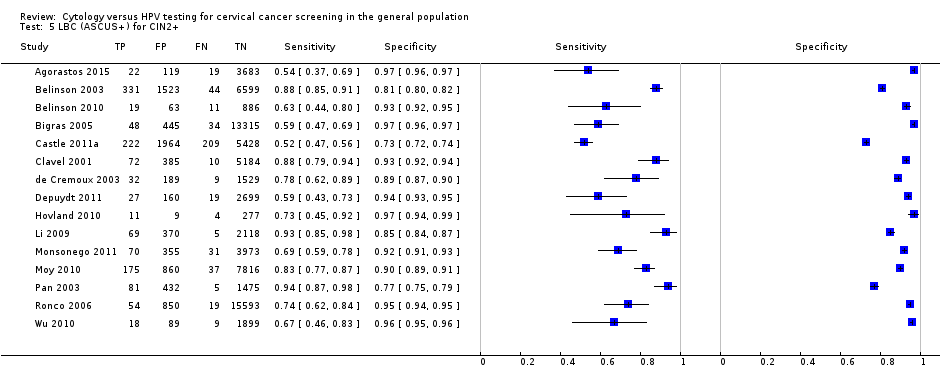
LBC (ASCUS+) for CIN2+.

LBC (ASCUS+) for CIN3+.
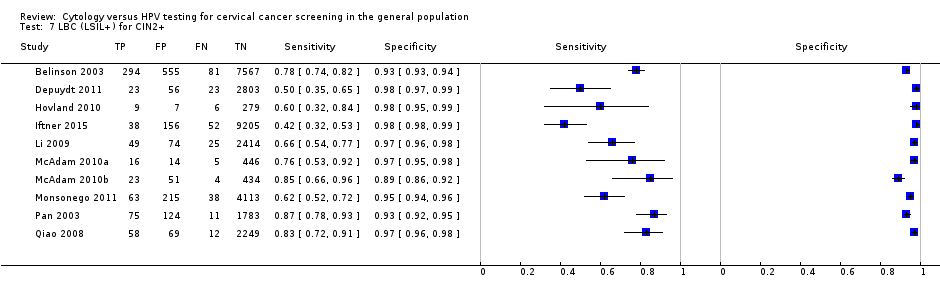
LBC (LSIL+) for CIN2+.
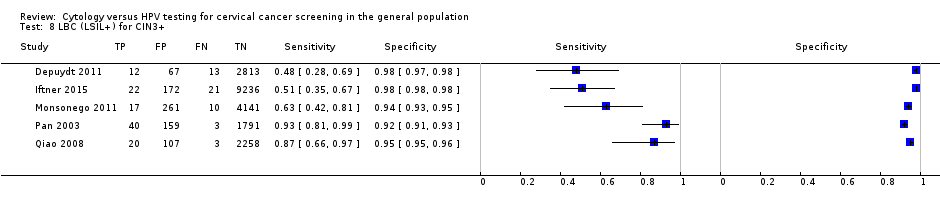
LBC (LSIL+) for CIN3+.

HC2 (1pg/mL) for CIN2+.

HC2 (1 pg/mL) for CIN3+.

HC2 (2 pg/mL) for CIN2+.

HC2 (2 pg/mL) for CIN3+.
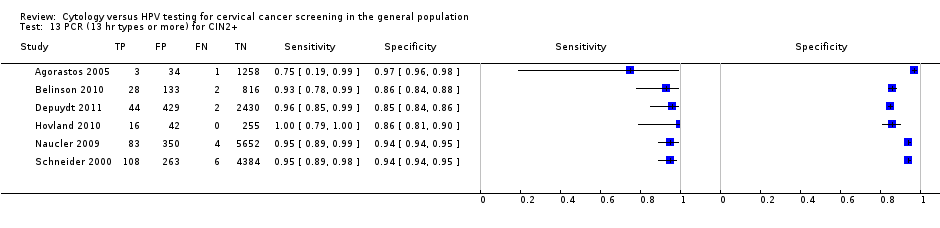
PCR (13 hr types or more) for CIN2+.
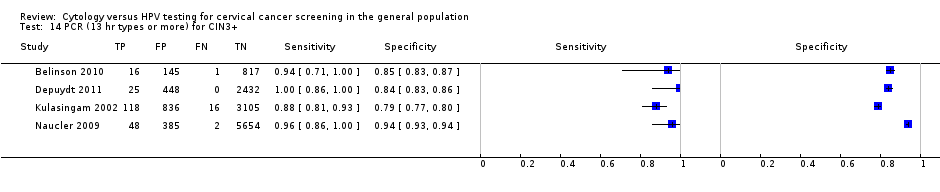
PCR (13 hr types or more) for CIN3+.

PCR (10‐11 hr types) for CIN2+.

PCR (10‐11 hr types) for CIN3+.

Aptima for CIN2+.
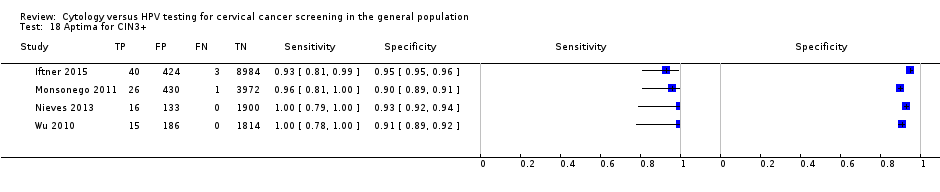
Aptima for CIN3+.

PCR (4 hr types) for CIN2+.
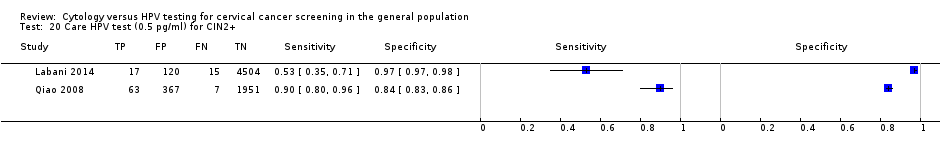
Care HPV test (0.5 pg/ml) for CIN2+.
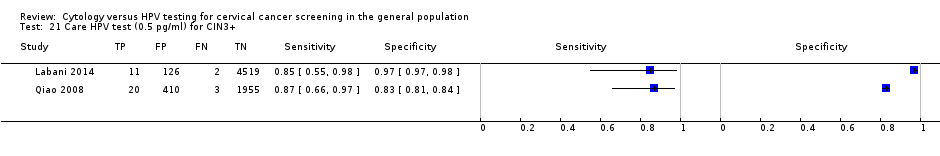
Care HPV test (0.5 pg/ml) for CIN3+.


NASBA (5 types) for CIN2+.

NASBA (9 types) for CIN2+.

HC2+4 (1 pg/ml) for CIN2+.

HC2+4 (1 pg/ml) for CIN3+.

HC2 (1pg/mL) for CIN2+ no verification bias.

CC or LBC (ASCUS+) for CIN2+ no verification bias.

HC2 (1pg/mL) for CIN2+ women >30.
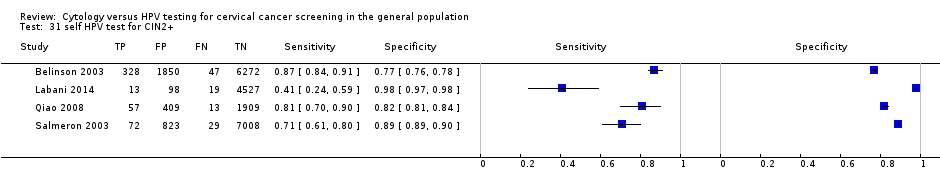
self HPV test for CIN2+.
| Human papillomavirus (HPV) compared to Papanicolaou (Pap) test for detection of cervical intraepithelial neoplasia (CIN 2+) in asymptomatic women | |||||
| Patient or population: adult asymptomatic women Settings: outpatient screening programmes New Test: HPV, HC2 test Cut‐off value: 1 pg/mL Comparison Test: Pap, liquid‐based cytology (LBC) test Cut‐off value: atypical squamous cells of undetermined significance (ASCUS) Reference Test: a colposcopy exam with or without biopsy as clinically indicated | |||||
| HPV | 138,230 women | Pooled sensitivity | 89.9% (88.6 to 91.1%) | Pooled specificity | 89.9% (89.7 to 90.0%) |
| Pap | 82,003 women | Pooled sensitivity | 72.9% (70.7 to 75%) | Pooled specificity | 90.3% (90.1 to 90.5%) |
| Test results | Number of results per 1000 women tested | Quality of the evidence | Comments | ||
| Prevalence of CIN 2+, 2%1 | |||||
| HPV | Pap | ||||
| True positives (TP) | 18 (18 to 18) | 15 (14 to 15) | ⊕⊕⊕⊝ | Women will be correctly classified and will receive further confirmatory testing or treatment | |
| TP absolute difference | 3 more | ||||
| False negatives (FN) | 2 (2 to 2) | 5 (5 to 6) | Women will be falsely reassured that they do not have CIN 2+, and the potentially beneficial treatment may be missed or will be delayed | ||
| FN absolute difference | 3 fewer | ||||
| True negatives (TN) | 881 (879 to 882) | 885 (883 to 887) | ⊕⊕⊕⊕ | Women will be correctly reassured that they do not have CIN 2+ | |
| TN absolute difference | 4 fewer | ||||
| False positives (FP) | 99 (98 to 101) | 95 (93 to 97) | Women will likely receive unnecessary further testing and possibly also unnecessary treatment; additionally further testing and unnecessary treatment may lead to adverse effects and use of resources without any health benefits | ||
| FP absolute difference | 4 more | ||||
| CI: Confidence interval; HPV human papillomavirus; Pap: Papanicolaou test, CIN: cervical intraepithelial neoplasia | |||||
| GRADE Working Group grades of evidence | |||||
| 1 Prevalence of 2% (20 women out of 1000) was assumed to be the average prevalence of cervical intraepithelial neoplasia 2+ in non HIV asymptomatic women. | |||||
| Test | Disease threshold | studies | Pooled sensitivity (95% CI) | Pooled specificity (95% CI) |
| CC (ASCUS+) | CIN 2+ | 16 | 65.87% (54.94 to 75.33) | 96.28% (94.72 to 97.39) |
| LBC (ASCUS+) | CIN 2+ | 15 | 75.51% (66.57 to 82.68) | 91.85% (88.43 to 94.32) |
| CC (LSIL+) | CIN 2+ | 9 | 62.84% (46.79‐76.50) | 97.73% (96.09‐98.70) |
| LBC (LSIL+) | CIN 2+ | 10 | 70.33% (59.73 to 79.11) | 96.20% (94.57 to 97.36) |
| HC2 (1 pg/mL) | CIN 2+ | 25 | 92.60% (99.45 to 95.30) | 89.30% (87.03 to 91.20) |
| PCR (> 12 types) | CIN 2+ | 6 | 95.13% (89.50 to 97.84) | 91.89% (83.79 to 96.13) |
| APTIMA | CIN 2+ | 3 | 92.66% (31.77 to 99.71) | 93.31% (47.30 to 99.54) |
| CC (ASCUS+) | CIN 3+ | 9 | 70.27% (57.87 to 80.30) | 96.67% (94.56 to 98.00) |
| LBC (ASCUS+) | CIN 3+ | 13 | 75.97% (64.72 to 84.49) | 91.19% (87.21 to 94.01) |
| CC (LSIL+) | CIN 3+ | 5 | 74.43% (67.81 to 80.10) | 96.86% (94.87 to 98.10) |
| LBC (LSIL+) | CIN 3+ | 5 | 71.91% (51.68 to 86.00) | 96.05% (93.53 to 97.60) |
| HC2 (1 pg/mL) | CIN 3+ | 19 | 96.50% (94.00 to 97.90) | 89.20% (86.70 to 91.30) |
| PCR (> 12 types) | CIN 3+ | 4 | 93.57% (69.90 to 98.91) | 86.49% (68.16 to 95.04) |
| APTIMA | CIN 3+ | 4 | 96.04% (72.91 to 99.54) | 92.80% (86.15 to 96.39) |
| Tests with fewer than three studies are not included in the table. | ||||
| Comparison | Disease threshold | Relative sensitivity (95% CI) | Relative specificity (95% CI) | Studies | Analysis number |
| HC2 vs CC (ASCUS+) | CIN 2+ | 1.52 (1.24 to 1.86) | 0.94 (0.92 to 0.96) | 9 | 1 |
| HC2 vs CC (ASCUS+) | CIN 3+ | 1.46 (1.12 to 1.91) | 0.95 (0.93 to 0.9) | 6 | 2 |
| PCR (> 12 types) vs CC (ASCUS+) | CIN 2+ | 1.37 (0.58 to 3.21) | 0.95 (0.76 to 1.19) | 3 | 5 |
| HC2 vs CC (LSIL+) | CIN 2+ | 1.28 (1.15 to 1.41) | 0.91 (0.87 to 0.95) | 6 | 7 |
| HC2 vs CC (LSIL+) | CIN 3+ | 1.22 (1.12 to 1.32) | 0.91 (0.87 to 0.95) | 5 | 8 |
| HC2 vs LBC (ASCUS+) | CIN 2+ | 1.18 (1.10 to 1.26) | 0.96 (0.95 to 0.97) | 10 | 11 |
| HC2 vs LBC (ASCUS+) | CIN 3+ | 1.17 (1.05 to 1.30) | 0.96 (0.95 to 0.98) | 8 | 12 |
| PCR (> 12 types) vs LBC (ASCUS+) | CIN 2+ | 1.53 (0.53 to 4.44) | 0.90 (0.89 to 0.92) | 3 | 15 |
| PCR (> 12 types) vs LBC (ASCUS+) | CIN 3+ | 1.47 (0.64 to 3.35) | 0.94 (0.8 to 1.09) | 3 | 16 |
| HC2 vs LBC (LSIL+) | CIN 2+ | 1.35 (1.19 to 1.53) | 0.92 (0.89 to 0.95) | 8 | 17 |
| HC2 vs LBC (LSIL+) | CIN 3+ | 1.30 (0.86 to 1.96) | 0.92 (0.8 to 1.00) | 4 | 18 |
| APTIMA vs LBC (ASCUS+) | CIN 3+ | 1.30 (0.49 to 3.41) | 0.98 (0.93 to 1.04) | 3 | 22 |
| Comparisons with fewer than three studies are not included in the table | |||||
| Comparison | Studies | Disease threshold | Relative sensitivity (95% CI) | Relative specificity (95% CI) |
| Age > 30 vs any age | 17 vs 20 | CIN 2+ | 1.13 (1.03 to 1.25) | 1.01 (0.98 to 1.04) |
| 13 vs 14 | CIN 3+ | 1.10 (1.02 to 1.19) | 1.04 (1.00 to 1.08) | |
| Increased vs low risk of verification bias | 17 vs 20 | CIN 2+ | 1.05 (0.95 to 1.16) | 1.00 (0.97 to 1.04) |
| 12 vs 15 | CIN 3+ | 1.09 (1.01 to 1.18) | 1.00 (0.96 to 1.05) | |
| High‐income vs middle‐/low‐income countries | 21 vs 16 | CIN 2+ | 1.01 (0.91 to 1.12) | 1.03 (1.00 to 1.07) |
| 13 vs 14 | CIN 3+ | 0.94 (0.87 to 1.02) | 1.01 (0.96 to 1.05) | |
| Assessed by bivariate random‐effects meta‐analysis including one covariate each time. | ||||
| Test | No. of studies | No. of participants |
| 1 CC (ASCUS+) for CIN2+ Show forest plot | 16 | 61099 |
| 2 CC (ASCUS+) for CIN3+ Show forest plot | 9 | 51857 |
| 3 CC (LSIL+) for CIN2+ Show forest plot | 9 | 41494 |
| 4 CC (LSIL+) for CIN3+ Show forest plot | 5 | 35648 |
| 5 LBC (ASCUS+) for CIN2+ Show forest plot | 15 | 82003 |
| 6 LBC (ASCUS+) for CIN3+ Show forest plot | 13 | 71919 |
| 7 LBC (LSIL+) for CIN2+ Show forest plot | 10 | 33519 |
| 8 LBC (LSIL+) for CIN3+ Show forest plot | 5 | 21166 |
| 9 HC2 (1pg/mL) for CIN2+ Show forest plot | 25 | 138230 |
| 10 HC2 (1 pg/mL) for CIN3+ Show forest plot | 19 | 120380 |
| 11 HC2 (2 pg/mL) for CIN2+ Show forest plot | 2 | 26768 |
| 12 HC2 (2 pg/mL) for CIN3+ Show forest plot | 2 | 26768 |
| 13 PCR (13 hr types or more) for CIN2+ Show forest plot | 6 | 16343 |
| 14 PCR (13 hr types or more) for CIN3+ Show forest plot | 4 | 14048 |
| 15 PCR (10‐11 hr types) for CIN2+ Show forest plot | 2 | 3965 |
| 16 PCR (10‐11 hr types) for CIN3+ Show forest plot | 1 | 2988 |
| 17 Aptima for CIN2+ Show forest plot | 3 | 15895 |
| 18 Aptima for CIN3+ Show forest plot | 4 | 17944 |
| 19 PCR (4 hr types) for CIN2+ Show forest plot | 1 | 1985 |
| 20 Care HPV test (0.5 pg/ml) for CIN2+ Show forest plot | 2 | 7044 |
| 21 Care HPV test (0.5 pg/ml) for CIN3+ Show forest plot | 2 | 7046 |
| 22 Cobas for CIN2+ Show forest plot | 2 | 11666 |
| 23 Cobas for CIN3+ Show forest plot | 2 | 11666 |
| 24 NASBA (5 types) for CIN2+ Show forest plot | 1 | 313 |
| 25 NASBA (9 types) for CIN2+ Show forest plot | 1 | 313 |
| 26 HC2+4 (1 pg/ml) for CIN2+ Show forest plot | 1 | 1352 |
| 27 HC2+4 (1 pg/ml) for CIN3+ Show forest plot | 1 | 1352 |
| 28 HC2 (1pg/mL) for CIN2+ no verification bias Show forest plot | 12 | 53013 |
| 29 CC or LBC (ASCUS+) for CIN2+ no verification bias Show forest plot | 8 | 31341 |
| 30 HC2 (1pg/mL) for CIN2+ women >30 Show forest plot | 13 | 69334 |
| 31 self HPV test for CIN2+ Show forest plot | 4 | 23474 |