Antipsicóticos atípicos para los trastornos de conducta desestabilizantes en niños y jóvenes
Información
- DOI:
- https://doi.org/10.1002/14651858.CD008559.pub3Copiar DOI

- Base de datos:
-
- Cochrane Database of Systematic Reviews
- Versión publicada:
-
- 09 agosto 2017see what's new
- Tipo:
-
- Intervention
- Etapa:
-
- Review
- Grupo Editorial Cochrane:
-
Grupo Cochrane de Problemas de desarrollo, psicosociales y de aprendizaje
- Copyright:
-
- Copyright © 2017 The Cochrane Collaboration. Published by John Wiley & Sons, Ltd.
Cifras del artículo
Altmetric:
Citado por:
Autores
Contributions of authors
Jik Loy, Sally Merry and Sarah Hetrick prepared the protocol.
Jik Loy, Sally Merry, Chohye Park and Sarah Hetrick revised the protocol.
Jik Loy and Karolina Stasiak did the data collection and extraction in the 2012 and 2016 reviews.
Jik Loy, Sally Merry, Sarah Hetrick and Karolina Stasiak contributed to the data analysis in the 2012 and 2016 reviews.
Jik Loy, Sally Merry, Sarah Hetrick and Karolina Stasiak contributed to the writing in the 2012 and 2016 reviews.
Jik Loy is the guarantor for the review.
Sources of support
Internal sources
-
Waikato District Health Board, New Zealand.
Provision of time and release from other clinical responsibilities for the first author.
External sources
-
None requested, Other.
Declarations of interest
Jik H Loy is a co‐investigator on a Health Research Grant (grant number 13/331) to evaluate the effectiveness of a modular, psychosocial intervention — Modular Approach to Treatment of Children ‒ Anxiety, Depression,Trauma and Conduct (MATCH‐ADTC) — in secondary mental health services for children and adolescents. It is unrelated to this review.
Sally N Merry (SM) is a board member for the International Society for Research in Internet Interventions, which is an unpaid position. SM is a consultant on a psychosocial intervention being carried out as an addition to a trial on antidepressant medication being carried out at Cambridge University. SM declares that both positions are unrelated to this review. SM is a co‐developer of SPARX — an online cognitive behavioural therapy for adolescents with depression. The intellectual property belongs to Uniservices Ltd Auckland (the commercial arm of the University of Auckland) and if SPARX were commercialised, SM stands to gain financially. SM is a Principal Investigator on the Health Research Grant (grant number 13/331) to evaluate the effectiveness of a modular psychosocial intervention (MATCH‐ADTC) in secondary mental health services for children and adolescents. It is unrelated to this review. SM is a co‐investigator with Karolina Stasiak on a project funded by the Ministry of Business, Innovation and Employment (MBIE) to develop and trial an e‐health platform to deliver interventions for common mental health problems in adolescence. SM declares this project is not related to this review.
Sarah E Hetrick's (SEH) institution receives funds from the Federal Government of Australia and the Colonial Foundation for this review update. SH received a Clinical Training Fellowship from the Australian National Health and Medical Research Council, which supports research focused on implementation of evidence for youth depression. She is a named investigator on several randomised controlled trials (RCTs) funded by the Australian National Health and Medical Research Council, but none are related to this review.
Karolina Stasiak (KS) is Senior Research Fellow at the Department of Psychological Medicine at the University of Auckland, where is she involved in applied research in the area of child, youth and family mental health. KS is a co‐developer of SPARX ‐ an online cognitive behavioural therapy for adolescents with depression. The intellectual property belongs to Uniservices Ltd Auckland (the commercial arm of the University of Auckland) and if SPARX were commercialised, KS stands to gain financially. In addition, KS is a co‐investigator with Sally Merry on a project funded by the MBIE to develop and trial an e‐health platform to deliver interventions for common mental health problems in adolescence. KS is also a co‐investigator in the Health Research Grant (grant number 13/331), to evaluate the effectiveness of a modular psychosocial intervention (MATCH‐ADTC) in secondary mental health services for children and adolescents, and a co‐investigator on a project funded by the Oakley Mental Health Foundation & Starship Foundation, to develop and evaluate an e‐health intervention to support psychological needs of children living with long‐term physical illness. KS is a co‐principal investigator on an open trial, funded by the Oakley Mental Health Foundation, to test the feasibility of an internet‐based cognitive behavioural therapy self‐help resource for children and adolescents in the aftermath of Christchurch earthquakes. KS has also worked on two projects funded by the Counties Manukau District Health Board to evaluate an intensive parenting programme for parents experiencing significant parenting problems with infants and young children. KS declares that none of these projects are related to this review. In the interests of transparency, KS declares travel grants from the Auckland Medical Research Foundation, to present a paper at the fifth European Conference on Positive Psychology; and the Maurice Phyllis Paykel Trust, to present a paper at the fifth European Conference on Positive Psychology.
Acknowledgements
The authors wish to thank Anne Wilson, from the University of Auckland, for assistance with search strategies. We wish to thank the authors who replied to our correspondences, including Professor Aman, Nicole Brown, Dr Hennighausen, Professor Schulz, Professor Connor, Dr Danielle Coppola and Dr Magali Haas from Johnson and Johnson for queries on Van Bellinghen 2001, Aman 2002, Snyder 2002, Reyes 2006a, Connor 2008, Fleischhaker 2011 and the TOSCA study. We also thank our colleague Chohye Park for her contribution to the protocol (Loy 2012). The first author also want to acknowledge Associate Professor David Menkies for his encouragement in the early days. We would also like to thank the authors of the studies included in this review who have provided additional data and comments in response to our requests for information. We want to thank Dr Joanne Wilson, Managing Editor, Cochrane, for her helpful suggestions.
Version history
| Published | Title | Stage | Authors | Version |
| 2017 Aug 09 | Atypical antipsychotics for disruptive behaviour disorders in children and youths | Review | Jik H Loy, Sally N Merry, Sarah E Hetrick, Karolina Stasiak | |
| 2012 Sep 12 | Atypical antipsychotics for disruptive behaviour disorders in children and youths | Review | Jik H Loy, Sally N Merry, Sarah E Hetrick, Karolina Stasiak | |
| 2010 Jun 16 | Atypical antipsychotics for disruptive behavioural disorders in inpatient or outpatient children and youths | Protocol | Jik H Loy, Sally N Merry, Chohye Park, Sarah E Hetrick | |
Differences between protocol and review
-
Methods. Types of participants. For clarity, we added that:
-
a diagnosis of a disruptive behaviour disorder must have been established "using criteria from either the Diagnostic and and Statistical Manual of Mental Disorders (DSM; American Psychiatric Association 2000; American Psychiatric Association 2013) or International Statistical Classification of Diseases and Related Health Problems (ICD; WHO 2016)"; and
-
we excluded studies where participants had a comorbid diagnosis of autism spectrum disorder (ASD), because "there are other reviews dealing with atypical antipsychotics in ASD such as the recently updated review by Hirsch 2016".
-
-
Methods. Types of interventions. For clarity, we added that: "Trials including a combination of atypical antipsychotics combined with other medications or psychosocial interventions, or both, were also eligible. No duration of treatment was specified a priori."
-
Methods. Types of outcome measures. Primary outcomes.
-
We deleted the following text, which was in our original protocol: "Steiner 2007 ranked some of the above scales in three categories: Excellent psychometric properties: cohesion, convergent, discriminant and predictive validity had all been tested in representative samples. Good psychometric properties: as above, but studies had one or two criteria missing. Adequate psychometric properties: more than two of the criteria listed above were not met but the scale was conceptually interesting or particularly suitable for clinical practice."
-
We added the following paragraph: "For clinical and statistical reasons, it is usually necessary to obtain information that covers behaviour in different settings, including home and school, from different informants (Verhulst 2002). Both observer and self‐rated rating scales are used. Parents observe variations in behaviour across multiple situations while teachers note deviation from peers in the school setting (Myers 2002). Generally, for externalising problems, there is greater inter‐rater consistency between parent and teacher informants. (Clay 2008). For self reports, while children and adolescents can be reliable and valid self reporters, and may useful for some difficult to observe behaviour such as stealing, there are potential limitations. These include children and youth's linguistic skills, presence of learning difficulties, self reflection skills, ability to monitor one's behaviour and risks of under‐reporting undesirable behaviour or to respond in a socially desirable manner (Myers 2002; Collett 2003). For these reasons, observer‐rated data were preferable to self‐rated data for this review. If several measures of the same outcome were available, we selected the measure used as the primary outcome in a given trial."
-
-
Methods. Types of outcome measures. Secondary outcomes. General functioning. We used the Clinical Global Impression ‒ Severity scale (CGI‐S; Rapoport 1985) as a very indirect approximation of functioning, as no data were available for CGAS.
-
Methods. Selection of studies. We reported that we recorded our decisions in a PRISMA diagram (Moher 2009).
-
Methods. Assessment of heterogeneity. We specified that: "We also reported Tau² ‒ an estimate of between‐study variance" in the updated review.
-
Methods. 'Summary of findings'. We included a 'Summary of findings' section to reflect the updated Cochrane guidelines. This information is summarised in summary of findings Table for the main comparison.
-
Methods. Sensitivity analysis. We did not exclude trials with 'no' or 'unclear' ratings for allocation concealment because we identified a limited number of trials. This method has been archived for use in future updates of this review. Please refer to our protocol (Loy 2010) and Table 1.
-
Results. Effects of interventions. In the previous version of this review, we pooled data on quetiapine and risperidone in meta‐analyses on aggression and conduct disorders (see analysis 1.2 and 1.4, respectively, in Loy 2012). To be consistent with our objective, which states that we will evaluate each drug separately (as opposed to assessing the class effect), we removed this study, Connor 2008, from these analyses in this version of the review. Thus, this version of the review reports the effects of risperidone only versus placebo.
Keywords
MeSH
Medical Subject Headings (MeSH) Keywords
- Aggression [*drug effects];
- Antipsychotic Agents [adverse effects, *therapeutic use];
- Anxiety Disorders [drug therapy];
- Attention Deficit and Disruptive Behavior Disorders [*drug therapy];
- Attention Deficit Disorder with Hyperactivity [drug therapy];
- Conduct Disorder [drug therapy];
- Depressive Disorder, Major [drug therapy];
- Dibenzothiazepines [adverse effects, *therapeutic use];
- Piperazines [*therapeutic use];
- Quetiapine Fumarate [*therapeutic use];
- Randomized Controlled Trials as Topic;
- Risperidone [adverse effects, *therapeutic use];
- Thiazoles [*therapeutic use];
- Weight Gain;
Medical Subject Headings Check Words
Adolescent; Child; Child, Preschool; Humans;
PICO
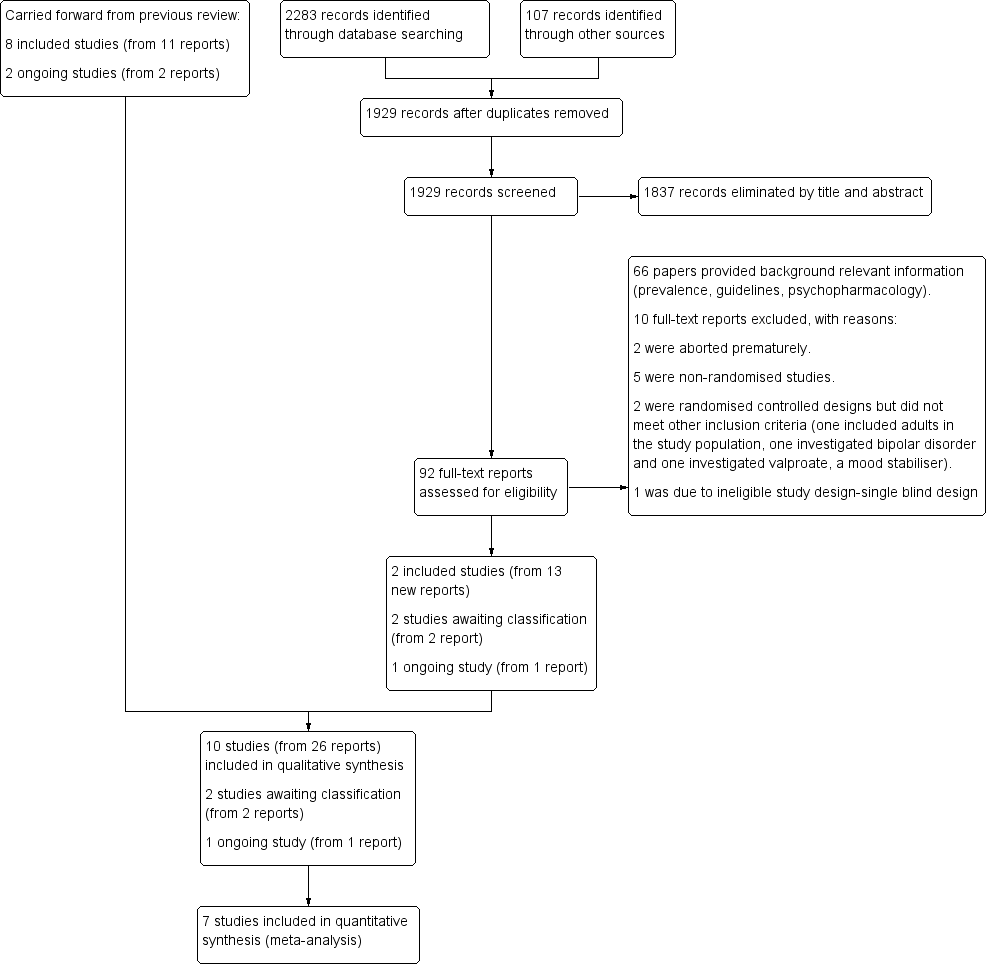
study flow diagram
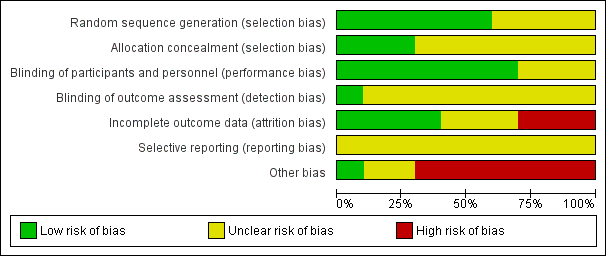
Risk of bias graph: review authors' judgements about each risk of bias item presented as percentages across all included studies.
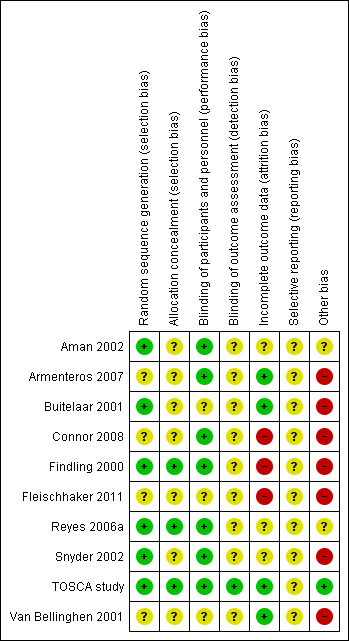
Risk of bias summary: review authors' judgements about each risk of bias item for each included study.
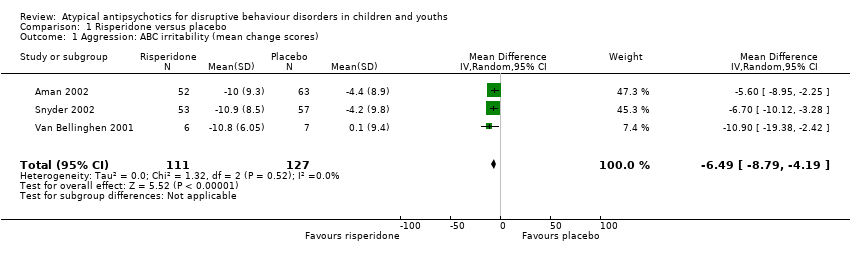
Comparison 1 Risperidone versus placebo, Outcome 1 Aggression: ABC irritability (mean change scores).

Comparison 1 Risperidone versus placebo, Outcome 2 Aggression: OAS‐M, ABS Reactive subscale (final scores).

Comparison 1 Risperidone versus placebo, Outcome 3 Aggression: OAS‐M, ABS Proactive subscale (final scores).

Comparison 1 Risperidone versus placebo, Outcome 4 Conduct: NCBR‐CP (mean change scores).

Comparison 1 Risperidone versus placebo, Outcome 5 Weight gain (antipsychotic only): Kg (mean change scores).

Comparison 1 Risperidone versus placebo, Outcome 6 Weight gain (antipsychotic and stimulant): Kg (mean change scores).
| Risperidone compared to placebo for disruptive behaviours in children and youths | ||||||
| Patient or population: Disruptive behaviours in children and youths | ||||||
| Outcomes | Anticipated absolute effects* (95% CI) | Relative effect | № of participants | Quality of the evidence | Comments | |
| Risk with placebo | Risk with risperidone | |||||
| Aggression | The mean aggression ABC‐I score ranged across control groups from −4.40 to 0.10 | The mean aggression ABC‐I score in the intervention groups was, on average, 6.49 lower (8.79 lower to 4.19 lower) | ‐ | 238 | ⊕⊕⊝⊝ | Included studies: Aman 2002; Snyder 2002; Van Bellinghen 2001 |
| Aggression | The mean aggression OAS‐M and ABS Proactive score ranged across control groups from 8.10 to 15.10 | The mean aggression OAS‐M and ABS Proactive score in the intervention groups was, on average, 1.12 lower (2.30 lower to 0.06 higher) | ‐ | 190 | ⊕⊕⊕⊝ | Included studies: Buitelaar 2001; TOSCA study |
| Conduct | The mean conduct score ranged across control groups from −6.20 to 25.80 | The mean conduct score in the intervention groups was, on average, 8.61 lower (11.49 lower to 5.74 lower) | ‐ | 225 | ⊕⊕⊕⊝ | Included studies: Aman 2002; Snyder 2002 |
| Weight gain (treatment with antipsychotic only) | The mean weight gain (treatment with antipsychotic only) score in the control groups ranged from 0.74 to 0.90 | The mean weight gain score in the intervention groups was, on average, 2.37 higher (0.26 higher to 4.49 higher) | ‐ | 138 | ⊕⊕⊕⊝ | Included studies: Aman 2002; Findling 2000 |
| Weight gain (treatment with antipsychotic and stimulant) | The mean weight gain (treatment with antipsychotic and stimulant) score in the control groups ranged from −1.20 to 0.90 | The mean weight gain score in the intervention groups was, on average, 2.14 higher (1.04 higher to 3.23 higher) | ‐ | 305 | ⊕⊕⊝⊝ | Included studies: Aman 2002; Findling 2000; TOSCA study |
| *The risk in the intervention group (and its 95% confidence interval) is based on the assumed risk in the comparison group and the relative effect of the intervention (and its 95% CI). ABS: Antisocial Behavior Scale;CI: Confidence interval; MD: Mean difference;OAS: Overt Aggression Scale;OAS‐M: Overt Aggression Scale ‒ Modified; RCT: Randomised controlled trial; SMD: Standardized mean difference | ||||||
| GRADE Working Group grades of evidence | ||||||
| 1 Downgraded 2 levels because of unclear risk of bias due to lack of information on selection bias and detection bias in 2 studies, and unclear risk of bias due to lack of information and poor reporting standards in 1 study. 2 trials assessed outpatients, 1 trial assessed patients in residential care. 2 Unclear allocation concealment and unclear blinding of outcome assessment for 1 study and potential reporting bias in both studies. 3 Downgraded 1 level because of unclear allocation concealment and unclear blinding of outcome assessment for both studies and unclear attrition and potential reporting bias. 4 Downgraded 1 level because of unclear blinding of outcome assessment and potential reporting bias. Heterogeneity: Tau² = 2.22; Chi² = 20.77, df = 1 (P < 0.00001); I² = 95%. 5 Downgraded 2 levels because of unclear blinding of outcome assessment in 2 studies, potential reporting bias in 3 studies, and potential attrition bias in 2 studies. Heterogeneity: Tau² = 0.85; Chi² = 23.32, df = 2 (P < 0.00001); I² = 91%. | ||||||
| Analysis | Method |
| Measures of treatment effect | For dichotomous data, we planned to analyse data on the intention‐to‐treat principle with dropouts included in the analysis. Out of the 10 studies, 1 used dichotomous outcomes (Armenteros 2007), therefore we were not able to perform further analyses. |
| Unit of analysis issues | For cross‐over trials, we planned to do paired analysis if data were presented. Otherwise, we planned to take all measurements from intervention periods and all measurements from control periods and analyse these as if the trial was a parallel‐group trial, acknowledging that there might be unit of analysis errors that could underestimate the precision of the estimate of the treatment effect (Deeks 2011). However, no cross‐over trials were identified. Also, there were no cluster‐randomised controlled trials, so we did not have to take this into account in our analyses. |
| Dealing with missing data ‒ missing participants | We intended to calculate the best‐ and worst‐case scenarios for the clinical response outcome, if possible. For example, the best‐case scenario assumed that dropouts in the intervention group had positive outcomes and those in the control group had negative outcomes. In the worst‐case scenario, dropouts in the intervention group had negative outcomes and those in the control group had positive outcomes. |
| Assessment of heterogeneity | Chapter 9 in the Cochrane Handbook recommends using a range for I² and a guide to interpretation (Deeks 2011). Had we found either moderate heterogeneity (I² in the range of 30% to 60%) or substantial heterogeneity (I² in the range of 50% to 90%), as specified in our protocol (Loy 2010), we planned to examine it using specified subgroup and sensitivity analyses (see Subgroup analysis and investigation of heterogeneity and Sensitivity analysis). |
| Assessment of reporting bias | We intended to draw funnel plots (effect size versus standard error) to assess publication bias if sufficient studies were found. Asymmetry of the plots may indicate publication bias, although they may also represent a true relationship between trial size and effect size. If such a relationship were identified, we planned to examine the clinical diversity of the studies as a possible explanation (Egger 1997). There were insufficient studies in our meta‐analysis to perform a funnel plot. |
| Subgroup analysis and investigation of heterogeneity | It was our intention to conduct separate analyses on the following subgroups, where possible.
There were too few studies in any of the analyses for us to carry out any subgroup analyses. |
| Sensitivity analysis | We intended to perform sensitivity analyses to explore whether the results of the review were robust in relation to certain study characteristics. We intended to exclude trials with 'no' or 'unclear' ratings for allocation concealment and use the fixed‐effect model for our primary outcome. We identified a limited number of trials and we did not exclude any of them based on the ratings of allocation concealment. We were not able to carry out a sensitivity analysis due to the small number of trials. |
| ADHD: attention deficit hyperactivity disorder | |
| Name of rating scale | Description | Construction | Study | Source of Information used in the study |
| Aberrant Behaviour Checklist (ABC) (Aman 1985a; Aman 1985b) | Symptom checklist for assessing problem behaviours of children and adults with mental retardation. It is also used for classifying problem behaviours of children and adolescents with mental retardation. | 58 items, 5 scales.
| Parent/caregiver | |
| Child Behaviour Checklist (CBCL) (Achenbach 1991)
| Checklist for evaluating maladaptive behavioural and emotional problems. | 113 items, 8 subscales.
| Parent | |
| Overt Aggression Scale (OAS) (Yudofsky 1986) | Assesses the severity and frequency of overt aggression. | 25 items, 4 subscales.
Within each category, aggressive behaviour is rated according to its severity. | Parent | |
| Overt Aggression Scale ‒ Modified (OAS‐M) (Kay 1988) | Assesses the severity and frequency of overt aggression. | 20 items, 4 subscales.
5‐point interval scale that represents increasing level of aggression. The total aggression score is obtained by multiplying the 4 individual scales by weights of 1, 2, 3 or 4 and then summing the 4 weighted scores. | Nurse or teacher | |
| Rating of aggression against people and/or property scale (RAAP) (Kemph 1993) | ‐ | Global rating scale, 1 item. Scored from 1 (no aggression reported) to 5 (intolerable behaviour). | Clinician | |
| Children's Aggression Scale ‒ Parent (CAS‐P; Halperin 2002) and Teacher (CAS‐T; Halperin 2003) | Retrospectively measures the frequency and severity of 4 categories of aggression: verbal aggression; aggression against objects and animals; provoked physical aggression; and initiated physical aggression | Respondents (parents/guardians and teachers) complete a Likert scale to evaluate the frequency of an act. The frequency of aggressive events is multiplied by its designated severity weight factor and then summed to yield a total score. | Parent and teacher | |
| Antisocial Behavior Scale (ABS) Proactive and Reactive Subscales (Brown 1996) | Instrument used to differentiate reactive/affective from proactive subtypes of aggression | 28 items. Proactive Aggression subscale: 5 proactive items and 5 covert antisocial items. Reactive Aggression subscale: 6 items. | Parent |
| Name of rating scale | Description | Construction | Study | Source of information used in the study |
| Conners' Parent Rating Scale (CPRS) (Conners 1989) | Checklist for assessing behavioural and emotional difficulties. | 48 items, 6 subscales.
| Parent | |
| Nisonger Child Behaviour Rating Form (NCBRF) (Aman 1996; Tassé 1996) | Assesses behaviour of children and adolescents with intellectual disability or autism spectrum disorders, or both. | 76 items, 8 subscales.
| Parent | |
| Nisonger Child Behavior Rating Form ‒ Typical IQ D‐Total (includes conduct problems and oppositional subscales) | Typical IQ version: assesses behaviour of children and adolescents with normal IQ. | 10 items, 1 prosocial subscale.
54 items, 6 problem behaviour subscales.
| Parent | |
| IQ: intelligence quotient. | ||||
| Study ID | General | Neurological | Gastrointestinal | Respiratory | Cardiovascular/Metabolic | Serious adverse event (unspecified) | Other |
| (risperidone = 12, placebo = 13) |
|
|
| ‐ | Not reported | ‐ | ‐ |
| (risperidone = 19, placebo = 19) |
|
|
|
| Not reported | ‐ | ‐ |
| (quetiapine = 9, placebo = 10) |
|
| ‐ | ‐ | No differences across groups found on ECG QRS or QTc intervals. | ‐ | ‐ |
| (risperidone = 10, placebo = 10) |
| ‐ |
| ‐ | No clinically significant changes in ECG. | ‐ |
|
| (risperidone = 6, placebo = 7) | No side effects reported in any category. | ‐ | ‐ | ‐ | ‐ | ‐ | ‐ |
| (risperidone = 55, placebo = 63) |
|
|
|
|
| ‐ | ‐ |
| (risperidone = 172, placebo = 163) |
|
|
|
|
|
| ‐ |
| (risperidone = 53, placebo = 57) |
|
|
|
|
|
|
|
| (risperidone = 73, placebo = 80) |
|
|
|
|
| ‐ |
|
| (ziprasidone = 25, placebo = 25) |
|
|
|
|
|
|
|
| Bpm: beats per minute; ECG: electrocardiogram; URTI: upper respiratory tract infection; EPSE: Extrapyramidal side effects; QRS: the name for the 3 waves (Q wave, R wave and S wave) on an electrocardiogram; QTc: correct QT (start of Q wave to end of T wave) interval | |||||||
| Outcome or subgroup title | No. of studies | No. of participants | Statistical method | Effect size |
| 1 Aggression: ABC irritability (mean change scores) Show forest plot | 3 | 238 | Mean Difference (IV, Random, 95% CI) | ‐6.49 [‐8.79, ‐4.19] |
| 2 Aggression: OAS‐M, ABS Reactive subscale (final scores) Show forest plot | 2 | 190 | Mean Difference (IV, Random, 95% CI) | ‐1.30 [‐2.21, ‐0.40] |
| 3 Aggression: OAS‐M, ABS Proactive subscale (final scores) Show forest plot | 2 | 190 | Mean Difference (IV, Random, 95% CI) | ‐1.12 [‐2.30, 0.06] |
| 4 Conduct: NCBR‐CP (mean change scores) Show forest plot | 2 | 225 | Mean Difference (IV, Random, 95% CI) | ‐8.61 [‐11.49, ‐5.74] |
| 5 Weight gain (antipsychotic only): Kg (mean change scores) Show forest plot | 2 | 138 | Mean Difference (IV, Random, 95% CI) | 2.37 [0.26, 4.49] |
| 6 Weight gain (antipsychotic and stimulant): Kg (mean change scores) Show forest plot | 3 | 305 | Mean Difference (IV, Random, 95% CI) | 2.14 [1.04, 3.23] |