治疗儿童和青少年破坏性品行障碍的非典型抗精神病药物
Abstract
研究背景
这是基于最近2012年(Loy2012)发表的原始Cochrane综述的更新版本。患有破坏性品行障碍的儿童及青少年可能求助于为他们提供非典型抗精神病药物的健康医疗部门。非典型抗精神病药物治疗破坏性品行障碍的用量在增长。
研究目的
目的是评估非典型抗精神病药物与安慰剂相比治疗儿童及青少年破坏性品行障碍的疗效和安全性。其目的是由于每一种非典型抗精神病药物具有不同的药理学原理,故分别评估每一种药物的疗效(斯塔尔2013),而不是类效应;而且这在临床上更有用。
检索策略
在2017年1月,我们检索了CENTRAL、MEDLINE、Embase、其他的5个数据库和2个试验登记数据库。
标准/纳入排除标准
非典型抗精神病药物对比安慰剂治疗诊断为破坏性品行障碍包括合并注意缺陷多动障碍的儿童及满18岁的青少年。主要结局指标是攻击事件、制造麻烦和不良事件(例如:体重增加或改变及代谢参数的变化)。次要结局指标是日常行为、违约行为、其他不良事件、社会功能属性、家庭功能属性、家长满意度和学校功能属性。
数据收集与分析
我们使用了Cochrane推荐的标准方法流程。两名综述作者(JL和KS)独立筛选试验、评估质量,并提取数据。我们采用了GRADE方法来评估证据的质量。除了由于结果数据不足的代谢参数这一指标,我们对其余每一个主要结局指标均进行了meta分析。
主要结果
我们纳入了10项试验(2000年‐2004年),涉及了896名5‐18岁的儿童及青少年。除了2项试验,所有受试者均来自于门诊。八项试验评估了利培酮的疗效,一项评估了喹硫平的疗效,还有一项评估了齐呱西酮的疗效。九项试验评估了急性期疗效(4至10周以上);其中有一项试验结合了兴奋剂药物与家长的训练来治疗。一项试验持续六个月以评估症状复发情况。
证据的质量是为低至中等。九项研究由药企提供了一定程度的支持或资助。
主要结局
通过meta分析方法,我们应用平均差(MD)来整合来自3项研究(238名受试者)涉及攻击行为的数据,所得数据由异常行为检查表(ABC)‐易怒量表评估。我们发现,对于青少年而言,利培酮相较于安慰剂会降低攻击性行为的发生(MD为−6.49,95%可信区间(CI)−8.79到−4.19;低质量证据)。我们使用标准差(SMD),汇总了两项利培酮试验(190名参与者)的数据,这两项试验使用了不同的评价量表:显性攻击性量表(OAS‐M)量表和反社会行为量表(ABS);由于ABS有两个不能结合的子量表(被动攻击和主动攻击),我们分别进行了两次分析。当我们整合了反社会行为主动量表和显性攻击量表,利培酮有效的数据标准差SMD为−1.30,(95%CI为−2.21到−0.40,中等质量证据)。当我们整合了反社会行为被动量表和显性攻击量表,标准差SMD为‐1.12(95%CI为−2.30到0.06,中等质量证据),由于置信区间重叠空白值,提示预估效果的不确定性。总之,证据表明利培酮可以减少攻击性行为。缺乏像奎硫平、齐呱西酮等其他非典型抗精神病药物对攻击性行为的影响数据。
我们汇总了两项利培酮试验数据(225名受试者),对使用的尼森格尔儿童行为评估表‐行为问题子量表(NCBRF‐CP)评估的行为问题情况进行meta分析。与安慰剂组相比,利培酮组的平均得分最终平均得分为8.61分(95%CI‐11.49至‐5.74;中等质量证据)。
我们通过两次meta分析研究了对体重的影响。我们想要区分单用抗精神病药物与联合使用兴奋剂类药物的疗效,因为后者可抑制食欲产生抵消体重增长的效果。我们整合了2项单用利培酮的试验(138名受试者),发现利培酮组的参与者增重2.37千克(公斤),相比于安慰剂组增重更多(95%CI为0.26到4.49;中等质量证据)。当又分析了一项所有受试者都给予利培酮联合用药的试验,我们发现那些在联合治疗组中增重2.14公斤(95%CI为1.04‐3.23;3项研究;305受试者;低质量证据),相比那些安慰剂组增重更多。
次要结局
在10项试验中,有3项涉及了日常行为,社会功能和父母满意度。没有试验涉及家庭或学校功能。所有10项试验都有关于依从性差/流失率和其他不良事件的数据。
作者结论
还有一些证据表明在短期内,利培酮可以减少破坏性品行障碍儿童和青少年的攻击问题和行为问题的发生;也有证据表明这种干预措施会伴有明显的体重增加。
对于攻击行为问题,异常行为检查表(ABC)‐易怒量表的6.49分的差异(范围从0到45)可能对临床具有重要的意义。由于临床中很难区分被动和主动攻击事件,所以解释两个不同反社会行为子量表不同的临床意义很具有挑战性。对于行为问题,尼森格尔儿童行为评估表‐行为问题子量表的8.61差值(范围从0到48)可能对临床具有重要指导作用。体重增加仍是需要关注的问题。
由于现有证据的局限性和高质量的试验的匮乏,上述所得结局尚需谨慎。缺乏支持喹硫平、齐呱西酮或任何其他非典型抗精神病药物治疗于儿童和青少年的破坏性品行障碍证据的,也没有五岁以下儿童用药的证据。在临床试验中发现的疗效在何种程度上可转化为实际的临床应用中还不确定。鉴于家长培训干预措施在治疗这些疾病方面的有效性,以及对药物疗效的一些模棱两可的证据,不单独使用药物治疗是很重要的。这是与当前的临床指南相一致。
PICO
Plain language summary
治疗儿童和青少年破坏性品行障碍的非典型抗精神病药物
系统综述研究问题
评价非典型抗精神病药物治疗儿童及青少年破坏性品行障碍的疗效和安全性(针对主要的新型镇静剂),对比安慰剂组(假药丸)(如争辩行为,反抗行为,易怒行为)。
背景
患有破坏性品行障碍的儿童和青少年经常出现攻击和严重的行为问题。患儿家人发现非典型抗精神病药物可以减轻上述症状来解决患儿健康问题。用于治疗破坏性品行障碍的非典型抗精神病药物的使用量在增加。
研究特点
我们回顾和评价了关于非典型抗精神病药物对比安慰剂治疗儿童和青少年破坏性品行障碍的证据。证据检索截止到2017年1月19日。我们检索到10项研究。这些研究中,有八项是研究利培酮疗效的、一项研究奎硫平疗效的、一项是研究齐拉西酮疗效的。五项研究进行了预试验研究(一个初步的小研究以评估的包括研究成本以及进行更大规模的研究的可行性)。其中,五项涉及了38名或更少受试者的研究;一项涉及了50名受试者的研究,两项超过100名受试者的研究,一项涉及了168名受试者的研究,一项涉及了多于300名受试者的研究。九项研究的观察期为四、六或十周。第十项是为期六个月的观察性研究。9/10的研究由药企提供了一定程度的支持或资助。
主要结果及证据质量
分析表明,利培酮可在一定程度上减少了攻击事件(低质量证据)和制造麻烦(中等质量证据)的发生;治疗6周后发现利培酮似乎在短期内显得相对安全。然而,伴随着明显的体重增加(低到中等质量的证据)。其余副作用尚未发现,远期的疗效并不明确。开具这些药物的临床医生和家属需要仔细评估药物的作用和风险。未有涉及5岁以下儿童的试验研究。除了利培酮以外,缺乏其他药物的研究。
我们建议进行更多试验研究,评估这些药物的远期疗效及安全性。也需要更多的试验研究除利培酮的以外的药物。最理想的情况是,先予心理治疗或伴随药物治疗联合应用,如基于现行的临床指南给予父母培训。足量足疗程使用药物是很重要的。需要仔细考虑药物的给药顺序或是联合使用药物的给药方法,以优化治疗效果,同时最大限度地减少用药。
由于证据的局限性,这些结论需要谨慎参考。这些研究使用了不同的数据结果分析,使得我们很难整合结果。由于6/10的研究为小样本试验,所以影响了试验的影响力(即研究辨别某一样本量偶然性影响的能力)。本综述的主要结局(如—攻击问题、行为问题和体重增加问题—)的证据质量使用GRADE分级考虑为从低到中等质量。
Authors' conclusions
Summary of findings
| Risperidone compared to placebo for disruptive behaviours in children and youths | ||||||
| Patient or population: Disruptive behaviours in children and youths | ||||||
| Outcomes | Anticipated absolute effects* (95% CI) | Relative effect | № of participants | Quality of the evidence | Comments | |
| Risk with placebo | Risk with risperidone | |||||
| Aggression | The mean aggression ABC‐I score ranged across control groups from −4.40 to 0.10 | The mean aggression ABC‐I score in the intervention groups was, on average, 6.49 lower (8.79 lower to 4.19 lower) | ‐ | 238 | ⊕⊕⊝⊝ | Included studies: Aman 2002; Snyder 2002; Van Bellinghen 2001 |
| Aggression | The mean aggression OAS‐M and ABS Proactive score ranged across control groups from 8.10 to 15.10 | The mean aggression OAS‐M and ABS Proactive score in the intervention groups was, on average, 1.12 lower (2.30 lower to 0.06 higher) | ‐ | 190 | ⊕⊕⊕⊝ | Included studies: Buitelaar 2001; TOSCA study |
| Conduct | The mean conduct score ranged across control groups from −6.20 to 25.80 | The mean conduct score in the intervention groups was, on average, 8.61 lower (11.49 lower to 5.74 lower) | ‐ | 225 | ⊕⊕⊕⊝ | Included studies: Aman 2002; Snyder 2002 |
| Weight gain (treatment with antipsychotic only) | The mean weight gain (treatment with antipsychotic only) score in the control groups ranged from 0.74 to 0.90 | The mean weight gain score in the intervention groups was, on average, 2.37 higher (0.26 higher to 4.49 higher) | ‐ | 138 | ⊕⊕⊕⊝ | Included studies: Aman 2002; Findling 2000 |
| Weight gain (treatment with antipsychotic and stimulant) | The mean weight gain (treatment with antipsychotic and stimulant) score in the control groups ranged from −1.20 to 0.90 | The mean weight gain score in the intervention groups was, on average, 2.14 higher (1.04 higher to 3.23 higher) | ‐ | 305 | ⊕⊕⊝⊝ | Included studies: Aman 2002; Findling 2000; TOSCA study |
| *The risk in the intervention group (and its 95% confidence interval) is based on the assumed risk in the comparison group and the relative effect of the intervention (and its 95% CI). ABS: Antisocial Behavior Scale;CI: Confidence interval; MD: Mean difference;OAS: Overt Aggression Scale;OAS‐M: Overt Aggression Scale ‒ Modified; RCT: Randomised controlled trial; SMD: Standardized mean difference | ||||||
| GRADE Working Group grades of evidence | ||||||
| 1 Downgraded 2 levels because of unclear risk of bias due to lack of information on selection bias and detection bias in 2 studies, and unclear risk of bias due to lack of information and poor reporting standards in 1 study. 2 trials assessed outpatients, 1 trial assessed patients in residential care. 2 Unclear allocation concealment and unclear blinding of outcome assessment for 1 study and potential reporting bias in both studies. 3 Downgraded 1 level because of unclear allocation concealment and unclear blinding of outcome assessment for both studies and unclear attrition and potential reporting bias. 4 Downgraded 1 level because of unclear blinding of outcome assessment and potential reporting bias. Heterogeneity: Tau² = 2.22; Chi² = 20.77, df = 1 (P < 0.00001); I² = 95%. 5 Downgraded 2 levels because of unclear blinding of outcome assessment in 2 studies, potential reporting bias in 3 studies, and potential attrition bias in 2 studies. Heterogeneity: Tau² = 0.85; Chi² = 23.32, df = 2 (P < 0.00001); I² = 91%. | ||||||
Background
Description of the condition
Disruptive behaviour disorders form a group of psychological problems that include conduct disorder, oppositional defiant disorder and disruptive behaviour disorder not otherwise specified (Findling 2008). Subclinical presentations of oppositional defiant disorder and conduct disorder were previously diagnosed as disruptive behaviour disorder not otherwise specified. In the Diagnostic and Statistical Manual of Mental Disorders, Fifth Edition (DSM‐5), disruptive behaviour disorder not otherwise specified became designated as "other specified disruptive disorder" (American Psychiatric Association 2013), when the number of symptoms does not meet the diagnostic threshold. Disruptive behaviour disorders are frequently comorbid with attention deficit hyperactivity disorder (ADHD) (Findling 2008).
According to the DSM‐5, conduct disorder is defined as a repetitive and persistent pattern of behaviour that violates the basic rights of others or violates major age‐appropriate societal rules or norms (American Psychiatric Association 2013). In the preceding 12 months, at least three out of 15 criteria must be present from any of the following four categories, with at least one criterion present in the last six months: aggression towards people or animals; destruction of property; deceitfulness or theft; or serious violation of rules. The behavioural disturbances must also cause clinically significant impairment in social, academic or occupational functioning. Conduct disorder can be classed as mild, moderate or severe (American Psychiatric Association 2013). It is also categorised into childhood onset, adolescent onset and unspecified onset subgroups (American Psychiatric Association 2013). The early onset group is believed to have a poorer prognosis with a more persistent course and more pervasive disturbances (Steiner 1997). A specifier was added in DSM‐5 for people with limited "prosocial emotion", showing callous and unemotional traits as research showed they tend to have a relatively more severe form of the disorder and a different treatment response (American Psychiatric Association 2013a).
Oppositional defiant disorder is diagnosed when a child has a minimum of four out of eight symptoms from the following three categories, for at least six months: angry/irritable mood; argumentative/defiant behaviour; and vindictiveness (American Psychiatric Association 2013). Oppositional defiant disorder is conceptualised as a potential precursor of conduct disorder if no interventions occur. This change highlights that the disorder reflects both emotional and behavioural symptomatology. The conduct disorder exclusion is deleted. The criteria were also changed with a note on frequency requirements and a specifier on current severity (American Psychiatric Association 2013a).
Prevalence of conduct disorder in the general population is estimated to be between 1.5% and 4% of children and adolescents using clinical interviewing as a method of detection (Steiner 1997). The ratio of boys to girls is between 5:1 and 3.2:1 depending on the age range (Steiner 1997). Reported community prevalence rates of oppositional defiant disorder range from 2% (Loeber 1998) to 16% (Cohen 1993), depending on the criteria and assessment methods used, the time period considered and the number of informants.
Disruptive mood dysregulation disorder (DMDD) was added as a new diagnosis to depressive disorders in DSM 5 (American Psychiatric Association 2013). This was to address concerns about the misdiagnosis and overtreatment of bipolar disorder in children and youths (Baweja 2016). This diagnosis remains somewhat controversial due to concerns about its construct validity and unclear treatment parameters (Baweja 2016; Freeman 2016). Youths with DMDD have significant overlap with symptoms of ODD (Freeman 2016). The development of ICD 11 aims to improve the diagnostic classification of irritability in youths (Evans 2017). The authors propose a different solution for ICD11: a subtype ODD with chronic irritability/anger (Evans 2017).
Comorbidity
Oppositional defiant disorder or conduct disorder may be comorbid in more than 50% of ADHD cases (Barkley 2006; Connor 2010). From psychology literature, there is evidence that children with comorbid ADHD, oppositional defiant disorder and conduct disorder experience multiple childhood and psychosocial risk factors that begin during infancy (Shaw 2001). Children with a history of trauma have greater oppositional defiant behaviours than children without exposure to trauma (Henry 2007). According to Steiner 2007, 14% of child patients have comorbid anxiety disorders and 9% have comorbid depressive disorder. Greene 2002 reported comorbidity of disruptive behaviour disorders with paediatric bipolar affective disorder of up to 40% to 50% (Greene 2002). However, there is a lack of clarity in the diagnosis of paediatric bipolar affective disorder and controversy in the literature, especially with emotionally dysregulated children and youths (Parens 2010).
Impact
A significant proportion of children (about 30%) with early onset of oppositional defiant disorder go on to develop conduct disorder (Waschbusch 2002). Oppositional defiant disorder significantly predicts compromised psychiatric, family and social functioning independently of the presence of conduct disorder (Biederman 1996; Greene 2002). In Biederman's study of oppositional defiant disorder in boys, oppositional defiant disorder was found to be associated with major depression, in the interval between the four‐year and 10‐year follow‐up (Biederman 2008).
Conduct disorder leads to multiple negative outcomes in adulthood (Moffitt 2002). From the Christchurch longitudinal study, Fergusson and Horwood demonstrated that children scoring in the top 5% for conduct problems at age eight years were at 4.8 times higher risk of leaving school without qualifications than children in the least disturbed 50%, and their rates of unemployment at 18 years of age were 2.9 times higher (Fergusson 1998). This study also indicated that conduct problems at seven to nine years of age were statistically significantly associated with a wide range of adverse psychosocial outcomes in adulthood, including crime, substance dependence, mental health problems and relationship difficulties, even after controlling for confounding factors (Fergusson 2004). Clinically, a significant proportion of children and youths with severe disruptive behaviour disorders may not be seen in psychiatric clinics, but are seen and dealt with by general practitioners, paediatricians, schools, welfare agencies, police, or courts, singly or in combination.
Psychosocial treatments
A range of psychosocial interventions are outlined in the NICE guidelines, including training programmes for parents and foster carers, child‐focused programmes and multimodal interventions for children and youths with, or at high risk of, developing oppositional defiant disorder and conduct disorders (NICE Clinical Guideline (CG158) 2013). For young children up to early adolescence, there are a variety of parent training programmes (Kazdin 1997; Weisz 2004; Kaminski 2008; Chorpita 2009). The programmes that do best are those that increase positive parent‐child interactions and emotional communication skills, teach parents to use time out and the importance of consistency, and those that require parents to practise new skills with their children (Kaminski 2008).
Screening for trauma is essential in clinical practice and thinking about the function of a child's behaviour is important. As succinctly put by Howard 2013: is a child distressed or deliberately defiant? Perry 2006 used the term "survival behaviours that include defiant behaviours" that are present in traumatized children. For those disruptive‐behaviour‐disorder children with comorbid trauma history, the additional treatment goals include ensuring safety, affect regulation and management, skills building, trauma resolution (Kuban 2011), and potentially more trauma‐specific therapies.
For youths, the main focus of interventions for conduct disorder is at the family or systemic level. They include functional family therapy and multi‐systemic therapy (Scott 2008). Functional family therapy is a treatment combining a family approach with cognitive and behavioural modification to improve family communication patterns and support functions, which has shown some effect (Scott 2008). A proposed Cochrane Review of functional family therapy remains at the protocol stage (Littell 2007). Multisystemic therapy (MST) is a family‐based treatment involving multiple systems (family, school, community). There were previous reports of effectiveness in some studies (Karnik 2007). An earlier Cochrane Review has reported that there is inconclusive evidence of the effectiveness of MST compared with other interventions in youths (Littell 2005). However, a more recent publication has summarised the effectiveness of MST outlining 55 published outcome, implementation and benchmarking studies, of which 25 are randomised trials (MST Services 2016). Out of the randomised trials, four are trials using MST with adolescents with serious conduct problems, and 11 are trials using MST with serious juvenile offenders. The authors suggest MST reduces long‐term re‐arrest rates in studies with serious juvenile offenders by a median of 42%. Out‐of‐home placements, across all MST studies, are reduced by a median of 54% (MST Services 2016).
Pharmacological treatments
The difficulties associated with disruptive behaviour disorders include problematic aggression and severe behavioural problems. These often result in presentation to psychiatric services, where a number of medications are used for disruptive behaviours, including off‐label use of some medications designed for other disorders, for example stimulant medications, mood stabilisers and antipsychotics (Tcheremissine 2006). None of these were originally developed for the treatment of disruptive behaviours.
Stimulant medications for the treatment of ADHD have been widely studied. There is evidence to support the use of extended‐release methylphenidate and amphetamine formulations, atomoxetine, and extended‐release guanfacine (α2‐adrenergic agonist) to improve symptoms of ADHD in adolescents in a recent systematic review (Chan 2016). There is also evidence for clonidine, another α2‐adrenergic agonist, and the US Food and Drug Administration (FDA) has approved an extended‐release clonidine to be used alone or with stimulants for the treatment of ADHD in paediatric patients aged 6 to 17 years since 2010 (Waknine 2010). There is convincing evidence that when ADHD co‐occurs with disruptive behaviour disorders and is treated with stimulant medications, improvements can be observed in disruptive behaviour disorder and aggression (Pappadopulos 2006; Ipser 2007).
The mood stabiliser lithium has been studied in inpatient settings for young people with conduct disorders. The evidence about its efficacy showed significant variability (Pappadopulos 2006; Ipser 2007). Two studies did not meet the inclusion criteria used in the systematic review by Pappadopulos 2006. One was a study of 20 youths with explosive temper and mood lability, in which sodium valproate was superior to placebo in reducing aggressive symptoms (Donovon 2000). Another was a seven‐week, cross‐over, randomised controlled trial of 71 youths with conduct disorder, in which participants receiving higher doses (500 mg/day to 1500 mg/day) of sodium valproate experienced greater global improvement scores and self‐reported impulse control than those randomised to low doses (250 mg/day) (Steiner 2003). Only one randomised controlled trial of 22 inpatient youths with conduct disorder indicated that carbamazepine was no different than placebo in reducing aggression and explosiveness (Cueva 1996), although, given the small sample size, is likely to be have been underpowered to show effect. Preliminary studies of alpha‐2 agonists (clonidine, guanfacine) suggest some effect on aggressive behaviour in patients with diagnoses of autism and ADHD with comorbid tics (Pappadopulos 2006).
Antipsychotic agents are used to control disruptive behaviour in clinical practice, particularly when aggression is a core feature. In the 1980s typical antipsychotics were studied (Findling 2008). However, interest has since shifted to atypical antipsychotics (Findling 2008). Of the atypical antipsychotics, risperidone is the most widely studied in the disruptive behaviour disorder population (Pappadopulos 2006). Currently, aripiprazole, olanzapine, quetiapine and risperidone have FDA‐ (Food and Drug Administration) approved paediatric indications for bipolar mania (10 to 17 years of age except for olanzapine, 13 to 17 years of age) and for schizophrenia (13 to 17 years of age) (FDA 2009; Correll 2010). In addition, aripiprazole and risperidone are also indicated for irritability and aggression associated with autistic disorder (six to 17 years of age) (Correll 2010; Ching 2012). Any usage for disruptive behaviour disorder is considered off‐label, except in Europe (European Medicines Agency 2011), and the individual clinician is medico‐legally responsible for the usage. There is a trend currently towards combination treatment with atypical antipsychotics and stimulant medication (Aman 2015; Kamble 2015).
Description of the intervention
This review focuses on atypical antipsychotics because of the clinical interest and usage in disruptive behaviour disorders (Doey 2007; Harrison‐Woolrych 2007). The atypical antipsychotics include risperidone, olanzapine, quetiapine, aripiprazole, amisulpiride, sertindole, ziprasidone, zotepine, clozapine, paliperidone, asenapine, iloperidone, and lurasidone. In treatment guidelines (Pappadopulos 2003), pharmacological management is used for emergency treatment of acute aggression in the short term (lasting days to weeks), or for chronic aggression where the duration of treatment is for at least six months.
How the intervention might work
A potential focus of the use of atypical antipsychotics is to target aggression in disruptive behaviour disorders (Findling 2008). Aggression is one of the diagnostic criteria for conduct disorders (American Psychiatric Association 2013); and a common presenting complaint in ODD (Turgay 2004). Reviewing the neurotransmitters of aggression, Swann 2003 postulates that the increased risk of impulsive behaviour may be associated with elevated dopaminergic or noradrenergic function. Results of animal studies suggest that trait impulsivity may result from an imbalance between dopamine and serotonin, where animals with serotonin depletions are impulsive due to release of a dopaminergic activation system from serotonin depletion (Harrison 1997). Siever 2008, in reviewing the neurobiology of aggression and violence, propose that aggression is mediated through insufficient serotonergic facilitation of "top‐down" control (executive regulation/control provided by the orbital frontal cortex and anterior cingulate cortex), excessive dopamine and noradrenaline stimulation and subcortical imbalances of glutamatergic/gabaminergic systems and dysfunction in the neuropeptide systems.
Atypical antipsychotics block dopamine and serotonin receptor systems and some investigators have proposed that their anti‐aggressive action comes from this effect (Schur 2003). Atypical antipsychotics that have the ability to antagonise the D2 receptor are said to reduce aggression (Nelson 2007). Siever 2008 proposes that atypical antipsychotics' anti‐aggressive effect is due to a reduction in dopaminergic stimulation and an increased effect on frontal inhibition. Pharmacologically, according to Stahl 2013, atypical antipsychotics, as a class, are defined as serotonin‐dopamine antagonists, in particular 5HT2a and D2 receptor antagonism. However, they also have partial agonist actions at 5HT1a receptors and D2 receptors. Interestingly, while atypical antipsychotics act as serotonin antagonist in the short term, chronic treatment may produce changes in the serotonin binding sites that are qualitatively and quantitatively similar to serotonin agonists (Krakowski 2006).
It is unclear if the mechanism of action for its antipsychotic effect is independent of its anti‐aggressive effect. Antipsychotic effect is achieved when 60% to 75% of D2 receptors have been blocked, while extrapyramidal side effects emerge when 80% or more D2 receptors have been blocked by an atypical antipsychotic (Ferrin 2015). This is the D2 occupancy theory (Remington 2014). The fast dissociation theory posits that antipsychotics come off the D2 receptor at very different rates with faster dissociation rates characterising the atypical antipsychotics (Remington 2014). It calls into question the need for continuous D2 binding to maintain antipsychotic response. The authors suggest exploring different types of antipsychotic dosing in order to achieve therapeutic effect and to reduce side effects (Remington 2014).
Thus, the pharmacological mechanism of action through which atypical antipsychotics may inhibit aggression is complex and further research is needed (Schur 2003; Siever 2008).
Why it is important to do this review
There are multiple studies showing increasing, widespread use of atypical antipsychotics amongst children and youths in different countries. They include Australia (Dean 2006), Canada (Doey 2007), New Zealand (Harrison‐Woolrych 2007), the United Kingdom (Rani 2008) and the USA (Olfson 2010).
This trend continues in more recent literature. An Australian study by Karanges and colleagues examined longitudinal trends in psychotropic medication dispensing from 2009 to 2012 by scrutinising the dispensing database maintained by the Department of Human Services (Karanges 2014). The overall trend (all ages) was a 22.7% increase in subsidised, antipsychotic prescriptions dispensed from 2009 to 2012 (from 2,573,833 prescriptions to 3,158,020 prescriptions). For atypical antipsychotics, the greatest increase was in the 10‐ to 14‐year age group (53.3% increase), followed by three to nine years (45%) and 15 to 19 years (40.9%). In 2012, risperidone was the most popular antipsychotic in those aged three to nine years and 10 to 14 years (90.1% and 72.6% respectively), with quetiapine most popular in those aged 15 to 19 years (34.1%). Seventy per cent of prescriptions for atypical antipsychotics were written by general practitioners and 20.1% by psychiatrists. There were no data on diagnoses. Bachmann and colleagues in Germany looked at antipsychotic prescription in children and adolescents, analysing data from a German statutory health insurance company from 2005 to 2012 (Bachmann 2014). They found that atypical antipsychotics were increasingly used off label to treat aggressive impulsive disorders. Most of the prescriptions were not written by child and adolescent psychiatrists. Risperidone was most commonly prescribed, given in 61.5% of cases to patients with ADHD and 35.5% of cases to patients with conduct disorders. Burcu and colleagues assessed antipsychotic prescribing patterns in the outpatient treatment of behavioural disorders in US youth (Burcu 2015). They used 2003 to 2010 national ambulatory medical care survey data and national hospital ambulatory medical care survey data (n = 4603). They found a different pattern — psychiatrists prescribed antipsychotics more than non‐psychiatrists (24.2% versus 4.6% respectively). In more than one third of the visits, antipsychotics were prescribed concomitantly with two or more psychotropic medication classes.
Other papers look at this issue through an ADHD treatment lens, in terms of combination treatment or concurrent use of atypical antipsychotics with stimulant medications (Amor 2014; Kamble 2015). Amor and colleagues assessed the one‐year period prevalence of stimulant combination therapy and 'switching' in children and adolescents with ADHD in Quebec, Canada (Amor 2014). They looked at a Quebec database from March 2007 to February 2012. They defined combination therapy as 30 consecutive days of concomitant use of multiple drugs. They found that among 9431 children and adolescents aged six to 17 years with ADHD, the one‐year period prevalence of combination therapy was 19.8% and that of switching was 18.7%. The most frequent combination categories were atypical antipsychotics (10.8%), followed by atomoxetine (5.5%) and clonidine (5.3%). The most frequently switched‐to categories were other stimulants (7.9%), atypical antipsychotics (5.5%) and atomoxetine (4.7%). There were no details available on the atypical antipsychotics used. In a US study, Kamble and colleagues examined the prevalence of concurrent use of long‐acting stimulants and atypical antipsychotics among children and adolescents aged six to 17 years with ADHD, retrospectively analysing 2003 to 2007 Medicaid data from four US states (Kamble 2015). They defined combination therapy as simultaneous receipt of both stimulant and atypical antipsychotic for at least 14 days. Among the 61,793 children and youths, 11,866 (19.2%) had combination treatment. The average length of concurrent use was 130 (± 98) days. Risperidone was used in about 61% of those children and youths.
Combination therapy has become more common in clinical practice (Aman 2015); and, from the papers above, potentially more so in the USA and Canada. Prescribing multiple combinations seems more the norm in a national survey of child and adolescent psychiatrists in the USA (Kearns 2014). Kreider 2014 also found that these combination treatments are common, of long duration and on the rise in the USA. Combinations of drugs with different mechanism of action and with some potentially reciprocally neutralising adverse events makes conceptual sense (Farmer 2011). However, it is not known how frequently patients receiving combination treatment are reviewed to assess the benefits and risks of their combination treatment (Olfson 2014). There is an emerging theme in the literature of a stepped care approach, as well as augmentation treatment, as part of the argument for combination therapy.
While there is a significant increase in the use of atypical antipsychotics in vulnerable child and adolescent populations, there is a lack of a corresponding increase in the clinical research evaluating efficacy or safety in this population (Greenhill 2003). The review seeks to address this important gap. In addition aggression itself, which is a common presenting symptom of disruptive behavioural disorders, remains an important clinical and social problem in the child and adolescent mental health field and is worthy of research (Aman 2015).
Objectives
To evaluate the effect and safety of atypical antipsychotics, compared to placebo, for treating disruptive behaviour disorders in children and youths. The aim was to evaluate each drug separately rather than the class effect, on the grounds that each atypical antipsychotic has different pharmacologic binding profile (Stahl 2013) and that this is clinically more useful.
Methods
Criteria for considering studies for this review
Types of studies
Randomised controlled, double‐blinded trials.
Types of participants
Children and adolescents up to and including 18 years of age, in any setting, with a diagnosis of a disruptive behaviour disorder, including oppositional defiant disorder, conduct disorder and disruptive behaviour disorder not otherwise specified, as established using criteria from either the Diagnostic and Statistical Manual of Mental Disorders (DSM; American Psychiatric Association 2000; American Psychiatric Association 2013) or International Statistical Classification of Diseases and Related Health Problems (ICD; WHO 2016). We included studies in which participants had comorbid diagnoses of ADHD, major depression, anxiety disorders or intellectual disability.
We excluded studies in which participants had a comorbid diagnosis of pervasive developmental disorder or autistic spectrum disorder (ASD), a comorbid psychotic disorder or bipolar affective disorder. This was to exclude those conditions in which antipsychotic agents may be treating symptoms other than disruptive behaviour, as in those cases clinical improvement may be related to improvement in the underlying psychopathology. In addition, there are other reviews dealing with atypical antipsychotics in ASD such as the recently updated review by Hirsch 2016.
Types of interventions
Any atypical antipsychotic, whether the mode of delivery was oral or intramuscular, compared with placebo. Trials including a combination of atypical antipsychotics combined with other medications or psychosocial interventions, or both, were also eligible. The rationale for including combination treatment in the review was that it mirrored clinical practice. No duration of treatment was specified a priori.
Types of outcome measures
Primary outcomes
-
Aggression: reduction in aggressive behaviour, measured through reduction in scores of validated rating scales.
-
Conduct problems: reduction in conduct problems or disruptive behaviour problems, measured through reduction in scores on relevant validated rating scales or subscales.
-
Adverse events: weight gain (absolute weight gain or changes in body mass index (BMI)) and metabolic parameters (specifically glucose and lipid profiles).
The hierarchy of preferred time points was: i) six‐week time point for initial efficacy and ii) six‐month time point after six months' maintenance treatment for long‐term efficacy (Jensen 2007a).
The rationale for the selection of the primary outcomes was that they were important and clinically relevant problems caregivers/families and clinicians grapple with. The justification for the time points arose from the recommendations from Jensen 2007a — a consensus report from the USA compiled from the contributions of multiple stakeholders including academics, researchers, the Food and Drug Administration (FDA), the National Institute of Mental Health (NIMH), industry sponsors and patient and family advocates. The report looked at impulsive aggression as a symptom across diagnostic categories in child psychiatry, with implications for medication studies.
Validated rating scales are those that accurately assess what they were designed to assess, are reliable and have normative data (Myers 2002). Collett 2003, Jensen 2007a and Steiner 2007 have listed scales that were suitable and have outlined the psychometric properties for the majority of them. The relevant scales are listed in Appendix 1.
For clinical and statistical reasons, it is usually necessary to obtain information that covers behaviour in different settings, including home and school, from different informants (Verhulst 2002). Both observer and self‐rated rating scales are used. Parents observe variations in behaviour across multiple situations while teachers note deviation from peers in the school setting (Myers 2002). Generally, for externalising problems, there is greater inter‐rater consistency between parent and teacher informants. (Clay 2008). For self‐reports, while children and adolescents can be reliable and valid self‐reporters, and may be useful for some difficult‐to‐observe behaviour such as stealing, there are potential limitations. These include children's and youths' linguistic skills, presence of learning difficulties, self‐reflection skills, ability to monitor one's behaviour and risks of under‐reporting undesirable behaviour or to respond in a socially desirable manner (Myers 2002; Collett 2003). For these reasons, observer‐rated data were preferable to self‐rated data for this review. If several measures of the same outcome were available, we selected the measure used as the primary outcome in a given trial.
For the measurement of weight gain, we selected measurement by kilogram.
Secondary outcomes
-
General functioning, as measured by the Children's Global Assessment Scale (CGAS) (Shaffer 1983).
-
Non‐compliance, measured as the proportion of participants discontinuing treatment.
-
Other adverse events, measured as the incidence of overall adverse events and breakdown by types of adverse events, taking into consideration frequency, severity and clinical importance, and including extrapyramidal side effects measured by standardised side‐effect scales, such as Simpson Angus Extrapyramidal Scale (SAES) (Simpson 1970), and common adverse events like sedation and hyperprolactinaemia.
-
Social functioning, as measured by, for example, the social adaptation subscale from the MacArthur Health and Behavior Questionnaire (HBQ) (Armstrong 2003).
-
Family functioning, as measured by, for example, Parenting Stress Index – Short Form (PSI‐SF) (Abidin 1995).
-
Parent satisfaction, as measured by, for example, Cleminshaw‒Guidubaldi Parent Satisfaction Scale (Guidubaldi 1985).
-
Functioning at school, as measured by, for example, the School Function Assessment (SFA) (Coster 2008).
Search methods for identification of studies
We ran database and trial register searches for the original review in June 2010 and August 2011 (see Appendix 2). For this version, we revised the search strategy by adding search terms for new drugs: iloperidone, asenapine, lurasidone and paliperidone (see Appendix 3). We did not limit our searches by date, language or publication type.
Electronic searches
We searched the databases and trial registers listed below in January 2015, February 2016 and January 2017. Details of the searches, including exact search dates, are reported in Appendix 4 .
-
Cochrane Central Register of Controlled Trials (CENTRAL; 2016, Issue 11) in the Cochrane LIbrary, which includes the Cochrane Developmental, Psychosocial and Learning Problems Group Specialized Register (searched 19 January 2017).
-
MEDLINE Ovid (1946 to December Week 1 2016).
-
MEDLINE In‐Process & Other Non‐Indexed Citations Ovid (18 January 2017).
-
Embase Ovid (1980 to 2017 Week 03).
-
PsycINFO Ovid (1806 to January Week 2 2017).
-
CINAHL Plus EBSCOhost (Cumulative Index to Nursing and Allied Health Literature; 1937 to current).
-
Cochrane Database of Systematic Reviews (CDSR; 2017, Issue 1) in the Cochrane Library.
-
Database of Abstracts of Reviews of Effects (DARE; 2015, Issue 2) in the Cochrane Library. No new content added after this issue.
-
ClinicalTrials.gov (clinicaltrials.gov; searched 20 January 2017).
-
WHO International Clinical Trials Registry Platform (ICTRP; apps.who.int/trialsearch; searched 20 January 2017).
We searched the following sources in 2011, but not for this update:
-
Australian New Zealand Clinical Trials Registry (ANZCTR; anzctr.org.au/trialSearch.aspx). The content of this register is included in WHO ICTRP.
-
metaRegister of Controlled Trials (isrctn.com/page/mrct). Reported as "under review" in 2015 and 2016.
-
National Research Register Archive. This service is no longer available.
-
UK Clinical Research Network (UKCRN). This service is no longer available.
Searching other resources
We examined reference lists of included studies and other review articles to identify relevant studies. We contacted authors of the identified RCTs to request further information. We also contacted pharmaceutical companies to request information about any published or unpublished trials using atypical antipsychotics for disruptive behaviour disorders in children and youths.
Data collection and analysis
Selection of studies
Two review authors (JL and KS) independently examined the titles and abstracts of all records obtained through the search strategy. The same two authors obtained and independently assessed the full texts of relevant reports appearing to meet the inclusion criteria. The two authors discussed any conflicts of opinion and, if necessary, called upon another review author (SM) to arbitrate until consensus was reached. They recorded their decisions in a PRISMA diagram (Moher 2009).
Data extraction and management
Two authors (JH and KS) carried out data extraction independently. They discussed any disagreements with another review author (SM) until consensus was reached.
They extracted the data listed below.
Study methods
-
Randomisation method (i.e. sequence generation).
-
Method of allocation concealment.
-
Blinding method (for those giving the treatment, participants, outcome assessors).
-
Stratification factors (if relevant).
Participants
-
Inclusion and exclusion criteria.
-
Number (total or per group).
-
Age distribution.
-
Gender.
-
Ethnicity.
-
Comorbidity.
-
Setting.
Intervention
-
Type of medication.
-
Dosage.
-
Length of prescription.
-
Mode of delivery.
Outcome data
-
Reduction of aggression; scale used.
-
Reduction of conduct problems; scale used.
-
Social functioning; scale used.
-
General functioning; scale used.
-
Family functioning; measurement method.
-
Parent satisfaction; measurement method.
-
School functioning; measurement method.
-
Duration of follow‐up.
-
Loss to follow‐up and any reasons given by investigators for same.
-
Non‐compliance: proportion of participants discontinuing treatment.
Analysis data
-
Methods of analysis (intention‐to‐treat or per‐protocol analysis).
-
Comparability of groups at baseline (yes or no).
-
Any other statistical techniques used by the investigators.
Safety data
-
Adverse events (overall incidence).
-
Weight gain; lipid and glucose profile, if available.
-
Breakdown by type of adverse events, taking into consideration frequency, severity and clinical importance.
JL and KS individually entered data into Cochrane's software for developing reviews: Review Manager 5 (RevMan 5) (Review Manager 2014). We compared extracted data to ensure accuracy. We resolved any discrepancies by consensus.
Assessment of risk of bias in included studies
For each included study, two review authors (JH and KS) independently assessed risk of bias, using the seven domains set out below from Chapter 8 of the Cochrane Handbook for Systematic Reviews of Interventions (hereafter referred to as the Cochrane Handbook; Higgins 2011b), with ratings of low, high and unclear risk of bias. We assigned these ratings based on the guidelines included in Table 8.5.d: "Criteria for judging risk of bias" in the Cochrane Handbook (Higgins 2011b). Please see the Characteristics of included studies tables for full details.
-
Sequence generation – the method used to generate the allocation sequence to determine if it produced comparable groups.
-
Allocation concealment – the method used to conceal allocation sequence to ensure that participants and investigators enrolling participants could not foresee group assignment.
-
Blinding of participants and personnel – the methods used to ensure that participants and personnel were blind to treatment allocation.
-
Blinding of outcome assessors – the methods used to ensure that those assessing outcomes were blind to treatment allocation.
-
Incomplete outcome data – the methods for dealing with incomplete data and the extent of details on attrition and withdrawals.
-
Selective outcome reporting – the completeness of data reported in the published trial as compared to prespecified outcomes measures, protocol or trial registry.
-
Other risk of bias – whether the trial had other problems such as methodological shortcomings or reporting discrepancies.
We did not exclude studies from meta‐analysis on the basis of the 'Risk of bias' assessment.
Measures of treatment effect
For continuous outcomes, where studies used the same outcome measure for comparisons, we pooled data by calculating the mean difference (MD) with 95% confidence intervals (CIs). Where different measures were used to assess the same outcome, we considered whether to pool data by calculating the standardised mean difference (SMD), with 95% CI.
There were no dichotomous data to include in this version of the review. Please refer to our protocol (Loy 2010) and Table 1 for methods archived for future updates of this review.
| Analysis | Method |
| Measures of treatment effect | For dichotomous data, we planned to analyse data on the intention‐to‐treat principle with dropouts included in the analysis. Out of the 10 studies, 1 used dichotomous outcomes (Armenteros 2007), therefore we were not able to perform further analyses. |
| Unit of analysis issues | For cross‐over trials, we planned to do paired analysis if data were presented. Otherwise, we planned to take all measurements from intervention periods and all measurements from control periods and analyse these as if the trial was a parallel‐group trial, acknowledging that there might be unit of analysis errors that could underestimate the precision of the estimate of the treatment effect (Deeks 2011). However, no cross‐over trials were identified. Also, there were no cluster‐randomised controlled trials, so we did not have to take this into account in our analyses. |
| Dealing with missing data ‒ missing participants | We intended to calculate the best‐ and worst‐case scenarios for the clinical response outcome, if possible. For example, the best‐case scenario assumed that dropouts in the intervention group had positive outcomes and those in the control group had negative outcomes. In the worst‐case scenario, dropouts in the intervention group had negative outcomes and those in the control group had positive outcomes. |
| Assessment of heterogeneity | Chapter 9 in the Cochrane Handbook recommends using a range for I² and a guide to interpretation (Deeks 2011). Had we found either moderate heterogeneity (I² in the range of 30% to 60%) or substantial heterogeneity (I² in the range of 50% to 90%), as specified in our protocol (Loy 2010), we planned to examine it using specified subgroup and sensitivity analyses (see Subgroup analysis and investigation of heterogeneity and Sensitivity analysis). |
| Assessment of reporting bias | We intended to draw funnel plots (effect size versus standard error) to assess publication bias if sufficient studies were found. Asymmetry of the plots may indicate publication bias, although they may also represent a true relationship between trial size and effect size. If such a relationship were identified, we planned to examine the clinical diversity of the studies as a possible explanation (Egger 1997). There were insufficient studies in our meta‐analysis to perform a funnel plot. |
| Subgroup analysis and investigation of heterogeneity | It was our intention to conduct separate analyses on the following subgroups, where possible.
There were too few studies in any of the analyses for us to carry out any subgroup analyses. |
| Sensitivity analysis | We intended to perform sensitivity analyses to explore whether the results of the review were robust in relation to certain study characteristics. We intended to exclude trials with 'no' or 'unclear' ratings for allocation concealment and use the fixed‐effect model for our primary outcome. We identified a limited number of trials and we did not exclude any of them based on the ratings of allocation concealment. We were not able to carry out a sensitivity analysis due to the small number of trials. |
ADHD: attention deficit hyperactivity disorder
Unit of analysis issues
We did not encounter any unit of analysis issues in this review. For methods to manage unit of analysis issues in future updates of this review, please refer to our protocol (Loy 2010) and Table 1.
Dealing with missing data
Missing statistics
In the first instance, we attempted to contact the original researchers for any missing data. If only standard error (SE) or P values were reported, we calculated standard deviations (SD) and have documented this in the review.
Missing participants
For continuous data, if available, we used intention‐to‐treat data and noted the methods used by authors for imputing missing data, such as last observation carried forward.
For additional methods archived for future updates of this review, please see our protocol (Loy 2010) and Table 1.
Assessment of heterogeneity
We assessed clinical heterogeneity by comparing differences in the distribution of important participant factors between trials (for example, age, gender, specific diagnosis, duration and severity of disorder, associated comorbidities). We assessed methodological heterogeneity by comparing trial factors (randomisation, concealment, blinding of outcome assessment, losses to follow‐up). We assessed statistical heterogeneity by performing the Chi² test of heterogeneity, where a significance level of less than 0.10 was interpreted as evidence of heterogeneity, and by using the I² statistic, which calculated the percentage of variability due to heterogeneity rather than sampling error. We also presented Tau² – an estimate of between‐study variance (see Differences between protocol and review).
Please refer to our protocol (Loy 2010) and to Table 1, for additional methods to assess heterogeneity, which have been archived for future updates of this review.
Assessment of reporting biases
In order to assess outcome reporting bias, we compared what the authors said they would report with what they actually reported for the main clinical outcomes. We assessed whether authors provided actual data for each outcome or just reported statistical significance without actual data, as missing data could indicate reporting bias. We corresponded with authors whenever possible to seek clarification regarding unclear detail in the publications.
For additional methods to assess reporting bias, which have been archived for future updates of this review, please refer to our protocol (Loy 2010) and to Table 1.
Data synthesis
We performed a meta‐analysis only where studies were considered to have sufficiently similar participants, interventions, comparators and outcome measures. We used a random‐effects model to pool data since there was expected clinical diversity.
According to Chapter 12 in the Cochrane Handbook (Schünemann 2011), where different outcome measures are used, the SMD should be used to pool results; and where the outcome measure is the same, the MD should be used. The statistical advice we had was that while we can pool outcomes based on different measures using the SMD, this can only be done using final scores and not with mean change scores. This is because using the SMD makes the assumption that there is an equal correlation between the baseline and final scores in each trial or for each measure, and information is seldom provided to confirm this. If some studies have a small correlation between baseline and final scores and others have a large correlation then pooling these makes the result meaningless. This is also the reason that change and final scores cannot be combined using SMD. Therefore, we undertook separate meta‐analyses of those studies reporting outcomes as change scores and those reporting them as final scores.
Summary of findings
We used the GRADEpro Guideline Development Tool (GRADEpro 2014) to construct summary of findings Table for the main comparison for the main comparison: medication versus placebo. The table contains information on the anticipated absolute magnitude of effect for three outcomes (aggression; conduct problems; and weight gain) and the number of participants and studies. It also includes a rating (high, moderate, low or very low) for the overall quality of the evidence, which we assessed using the GRADE approach (Schünemann 2011). Evidence from randomised controlled trials began as high quality but we downgraded according to the presence of the following criteria: limitations in the design and implementation; indirectness of evidence; inconsistency of results; imprecision of results; and high probability of publication bias.
Subgroup analysis and investigation of heterogeneity
There was inadequate information to perform subgroup analyses due to few relevant studies, small sample sizes and, therefore, low power. If adequately powered, we would consider the following subgroup analyses: differences by types of medications; duration of treatment; presence/absence of ADHD; presence/absence of psychostimulants; and presence/absence of intellectual disability.
Please see our protocol (Loy 2010) and Table 1 for subgroup analyses archived for future updates of this review.
Sensitivity analysis
Sensitivity analyses to assess the impact of study risk of bias on the results of meta‐analysis were inappropriate, as there were a limited number of studies. Please see our protocol (Loy 2010) and Table 1 for sensitivity analyses archived for future updates of this review.
Results
Description of studies
Results of the search
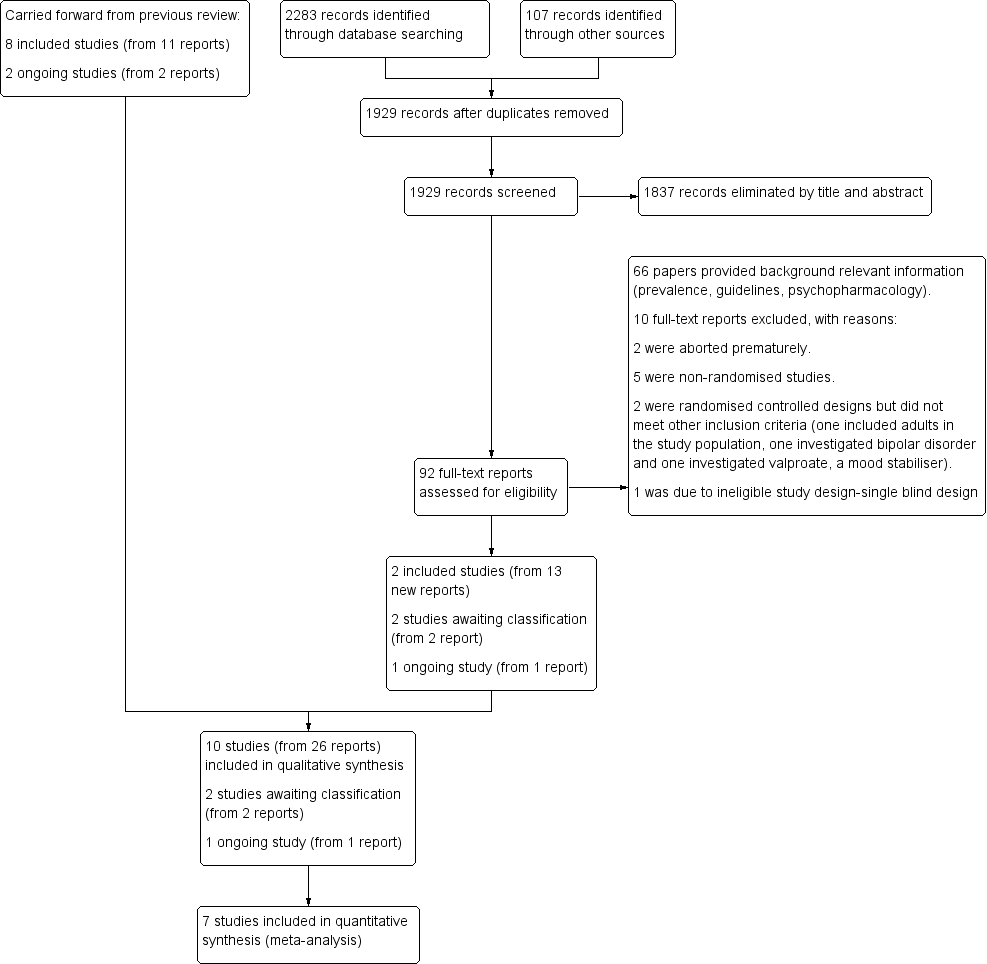
In the previous version of the review (Loy 2012), we ran searches in June 2010 and August 2011 and screened a total of 2992 citations by title and abstract. We obtained the full‐text reports of 106 records and assessed these for eligibility. Of these, we included eight studies (from 11 reports), identified two ongoing studies and excluded 11 studies.
For this update, we revised our search strategies to include four new drugs (iloperidone, asenapine, lurasidone and paliperidone), and added the Cochrane Database of Systematic Reviews (CDSR) and the Database of Abstracts of Reviews of Effects (DARE) to our list of sources. We conducted our revised search for the period from August 2011 to January 2015, and re‐ran this search in February 2016 and January 2017. Overall, we found 2390 records: 2283 from electronic searches and 107 from searching other sources (trial registers). Having removed 461 duplicates, we screened 1929 records against our inclusion criteria (Criteria for considering studies for this review), and eliminated 1837 on the basis of title and abstract. We next obtained and assessed 92 full‐text reports for eligibility. We excluded 76 reports, 10 of which are discussed in the Excluded studies section. We included 12 new reports of the TOSCA study; plus one additional report brought forward from the 2012 review (Loy 2012), when it had still been an ongoing trial; and one new report of another previously ongoing study in a conference poster (Fleischhaker 2011). See Included studies. In addition, we identified one new ongoing study (NCT00794625), and two studies of potential interest, which we have listed as 'awaiting classification' (NCT02063945; IRCT201211051743N10).
Please see Figure 1.
study flow diagram
Included studies
This review includes 10 trials (from 26 reports). Eight trials (11 reports) were included in the previous version of the review (Findling 2000; Buitelaar 2001; Van Bellinghen 2001; Aman 2002; Snyder 2002; Reyes 2006a; Armenteros 2007; Connor 2008). This update includes two new trials (Fleischhaker 2011; TOSCA study), from 15 reports. 13 of these reports were identified from the updated searches and two were carried forward from the original review having previously been ongoing studies
In the secondary paper to the TOSCA study, Gadow 2014 expanded on prior research by examining treatment effects on ADHD, disruptive behaviour symptoms and informant discrepancy. The main outcome was ADHD symptom severity rating assessed by the ADHD Symptom Checklist‐4 (ADHD‐SC4; Gadow 2008), Peer Conflict Scale (Gadow 1986), and the Child and Adolescent Symptom Inventory‐4R (CASI‐4R; Gadow 2005). Gadow 2014 reported that at least one half of the teacher data for the ADHD‐SC4 scale were missing for 50/117 children (43%) for various reasons, including difficulties in synchronizing the clinical trial with the child's school year, parent‐school conflicts and different levels of teacher involvement across sites (p 950). Intention‐to‐treat or 'last observation carried forward' analysis was used in Gadow 2014. We decided not to analyse this paper in depth for the following reasons: the significant amount of missing teacher data; the rating scales used in the study were not the ones commonly available or used; and the domains we are interested in, for example aggression, were based on a further subgroup analysis.
Location of studies
Four trials were multicentre (Aman 2002; Snyder 2002; Reyes 2006a; TOSCA study), and included data from several countries (Belgium, Canada, Germany, Great Britain, Israel, Netherlands, Poland, South Africa, Spain and the USA). The other trials were conducted in the USA (Findling 2000; Armenteros 2007; Connor 2008), the Netherlands (Buitelaar 2001), Belgium (Van Bellinghen 2001) and Germany (Fleischhaker 2011).
Study designs
All 10 included studies were randomised controlled trials. They spanned the period 2000 to 2014. Eight assessed risperidone (Findling 2000; Buitelaar 2001; Van Bellinghen 2001; Aman 2002; Snyder 2002; Reyes 2006a; Armenteros 2007; TOSCA study); one assessed quetiapine (Connor 2008); and one assessed ziprasidone (Fleischhaker 2011).
Sample sizes ranged from 13 to 335. In five trials, the total number of participants was 25 or fewer (Findling 2000; Buitelaar 2001; Van Bellinghen 2001; Armenteros 2007; Connor 2008). Five were pilot trials (Findling 2000; Van Bellinghen 2001; Armenteros 2007; Connor 2008, Fleischhaker 2011). Three trials had 115, 110 and 168 participants (Aman 2002; Snyder 2002; TOSCA study respectively), and one had 335 participants (Reyes 2006a).
All trials used inactive placebo as control.
The latest trial, 'treatment of severe childhood aggression' (referred to as the TOSCA trial), involved a complex trial design with three treatment components and may be viewed as an augmentation study or a combination treatment study (TOSCA study). It was a two‐stage, nine‐week parallel group, double‐blind, randomised controlled trial of risperidone ('augmented' = active) and placebo ('basic' = placebo) added to parent training and stimulant. The parents/guardians of all participants received parent training in strategies of behaviour management from baseline and throughout the nine weeks. Stage one consisted of three weeks' open‐label stimulant and stage two consisted of six weeks of a double‐blinded, placebo‐controlled comparison of added risperidone versus placebo. Only those participants who evidenced less‐than‐optimal response to stimulant were given the second medication (placebo or risperidone).
The timing of randomisation was one of the design challenges discussed in Farmer 2011. This was partly determined by the National Institute of Mental Health (NIMH) review process. The original proposal was to randomise less‐than‐optimal stimulant responders to either risperidone or placebo for six weeks (at the end of week three) but the NIMH review committee was concerned about attrition before the randomisation. Therefore, the final decision was to randomise enrolled participants at baseline (week 0) to the two treatment strategies — stimulant plus placebo versus stimulant plus risperidone — with the parents/guardians of all participants receiving parent training in strategies of behaviour management. Participants who responded optimally to the stimulant alone in stage one (i.e. in the first three weeks) were not given the second medication (risperidone or placebo).
The trial of ziprasidone was a double‐blinded, parallel‐group, randomised controlled trial, including a three‐week baseline period for finding the best individual dose, a six‐week treatment period and a two‐week washout period (Fleischhaker 2011).
One trial was a three‐stage trial that included a six‐week open‐label phase, followed by a six‐week single‐blind phase of risperidone and then a six‐month maintenance, double‐blind, randomised controlled trial (Reyes 2006a). It is important to note that randomisation occurred not at the acute phase but only after participants responded to active treatment. The objective of the study was to evaluate long‐term maintenance treatment. Participants were excluded from the trial once they had symptom recurrence.
The remainder of the studies were between four weeks and 10 weeks in duration, with follow‐up from four weeks in two trials (Van Bellinghen 2001; Armenteros 2007) to six weeks in five trials (Buitelaar 2001; Aman 2002; Snyder 2002; Connor 2008; TOSCA study), nine weeks in one trial (Fleischhaker 2011; three weeks of titration followed by six weeks of fixed‐dose medication), and 10 weeks in another trial (Findling 2000).
Three trials used a one‐week placebo run‐in (Aman 2002; Snyder 2002; Connor 2008) or ‘single‐blind placebo phase’ (Connor 2008), after which placebo responders were excluded from further participation in the trial.
Participants
Participants were between five and 18 years of age. In eight trials, there were significantly more males than females (Findling 2000; Buitelaar 2001; Aman 2002; Snyder 2002; Reyes 2006a; Armenteros 2007; Connor 2008, TOSCA study). Eight trials included outpatients while one trial included children from residential care (Van Bellinghen 2001) and one trial included inpatients (Buitelaar 2001).
Six studies included a significant number of participants with sub‐average to borderline intelligence quotient (IQ; 36 to 84) (not Armenteros 2007; Connor 2008 or TOSCA study). One study stipulated that patients must have an IQ over 55 but did not report demographic features of the participants, including average IQ (Fleischhaker 2011).
Studies varied in their inclusion criteria for participants. Aman 2002, Snyder 2002 and Reyes 2006a included participants with DSM‐IV criteria for conduct disorder, oppositional defiant disorder and disruptive behaviour disorder not otherwise specified (American Psychiatric Association 2000), and included participants with comorbid ADHD. Buitelaar 2001 included participants with DSM‐IV criteria for conduct disorder, oppositional defiant disorder and ADHD (American Psychiatric Association 2000). Findling 2000 and Connor 2008 included participants with conduct disorder only. Armenteros 2007 specifically looked at participants with DSM‐IV criteria for ADHD (American Psychiatric Association 2000) and a specific aggression criterion, as it was an ADHD augmentation trial, while Van Bellinghen 2001 included participants with symptoms of "persistent behavioural disturbances including hostility, aggression, irritability, agitation and hyperactivity" rather than DSM‐IV diagnoses. The TOSCA study included participants with DSM‐IV (American Psychiatric Association 2000) diagnoses of ADHD with comorbid conduct disorder or oppositional defiant disorder. Fleischhaker 2011 included participants with DSM‐IV diagnoses of conduct disorder, oppositional defiant disorder and disruptive behaviour disorder not otherwise specified (American Psychiatric Association 2000); there was no detail provided about comorbidity in this trial.
Six trials included ADHD comorbidity. In the TOSCA study, all participants had ADHD with comorbid conduct disorder or oppositional defiant disorder, and all participants had stimulant treatment titrated in the three‐week lead‐in period.
In Armenteros 2007, ADHD was the main diagnosis. In Van Bellinghen 2001, ADHD comorbidity was not stated other than that one participant in the placebo group was on Ritalin, which was discontinued during the trial. In Findling 2000, there was no information on ADHD comorbidity. With the exception of the TOSCA study, doses of concomitant stimulant medications were not mentioned in the trials.
Interventions
In one study for quetiapine, the mean dose at endpoint was 294 (± 78) mg/day, with a range of 200 to 600 mg/day (Connor 2008).
In one study for ziprasidone, the maximum intended daily dose was 20 mg for patients with a body weight of 50 kg or less, and 40 mg for patients with a body weight more than 50 kg. No endpoint mean dose was reported (Fleischhaker 2011).
In the earlier studies (2000 to 2007) the mean doses of risperidone at endpoint ranged from 0.98 mg/day to 1.5 mg/day. In the most recent study (TOSCA study), the mean endpoint dose of risperidone was 1.7 (± 0.75) mg/day in the active arm and 1.9 (± 0.72) mg/day in the placebo arm.
All trials used the oral method of antipsychotic administration, four of them using risperidone solution (Van Bellinghen 2001; Aman 2002; Snyder 2002; Reyes 2006a), and the rest using oral preparation.
The duration of intervention was four weeks in two trials (Van Bellinghen 2001; Armenteros 2007); six weeks in six trials (Buitelaar 2001; Aman 2002; Snyder 2002; Connor 2008; Fleischhaker 2011; TOSCA study); and 10 weeks in one trial (Findling 2000).
One trial investigated risperidone maintenance (Reyes 2006a). In this trial, after two 6‐week phases (open‐label followed by single‐blind risperidone treatment), all responders were randomised to six months' maintenance of risperidone or placebo. The primary efficacy measure was time‐to‐symptom recurrence.
In the TOSCA study, the mean endpoint dose of methylphenidate (stimulant) for the placebo group was 44.8 (± 14.6) mg/day compared with 46.1 (± 16.8) mg/day in the active group. The parents/guardians of all participants (both active and placebo arms) received parent training in strategies of behaviour management throughout the trial.
With the exception of the TOSCA study (as detailed above), the rest of the trials dealt with psychosocial interventions in the following way: one trial specified that participants had to have failed psychosocial treatment (contingency management and social skills training) before starting medication (Buitelaar 2001). Aman 2002 permitted behavioural therapy that had started 30 days before the trial. Armenteros 2007 and Connor 2008 allowed "pre‐existing or current psychosocial interventions". There was no information in the rest of the trials as to how many participants actually had concomitant psychosocial treatments or further details of those treatments.
With the exception of the TOSCA study, doses of concomitant stimulant medications were not mentioned in the trials.
Outcomes
Primary outcomes
Details of the standardised scales used to assess aggression and conduct problems are presented in additional Table 2 and Table 3.
| Name of rating scale | Description | Construction | Study | Source of Information used in the study |
| Aberrant Behaviour Checklist (ABC) (Aman 1985a; Aman 1985b) | Symptom checklist for assessing problem behaviours of children and adults with mental retardation. It is also used for classifying problem behaviours of children and adolescents with mental retardation. | 58 items, 5 scales.
| Parent/caregiver | |
| Child Behaviour Checklist (CBCL) (Achenbach 1991)
| Checklist for evaluating maladaptive behavioural and emotional problems. | 113 items, 8 subscales.
| Parent | |
| Overt Aggression Scale (OAS) (Yudofsky 1986) | Assesses the severity and frequency of overt aggression. | 25 items, 4 subscales.
Within each category, aggressive behaviour is rated according to its severity. | Parent | |
| Overt Aggression Scale ‒ Modified (OAS‐M) (Kay 1988) | Assesses the severity and frequency of overt aggression. | 20 items, 4 subscales.
5‐point interval scale that represents increasing level of aggression. The total aggression score is obtained by multiplying the 4 individual scales by weights of 1, 2, 3 or 4 and then summing the 4 weighted scores. | Nurse or teacher | |
| Rating of aggression against people and/or property scale (RAAP) (Kemph 1993) | ‐ | Global rating scale, 1 item. Scored from 1 (no aggression reported) to 5 (intolerable behaviour). | Clinician | |
| Children's Aggression Scale ‒ Parent (CAS‐P; Halperin 2002) and Teacher (CAS‐T; Halperin 2003) | Retrospectively measures the frequency and severity of 4 categories of aggression: verbal aggression; aggression against objects and animals; provoked physical aggression; and initiated physical aggression | Respondents (parents/guardians and teachers) complete a Likert scale to evaluate the frequency of an act. The frequency of aggressive events is multiplied by its designated severity weight factor and then summed to yield a total score. | Parent and teacher | |
| Antisocial Behavior Scale (ABS) Proactive and Reactive Subscales (Brown 1996) | Instrument used to differentiate reactive/affective from proactive subtypes of aggression | 28 items. Proactive Aggression subscale: 5 proactive items and 5 covert antisocial items. Reactive Aggression subscale: 6 items. | Parent |
| Name of rating scale | Description | Construction | Study | Source of information used in the study |
| Conners' Parent Rating Scale (CPRS) (Conners 1989) | Checklist for assessing behavioural and emotional difficulties. | 48 items, 6 subscales.
| Parent | |
| Nisonger Child Behaviour Rating Form (NCBRF) (Aman 1996; Tassé 1996) | Assesses behaviour of children and adolescents with intellectual disability or autism spectrum disorders, or both. | 76 items, 8 subscales.
| Parent | |
| Nisonger Child Behavior Rating Form ‒ Typical IQ D‐Total (includes conduct problems and oppositional subscales) | Typical IQ version: assesses behaviour of children and adolescents with normal IQ. | 10 items, 1 prosocial subscale.
54 items, 6 problem behaviour subscales.
| Parent |
IQ: intelligence quotient.
Aggression
In one study, Reyes 2006a, aggression was not a specific outcome.
Eight studies — Findling 2000; Buitelaar 2001; Van Bellinghen 2001; Aman 2002; Snyder 2002; Armenteros 2007; Connor 2008; TOSCA study — assessed aggression using the rating scales below (endpoints fall between four and 10 weeks).
-
Aberrant Behaviour Checklist (ABC) ‒ Irritability subscale (Aman 1985a; Aman 1985b), used in three studies (Van Bellinghen 2001; Aman 2002; Snyder 2002).
-
Child Behaviour Checklist (CBCL) ‒ Aggression subscale (Achenbach 1991), used in one study (Findling 2000).
-
Overt Aggression Scale (OAS) (Yudofsky 1986), used in one study (Connor 2008).
-
Overt Aggression Scale ‒ Modified (OAS‐M) (Kay 1988), used in one study (Buitelaar 2001).
-
Rating of aggression against people and/or property scale (RAAP) (Kemph 1993), used in one study (Findling 2000).
-
Children's Aggression Scale ‒ Parent (CAS‐P) and Teacher (CAS‐T) (Halperin 2002; Halperin 2003), used in one study (Armenteros 2007).
-
Antisocial Behavior Scale (ABS) ‒ Proactive and Reactive Behavior subscales (Brown 1996), used in one study (TOSCA study).
Conduct problems
Three studies did not measure conduct problems (Buitelaar 2001; Van Bellinghen 2001; Armenteros 2007).
Seven studies — Findling 2000; Aman 2002; Snyder 2002; Reyes 2006a; Connor 2008; Fleischhaker 2011; TOSCA study — assessed conduct problems using the rating scales listed below (endpoints fall between six weeks to six months).
-
Nisonger Child Behaviour Rating Form ‒ Conduct Problem subscale (NCBRF‐CP) (Aman 1996; Tassé 1996), used in four studies (Findling 2000; Aman 2002; Snyder 2002; Reyes 2006a).
-
Conners' Parent Rating Scale ‒ Conduct Problem subscale (CPRS‐CP) (Conners 1989), used in one study (Connor 2008).
-
Nisonger Child Behaviour Rating Form (NCBRF) Typical IQ, D‐Total (consisting of conduct disorder and oppositional defiant disorder subscales) (Aman 2008), used in two studies (Fleischhaker 2011; TOSCA study).
Adverse events
With the exception of one study, Fleischhaker 2011, which did not report on weight gain, all trials assessed weight gain in kilograms. Three studies presented mean weight gain and SDs (Findling 2000; Aman 2002; Reyes 2006a). One study, the TOSCA study, reported baseline and endpoint mean weight and SDs for both arms. Metabolic parameters were only available in two trials (Reyes 2006a; TOSCA study).
Secondary outcomes
General functioning
Only one trial, Reyes 2006a, assessed general functioning, using the Children's Global Assessment Scale (CGAS) (Shaffer 1983).
Non‐compliance
Data on non‐compliance and attrition rate were available from all 10 trials (Findling 2000; Buitelaar 2001; Van Bellinghen 2001; Aman 2002; Snyder 2002; Reyes 2006a; Armenteros 2007; Connor 2008; Fleischhaker 2011; TOSCA study), and are reported in the 'Risk of bias' tables, beneath the Characteristics of included studies tables.
Other adverse events
Data on other adverse events were available from all 10 trials (Findling 2000; Buitelaar 2001; Van Bellinghen 2001; Aman 2002; Snyder 2002; Reyes 2006a; Armenteros 2007; Connor 2008; Fleischhaker 2011; TOSCA study), and are presented in Table 4.
| Study ID | General | Neurological | Gastrointestinal | Respiratory | Cardiovascular/Metabolic | Serious adverse event (unspecified) | Other |
| (risperidone = 12, placebo = 13) |
|
|
| ‐ | Not reported | ‐ | ‐ |
| (risperidone = 19, placebo = 19) |
|
|
|
| Not reported | ‐ | ‐ |
| (quetiapine = 9, placebo = 10) |
|
| ‐ | ‐ | No differences across groups found on ECG QRS or QTc intervals. | ‐ | ‐ |
| (risperidone = 10, placebo = 10) |
| ‐ |
| ‐ | No clinically significant changes in ECG. | ‐ |
|
| (risperidone = 6, placebo = 7) | No side effects reported in any category. | ‐ | ‐ | ‐ | ‐ | ‐ | ‐ |
| (risperidone = 55, placebo = 63) |
|
|
|
|
| ‐ | ‐ |
| (risperidone = 172, placebo = 163) |
|
|
|
|
|
| ‐ |
| (risperidone = 53, placebo = 57) |
|
|
|
|
|
|
|
| (risperidone = 73, placebo = 80) |
|
|
|
|
| ‐ |
|
| (ziprasidone = 25, placebo = 25) |
|
|
|
|
|
|
|
Bpm: beats per minute; ECG: electrocardiogram; URTI: upper respiratory tract infection; EPSE: Extrapyramidal side effects; QRS: the name for the 3 waves (Q wave, R wave and S wave) on an electrocardiogram; QTc: correct QT (start of Q wave to end of T wave) interval
Social functioning
One trial, Van Bellinghen 2001, assessed social functioning, using the Personal Assessment Checklist (PAC), part of which rated social relationships. It was unclear if PAC was a validated measure.
Family functioning
No trial set out to examine this outcome.
Parent satisfaction
A secondary paper to the TOSCA study examined participants' parents' satisfaction with the TOSCA study overall, with special attention to parents' satisfaction with the parent training component (Rundberg‐Rivera 2015). No other trial set out to examine this as an outcome.
Functioning at school
No trial set out to examine this outcome.
Excluded studies
For full details, please see Characteristics of excluded studies.
In the previous version of this review (Loy 2012), we excluded 11 studies because they did not meet all our inclusion criteria (Buitelaar 2000; Soderstrom 2002; Turgay 2002; Findling 2004; Croonenberghs 2005; Findling 2006; Handen 2006; Masi 2006; Reyes 2006b; Haas 2008; Tyrer 2008). Tyrer 2008 was a RCT of risperidone, haloperidol and placebo in the treatment of aggressive, challenging behaviour in adults with intellectual disability. Three studies were on olanzapine; one was a clinical case series of six aggressive youths (Soderstrom 2002), one was a retrospective chart review of olanzapine treatment in adolescents with conduct disorder (Masi 2006), and one was an open‐label prospective trial of olanzapine in youths with disruptive behaviour disorder and below‐average intelligence (Handen 2006). One study was an open‐label trial of quetiapine in aggressive children with conduct disorder (Findling 2006). There was one open‐label study of risperidone in inpatient children and youths with psychiatric disorders associated with aggressive behaviour (Buitelaar 2000). There were five studies that were long‐term, open‐label studies of risperidone in children with disruptive behaviour disorders, four of which were up to a year's duration (Turgay 2002; Findling 2004; Croonenberghs 2005; Haas 2008), and one of which was up to three years' duration (Reyes 2006b).
In this updated review, we excluded eight trials for not meeting our inclusion criteria. NCT00550147 was an open‐label study of quetiapine added to methylphenidate in the treatment of ADHD and aggressive behaviour. Teixeira 2013a was an open, naturalistic study of clozapine in seven boys with severe conduct disorder over 26 weeks. Blader 2013 examined open titration and optimisation of stimulant monotherapy in 160 children. Holzer 2013 was an open‐label trial of atomoxetine and olanzapine in ADHD with comorbid disruptive behaviour disorder in children and adolescents. Kuperman 2010 was an open‐label trial of aripiprazole in the treatment of conduct disorder in adolescents. In Tramontina 2009, the investigators assessed response to treatment with aripiprazole in children and adolescents with bipolar disorder and comorbid ADHD in a pilot randomised controlled trial. Blader 2009 examined adjunctive divalproex versus placebo for children with ADHD and aggression refractory to stimulant monotherapy. Divalproex is considered to be a mood stabiliser and not an antipsychotic and does not fall under the scope of the review. Safavi 2016 was excluded due to ineligible methodology; it was a single‐blind design, rather than double blind, and compared the effects of methylphenidate, and methylphenidate and risperidone combined, in preschool children with attention deficit hyperactivity disorder.
Two additional trials would have met our criteria but were aborted prematurely. NCT00279409 was terminated due to slow rate of recruitment. It was originally called "Treatment of Children With ADHD Who do Not Fully Respond to Stimulants (TREAT)". The active comparator (also called the "combination arm") was parent training plus continued treatment on a stimulant plus augmentation with aripiprazole. Placebo comparator (also called the "simple treatment" arm) was parent training plus continued treatment on a stimulant plus a placebo matching aripiprazole. The ISRCTN95609637 study — a trial which was part of the Pediatric European Risperidone Project (PERS) — was abandoned according to the information on the research registry with no further information given. According to the PERS project website (Pediatric European Risperidone Studies (PERS) 2016), it was put on hold with no patients enrolled since 2013, as the British regulatory agency (Medicines & Healthcare products Regulatory Agency (MHRA)) put a recall on their medicine, followed by withdrawal of the trial sponsor in 2014. The reason, at the time, was that risperidone was one of 16 prescription medicines made at an Indian factory which failed a routine inspection. In the inspection, they found some risk of cross‐contamination due to poor cleaning practices, defects in building fabric and the ventilation systems at the site. There was also evidence of forged documents relating to staff training records, which had been rewritten (British Broadcasting Corporation (BBC) 2013).
Studies awaiting assessment
We identified two studies awaiting assessment (NCT02063945; IRCT201211051743N10). One study has not yet been published and it is unclear if it will be published in Persian or English, as it is an Iranian study (IRCT201211051743N10). We are awaiting publication of NCT02063945 to assess for possible exclusion, as it is likely to be an open‐label trial.
Ongoing studies
We identified one ongoing study called "Effectiveness of Combined Medication Treatment for Aggression in Children With Attention Deficit With Hyperactivity Disorder (The SPICY Study)" (NCT00794625). It is a double‐blinded, randomised controlled trial involving children (male and female), aged six to 12 years, with attention deficit disorder with hyperactivity (ADHD). The purpose of this trial is to determine the advantages and disadvantages of adding one of two different types of drugs to stimulant treatment for reducing aggressive behaviour in children with ADHD. During phase one, participants will receive a stimulant medication. If they do not respond to the stimulant, valproate and behavioural family counselling will be added to their treatment during phase two. If they do not respond to valproate, they will be switched to risperidone. The primary outcome is aggressive behaviour. The secondary outcomes are ADHD symptoms. The time frame is weekly follow‐up for 11 to 16 weeks. The recruitment status of this study is unknown. We have written to the author but have not received a reply at time of updating this review (Loy 2016c [pers comm]).
Risk of bias in included studies
We provide a brief description of our 'Risk of bias' assessment below. For more detailed information, please see the 'Risk of bias' tables, beneath the Characteristics of included studies tables, Figure 2 and Figure 3.

Risk of bias graph: review authors' judgements about each risk of bias item presented as percentages across all included studies.

Risk of bias summary: review authors' judgements about each risk of bias item for each included study.
Allocation
Random sequence generation
We judged sequence generation to be at low risk of bias for six trials (Findling 2000; Buitelaar 2001; Snyder 2002; Reyes 2006a; Armenteros 2007; TOSCA study). In the remaining four trials, we judged the risk of bias to be unclear: sequence generation was not described in two trials (Van Bellinghen 2001; Connor 2008); and there was insufficient information available for two other trials (Aman 2002; Fleischhaker 2011).
Allocation concealment
We judged allocation concealment to be at low risk of bias for three trials (Findling 2000; Reyes 2006a; TOSCA study). Findling 2000 used a random number list. The list was kept in the Center for Drug Research and was not accessible to either the primary investigator or other study raters. Reyes 2006a used treatment numbers allocated at each investigative centre in chronological order. Randomisation assignment in the TOSCA study was completed through a secured website. The unblinded medication dispenser entered the appropriate information into the website and an email with the participant’s treatment assignment was sent to the dispenser and to the statistician at the time. Randomisation assignment for each participant was printed and sealed in an envelope for study emergency only (Loy 2016a [pers comm]). In the other seven trials, the method of concealment was not described and we judged the risk of bias to be unclear (Buitelaar 2001; Van Bellinghen 2001; Aman 2002; Snyder 2002; Armenteros 2007; Connor 2008; Fleischhaker 2011).
Blinding
Blinding of participants and personnel
We judged seven trials to be a low risk of bias for blinding of participants and personnel (Findling 2000; Aman 2002; Snyder 2002; Reyes 2006a; Armenteros 2007; Connor 2008; TOSCA study). For two trials, details of blinding were not described (Van Bellinghen 2001; Fleischhaker 2011), and for another trial we judged details of blinding to be inadequate (Buitelaar 2001), and therefore rated all three studies at unclear risk of bias.
Blinding of outcome assessors
Only one study provided significant detail on the blinding of outcome assessors (albeit some of this information was obtained by email correspondence (Loy 2016b [pers comm]) and we rated it at low risk of bias (TOSCA study). The other studies did not include sufficient details on the blinding of outcome assessors and therefore we deemed the risk of bias to be unclear for all.
Incomplete outcome data
Overall, we judged four trials — Buitelaar 2001, Van Bellinghen 2001, Armenteros 2007, and the TOSCA study — to be at low risk of attrition bias for the following reasons. Van Bellinghen 2001 did not have any dropouts in either the treatment (6/6) or placebo (7/7) arms. Buitelaar 2001 and Armenteros 2007 clearly stated the reasons for all the dropouts in their articles. TOSCA study displayed detailed reasons for participant attrition in table S1 and S2 (p 60e1). Complete patient flow charts were available for Armenteros 2007 and the TOSCA study.
We judged three trials to be at high risk of attrition bias (Findling 2000; Connor 2008; Fleischhaker 2011). Both Findling 2000and Connor 2008 had 70% attrition rate in their placebo arm. The reasons for the attrition were clearly articulated. A patient flow chart was available for Connor 2008. The reasons for attrition in Fleischhaker 2011 were inadequately described and the narrative description and the flow of participants' diagram did not match. Furthermore, Fleischhaker 2011 did not report participant allocation and attrition using CONSORT standards.
We judged three trials to be at unclear risk of attrition bias (Aman 2002; Snyder 2002; Reyes 2006a). For Aman 2002, no efficacy data were recorded for three patients in the treatment arm and hence they were not included in any efficacy analyses (but the authors claimed to have used an intention‐to‐treat analysis). For Snyder 2002, there was discrepancy in dropouts between the table data, the narrative and graph in the published article. In Reyes 2006a, the reasons were only partially described (24 in the treatment arm discontinued, four due to side effects, 20 others not described; 25 in the placebo arm discontinued, four due to side effects, 21 others not described). A patient flow chart was available for Reyes 2006a.
Other than Van Bellinghen 2001 mentioned above who had no dropouts, for the other nine trials the attrition rate ranged from 0% to 40% in the treatment arm and 8% to 70% in the placebo arm (Aman 2002 ‒ 31 withdrawn (12 active treatment; 19 placebo) out of sample size of 118 (55 active treatment, 63 placebo); TOSCA study ‒ 14 withdrawn (11 active treatment, three placebo) out of sample size of 168 (84 active treatment, 84 placebo); Armenteros 2007 ‒ two withdrawn (one active treatment, one placebo) out of sample size of 25 (12 active treatment, 13 placebo); Buitelaar 2001 ‒ two withdrawn (from placebo) out of sample size of 38 (19 active treatment, 19 placebo); Connor 2008 ‒ eight withdrawn (one active treatment, seven placebo) out of sample size of 19 (nine active treatment, 10 placebo); Findling 2000 ‒ 11 withdrawn (four active treatment, seven placebo) out of sample size of 20 (10 active treatment, 10 placebo); Snyder 2002 ‒ 25 withdrawn (six active treatment, 19 placebo) out of sample size of 110 (53 active treatment, 57 placebo).
There was imbalance in the proportion missing between the treatment and placebo arms in three studies in particular (Findling 2000; Snyder 2002; Connor 2008). In Findling 2000, three out of 10 youths assigned to risperidone were withdrawn by their guardian because of lack of effect, and one youth who received risperidone was withdrawn from the study during week four due to the development of a rash (side effect). Four out of 10 patients assigned to placebo were withdrawn by their guardians because of lack of benefit, two more were withdrawn from the study by the principal investigator because of non‐compliance with study procedures, and one youth randomly assigned to placebo was lost to follow‐up. For Connor 2008, one out of nine participants withdrew from the medication (quetiapine) group due to side effects. Out of 10 participants in the placebo group, five withdrew due to lack of efficacy and two withdrew due to protocol violation. In Snyder 2002, six out of 53 participants dropped out of the risperidone group and 19 out of 57 participants dropped out from the placebo group. Reasons for discontinuation included: (i) insufficient response (two from risperidone group and 19 from placebo group); (ii) loss to follow‐up (one from risperidone group); and (iii) loss of parental consent (three from risperidone group). Thus in two of the studies (Snyder 2002; Connor 2008), the imbalance between the treatment and placebo arms was attributable to the lack of effect from the placebo.
In the TOSCA study, where the non‐responders only were given risperidone or placebo, the authors stated that they included data from all randomised participants based on intention‐to‐treat principles, and last observation carried forward was used to check the sensitivity of the primary analysis to the assumption that data were missing at random (Farmer 2011). The TOSCA study reported a completers' analysis only and this was confirmed in correspondence with the authors (Loy 2016b [pers comm]. In the TOSCA study paper it was stated that, "various sensitivity analyses were conducted to examine the robustness of results" (TOSCA study p 51); however, the sensitivity analysis was not published in the paper for comparison. From the correspondence (Loy 2016b [pers comm], the statistician of the TOSCA study confirmed that it was carried out and was found to be non‐significant (did not impact on the other results). The published attrition figures are as follows: 30 out of 168 participants were lost to follow‐up (baseline basic or placebo = 84; augmented or risperidone added = 84; week nine basic or placebo = 71; week nine augmented or risperidone added = 66).
In the reporting of missing data, no study in the review did a comparison between key baseline characteristics between individuals with missing and observed outcomes.
In the analysis of missing data, five studies used the last observation carried forward as an imputation method to address incomplete data (Buitelaar 2001; Aman 2002; Snyder 2002; Reyes 2006a; Armenteros 2007). Criticisms against this method are based on the underlying assumption that an individual’s missing value has not changed from the previously measured value, that it fails to account for the uncertainty about missing values (Wood 2004; Sterne 2009), and that there is a risk that the resulting standard errors will be too small (Sterne 2009), or that CIs are too narrow (Higgins 2011a). One study used mixed‐effect longitudinal analysis (Connor 2008); and one study was not explicit in the method used (Findling 2000).
The assumptions made in the main analysis were not made explicit in the studies except for Connor 2008. No formal sensitivity analyses were performed by any study to explore the effect of departures from the assumptions made in the main analysis.
Selective reporting
No complete protocol was available for any of the 10 trials and we therefore judged all studies to be of unclear risk of bias. We considered the TOSCA study to be unclear as the primary outcomes were consistent but secondary outcomes were not listed fully. In addition, there may be a possible reporting bias in Armenteros 2007, as dichotomous results were presented while no differences in mean scores were detected.
Other potential sources of bias
There are further design issues that may introduce bias by overestimating the true intervention effect.
As the completer analysis was the only other potential source of bias, we rated one trial at low risk of bias on this domain (TOSCA study).
We judged two trials to be at unclear risk of other potential sources of bias (Aman 2002; Reyes 2006a). For Aman 2002, there was the use of a one‐week, placebo run‐in design. In general, the use of enriched designs, such as the use of placebo run‐in periods to exclude responders, may artificially inflate the numbers responding to the active drug. For Reyes 2006a, only patients who responded to the initial treatment were randomised, potentially introducing a selection bias. This was addressed, in part, by including a single‐blind phase.
We judged seven trials to be at high risk of other potential sources of bias (Findling 2000; Buitelaar 2001; Van Bellinghen 2001; Snyder 2002; Armenteros 2007; Connor 2008; Fleischhaker 2011). Findling 2000, Buitelaar 2001, Van Bellinghen 2001, Armenteros 2007, Connor 2008 and Fleischhaker 2011 had small numbers of participants, and therefore had limited power to detect differences. For Buitelaar 2001, we were unsure why 145 potential participants were approached and only 49 were found to be eligible. Both Snyder 2002 and Connor 2008 also used the one‐week, placebo run‐in design. In addition, for Snyder 2002 it was unclear if the two international sites in South Africa followed the same protocol. The quality of reporting for Fleischhaker 2011 is consistent with a poster presentation but not to the level of a peer‐review journal article.
The authors of nine trials, except for Fleischhaker 2011, stated that intention‐to‐treat analyses (ITT) had been undertaken; however, as pointed out above, the TOSCA study publication includes a completers' analysis only. A full application of the intention‐to‐treat principle is only possible when complete outcome data are available for all randomised participants (Hollis 1999). As noted above, no efficacy data were recorded for three participants in the treatment arm of Aman 2002, and subsequently the Aman 2002 study presented the data for 52 out of the 55 participants randomised to the active arm. (Sample size: 118; 55 active treatment arm (results reported for 52 participants); 63 placebo arm).
None of the studies reported any conflict of interest with regard to the funding of the studies.
Effects of interventions
Our initial aim was to have two meta‐analyses overall, one for aggression and one for conduct problems. However, the studies identified for inclusion reported results in two ways: some reported pre‐intervention and postintervention means, while others presented mean change scores. Despite our best efforts, we were unable to obtain data from the authors to allow us to get the data in a consistent format. In addition, some studies used the same measures while others used different measures.
According to Chapter 12 in the Cochrane Handbook (Schünemann 2011), where different outcomes measures are used, the SMD should be used to pool results; and where the outcome measures are the same, the MD should be used. However, it is more complex when the results are presented differently, as outlined above.
We were advised that while we can pool outcomes based on different measures using the SMD, this can only be done using final scores or mean change scores but not a combination of both. This is because using the SMD makes the assumption that there is an equal correlation between the baseline and final scores in each trial or for each measure but information is seldom provided to confirm this. If some studies have a small correlation between baseline and final scores and others have a large correlation then pooling these studies makes the result meaningless. This is also the reason that change and final scores cannot be combined using SMD.
Therefore, we undertook separate analyses. For aggression, the first meta‐analysis uses the MD method to pool data, as we had several studies that used the same outcome measure. The second uses the SMD to combine outcome data from two different measures (both reported final scores). We used a similar approach for the outcome 'conduct problems'.
Comparison: medication versus placebo
Primary outcomes
1. Aggression
The first meta‐analysis of aggression included three trials (Van Bellinghen 2001; Aman 2002; Snyder 2002), which employed the Aberrant Behaviour Checklist (ABC) ‒ Irritability subscale (15 items yielding a maximum of 45 points; Aman 1985a). Results for the ABC‐Irritability subscale yielded a final mean score on treatment that was 6.49 points lower on this subscale than with placebo, in favour of risperidone (95% CI −8.79 to −4.19, Tau² = 0, I² = 0%, P < 0.00001, 3 trials, 238 participants, low‐quality evidence; Analysis 1.1).
In the next meta‐analysis we combined two trials (TOSCA study; Buitelaar 2001). We used the SMD as the trials used different rating scales. The rating scales were OAS‐M (Coccaro 1991); and Antisocial Behaviour Scales (ABS) (Elliot 1985). The ABS consisted of Reactive and Proactive subscales (parent‐rated), which could not be combined to give a total score. Therefore, we conducted separate meta‐analyses with ABS Reactive and ABS Proactive subscales. The Reactive items measured "hot" aggression while the Proactive subscale was said to measure "cold" aggression (TOSCA study). Combining data from the ABS Reactive subscale and the OAS‐M, yielded an SMD of −1.30, suggesting a significant effect in favour of risperidone (95% CI −2.21 to −0.40, Tau² = 0, I² = 0, P value = 0.005, 190 participants, moderate‐quality evidence; Analysis 1.2). In contrast, combining data from the ABS Proactive subscale and the OAS‐M, yielded an SMD of −1.12 (95% CI −2.30 to 0.06, Tau² = 0, I² = 0, P value = 0.06, 190 participants, moderate‐quality evidence; Analysis 1.3), suggesting uncertainty about the estimate of effect, as the CIs overlapped the null value.
The data for meta‐analyses for aggression came from short‐term studies (Buitelaar 2001; Van Bellinghen 2001; Aman 2002; Snyder 2002; TOSCA study).
2. Conduct problems
We combined data from two trials, Aman 2002 and Snyder 2002, both of which employed the Nisonger Child Behaviour Rating Form ‒ Conduct Problem subscale (NCBRF‐CP; 16 items yielding a maximum of 48; Aman 1996) in a meta‐analysis. The results yielded a mean score at the end of the intervention period that was 8.61 points lower than that on placebo, in favour of risperidone (95% CI −11.49 to −5.74, Tau² = 0, I² = 0, P < 0.00001, 225 participants, moderate‐quality evidence; Analysis 1.4).
We were unable to extract any appropriate data from the TOSCA study to include in the meta‐analysis of conduct problems. The TOSCA study used a new form of Nisonger Child Behavior Rating Scale Form ‒ Typical IQ (NCBRF; Aman 2008) while the earlier trials (Aman 2002 and Snyder 2002) used the low IQ NCBRF scale (Aman 1996). The TOSCA study utilised D‐Total as a primary outcome, which is a combination of conduct disorder and oppositional defiant disorder symptoms, while Aman 2002 and Snyder 2002 used the conduct disorder single subscales of the NCBRF ‒ low IQ version. Upon comparing the individual items between the low‐IQ and normal‐IQ subscales, we discovered there was insufficient overlap between the low‐IQ and normal‐IQ subscales to allow us to assume they measure the same construct. In effect, they needed to be treated as different rating scales for the purpose of the meta‐analysis. Because our existing conduct problems meta‐analysis was based on the MD method, we were unable to combine it with the TOSCA study data.
We excluded Reyes 2006a from the meta‐analysis, as the study's objectives and methodology were significantly different from the other trials (investigation of symptom recurrence up to six months, rather than six weeks' acute efficacy).
The data for meta‐analyses of conduct problems were from short‐term studies (Aman 2002; Snyder 2002).
3. Adverse events
i) Weight gain
We performed two meta‐analyses of weight gain.
In the first meta‐analysis, we pooled data from two trials that used antipsychotic medication only (Findling 2000; Aman 2002). Using the MD method, the results revealed that participants on risperidone gained, on average, 2.37 kilograms (kg) more than those in the placebo group over the treatment period of six to 10 weeks (MD 2.37, 95% CI 0.26 to 4.49, Tau² = 2.22, I² = 95%, P value = 0.03, 138 participants, moderate‐quality evidence; Analysis 1.5).
In the second meta‐analysis, we pooled data from three trials (Findling 2000; Aman 2002; TOSCA study), noting that in the TOSCA study trial, all participants received stimulants as well as a risperidone (or placebo) during the course of the treatment. Stimulant medication has a counteracting effect on weight gain due to its appetite suppression. Using the MD method, the results revealed that participants in the intervention group gained, on average, 2.14 kg more than those in the placebo group over the treatment period of six to 10 weeks (MD 2.14; 95% CI 1.04 to 3.23, Tau² = 0.85, I² = 91%, P < 0.0001, 305 participants, low‐quality evidence; Analysis 1.6). There is substantial heterogeneity with I² = 91%, most likely due to clinical heterogeneity. Specifically, while in three trials the medication was risperidone, the characteristics of participants and methodologies varied considerably. Findling 2000 included participants with IQ above 70, excluded moderate‐to‐severe ADHD, and it was unclear whether psychosocial interventions were offered. Aman 2002 included participants with IQ range of 36 to 84, and more than half of the sample had comorbid ADHD and were allowed concurrent stimulant medication (no dosage specified) and behavioural therapy. Finally, the TOSCA study included participants with a mean IQ of 97.1 (SD 14.1), and all participants had comorbid ADHD, which was actively treated with specified stimulant dosage, while all families received parent training.
We excluded Reyes 2006a from the analysis of weight gain for the same reason as noted above. The authors reported that over the six‐month maintenance phase, the mean weight increase was 2.1 kg (SD = 2.7) for risperidone‐treated patients; while participants receiving placebo had a decrease in mean weight of 0.2 kg (SD = 2.2) (Reyes 2006a).
ii) Metabolic parameters
Two trials reported data for this outcome (Reyes 2006a; TOSCA study). Reyes 2006a reported "no clinically significant changes in mean fasting glucose levels during treatment" but no specific data were provided in the published study. There was no information reported on glucose or lipid profiles from other trials. The TOSCA study reported there were four clinically‐significant abnormal values: two with the risperidone (augmented) treatment group (triglyceride 389 mg/dL and prolactin 112 microg/L) and two with the placebo (basic) group (fasting glucose 144 mg/dL and fasting insulin 24 microIU/mL).
The TOSCA study also analysed prolactin concentrations at screening and endpoint. The values were very similar at screening (5.7 (± 3.9) µg/L and 5.9 (± 3.0) µg/L, for placebo/basic and risperidone/augmented treatment respectively), but significantly different at endpoint (placebo/basic treatment 7.1 (± 9.3) µg/L; risperidone/augmented treatment 36.0 (± 27.5) µg/L; Wilcoxon ranked sum test, P < 0.001). Using upper limits higher than 18.0 ng/mL for boys and higher than 30 ng/mL for girls, 68% assigned to risperidone (augmented) treatment had elevated prolactin levels compared with 5% assigned to placebo (basic) treatment. None were considered to be causing sexual or other adverse events according to the authors.
In Fleischhaker 2011, the reported metabolic data were only limited to incidence of hyperprolactinaemia (3/25 in the ziprasidone group and 1/25 in the placebo group). No blood results were reported.
In the first version of this review (Loy 2012), we wrote to all eight authors and had replies from four of them. Professor Connor and Dr Coppola, from Johnson and Johnson, responded on behalf of three authors: Aman, Synder and Reyes. The response for Reyes for glucose was: "No statistical testing was performed on laboratory analyses for this study. The statement was based on clinical assessment of mean changes. Note that the protocol specified that blood samples for clinical laboratory evaluations were to be obtained after an overnight fast. Although the majority (n = 368) of subjects were considered fasting, 138 subjects were identified as not fasting in regard to glucose changes from screening. The results described here (in the raw data) were for all data regardless of the fasting conditions." (Loy 2011a [pers comm]). We were unable to interpret the raw data, which had a mixture of fasting and non‐fasting glucose values.
Secondary outcomes
1. General functioning
Only one trial reported on general functioning (Reyes 2006a), using the Children's Global Assessment Scale (CGAS; Shaffer 1983). Participants treated with risperidone improved significantly more on CGAS than those on placebo.
The TOSCA study reported that there were no significant differences between scores at the end of treatment for groups on the Clinical Global Impression ‒ Improvement (CGI‐I; Guy 1976) and Clinical Global Impression ‒ Severity (CGI‐S; Rapoport 1985).
2. Non‐compliance
The number of participants (n) who withdrew due to adverse events was small (n = 15: one in Findling 2000; two in Aman 2002; eight in Reyes 2006a; one in Connor 2008; three in the TOSCA study). Overall, very few participants (n = 13) withdrew due to non‐compliance with treatment protocol (two in Findling 2000; three in Aman 2002; two in Armenteros 2007; two in Connor 2008; four (categorised as "terminated for non‐adherence") in the TOSCA study). The TOSCA study provided detailed tables explaining participant attrition; in the earlier studies, however, the details of non‐compliance were not defined.
3. Other adverse events
Table 4 summarises other adverse events besides weight gain and metabolic parameters, which are reported above. We grouped them into 'general', 'neurological', 'gastrointestinal', 'respiratory', 'cardiovascular' and 'other' side effects. Both the TOSCA study and Fleischhaker 2011 provided detailed information on adverse events in their respective publications. Two trials reported unspecified, serious adverse events but provided no details on what they were (Snyder 2002; Reyes 2006a). Van Bellinghen 2001 reported no data on adverse events.
4. Social functioning
One trial reported that scores on the Personal Assessment Checklist significantly favoured risperidone over placebo in terms of social relationships (mean change at endpoint = 1.3 for risperidone‐treated group compared with mean change at endpoint = 0.1 for placebo‐treated group) (Van Bellinghen 2001), but no SDs were provided by the authors, and the number of participants in this study was low (n = 13).
5. Parent satisfaction
Rundberg‐Rivera 2015 (a secondary publication to the TOSCA study) reported findings regarding parent satisfaction of those who had participated in the TOSCA study. Parents completed the Parent Satisfaction Questionnaire (PSQ), consisting of 18 items (Stallard 1996), to evaluate the: (1) overall levels of satisfaction in the study, (2) differences in satisfaction between responders and non‐responders, (3) differences in satisfaction based on treatment assignment (placebo versus active treatment), and (4) relation of study condition with parental confidence in managing problem behaviours. The authors reported no statistically significant differences between group allocation and parent satisfaction using three items on the PSQ (items six, seven and 18; P value greater than or equal to 0.72).
6. Family functioning, parent satisfaction, functioning at school
There was no information available on family functioning and functioning at school.
Subgroup analysis
The systematic review became focused on risperidone, as there was only one pilot study on quetiapine (Connor 2008), and one on ziprasidone (Fleischhaker 2011), compared with the eight trials on risperidone. In the first version of this review (Loy 2012), which spanned studies from 2000 to 2008, there was no clinically significant diversity in doses of risperidone between studies. The mean doses at endpoint ranged from 0.98 mg/day to 1.5 mg/day. The TOSCA study used a higher dose of risperidone: for children weighing less than 25 kg risperidone was dosed at 0.5 to 2.5 mg/day and for those weighing more than 25kg dosing ranged from 0.5 to 3.5 mg/day.
There was inadequate information from the original papers to do subgroup analyses by presence/absence of ADHD, presence/absence of psychostimulants, or presence/absence of intellectual disability. We note that Aman 2002 and Snyder 2002 conducted a post‐hoc analysis in a separate paper (Aman 2004), assessing risperidone effects in the presence/absence of psychostimulant medicine in participants with ADHD and disruptive behaviour disorders, and showed significant reductions in both disruptive behaviour and hyperactivity compared to placebo, regardless of concomitant stimulant use.
With regard to the duration of treatment, two pilot risperidone studies were 10 weeks and four weeks (Findling 2000 and Van Bellinghen 2001 respectively). Subsequent studies were mainly six weeks in duration (Buitelaar 2001; Aman 2002; Snyder 2002; TOSCA study); Armenteros 2007 lasted four weeks. The pilot study on quetiapine was six weeks (Connor 2008); and the pilot study on ziprasidone had a three‐week baseline period for finding the best individual dose, a six‐week treatment period and two‐week washout period (Fleischhaker 2011). There was only one study looking at six‐month risperidone maintenance treatment and 'time‐to‐symptom' recurrence (Reyes 2006a). Trial authors reported that 'time‐to‐symptom' recurrence was significantly longer in patients who continued risperidone than in those switched to placebo.
Discussion
Summary of main results
Overall, there was some evidence of limited efficacy of risperidone in reducing aggression and conduct problems in the short term in children and youths (aged five to 18 years) with disruptive behaviour disorders (four to 10 weeks), from a small number of studies in which there was some risk of bias of overestimating the true intervention effect. There were significant methodological limitations (Quality of the evidence), which impact on our confidence in the estimation of effect. There is no current evidence for the efficacy of quetiapine and ziprasidone on aggression and conduct problems in children and youths. Earlier studies did not include psychosocial interventions and stimulant medication treatments for comorbid ADHD in disruptive behaviour disorders. Recently, however, there has been some effort to address this in response to clinical guidelines and best clinical practice. So far there is only one trial which investigates the risperidone augmentation/combination with simultaneous stimulant medication and parent training in disruptive behavioural disorders. Risperidone treatment is associated with significant adverse events of weight gain and metabolic dysfunction.
For aggression, the difference in scores of 6.49 points on the ABC ‒ Irritability subscale (range 0 to 45) may be clinically significant. Owen 2009 used a difference of seven points on the ABC ‒ Irritability subscale as a measure of a clinically significant difference between treatment and placebo for children and adolescents with autistic disorder. Hassiotis 2009 used a difference of eight points on the ABC ‒ Irritability subscale between the treatment and control group to detect a clinically significant difference for challenging behaviour in adults with intellectual disabilities. The meaning of the differential findings on the two different ABS subscales is unclear. The scale splits aggression into two conceptually different constructs: reactive ("hot") and proactive ("cold"). From a clinical perspective, it can be difficult to distinguish between the two types of aggression. When we look at the risperidone‐only studies (Buitelaar 2001; TOSCA study), the differential findings on the two different ABS subscales remain, though the effect becomes larger and more precise as the heterogeneity of the meta‐analysis is reduced when we take out the quetiapine study (Connor 2008). In the future, we will consider pooling only risperidone studies.
For conduct problems, the difference in mean scores of 8.61 points on the NCBRF‐CP (range 0 to 48) is likely to be clinically significant. A difference of seven or more points on NCBRF‐CP by Reyes 2006a, and a difference of at least eight points on NCBRF‐CP by Tassé 1996, were considered to be clinically relevant differences between treatment and placebo in children and adolescents with disruptive behaviour disorders.
For weight gain, our meta‐analyses suggest a range in the average differences in weight gain from 2.14 kg to 2.37 kg over the treatment period, depending on whether there was concomitant administration of stimulant medication, which acts as an appetite suppressant. While weight is well documented, other metabolic side effects — including hyperprolactinaemia — were not well studied in the trials. However, these still need to be factored in clinically, as part of the risk benefit consideration.
Please refer to summary of findings Table for the main comparison.
Overall completeness and applicability of evidence
Ten RCTs assessed the efficacy of atypical antipsychotics in disruptive behaviour disorders in children and youths. Of these, eight trials assessed risperidone, one assessed quetiapine and one assessed ziprasidone. There were no RCTs in disruptive behavioural disorders for olanzapine, aripiprazole and the other newer atypical antipsychotics. Of the eight risperidone studies, three were pilot trials. One was a pilot trial of risperidone augmentation for treatment‐resistant aggression in ADHD (Armenteros 2007); one was a study of risperidone in the treatment of conduct disorder (Findling 2000); and one was a pilot trial of risperidone in the treatment of behavioural disturbances in children and youths in residential care with borderline intellectual functioning (Van Bellinghen 2001). The quetiapine trial was a pilot study of quetiapine in the treatment of conduct disorder (Connor 2008). The ziprasidone trial was also a pilot study of ziprasidone in the treatment of severe conduct disorder/disruptive behaviour disorders in children and youths (Fleischhaker 2011). Thus out of the 10 included trials, five are pilot trials, which has implications in terms of number of participants per trial.
There were small numbers of participants in five trials (38 participants or fewer) (Findling 2000; Buitelaar 2001; Van Bellinghen 2001; Armenteros 2007; Connor 2008). This had a significant impact on the power of the studies and the precision of the estimate of the effect. One trial had 50 participants (Fleischhaker 2011); two trials had over 100 participants each (Aman 2002; Snyder 2002); one had 168 participants (TOSCA study); and one had over 300 participants (Reyes 2006a). Participants in the trials were between five and 18 years of age. There were no data for children under five years. The study on quetiapine (Connor 2008), which had a small sample size and was inadequately powered, produced a non‐significant result for aggression. The study on ziprasidone was also underpowered and found no significant effect of the active agent (ziprasidone) compared with the placebo group at the end of treatment (Fleischhaker 2011).
Aman 2002 and Snyder 2002 were larger, outpatient, multicentre, randomised, double‐blind controlled trials of risperidone and placebo in children and youths with disruptive behaviour disorders and sub‐average IQ. Buitelaar 2001 was a randomised, double‐blind controlled trial of risperidone and placebo in inpatient youths with disruptive behaviour disorders and an IQ between 60 and 90. The TOSCA study was a large, multicentre trial. It had a complex study design with three treatment components and may be viewed as an augmentation study or a combination treatment study. What is important about the trial design in terms of the findings is that it sought to replicate ideal clinical treatment in the trial, with all participants already receiving stimulants for ADHD and parent training before the addition of risperidone.
Nine trials focused on acute efficacy (Findling 2000; Buitelaar 2001; Van Bellinghen 2001; Aman 2002; Snyder 2002; Armenteros 2007; Connor 2008, Fleischhaker 2011; TOSCA study), with the duration of intervention at four, six and 10 weeks. The tenth study was a six‐month maintenance trial looking at 'time‐to‐symptom' recurrence (Reyes 2006a). The duration of a RCT is an important consideration given the episodic nature of aggression, the natural waxing and waning of conduct problems, and the stability and the chronicity of the diagnosis of disruptive behaviour disorder, and in particular of conduct disorder (Steiner 1997; Steiner 2007; Connor 2008). Thus far, the follow‐up period in the trials is not long enough to demonstrate whether or not there is a sustained effect. We await the publication of the follow‐up results from the TOSCA study.
Due to the short duration of treatment in most trials there was a focus on short‐term adverse events. Earlier trials focused on weight gain, extrapyramidal side effects and prolactin levels. Metabolic side effects were poorly addressed in earlier trials; they were better documented in later trials (TOSCA study). Some trials continued as open‐label studies looking at safety, tolerability and continuation of effects of risperidone, but they were outside the parameters of this review. The long‐term, open‐label studies of risperidone in children with disruptive behaviour disorders were Turgay 2002, Croonenberghs 2005, Findling 2006 and Haas 2008, with up to one year's follow‐up; and Reyes 2006b, with up to three years' follow‐up.
Seven trials — Findling 2000, Buitelaar 2001, Aman 2002, Snyder 2002, Reyes 2006a, Connor 2008, and the TOSCA study — focused on a DSM‐IV diagnosis of a disruptive behaviour disorder with comorbid ADHD (American Psychiatric Association 2000); one trial focused on treatment‐resistant aggression in ADHD (Armenteros 2007); one trial measured behavioural symptoms instead of diagnoses (Van Bellinghen 2001); and one trial focused on primary DSM‐IV diagnoses of conduct disorder, oppositional defiant disorder and disruptive behaviour disorder not otherwise specified (Fleischhaker 2011). Trials that used DSM‐IV diagnoses would be more applicable clinically. The majority of the trials included participants with moderate‐to‐severe symptom severity and of clinical concern. This reflected clinical practice and circumstances where medication was warranted.
Seven trials included a significant number of participants with sub‐average to borderline IQ (range 36 to 84) (Findling 2000; Buitelaar 2001; Van Bellinghen 2001; Aman 2002; Snyder 2002; Reyes 2006a; Fleischhaker 2011), and only two trials, Reyes 2006a and Fleischhaker 2011, provided information on numbers, with approximately two‐thirds of participants having an IQ greater than 84 and IQ greater than 55, respectively. Armenteros 2007, Connor 2008 and the TOSCA study specifically excluded participants with sub‐average IQ. Thus the studies represented a mixed sample. In clinical practice, disruptive behavioural disorders are found in children and youths with both sub‐average and normal IQ and so the sample from the reviewed trials appears to be generalisable to the ones encountered in a clinical context.
With regards to the setting: eight studies were conducted with an outpatient population; one study looked at children in residential care (Van Bellinghen 2001); and one was carried out with inpatients (Buitelaar 2001). Outpatient management would be the most common in clinical practice and some children and youths with intellectual disability/mental retardation may be in residential care.
An important limitation in the evidence base was that earlier trials did not address the issue of pre‐existing or concurrent use of psychosocial treatments for disruptive behaviour disorders with medications, which is applicable in clinical practice. In one trial (Buitelaar 2001), it was specified that the participants had previously failed psychosocial treatment (contingency management and social skills training) before starting intervention with antipsychotic medication. Aman 2002 permitted behavioural therapy if it had started 30 days before the trial. Armenteros 2007 and Connor 2008 allowed "pre‐existing or current psychosocial interventions". The remaining trials did not comment on psychosocial interventions. There was no information in any of the trials about how many participants actually had concomitant psychosocial treatments and no further details of those treatments were described. This limitation was addressed directly by the TOSCA study, where all parents received evidence‐based parent training with monitoring of fidelity. This reflects ideal, optimal clinical treatment and the implication is that future clinical trials should incorporate psychosocial treatment into their designs.
Another limitation of the evidence was the comorbid treatment of ADHD with stimulant medication. There was no information available in earlier papers on the doses of stimulant medications used by participants: this was addressed by the TOSCA study to some extent. From baseline, there was a three‐week, open‐label, stimulant titration followed by six weeks of a double‐blinded, placebo‐controlled comparison of added risperidone versus placebo. Blader 2014 critiqued the three‐week duration of the pre‐treatment as not being long enough to establish an optimal stimulant regime. In the Blader 2013 study of adjunctive sodium valproate for ADHD children with aggression, the stimulant dosing took five to seven weeks or longer (alongside behaviour therapy) and, consequently, at least half the patients (82 out of 160 patients) showed remission of their aggressive behaviour. This compares with eight out 138 patients in the TOSCA study trial who responded to stimulants in the lead‐in phase. Blader 2014 also noted that adherence to stimulant treatment was not specifically addressed in the TOSCA study trial. ADHD symptom outcome was reported in a secondary paper (Gadow 2014).
Quality of the evidence
Important methodological limitations were present in the trials included in this review. Some of the trials were carried out pre‐CONSORT statement of 2001 (Moher 2001), thus the level of reporting currently expected was not available in the papers describing these studies, particularly with regard to the allocation concealment, randomisation and blinding processes. Fleischhaker 2011 did not follow the CONSORT standards. Reyes 2006a reported that they were unable to exclude the possibility of selection bias as only patients who responded to the initial acute treatment were subsequently randomised. No protocol was available for any of the trials. Three of the eight trials implemented a one‐week placebo run‐in to exclude placebo responders (Aman 2002; Snyder 2002; Connor 2008). One critique of this design was that placebo washout causes artificial inflation of the numbers apparently responding to the active drug and reduction of the numbers apparently responding to placebo (Jackson 2005, cited in Timimi 2008).
The overall attrition rate was relatively high, varying between 0% and 40% in the intervention group and 0% and 70% in the control group. This group of participants is difficult to study as, by definition, children and youths with disruptive behaviour disorders may not adhere to the rules of the treatment and research protocol; they may be oppositional and may not come for follow‐up appointments, and they may be itinerant. Therefore high dropout rates may be expected.
There were shortcomings in dealing with incomplete outcome data, in particular the use of the last observation carried forward as an imputation method to address incomplete data (Buitelaar 2001; Aman 2002; Snyder 2002; Reyes 2006a; Armenteros 2007). Criticisms against this method are that it is based on the underlying assumption that an individual’s missing value has not changed from the previously measured value and that it fails to account for the uncertainty about missing values (Wood 2004; Sterne 2009) and risk, resulting in standard errors that are too small (Sterne 2009) or CIs that are too narrow (Higgins 2011a). On the other hand, a limitation of the TOSCA study is that the published data are based on analysis of those who completed the study only, and the sensitivity analyses are not available for comparison. The overall implication is a potential risk of attrition bias, which may lead to an overestimation of the effect size.
Another methodological shortcoming is that there are significant overlaps in theoretical construct and measurement of aggression and conduct problems (Jensen 2007a; Calles 2011). There are no current gold standard measures of aggression or conduct problems. One implication is that by using different measures and reporting standards, it is challenging to pool the results for the purpose of a meta‐analysis or to understand the results from a clinical perspective.
All earlier trials had some degree of pharmaceutical support or sponsorship. Fleischhaker 2011 was an investigator‐initiated trial, financially supported by a pharmaceutical company. One trial specifically stated that the authors analysed all the data and completed all the writing (Connor 2008). From email correspondence (Loy 2016a [pers comm], we learned that the TOSCA study originally requested a pharmaceutical company to sponsor the study medication. Due to lack of agreement over certain issues, this fell through, except for one trial site. Subsequently, the authors obtained funding from the National Institute of Mental Health (NIMH) to purchase the study medications (both stimulant and risperidone and placebo) from an independent pharmacy. Only one study site, from which approximately 50 participants were recruited, received medication sponsored by the pharmaceutical company. It is possible that the centre used pharmaceutical‐supplied medication for one or two participants only. There were 168 participants in the trial. The lead author's view from this trial was that the pharmaceutical involvement was virtually nonexistent. There was no information available regarding this for the remainder of the trials.
For each trial included in the review, there were some areas of unclear bias and these are listed in the 'Risk of bias' tables, beneath the Characteristics of included studies tables. The overall quality of four trials was better than the others (Aman 2002; Snyder 2002; Reyes 2006a; TOSCA study), due to these trials being adequately powered and more methodologically rigorous, and therefore more trustworthy. Overall, we graded the quality of evidence as low, with the exception of the TOSCA study (Figure 3). Further research is very likely to have an important impact on our confidence in the estimate of effect and is likely to change the estimate, given all the study limitations as well as methodological shortcomings. These are also listed in summary of findings Table for the main comparison.
Potential biases in the review process
We conducted a comprehensive review of published literature from databases and trial registers and extracted and synthesized the available information. However, we cannot be confident about the grey literature. We acknowledged the authors who replied to our queries for further clarification in the original review (Loy 2012); and acknowledge those who replied in this update (see Acknowledgements). There were authors who did not reply to our requests for further information and, therefore, we had to classify some aspects of the trials as 'unclear' especially with regards to methodological issues. This has an impact on our 'Risk of bias' assessment and GRADE assessment in terms of downgrading the evidence.
Agreements and disagreements with other studies or reviews
Differences to the previous version of this review, Loy 2012, include the addition of two new trials (one of which was published in a peer review journal (TOSCA study), and the other published as a conference poster (Fleischhaker 2011)); the synthesis of additional and combined data into one analysis; the discovery of two trials that were terminated at the recruitment stage and were never completed (one due to slow recruitment (NCT00279409), and the other due to drug formulation availability issues (ISRCTN95609637)); and recent updates in the literature.
Since the publication of our review in 2012 (Loy 2012), a number of new, clinical guidelines have been developed. The original guideline was the "TRAAY‐ Treatment recommendations for the use of antipsychotics for aggressive youth" (Pappadopulos 2003). Since 2012, the Treatment of Maladaptive Aggression in Youth (T‐MAY) Center for Education and Research on Mental Health Therapeutics (CERT) Guidlines I and II have been developed (Knapp 2012; Scotto Rosato 2012). Scotto Rosato 2012 recommended using evidence‐based, psychosocial interventions as the first line of treatment; targeting the underlying disorder first; considering individual psychosocial and medical factors in the selection of drugs, if evidence‐based medication treatment is initiated; avoiding the use of multiple, psychotropic medications simultaneously; and careful monitoring of treatment response by using structured rating scales, as well as careful monitoring for side effects.
Canadian guidelines on pharmacotherapy for disruptive and aggressive behaviour in children and adolescents with ADHD, oppositional defiant disorder and conduct disorder suggest that atypical antipsychotics are introduced only if psychosocial interventions have not shown adequate improvement (Gorman 2015). Risperidone received a conditional recommendation in this guideline due to risk of adverse effects. The results of this review are consistent with the role of risperidone given in these clinical guidelines. Only one trial in this review — the TOSCA study — closely resembles best, real world, clinical practice as outlined in the treatment recommendations.
A review by Pappadopulos 2006 reported a mean effect size of 0.9 for aggression for risperidone in treating disruptive behaviour disorders in children and adolescents. The studies in Pappadopulos 2006, which required effect‐size calculations for multiple raters, were averaged to determine the overall effect size. There were two duplications in this review as both Aman 2004 and LeBlanc 2005 were not stand‐alone studies but described post‐hoc analyses of the data from Aman 2002 and Snyder 2002 combined. The review also included some studies of children and youths with autistic spectrum disorder and disruptive behaviour disorders in the same analysis while autism spectrum disorder was not in our inclusion criteria. The effect size reported in Pappadopulos 2006 is large compared to the small effect size from our meta‐analysis for aggression for risperidone. The difference in our view is probably due to the inclusion of studies of children and youths with autistic spectrum disorder and comorbid disruptive behaviour disorders. Pappadopulos 2006 summarised and averaged the published effect sizes instead of conducting a meta‐analysis and this may have led to an overestimation of the effect size. The analysis by Jensen 2007b was similar to our review. There were six studies in the Jensen 2007b review with the exception of Armenteros 2007 and Connor 2008. Another issue was that the two reviews — Pappadopulos 2006 and Jensen 2007b — did not present CIs alongside the effect sizes. Since 2009, the sixth edition of the American Psychological Association's Publication Manual states that “estimates of appropriate effect sizes and confidence intervals are the minimum expectations” (American Psychological Association 2010, p 33).
Seida 2012 published a report called, "Antipsychotics for children and young adults: a comparative effectiveness review". This is a broad (non‐Cochrane) systematic review of the effectiveness and safety of first‐ (FGA) and second‐generation antipsychotics (SGA) for patients aged 24 years and younger with psychiatric and behavioural conditions. Because the authors focused on breadth, there is less depth in their analysis. A useful feature of this review is the authors' highlight of the number of studies looking at effectiveness (FGA versus SGA) and efficacy (drug versus placebo). They also identified the same eight studies for disruptive behaviour disorder. Their conclusion is that youths treated with risperidone had greater improvement on behavioural symptom measures and on CGI measures compared to placebo, with moderate strength of evidence. This is in contrast with our more conservative estimate of the effect.
Pringsheim 2012 reported a non‐Cochrane systematic review in December 2012, subsequent to our Cochrane Review, with the same eight trials and similar findings to ours. Duhig 2013 is a non‐Cochrane, non‐systematic review, specifically examining the efficacy of risperidone studies in children and adolescents with disruptive behavioural disorders. The authors cited the same seven trials of risperidone included in this review with similar findings. Pringsheim 2015 is a non‐Cochrane, systematic review of RCTs of antipsychotics, lithium and anticonvulsants. They included 11 RCTs of antipsychotics and seven RCTs of lithium and anticonvulsants. The authors concluded that there is "moderate quality evidence that risperidone has a moderate‐to‐large effect in conduct problems and aggression in youth with sub‐average IQ and ODD [oppositional defiant disorder], CD [conduct disorder] or DBD‐NOS [disruptive behaviour disorder ‐ not otherwise specified], with and without ADHD, and high‐quality evidence that risperidone has a moderate effect on disruptive and aggressive behaviour in youth with average IQ and ODD or CD, with or without ADHD". The authors also concluded that the evidence to support the use of antipsychotics and mood stabilizers is of low quality except for risperidone. Again, our findings are more conservative.
Our review does not include general expert opinion, commentary or partial reviews (Nevels 2010; Teixeira 2013b); or inpatient treatment of aggression in youths (Deshmukh 2010).
The TOSCA study group have published the results of their 12‐month naturalistic follow‐up (Gadow 2016), with an aim to report on the treatment regime, behavioural outcomes and adverse events. Following the nine‐week trial, blinded treatment of clinical responders continued until week 21 (Findling 2017). (Results were not available at the cut‐off date for this review, 19 January 2017, and therefore have not been included.) After week 21, study blind was broken and study staff assisted families to find ongoing care. According to the authors, after week 21, treatment was no longer free of charge to the families (Gadow 2016). At 12 months, there were 108 participants available for the follow‐up (basic = 55; augmented = 53), comprising 64% of the original sample. Of the participants, 43% in the augmented group and 36% in the basic group adhered to their assigned medication regimen; 23% in the augmented group and 11% in the basic group were not taking medications. About half of the participants were receiving modified drug treatment consisting of multiple drugs, including alpha agonists, selective serotonin reuptake inhibitors (SSRIs) and anti‐epileptics, in addition to stimulants and atypical antipsychotics in various permutations. While both treatment strategies were associated with clinical improvement at follow‐up, and primary behavioural outcomes did not differ significantly, parents still rated 45% of participants as impaired 'often or very often' from ADHD and as non‐compliant or aggressive. The authors raised issues of the impact of terminating parent training after week 21, and the impact of the unaffordability of the recommended treatment on long‐term outcomes (Gadow 2016).
It is important to note the theoretical concerns and themes in the literature regarding short‐ and long‐term side effects, and ultimately safety concerns for children and youth, to have a sense of the extent and depth of the problem (Devlin 2015). This will affect the risk‒benefit consideration and impact on decision on starting, adhering to, and persisting in treatment (Murphy 2015).
The weight gain reported in our review is of concern. It is unclear if the effect will attenuate over time. Correll 2009 suggests that interpretation of data may be hampered by variables prior to antipsychotic medication exposure, which can obscure cardiometabolic effects. In his prospective cohort study of weight and metabolic changes in paediatric patients naive to antipsychotic medication, 22.1% (60 participants) of the sample (272 participants) had disruptive or aggressive behaviour disorders. The rest had mood or schizophrenia spectrum disorders. After a median of 10.8 weeks of treatment, weight increased by 5.3 kg (95% CI 4.8 to 5.9 kg) in those treated with risperidone (135 participants). However, other authors of open‐label studies of risperidone for disruptive behaviour disorders in children and youth suggest that weight gain was greatest early on and levelled off between six and 12 months (Croonenberghs 2005, 504 participants; Turgay 2002, 77 participants) and two years (Reyes 2006b, 35 participants). About half of the mean weight gain of participants on risperidone at year one was attributable to developmentally expected growth (Turgay 2002; Findling 2004; Croonenberghs 2005).
In the 12‐month follow‐up of the TOSCA trial (Gadow 2016), the group exposed to risperidone treatment (augmented group) experienced an increase in weight from the end of acute treatment (week nine) till week 52, and weight gain was maintained at week 52, while the non‐exposed group (basic group) experienced decreased weight over time. Both groups had prior, concurrent stimulant treatment. The augmented group also had elevated prolactin levels (59%) compared to the basic group (5%) at 52 weeks (Gadow 2016). In a systematic review of cardiometabolic and endocrine side effects of atypical antipsychotics in children and adolescents, De Hert 2011 reported that risperidone was associated with intermediate weight gain (1.76 kg, 95% CI 1.27 to 2.25; 1200 participants).
Apart from weight gain, other cardiometabolic side effects like abdominal adiposity, hypertension, dyslipidaemia, insulin resistance and metabolic syndrome have been reported in children and youths treated with atypical antipsychotics (Devlin 2015). Recent estimates from longitudinal studies suggest that SGA‐treated children have a threefold greater risk of developing type 2 diabetes compared with untreated children. If there are problems of childhood obesity, it is associated with vascular damage in childhood, and with greater risk of cardiovascular disease in adulthood and at an earlier onset (Devlin 2015). Research into some genetic variants that may be useful in predicting cardiometabolic side effects in SGA‐treated children is still in its infancy (Devlin 2015).
It is known that risperidone can increase prolactin levels (Perkins 2004). One issue is that children may not have more common side effects of hyperprolactinaemia like galactorrhoea, amenorrhoea and sexual dysfunction. One concern is that hyperprolactinaemia at levels leading to hypogonadism may be associated with osteoporosis (Almandil 2011). Other (unconfirmed) potential risks from childhood hyperprolactinaemia are risk of breast cancer and pituitary tumours (Perkins 2004; Correll 2008). Little is known about the long‐term effects of risperidone treatment received early in the developmental course. In one animal study, adult rats treated with risperidone during development are hyperactive (Bardgett 2013). The authors queried whether chronic antipsychotic drug use in a paediatric population may modify brain development and alter neural set points for future specific behaviours.
Vitiello 2009 proposed that short‐term use of atypical antipsychotics includes a treatment course of less than six months, an intermediate treatment course of 18 months and long‐term use as beyond that. The authors' view is that distal benefit/risk ratio remains to be determined for long‐term treatment for atypical antipsychotics in general for children and adolescents. Caccia 2011 did a review on antipsychotic toxicology in children. The authors raised multiple, pertinent issues relating to further research on mechanisms underlying adverse effects, genetic risk of specific toxicities induced by antipsychotics and, because long‐term safety data are limited, advocated for permanent, systematic and collaborative epidemiological assessments and quantification for long‐term monitoring in this age group.
This challenge of a pharmacovigilance system has been taken up by the SENTIA (Safety of Neuroleptics in Infancy and Adolescence) project, which is an online monitoring registry in Spain (Palanca‐Maresca 2014). Another initiative, called the PERS (Pediatric European Risperidone Studies) project, plans to look at long‐term tolerability in a two‐year pharmacovigilance in children and adolescents with conduct disorder and normal intelligence (Glennon 2014).

study flow diagram
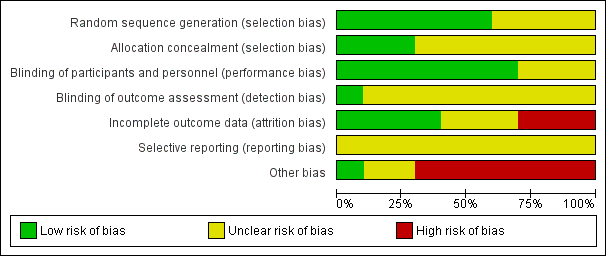
Risk of bias graph: review authors' judgements about each risk of bias item presented as percentages across all included studies.
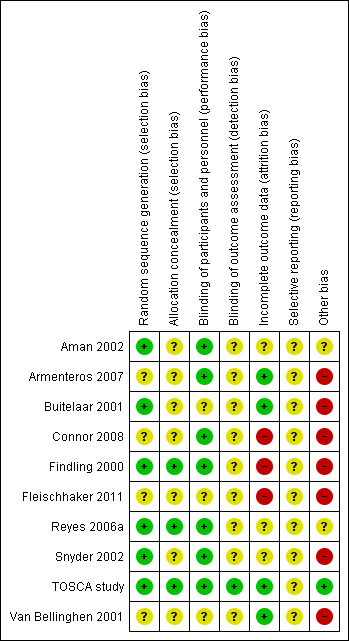
Risk of bias summary: review authors' judgements about each risk of bias item for each included study.
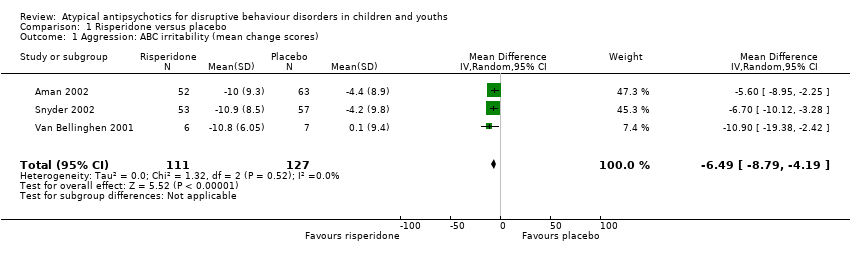
Comparison 1 Risperidone versus placebo, Outcome 1 Aggression: ABC irritability (mean change scores).

Comparison 1 Risperidone versus placebo, Outcome 2 Aggression: OAS‐M, ABS Reactive subscale (final scores).

Comparison 1 Risperidone versus placebo, Outcome 3 Aggression: OAS‐M, ABS Proactive subscale (final scores).

Comparison 1 Risperidone versus placebo, Outcome 4 Conduct: NCBR‐CP (mean change scores).

Comparison 1 Risperidone versus placebo, Outcome 5 Weight gain (antipsychotic only): Kg (mean change scores).

Comparison 1 Risperidone versus placebo, Outcome 6 Weight gain (antipsychotic and stimulant): Kg (mean change scores).
| Risperidone compared to placebo for disruptive behaviours in children and youths | ||||||
| Patient or population: Disruptive behaviours in children and youths | ||||||
| Outcomes | Anticipated absolute effects* (95% CI) | Relative effect | № of participants | Quality of the evidence | Comments | |
| Risk with placebo | Risk with risperidone | |||||
| Aggression | The mean aggression ABC‐I score ranged across control groups from −4.40 to 0.10 | The mean aggression ABC‐I score in the intervention groups was, on average, 6.49 lower (8.79 lower to 4.19 lower) | ‐ | 238 | ⊕⊕⊝⊝ | Included studies: Aman 2002; Snyder 2002; Van Bellinghen 2001 |
| Aggression | The mean aggression OAS‐M and ABS Proactive score ranged across control groups from 8.10 to 15.10 | The mean aggression OAS‐M and ABS Proactive score in the intervention groups was, on average, 1.12 lower (2.30 lower to 0.06 higher) | ‐ | 190 | ⊕⊕⊕⊝ | Included studies: Buitelaar 2001; TOSCA study |
| Conduct | The mean conduct score ranged across control groups from −6.20 to 25.80 | The mean conduct score in the intervention groups was, on average, 8.61 lower (11.49 lower to 5.74 lower) | ‐ | 225 | ⊕⊕⊕⊝ | Included studies: Aman 2002; Snyder 2002 |
| Weight gain (treatment with antipsychotic only) | The mean weight gain (treatment with antipsychotic only) score in the control groups ranged from 0.74 to 0.90 | The mean weight gain score in the intervention groups was, on average, 2.37 higher (0.26 higher to 4.49 higher) | ‐ | 138 | ⊕⊕⊕⊝ | Included studies: Aman 2002; Findling 2000 |
| Weight gain (treatment with antipsychotic and stimulant) | The mean weight gain (treatment with antipsychotic and stimulant) score in the control groups ranged from −1.20 to 0.90 | The mean weight gain score in the intervention groups was, on average, 2.14 higher (1.04 higher to 3.23 higher) | ‐ | 305 | ⊕⊕⊝⊝ | Included studies: Aman 2002; Findling 2000; TOSCA study |
| *The risk in the intervention group (and its 95% confidence interval) is based on the assumed risk in the comparison group and the relative effect of the intervention (and its 95% CI). ABS: Antisocial Behavior Scale;CI: Confidence interval; MD: Mean difference;OAS: Overt Aggression Scale;OAS‐M: Overt Aggression Scale ‒ Modified; RCT: Randomised controlled trial; SMD: Standardized mean difference | ||||||
| GRADE Working Group grades of evidence | ||||||
| 1 Downgraded 2 levels because of unclear risk of bias due to lack of information on selection bias and detection bias in 2 studies, and unclear risk of bias due to lack of information and poor reporting standards in 1 study. 2 trials assessed outpatients, 1 trial assessed patients in residential care. 2 Unclear allocation concealment and unclear blinding of outcome assessment for 1 study and potential reporting bias in both studies. 3 Downgraded 1 level because of unclear allocation concealment and unclear blinding of outcome assessment for both studies and unclear attrition and potential reporting bias. 4 Downgraded 1 level because of unclear blinding of outcome assessment and potential reporting bias. Heterogeneity: Tau² = 2.22; Chi² = 20.77, df = 1 (P < 0.00001); I² = 95%. 5 Downgraded 2 levels because of unclear blinding of outcome assessment in 2 studies, potential reporting bias in 3 studies, and potential attrition bias in 2 studies. Heterogeneity: Tau² = 0.85; Chi² = 23.32, df = 2 (P < 0.00001); I² = 91%. | ||||||
| Analysis | Method |
| Measures of treatment effect | For dichotomous data, we planned to analyse data on the intention‐to‐treat principle with dropouts included in the analysis. Out of the 10 studies, 1 used dichotomous outcomes (Armenteros 2007), therefore we were not able to perform further analyses. |
| Unit of analysis issues | For cross‐over trials, we planned to do paired analysis if data were presented. Otherwise, we planned to take all measurements from intervention periods and all measurements from control periods and analyse these as if the trial was a parallel‐group trial, acknowledging that there might be unit of analysis errors that could underestimate the precision of the estimate of the treatment effect (Deeks 2011). However, no cross‐over trials were identified. Also, there were no cluster‐randomised controlled trials, so we did not have to take this into account in our analyses. |
| Dealing with missing data ‒ missing participants | We intended to calculate the best‐ and worst‐case scenarios for the clinical response outcome, if possible. For example, the best‐case scenario assumed that dropouts in the intervention group had positive outcomes and those in the control group had negative outcomes. In the worst‐case scenario, dropouts in the intervention group had negative outcomes and those in the control group had positive outcomes. |
| Assessment of heterogeneity | Chapter 9 in the Cochrane Handbook recommends using a range for I² and a guide to interpretation (Deeks 2011). Had we found either moderate heterogeneity (I² in the range of 30% to 60%) or substantial heterogeneity (I² in the range of 50% to 90%), as specified in our protocol (Loy 2010), we planned to examine it using specified subgroup and sensitivity analyses (see Subgroup analysis and investigation of heterogeneity and Sensitivity analysis). |
| Assessment of reporting bias | We intended to draw funnel plots (effect size versus standard error) to assess publication bias if sufficient studies were found. Asymmetry of the plots may indicate publication bias, although they may also represent a true relationship between trial size and effect size. If such a relationship were identified, we planned to examine the clinical diversity of the studies as a possible explanation (Egger 1997). There were insufficient studies in our meta‐analysis to perform a funnel plot. |
| Subgroup analysis and investigation of heterogeneity | It was our intention to conduct separate analyses on the following subgroups, where possible.
There were too few studies in any of the analyses for us to carry out any subgroup analyses. |
| Sensitivity analysis | We intended to perform sensitivity analyses to explore whether the results of the review were robust in relation to certain study characteristics. We intended to exclude trials with 'no' or 'unclear' ratings for allocation concealment and use the fixed‐effect model for our primary outcome. We identified a limited number of trials and we did not exclude any of them based on the ratings of allocation concealment. We were not able to carry out a sensitivity analysis due to the small number of trials. |
| ADHD: attention deficit hyperactivity disorder | |
| Name of rating scale | Description | Construction | Study | Source of Information used in the study |
| Aberrant Behaviour Checklist (ABC) (Aman 1985a; Aman 1985b) | Symptom checklist for assessing problem behaviours of children and adults with mental retardation. It is also used for classifying problem behaviours of children and adolescents with mental retardation. | 58 items, 5 scales.
| Parent/caregiver | |
| Child Behaviour Checklist (CBCL) (Achenbach 1991)
| Checklist for evaluating maladaptive behavioural and emotional problems. | 113 items, 8 subscales.
| Parent | |
| Overt Aggression Scale (OAS) (Yudofsky 1986) | Assesses the severity and frequency of overt aggression. | 25 items, 4 subscales.
Within each category, aggressive behaviour is rated according to its severity. | Parent | |
| Overt Aggression Scale ‒ Modified (OAS‐M) (Kay 1988) | Assesses the severity and frequency of overt aggression. | 20 items, 4 subscales.
5‐point interval scale that represents increasing level of aggression. The total aggression score is obtained by multiplying the 4 individual scales by weights of 1, 2, 3 or 4 and then summing the 4 weighted scores. | Nurse or teacher | |
| Rating of aggression against people and/or property scale (RAAP) (Kemph 1993) | ‐ | Global rating scale, 1 item. Scored from 1 (no aggression reported) to 5 (intolerable behaviour). | Clinician | |
| Children's Aggression Scale ‒ Parent (CAS‐P; Halperin 2002) and Teacher (CAS‐T; Halperin 2003) | Retrospectively measures the frequency and severity of 4 categories of aggression: verbal aggression; aggression against objects and animals; provoked physical aggression; and initiated physical aggression | Respondents (parents/guardians and teachers) complete a Likert scale to evaluate the frequency of an act. The frequency of aggressive events is multiplied by its designated severity weight factor and then summed to yield a total score. | Parent and teacher | |
| Antisocial Behavior Scale (ABS) Proactive and Reactive Subscales (Brown 1996) | Instrument used to differentiate reactive/affective from proactive subtypes of aggression | 28 items. Proactive Aggression subscale: 5 proactive items and 5 covert antisocial items. Reactive Aggression subscale: 6 items. | Parent |
| Name of rating scale | Description | Construction | Study | Source of information used in the study |
| Conners' Parent Rating Scale (CPRS) (Conners 1989) | Checklist for assessing behavioural and emotional difficulties. | 48 items, 6 subscales.
| Parent | |
| Nisonger Child Behaviour Rating Form (NCBRF) (Aman 1996; Tassé 1996) | Assesses behaviour of children and adolescents with intellectual disability or autism spectrum disorders, or both. | 76 items, 8 subscales.
| Parent | |
| Nisonger Child Behavior Rating Form ‒ Typical IQ D‐Total (includes conduct problems and oppositional subscales) | Typical IQ version: assesses behaviour of children and adolescents with normal IQ. | 10 items, 1 prosocial subscale.
54 items, 6 problem behaviour subscales.
| Parent | |
| IQ: intelligence quotient. | ||||
| Study ID | General | Neurological | Gastrointestinal | Respiratory | Cardiovascular/Metabolic | Serious adverse event (unspecified) | Other |
| (risperidone = 12, placebo = 13) |
|
|
| ‐ | Not reported | ‐ | ‐ |
| (risperidone = 19, placebo = 19) |
|
|
|
| Not reported | ‐ | ‐ |
| (quetiapine = 9, placebo = 10) |
|
| ‐ | ‐ | No differences across groups found on ECG QRS or QTc intervals. | ‐ | ‐ |
| (risperidone = 10, placebo = 10) |
| ‐ |
| ‐ | No clinically significant changes in ECG. | ‐ |
|
| (risperidone = 6, placebo = 7) | No side effects reported in any category. | ‐ | ‐ | ‐ | ‐ | ‐ | ‐ |
| (risperidone = 55, placebo = 63) |
|
|
|
|
| ‐ | ‐ |
| (risperidone = 172, placebo = 163) |
|
|
|
|
|
| ‐ |
| (risperidone = 53, placebo = 57) |
|
|
|
|
|
|
|
| (risperidone = 73, placebo = 80) |
|
|
|
|
| ‐ |
|
| (ziprasidone = 25, placebo = 25) |
|
|
|
|
|
|
|
| Bpm: beats per minute; ECG: electrocardiogram; URTI: upper respiratory tract infection; EPSE: Extrapyramidal side effects; QRS: the name for the 3 waves (Q wave, R wave and S wave) on an electrocardiogram; QTc: correct QT (start of Q wave to end of T wave) interval | |||||||
| Outcome or subgroup title | No. of studies | No. of participants | Statistical method | Effect size |
| 1 Aggression: ABC irritability (mean change scores) Show forest plot | 3 | 238 | Mean Difference (IV, Random, 95% CI) | ‐6.49 [‐8.79, ‐4.19] |
| 2 Aggression: OAS‐M, ABS Reactive subscale (final scores) Show forest plot | 2 | 190 | Mean Difference (IV, Random, 95% CI) | ‐1.30 [‐2.21, ‐0.40] |
| 3 Aggression: OAS‐M, ABS Proactive subscale (final scores) Show forest plot | 2 | 190 | Mean Difference (IV, Random, 95% CI) | ‐1.12 [‐2.30, 0.06] |
| 4 Conduct: NCBR‐CP (mean change scores) Show forest plot | 2 | 225 | Mean Difference (IV, Random, 95% CI) | ‐8.61 [‐11.49, ‐5.74] |
| 5 Weight gain (antipsychotic only): Kg (mean change scores) Show forest plot | 2 | 138 | Mean Difference (IV, Random, 95% CI) | 2.37 [0.26, 4.49] |
| 6 Weight gain (antipsychotic and stimulant): Kg (mean change scores) Show forest plot | 3 | 305 | Mean Difference (IV, Random, 95% CI) | 2.14 [1.04, 3.23] |