Diferentes intensidades para el control de la glucemia en embarazadas con diabetes preexistente
Referencias
References to studies included in this review
References to studies excluded from this review
Additional references
References to other published versions of this review
Characteristics of studies
Characteristics of included studies [ordered by study ID]
Ir a:
| Methods | RCT. | |
| Participants | 137 pregnant women and their infants. Recruited: July 1978 to June 1989. Setting: Perinatal Treatment Center, University of Cincinnati, Ohio, USA. Inclusion criteria: women with type 1 diabetes enrolled in the trial before 9 weeks' gestation. Exclusion criteria: infants whose birth dates were discrepant by 2 weeks or more from the estimated GA. Severity of diabetes: Very tight glycaemic control target: 31 White classification B‐C; 37 White classification D‐RT. Tight‐moderate glycaemic control target: 38 White classification B‐C; 31 White classification D‐RT. Duration of diabetes (years): Very tight glycaemic control target: 11.9 (6.1). Tight glycaemic control target: 11.3 (7.1). | |
| Interventions | Very tight glycaemic control target (n = 68): Target of FBG < 80 mg/dL (< 4.44 mmol/L); 1.5 hour postprandial BG < 120 mg/dL (< 6.66 mmol/L). Admitted to hospital immediately on trial entry to achieve strict control; seen weekly throughout pregnancy. Tight glycaemic control target (standard management) (n = 69): Target of FBG < 100 mg/dL (< 5.55 mmol/L); postprandial BG < 140 mg/dL (< 7.77 mmol/L). Only admitted to hospital if, after 1 week of outpatient management, the criteria for control of BG were not met; seen biweekly in the first trimester, and weekly thereafter. ALL WOMEN: all women received a twice‐daily insulin dose including both a short‐acting and an intermediate‐acting insulin, with dietary regulation; BG was monitored with a reflectance meter (Ames dextrometer). All women were admitted to hospital for the 28th week of gestation and again at 1 to 4 weeks before anticipated birth to evaluate and optimise serum glucose control. | |
| Outcomes | HbA1c (first, second, third trimester). Mean preprandial glucose (first, second, third trimester). Mean postprandial glucose (first, second, third trimester). Pregnancy‐induced hypertension. Maternal length of hospital stay. Infant serum calcium concentrations ‐ hypocalcaemia defined as serum total of < 8.0 mg/dL (2.00 mmol/L) in term infants (at least 37 weeks GA); and < 7.0 mg/dL (1.75 mmol/L) in preterm infants. Infant serum magnesium concentrations ‐ hypomagnesaemia defined as serum magnesium concentration < 1.6 mg/dL (0.66 mmol/L). Perinatal asphyxia (defined as presence of late decelerations in fetal heart rate or prolonged fetal bradycardia (fetal distress) and/or 1 minute Apgar scores < 7). Birthweight. GA. Apgar score. Fetal distress. | |
| Notes | Mimouni 1987 appears to be an interim report of the trial. | |
| Risk of bias | ||
| Bias | Authors' judgement | Support for judgement |
| Random sequence generation (selection bias) | Unclear risk | "randomly assigned" ‐ no further information. |
| Allocation concealment (selection bias) | Unclear risk | "randomly assigned" ‐ no further information. |
| Blinding of participants and personnel (performance bias) | High risk | Not feasible to blind the intervention. |
| Blinding of outcome assessment (detection bias) | Unclear risk | Blinding of outcome assessment was not reported. |
| Incomplete outcome data (attrition bias) | Low risk | No losses to follow‐up reported. |
| Selective reporting (reporting bias) | High risk | None of the primary review outcomes of perinatal mortality or serious perinatal morbidity, pre‐eclampsia, hyperglycaemia requiring treatment and caesarean birth were reported; many secondary review outcomes also not reported (e.g. large‐for‐GA). |
| Other bias | Low risk | No apparent evidence of other bias. |
| Methods | RCT. | |
| Participants | 60 pregnant women with type 1 diabetes; aged between 24 and 40 years; parity between 3 to 8. Setting: King Fahad Hospital, Alkhobar, Saudi Arabia. Inclusion criteria: White classification B and C for type 1 diabetes. Exclusion criteria: Women with any other medical complications; women who presented after the first trimester. | |
| Interventions | Tight glycaemic control target (n = 16): Target of 5.6 mmol/L or below*. Moderate glycaemic control target (n = 29): Target between 5.6 and 6.7 mmol/L*. Loose glycaemic control (n = 15): Target between 6.7 and 8.9 mmol/L*. *paper does not specify if this was FBG, but we have assumed that it is ALL WOMEN: were admitted to hospital during the first trimester to regulate their diet and insulin requirements (average stay of 8 days); had insulin doses of 1 unit for each 0.6 mmol/L above the set target and adjusted as required; were reviewed every 2 weeks in the clinic for routine antenatal care, glycosuria and bacteriuria; were readmitted to hospital at 20 and 28 weeks' GA to readjust insulin dose, ultrasound follow‐up of biparietal diameter; were asked to count up to 10 fetal movements every day from 28 weeks' GA; were readmitted to hospital at 36 weeks' GA for insulin dose readjustment, ultrasonography, fetal movement count, biweekly oestriol estimation and electronic fetal monitoring. At 38 weeks' GA, women with no contraindication for vaginal birth had their cervix evaluated and PGE2 sublingual tablets were administered to women who had an unfavourable cervix. | |
| Outcomes | Fasting, 2‐hour postprandial and midnight BG concentrations. Length of hospital stay. Ultrasound follow‐up of fetal biparietal diameter, head and abdominal circumferences; and femoral length at 30 and 28 weeks' GA. Weekly serum oestriol estimation and electronic fetal monitoring (biochemical and physical tests) from 28 weeks' GA. Perinatal mortality. Pre‐eclampsia. Caesarean section. Maternal hypoglycaemia in first half of pregnancy. Transient maternal hypotension. Respiratory distress syndrome. Birthweight > 90th centile. | |
| Notes | ||
| Risk of bias | ||
| Bias | Authors' judgement | Support for judgement |
| Random sequence generation (selection bias) | Unclear risk | "allocated at random" ‐ no further details. |
| Allocation concealment (selection bias) | Unclear risk | "allocated at random" ‐ no further details. |
| Blinding of participants and personnel (performance bias) | High risk | Not feasible to blind the intervention. |
| Blinding of outcome assessment (detection bias) | Unclear risk | Blinding of outcome assessment was not reported. |
| Incomplete outcome data (attrition bias) | Low risk | No losses to follow‐up reported. |
| Selective reporting (reporting bias) | High risk | Primary review outcomes of congenital anomalies and maternal hyperglycaemia requiring treatment not reported; many secondary review outcomes not reported. |
| Other bias | Unclear risk | Numbers randomised per group are imbalanced (16:29:15). This may have been due to 1:2:1 randomisation but this was not mentioned in the paper. |
| Methods | RCT. | |
| Participants | 26 pregnant women with type 1 diabetes who presented for antenatal care before 13 weeks' GA. Recruited from 1 April 2000 to 31 March 2003. Type 1 diabetes was identified on clinical grounds, including requirement for insulin and/or a history of abrupt onset of diabetes, diabetic ketoacidosis or both. Setting: Department of Obstetrics and Gynaecology, Kaiser Permanente Hospital, Bellflower, CA, USA. | |
| Interventions | Very tight glycaemic control target (n = 13 women and babies): Fasting and pre‐meal glucose targets of 60 to 90 mg/dL (3.33 to 5.0 mmol/L); and 1 hour post‐meal targets of 120 to 140 mg/dL (6.66 to 7.77 mmol/L). Tight glycaemic control target (n = 9 women and babies): Fasting and pre‐meal glucose targets of 95 to 115 mg/dL (5.27 to 6.38 mmol/L); and 1‐hour post‐meal targets of 155 to 175 mg/dL (8.6 to 9.71 mmol/L). ALL WOMEN: were instructed in diet, insulin administration and glucose self‐monitoring; diet caloric content was based on ideal prepregnancy weight (40% carbohydrates, 20% fat and 40% protein). For women using multiple injections, combinations of intermediate acting (NPH) and either regular insulin or insulin lispro were used to control maternal glycaemia. Women using continuous insulin infusion (insulin pumps) were trained to adjust their basal and bolus doses of insulin lispro to achieve the target values for their respective group. Women were given written and verbal instructions in the daily adjustment of their insulin doses to achieve target glucose values for their assigned group. | |
| Outcomes | Perinatal mortality. Serious perinatal morbidity. Capillary plasma glucose (self‐monitored 7 times a day with a memory‐based portable glucose meter). Hypoglycaemic symptoms (self‐reported nervousness, tremulousness and peri‐oral numbness). HbA1c measured each trimester. BMI. Maternal weight gain. Chronic hypertension. GA (weeks). Caesarean. Birth defects. Birthweight. | |
| Notes | ||
| Risk of bias | ||
| Bias | Authors' judgement | Support for judgement |
| Random sequence generation (selection bias) | Low risk | "computer‐generated block randomization." |
| Allocation concealment (selection bias) | Unclear risk | "computer‐generated block randomization." |
| Blinding of participants and personnel (performance bias) | High risk | "Open label"; Not feasible to blind the intervention. |
| Blinding of outcome assessment (detection bias) | Unclear risk | Blinding of outcome assessment was not reported. |
| Incomplete outcome data (attrition bias) | Unclear risk | 4/26 (15.4%) ‐ all 4 were from the very tight glycaemic control target group (2 women had first trimester abortions, 1 was excluded because she had participated in an earlier pregnancy and 1 left the study because of not attending appointments). |
| Selective reporting (reporting bias) | High risk | Primary review outcomes of pre‐eclampsia and maternal hyperglycaemia requiring treatment and serious perinatal morbidity not reported; many secondary review outcomes not reported. |
| Other bias | Low risk | No apparent evidence of other bias. |
BG: blood glucose
BMI: body mass index
FBG: fasting blood glucose
GA: gestational age
HbA1c: glycated haemoglobin
mg/dL: milligrams/decilitre
mmol/L: millimol/litre
NPH: neutral protamine hagedorn
PGE2: prostaglandin E2
RCT: randomised controlled trial
Characteristics of excluded studies [ordered by study ID]
Ir a:
| Study | Reason for exclusion |
| All pregnant women received intensive therapy ("the protocol required that women in the conventional treatment group change to intensive therapy while attempting to become pregnant and during pregnancy"). |
Data and analyses
| Outcome or subgroup title | No. of studies | No. of participants | Statistical method | Effect size |
| 1 Caesarean section Show forest plot | 1 | 22 | Risk Ratio (M‐H, Fixed, 95% CI) | 0.92 [0.49, 1.73] |
| Analysis 1.1  Comparison 1 Very tight versus tight‐moderate glycaemic control, Outcome 1 Caesarean section. | ||||
| 1.1 FBG target 3.33 to 5.0 vs 5.27 to 6.38 mmol/L | 1 | 22 | Risk Ratio (M‐H, Fixed, 95% CI) | 0.92 [0.49, 1.73] |
| 2 Perinatal mortality Show forest plot | 1 | 22 | Risk Ratio (M‐H, Fixed, 95% CI) | 0.0 [0.0, 0.0] |
| Analysis 1.2  Comparison 1 Very tight versus tight‐moderate glycaemic control, Outcome 2 Perinatal mortality. | ||||
| 2.1 FBG target 3.33 to 5.0 vs 5.27 to 6.38 mmol/L | 1 | 22 | Risk Ratio (M‐H, Fixed, 95% CI) | 0.0 [0.0, 0.0] |
| 3 Serious perinatal morbidity Show forest plot | 1 | 22 | Risk Ratio (M‐H, Fixed, 95% CI) | 0.0 [0.0, 0.0] |
| Analysis 1.3 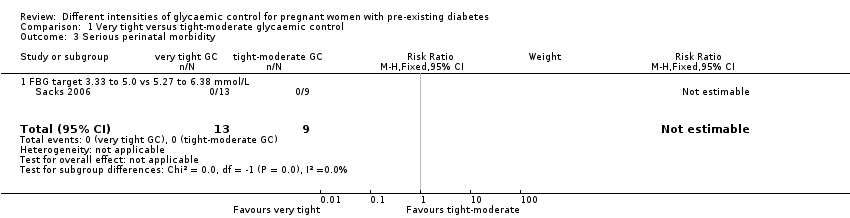 Comparison 1 Very tight versus tight‐moderate glycaemic control, Outcome 3 Serious perinatal morbidity. | ||||
| 3.1 FBG target 3.33 to 5.0 vs 5.27 to 6.38 mmol/L | 1 | 22 | Risk Ratio (M‐H, Fixed, 95% CI) | 0.0 [0.0, 0.0] |
| 4 Congenital fetal anomaly Show forest plot | 1 | 22 | Risk Ratio (M‐H, Fixed, 95% CI) | 3.57 [0.19, 66.61] |
| Analysis 1.4  Comparison 1 Very tight versus tight‐moderate glycaemic control, Outcome 4 Congenital fetal anomaly. | ||||
| 4.1 FBG target 3.33 to 5.0 vs 5.27 to 6.38 mmol/L | 1 | 22 | Risk Ratio (M‐H, Fixed, 95% CI) | 3.57 [0.19, 66.61] |
| 5 Pregnancy‐induced hypertension Show forest plot | 1 | 137 | Risk Ratio (M‐H, Fixed, 95% CI) | 1.40 [0.60, 3.25] |
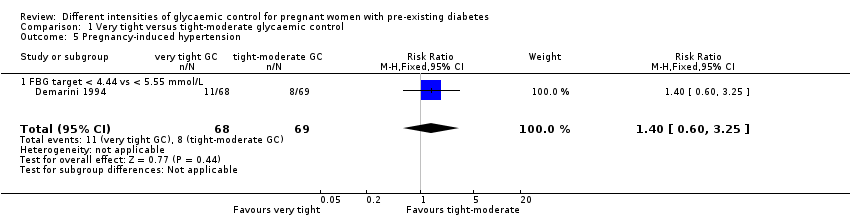
| Analysis 1.5  Comparison 1 Very tight versus tight‐moderate glycaemic control, Outcome 5 Pregnancy‐induced hypertension. | ||||
| 5.1 FBG target < 4.44 vs < 5.55 mmol/L | 1 | 137 | Risk Ratio (M‐H, Fixed, 95% CI) | 1.40 [0.60, 3.25] |
| 6 Chronic hypertension: not prespecified Show forest plot | 1 | 22 | Risk Ratio (M‐H, Fixed, 95% CI) | 0.0 [0.0, 0.0] |
| Analysis 1.6 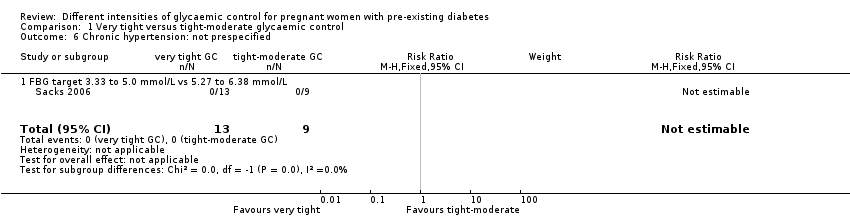 Comparison 1 Very tight versus tight‐moderate glycaemic control, Outcome 6 Chronic hypertension: not prespecified. | ||||
| 6.1 FBG target 3.33 to 5.0 mmol/L vs 5.27 to 6.38 mmol/L | 1 | 22 | Risk Ratio (M‐H, Fixed, 95% CI) | 0.0 [0.0, 0.0] |
| 7 Glycaemic control ‐ Self‐monitored blood glucose (mean, mmol/L) Show forest plot | 1 | Mean Difference (IV, Fixed, 95% CI) | Subtotals only | |
| Analysis 1.7 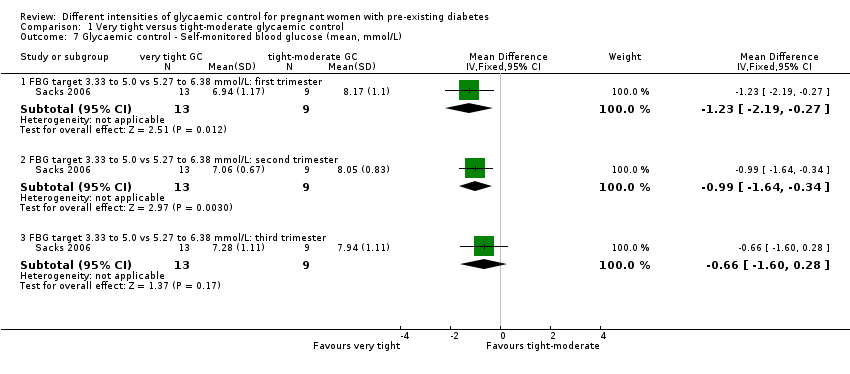 Comparison 1 Very tight versus tight‐moderate glycaemic control, Outcome 7 Glycaemic control ‐ Self‐monitored blood glucose (mean, mmol/L). | ||||
| 7.1 FBG target 3.33 to 5.0 vs 5.27 to 6.38 mmol/L: first trimester | 1 | 22 | Mean Difference (IV, Fixed, 95% CI) | ‐1.23 [‐2.19, ‐0.27] |
| 7.2 FBG target 3.33 to 5.0 vs 5.27 to 6.38 mmol/L: second trimester | 1 | 22 | Mean Difference (IV, Fixed, 95% CI) | ‐0.99 [‐1.64, ‐0.34] |
| 7.3 FBG target 3.33 to 5.0 vs 5.27 to 6.38 mmol/L: third trimester | 1 | 22 | Mean Difference (IV, Fixed, 95% CI) | ‐0.66 [‐1.60, 0.28] |
| 8 Glycaemic control ‐ Self‐monitored blood glucose tests/day Show forest plot | 1 | 22 | Mean Difference (IV, Fixed, 95% CI) | 1.60 [‐0.15, 3.35] |
| Analysis 1.8 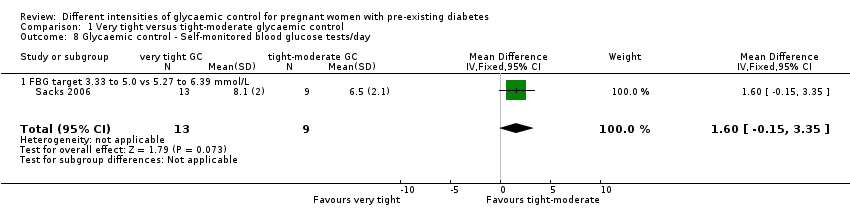 Comparison 1 Very tight versus tight‐moderate glycaemic control, Outcome 8 Glycaemic control ‐ Self‐monitored blood glucose tests/day. | ||||
| 8.1 FBG target 3.33 to 5.0 vs 5.27 to 6.39 mmol/L | 1 | 22 | Mean Difference (IV, Fixed, 95% CI) | 1.60 [‐0.15, 3.35] |
| 9 Glycaemic control ‐ HbA1c (%): first trimester Show forest plot | 2 | Mean Difference (IV, Fixed, 95% CI) | Subtotals only | |
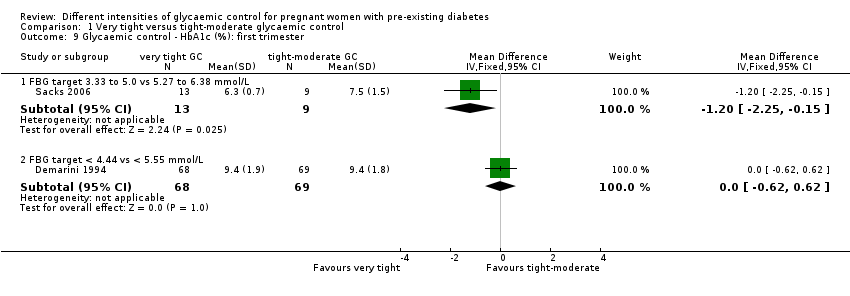
| Analysis 1.9  Comparison 1 Very tight versus tight‐moderate glycaemic control, Outcome 9 Glycaemic control ‐ HbA1c (%): first trimester. | ||||
| 9.1 FBG target 3.33 to 5.0 vs 5.27 to 6.38 mmol/L | 1 | 22 | Mean Difference (IV, Fixed, 95% CI) | ‐1.20 [‐2.25, ‐0.15] |
| 9.2 FBG target < 4.44 vs < 5.55 mmol/L | 1 | 137 | Mean Difference (IV, Fixed, 95% CI) | 0.0 [‐0.62, 0.62] |
| 10 Glycaemic control ‐ HbA1c (%): second trimester Show forest plot | 2 | Mean Difference (IV, Fixed, 95% CI) | Subtotals only | |
| Analysis 1.10  Comparison 1 Very tight versus tight‐moderate glycaemic control, Outcome 10 Glycaemic control ‐ HbA1c (%): second trimester. | ||||
| 10.1 FBG target 3.33 to 5.0 vs 5.27 to 6.38 mmol/L | 1 | 22 | Mean Difference (IV, Fixed, 95% CI) | ‐0.5 [‐1.09, 0.09] |
| 10.2 FBG target < 4.44 vs < 5.55 mmol/L | 1 | 137 | Mean Difference (IV, Fixed, 95% CI) | 0.10 [‐0.37, 0.57] |
| 11 Glycaemic control ‐ HbA1c (%): third trimester Show forest plot | 2 | Mean Difference (IV, Fixed, 95% CI) | Subtotals only | |
| Analysis 1.11 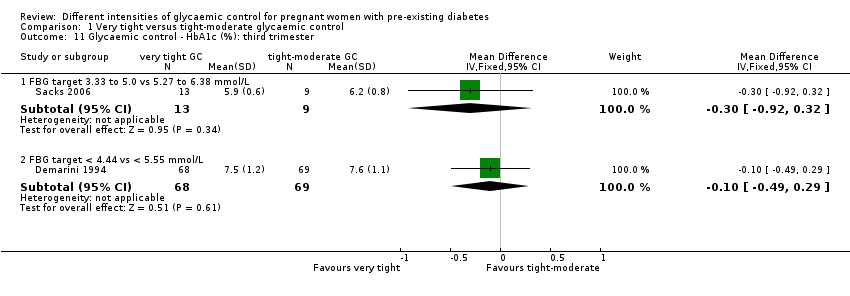 Comparison 1 Very tight versus tight‐moderate glycaemic control, Outcome 11 Glycaemic control ‐ HbA1c (%): third trimester. | ||||
| 11.1 FBG target 3.33 to 5.0 vs 5.27 to 6.38 mmol/L | 1 | 22 | Mean Difference (IV, Fixed, 95% CI) | ‐0.30 [‐0.92, 0.32] |
| 11.2 FBG target < 4.44 vs < 5.55 mmol/L | 1 | 137 | Mean Difference (IV, Fixed, 95% CI) | ‐0.10 [‐0.49, 0.29] |
| 12 Glycaemic control ‐ Mean preprandial glucose (mmol/L) Show forest plot | 1 | Mean Difference (IV, Fixed, 95% CI) | Subtotals only | |
| Analysis 1.12 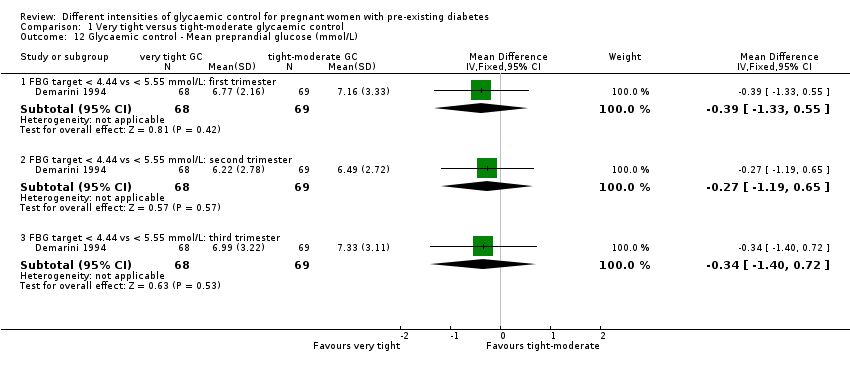 Comparison 1 Very tight versus tight‐moderate glycaemic control, Outcome 12 Glycaemic control ‐ Mean preprandial glucose (mmol/L). | ||||
| 12.1 FBG target < 4.44 vs < 5.55 mmol/L: first trimester | 1 | 137 | Mean Difference (IV, Fixed, 95% CI) | ‐0.39 [‐1.33, 0.55] |
| 12.2 FBG target < 4.44 vs < 5.55 mmol/L: second trimester | 1 | 137 | Mean Difference (IV, Fixed, 95% CI) | ‐0.27 [‐1.19, 0.65] |
| 12.3 FBG target < 4.44 vs < 5.55 mmol/L: third trimester | 1 | 137 | Mean Difference (IV, Fixed, 95% CI) | ‐0.34 [‐1.40, 0.72] |
| 13 Glycaemic control ‐ Mean postprandial glucose (mmol/L) Show forest plot | 1 | Mean Difference (IV, Fixed, 95% CI) | Subtotals only | |
| Analysis 1.13  Comparison 1 Very tight versus tight‐moderate glycaemic control, Outcome 13 Glycaemic control ‐ Mean postprandial glucose (mmol/L). | ||||
| 13.1 FBG target < 4.44 vs < 5.55 mmol/L: first trimester | 1 | 137 | Mean Difference (IV, Fixed, 95% CI) | ‐0.94 [‐2.05, 0.17] |
| 13.2 FBG target < 4.44 vs < 5.55 mmol/L: second trimester | 1 | 137 | Mean Difference (IV, Fixed, 95% CI) | ‐0.56 [‐1.38, 0.26] |
| 13.3 FBG target < 4.44 vs < 5.55 mmol/L: third trimester | 1 | 137 | Mean Difference (IV, Fixed, 95% CI) | ‐0.11 [‐1.26, 1.04] |
| 14 Glycaemic control ‐ Below FBG threshold (% days) Show forest plot | 1 | Mean Difference (IV, Fixed, 95% CI) | Subtotals only | |
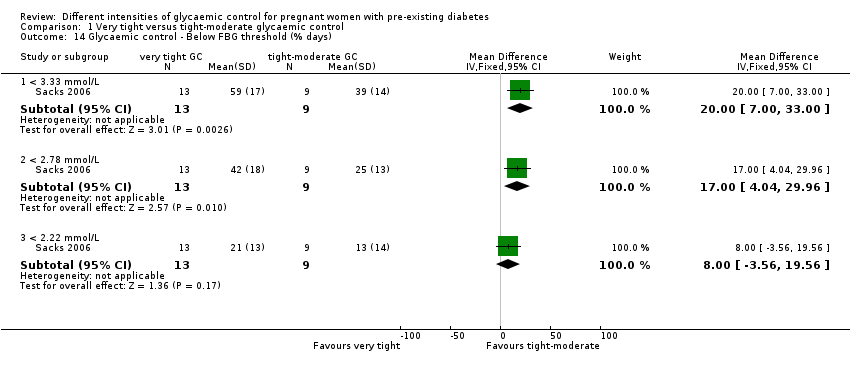
| Analysis 1.14  Comparison 1 Very tight versus tight‐moderate glycaemic control, Outcome 14 Glycaemic control ‐ Below FBG threshold (% days). | ||||
| 14.1 < 3.33 mmol/L | 1 | 22 | Mean Difference (IV, Fixed, 95% CI) | 20.0 [7.00, 33.00] |
| 14.2 < 2.78 mmol/L | 1 | 22 | Mean Difference (IV, Fixed, 95% CI) | 17.0 [4.04, 29.96] |
| 14.3 < 2.22 mmol/L | 1 | 22 | Mean Difference (IV, Fixed, 95% CI) | 8.0 [‐3.56, 19.56] |
| 15 Hypoglycaemic episodes ‐ > 1 subjective (% of days): not prespecified Show forest plot | 1 | 22 | Mean Difference (IV, Fixed, 95% CI) | 22.0 [11.07, 32.93] |
| Analysis 1.15 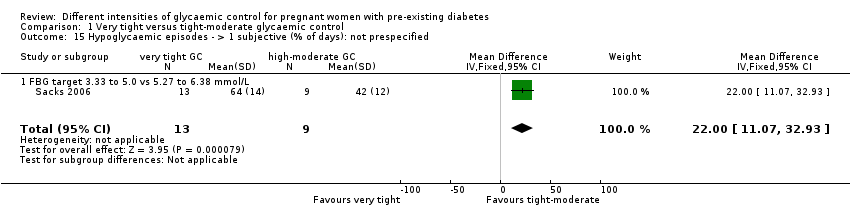 Comparison 1 Very tight versus tight‐moderate glycaemic control, Outcome 15 Hypoglycaemic episodes ‐ > 1 subjective (% of days): not prespecified. | ||||
| 15.1 FBG target 3.33 to 5.0 vs 5.27 to 6.38 mmol/L | 1 | 22 | Mean Difference (IV, Fixed, 95% CI) | 22.0 [11.07, 32.93] |
| 16 Gestational weight gain (kg/week) Show forest plot | 1 | 22 | Mean Difference (IV, Fixed, 95% CI) | 0.02 [‐0.23, 0.27] |
| Analysis 1.16 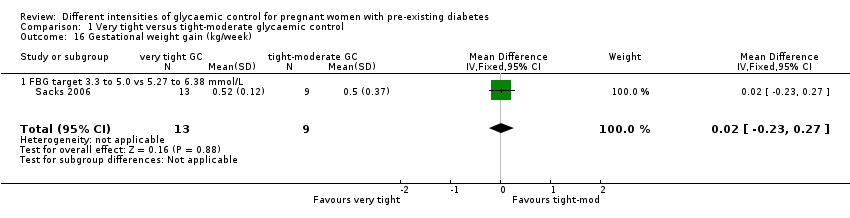 Comparison 1 Very tight versus tight‐moderate glycaemic control, Outcome 16 Gestational weight gain (kg/week). | ||||
| 16.1 FBG target 3.3 to 5.0 vs 5.27 to 6.38 mmol/L | 1 | 22 | Mean Difference (IV, Fixed, 95% CI) | 0.02 [‐0.23, 0.27] |
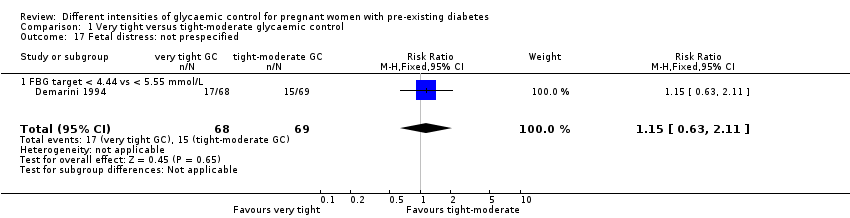
| 17 Fetal distress: not prespecified Show forest plot | 1 | 137 | Risk Ratio (M‐H, Fixed, 95% CI) | 1.15 [0.63, 2.11] |
| Analysis 1.17  Comparison 1 Very tight versus tight‐moderate glycaemic control, Outcome 17 Fetal distress: not prespecified. | ||||
| 17.1 FBG target < 4.44 vs < 5.55 mmol/L | 1 | 137 | Risk Ratio (M‐H, Fixed, 95% CI) | 1.15 [0.63, 2.11] |
| 18 Gestational age at birth (weeks) Show forest plot | 2 | 159 | Mean Difference (IV, Fixed, 95% CI) | 0.43 [‐0.23, 1.08] |
| Analysis 1.18  Comparison 1 Very tight versus tight‐moderate glycaemic control, Outcome 18 Gestational age at birth (weeks). | ||||
| 18.1 FBG target 3.33 to 5.0 vs 5.27 to 6.38 mmol/L | 1 | 22 | Mean Difference (IV, Fixed, 95% CI) | ‐0.30 [‐2.44, 1.84] |
| 18.2 FBG target < 4.44 vs < 5.55 mmol/L | 1 | 137 | Mean Difference (IV, Fixed, 95% CI) | 0.5 [‐0.19, 1.19] |
| 19 Birthweight (g) Show forest plot | 2 | 159 | Mean Difference (IV, Fixed, 95% CI) | ‐2.62 [‐179.83, 174.59] |
| Analysis 1.19 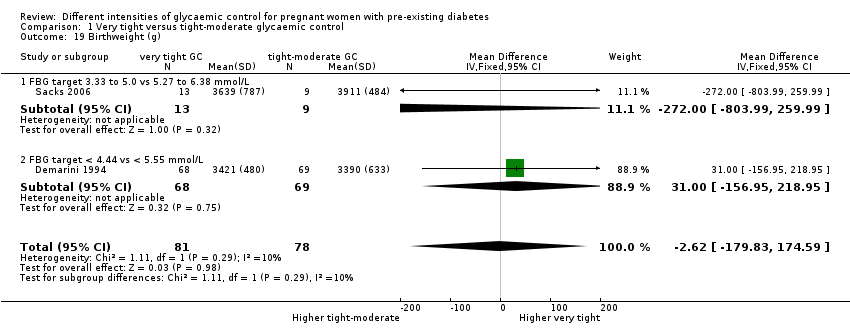 Comparison 1 Very tight versus tight‐moderate glycaemic control, Outcome 19 Birthweight (g). | ||||
| 19.1 FBG target 3.33 to 5.0 vs 5.27 to 6.38 mmol/L | 1 | 22 | Mean Difference (IV, Fixed, 95% CI) | ‐272.0 [‐803.99, 259.99] |
| 19.2 FBG target < 4.44 vs < 5.55 mmol/L | 1 | 137 | Mean Difference (IV, Fixed, 95% CI) | 31.0 [‐156.95, 218.95] |
| 20 Apgar score Show forest plot | 1 | Risk Ratio (M‐H, Fixed, 95% CI) | Subtotals only | |
| Analysis 1.20 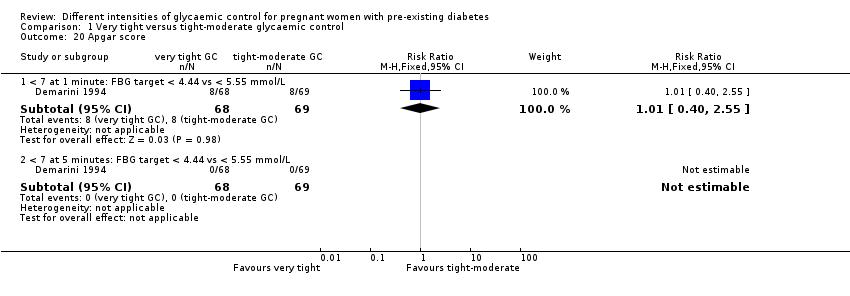 Comparison 1 Very tight versus tight‐moderate glycaemic control, Outcome 20 Apgar score. | ||||
| 20.1 < 7 at 1 minute: FBG target < 4.44 vs < 5.55 mmol/L | 1 | 137 | Risk Ratio (M‐H, Fixed, 95% CI) | 1.01 [0.40, 2.55] |
| 20.2 < 7 at 5 minutes: FBG target < 4.44 vs < 5.55 mmol/L | 1 | 137 | Risk Ratio (M‐H, Fixed, 95% CI) | 0.0 [0.0, 0.0] |
| 21 Asphyxia: not prespecified Show forest plot | 1 | 137 | Risk Ratio (M‐H, Fixed, 95% CI) | 1.01 [0.58, 1.78] |
| Analysis 1.21  Comparison 1 Very tight versus tight‐moderate glycaemic control, Outcome 21 Asphyxia: not prespecified. | ||||
| 21.1 FBG target < 4.44 vs < 5.55 mmol/L | 1 | 137 | Risk Ratio (M‐H, Fixed, 95% CI) | 1.01 [0.58, 1.78] |
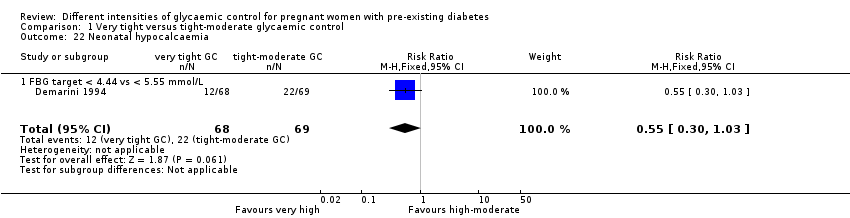
| 22 Neonatal hypocalcaemia Show forest plot | 1 | 137 | Risk Ratio (M‐H, Fixed, 95% CI) | 0.55 [0.30, 1.03] |
| Analysis 1.22  Comparison 1 Very tight versus tight‐moderate glycaemic control, Outcome 22 Neonatal hypocalcaemia. | ||||
| 22.1 FBG target < 4.44 vs < 5.55 mmol/L | 1 | 137 | Risk Ratio (M‐H, Fixed, 95% CI) | 0.55 [0.30, 1.03] |
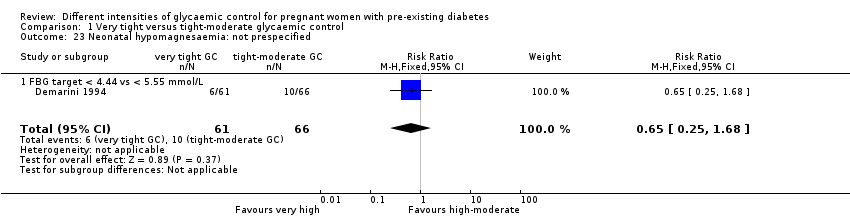
| 23 Neonatal hypomagnesaemia: not prespecified Show forest plot | 1 | 127 | Risk Ratio (M‐H, Fixed, 95% CI) | 0.65 [0.25, 1.68] |
| Analysis 1.23  Comparison 1 Very tight versus tight‐moderate glycaemic control, Outcome 23 Neonatal hypomagnesaemia: not prespecified. | ||||
| 23.1 FBG target < 4.44 vs < 5.55 mmol/L | 1 | 127 | Risk Ratio (M‐H, Fixed, 95% CI) | 0.65 [0.25, 1.68] |
| 24 Maternal hospitalisation (days) Show forest plot | 1 | 137 | Mean Difference (IV, Fixed, 95% CI) | 10.60 [9.53, 11.67] |
| Analysis 1.24 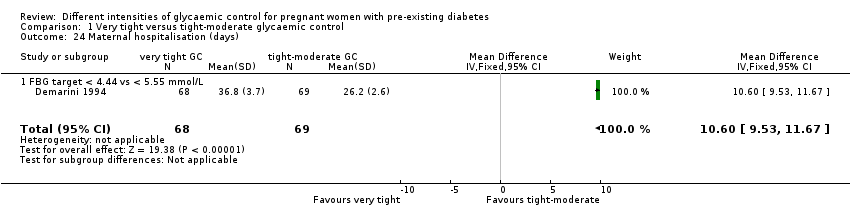 Comparison 1 Very tight versus tight‐moderate glycaemic control, Outcome 24 Maternal hospitalisation (days). | ||||
| 24.1 FBG target < 4.44 vs < 5.55 mmol/L | 1 | 137 | Mean Difference (IV, Fixed, 95% CI) | 10.60 [9.53, 11.67] |
| Outcome or subgroup title | No. of studies | No. of participants | Statistical method | Effect size |
| 1 Pre‐eclampsia Show forest plot | 1 | 45 | Risk Ratio (M‐H, Fixed, 95% CI) | 5.29 [0.23, 122.91] |
| Analysis 2.1 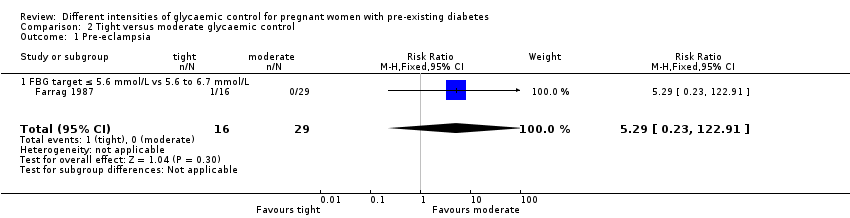 Comparison 2 Tight versus moderate glycaemic control, Outcome 1 Pre‐eclampsia. | ||||
| 1.1 FBG target ≤ 5.6 mmol/L vs 5.6 to 6.7 mmol/L | 1 | 45 | Risk Ratio (M‐H, Fixed, 95% CI) | 5.29 [0.23, 122.91] |
| 2 Caesarean section Show forest plot | 1 | 45 | Risk Ratio (M‐H, Fixed, 95% CI) | 1.21 [0.22, 6.50] |
| Analysis 2.2 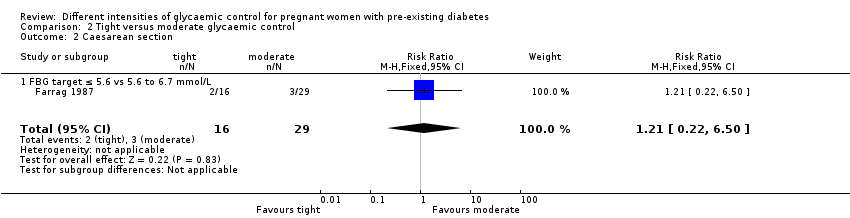 Comparison 2 Tight versus moderate glycaemic control, Outcome 2 Caesarean section. | ||||
| 2.1 FBG target ≤ 5.6 vs 5.6 to 6.7 mmol/L | 1 | 45 | Risk Ratio (M‐H, Fixed, 95% CI) | 1.21 [0.22, 6.50] |
| 3 Perinatal mortality Show forest plot | 1 | 45 | Risk Ratio (M‐H, Fixed, 95% CI) | 0.0 [0.0, 0.0] |
| Analysis 2.3 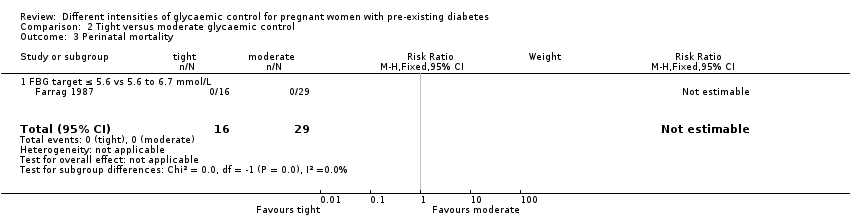 Comparison 2 Tight versus moderate glycaemic control, Outcome 3 Perinatal mortality. | ||||
| 3.1 FBG target ≤ 5.6 vs 5.6 to 6.7 mmol/L | 1 | 45 | Risk Ratio (M‐H, Fixed, 95% CI) | 0.0 [0.0, 0.0] |
| 4 Transient maternal hypertension Show forest plot | 1 | 45 | Risk Ratio (M‐H, Fixed, 95% CI) | 0.59 [0.03, 13.66] |
| Analysis 2.4 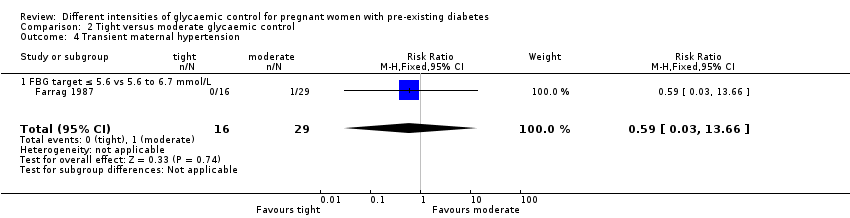 Comparison 2 Tight versus moderate glycaemic control, Outcome 4 Transient maternal hypertension. | ||||
| 4.1 FBG target ≤ 5.6 vs 5.6 to 6.7 mmol/L | 1 | 45 | Risk Ratio (M‐H, Fixed, 95% CI) | 0.59 [0.03, 13.66] |
| 5 Hypoglycaemic epispodes ‐ first half of pregnancy: not prespecified Show forest plot | 1 | 45 | Risk Ratio (M‐H, Fixed, 95% CI) | 26.47 [1.61, 435.38] |
| Analysis 2.5 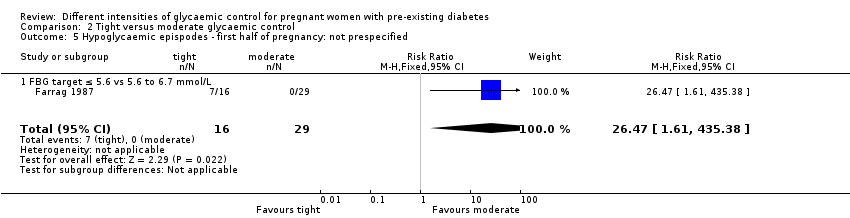 Comparison 2 Tight versus moderate glycaemic control, Outcome 5 Hypoglycaemic epispodes ‐ first half of pregnancy: not prespecified. | ||||
| 5.1 FBG target ≤ 5.6 vs 5.6 to 6.7 mmol/L | 1 | 45 | Risk Ratio (M‐H, Fixed, 95% CI) | 26.47 [1.61, 435.38] |
| 6 Large‐for‐gestational age (birthweight > 90th centile) Show forest plot | 1 | 45 | Risk Ratio (M‐H, Fixed, 95% CI) | 0.0 [0.0, 0.0] |
| Analysis 2.6  Comparison 2 Tight versus moderate glycaemic control, Outcome 6 Large‐for‐gestational age (birthweight > 90th centile). | ||||
| 6.1 FBG target ≤ 5.6 vs 5.6 to 6.7 mmol/L | 1 | 45 | Risk Ratio (M‐H, Fixed, 95% CI) | 0.0 [0.0, 0.0] |
| 7 Respiratory distress syndrome Show forest plot | 1 | 45 | Risk Ratio (M‐H, Fixed, 95% CI) | 0.91 [0.09, 9.24] |
| Analysis 2.7 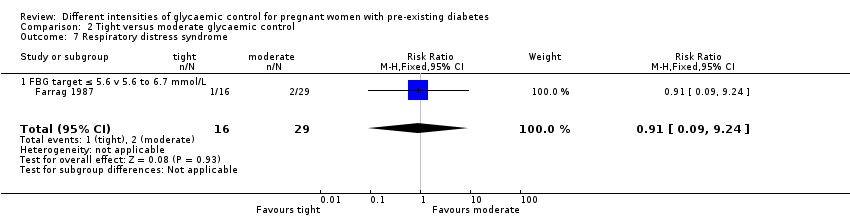 Comparison 2 Tight versus moderate glycaemic control, Outcome 7 Respiratory distress syndrome. | ||||
| 7.1 FBG target ≤ 5.6 v 5.6 to 6.7 mmol/L | 1 | 45 | Risk Ratio (M‐H, Fixed, 95% CI) | 0.91 [0.09, 9.24] |
| Outcome or subgroup title | No. of studies | No. of participants | Statistical method | Effect size |
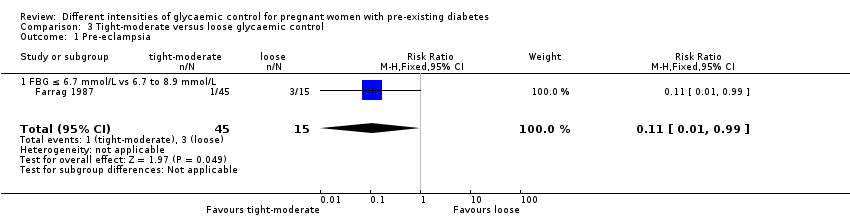
| 1 Pre‐eclampsia Show forest plot | 1 | 60 | Risk Ratio (M‐H, Fixed, 95% CI) | 0.11 [0.01, 0.99] |
| Analysis 3.1  Comparison 3 Tight‐moderate versus loose glycaemic control, Outcome 1 Pre‐eclampsia. | ||||
| 1.1 FBG ≤ 6.7 mmol/L vs 6.7 to 8.9 mmol/L | 1 | 60 | Risk Ratio (M‐H, Fixed, 95% CI) | 0.11 [0.01, 0.99] |
| 2 Caesarean section Show forest plot | 1 | 60 | Risk Ratio (M‐H, Fixed, 95% CI) | 0.28 [0.10, 0.78] |
| Analysis 3.2  Comparison 3 Tight‐moderate versus loose glycaemic control, Outcome 2 Caesarean section. | ||||
| 2.1 FBG target ≤ 6.7 vs 6.7 to 8.9 mmol/L | 1 | 60 | Risk Ratio (M‐H, Fixed, 95% CI) | 0.28 [0.10, 0.78] |
| 3 Perinatal mortality Show forest plot | 1 | 60 | Risk Ratio (M‐H, Fixed, 95% CI) | 0.07 [0.00, 1.37] |
| Analysis 3.3 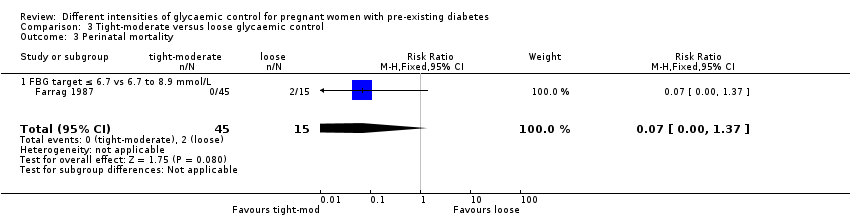 Comparison 3 Tight‐moderate versus loose glycaemic control, Outcome 3 Perinatal mortality. | ||||
| 3.1 FBG target ≤ 6.7 vs 6.7 to 8.9 mmol/L | 1 | 60 | Risk Ratio (M‐H, Fixed, 95% CI) | 0.07 [0.00, 1.37] |
| 4 Transient maternal hypertension Show forest plot | 1 | 45 | Risk Ratio (M‐H, Fixed, 95% CI) | 1.81 [0.12, 27.07] |
| Analysis 3.4  Comparison 3 Tight‐moderate versus loose glycaemic control, Outcome 4 Transient maternal hypertension. | ||||
| 4.1 FBG target ≤ 6.7 vs 6.7 to 8.9 mmol/L | 1 | 45 | Risk Ratio (M‐H, Fixed, 95% CI) | 1.81 [0.12, 27.07] |
| 5 Hypoglycaemic episodes ‐ in first half of pregnancy: not prespecified Show forest plot | 1 | 60 | Risk Ratio (M‐H, Fixed, 95% CI) | 5.22 [0.32, 86.28] |
| Analysis 3.5  Comparison 3 Tight‐moderate versus loose glycaemic control, Outcome 5 Hypoglycaemic episodes ‐ in first half of pregnancy: not prespecified. | ||||
| 5.1 FBG target ≤ 6.7 vs 6.7 to 8.9 mmol/L | 1 | 60 | Risk Ratio (M‐H, Fixed, 95% CI) | 5.22 [0.32, 86.28] |
| 6 Large‐for‐gestational age (birthweight > 90th centile) Show forest plot | 1 | 60 | Risk Ratio (M‐H, Fixed, 95% CI) | 0.01 [0.00, 0.20] |
| Analysis 3.6 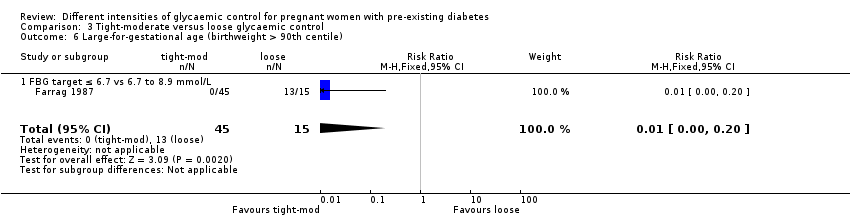 Comparison 3 Tight‐moderate versus loose glycaemic control, Outcome 6 Large‐for‐gestational age (birthweight > 90th centile). | ||||
| 6.1 FBG target ≤ 6.7 vs 6.7 to 8.9 mmol/L | 1 | 60 | Risk Ratio (M‐H, Fixed, 95% CI) | 0.01 [0.00, 0.20] |
| 7 Respiratory distress syndrome Show forest plot | 1 | 60 | Risk Ratio (M‐H, Fixed, 95% CI) | 0.17 [0.05, 0.59] |
| Analysis 3.7  Comparison 3 Tight‐moderate versus loose glycaemic control, Outcome 7 Respiratory distress syndrome. | ||||
| 7.1 FBG target ≤ 6.7 vs 6.7 to 8.9 mmol/L | 1 | 60 | Risk Ratio (M‐H, Fixed, 95% CI) | 0.17 [0.05, 0.59] |

Study flow diagram.
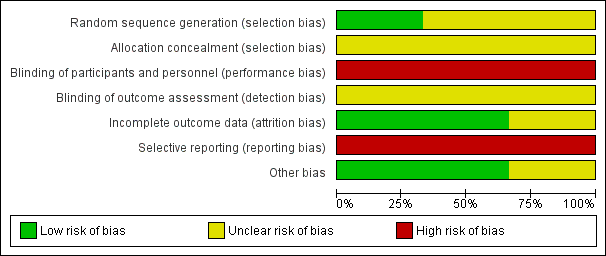
Methodological quality graph: review authors' judgements about each methodological quality item presented as percentages across all included studies.
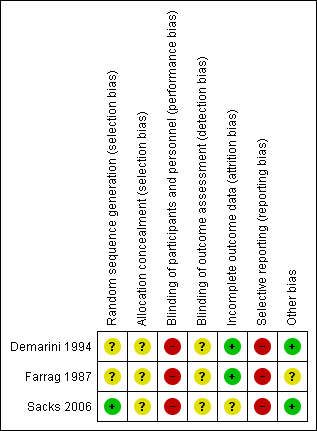
Methodological quality summary: review authors' judgements about each methodological quality item for each included study.

Comparison 1 Very tight versus tight‐moderate glycaemic control, Outcome 1 Caesarean section.

Comparison 1 Very tight versus tight‐moderate glycaemic control, Outcome 2 Perinatal mortality.

Comparison 1 Very tight versus tight‐moderate glycaemic control, Outcome 3 Serious perinatal morbidity.

Comparison 1 Very tight versus tight‐moderate glycaemic control, Outcome 4 Congenital fetal anomaly.
Comparison 1 Very tight versus tight‐moderate glycaemic control, Outcome 5 Pregnancy‐induced hypertension.

Comparison 1 Very tight versus tight‐moderate glycaemic control, Outcome 6 Chronic hypertension: not prespecified.

Comparison 1 Very tight versus tight‐moderate glycaemic control, Outcome 7 Glycaemic control ‐ Self‐monitored blood glucose (mean, mmol/L).

Comparison 1 Very tight versus tight‐moderate glycaemic control, Outcome 8 Glycaemic control ‐ Self‐monitored blood glucose tests/day.
Comparison 1 Very tight versus tight‐moderate glycaemic control, Outcome 9 Glycaemic control ‐ HbA1c (%): first trimester.

Comparison 1 Very tight versus tight‐moderate glycaemic control, Outcome 10 Glycaemic control ‐ HbA1c (%): second trimester.

Comparison 1 Very tight versus tight‐moderate glycaemic control, Outcome 11 Glycaemic control ‐ HbA1c (%): third trimester.

Comparison 1 Very tight versus tight‐moderate glycaemic control, Outcome 12 Glycaemic control ‐ Mean preprandial glucose (mmol/L).

Comparison 1 Very tight versus tight‐moderate glycaemic control, Outcome 13 Glycaemic control ‐ Mean postprandial glucose (mmol/L).
Comparison 1 Very tight versus tight‐moderate glycaemic control, Outcome 14 Glycaemic control ‐ Below FBG threshold (% days).

Comparison 1 Very tight versus tight‐moderate glycaemic control, Outcome 15 Hypoglycaemic episodes ‐ > 1 subjective (% of days): not prespecified.

Comparison 1 Very tight versus tight‐moderate glycaemic control, Outcome 16 Gestational weight gain (kg/week).
Comparison 1 Very tight versus tight‐moderate glycaemic control, Outcome 17 Fetal distress: not prespecified.

Comparison 1 Very tight versus tight‐moderate glycaemic control, Outcome 18 Gestational age at birth (weeks).

Comparison 1 Very tight versus tight‐moderate glycaemic control, Outcome 19 Birthweight (g).

Comparison 1 Very tight versus tight‐moderate glycaemic control, Outcome 20 Apgar score.

Comparison 1 Very tight versus tight‐moderate glycaemic control, Outcome 21 Asphyxia: not prespecified.
Comparison 1 Very tight versus tight‐moderate glycaemic control, Outcome 22 Neonatal hypocalcaemia.
Comparison 1 Very tight versus tight‐moderate glycaemic control, Outcome 23 Neonatal hypomagnesaemia: not prespecified.

Comparison 1 Very tight versus tight‐moderate glycaemic control, Outcome 24 Maternal hospitalisation (days).

Comparison 2 Tight versus moderate glycaemic control, Outcome 1 Pre‐eclampsia.

Comparison 2 Tight versus moderate glycaemic control, Outcome 2 Caesarean section.

Comparison 2 Tight versus moderate glycaemic control, Outcome 3 Perinatal mortality.

Comparison 2 Tight versus moderate glycaemic control, Outcome 4 Transient maternal hypertension.

Comparison 2 Tight versus moderate glycaemic control, Outcome 5 Hypoglycaemic epispodes ‐ first half of pregnancy: not prespecified.

Comparison 2 Tight versus moderate glycaemic control, Outcome 6 Large‐for‐gestational age (birthweight > 90th centile).

Comparison 2 Tight versus moderate glycaemic control, Outcome 7 Respiratory distress syndrome.
Comparison 3 Tight‐moderate versus loose glycaemic control, Outcome 1 Pre‐eclampsia.

Comparison 3 Tight‐moderate versus loose glycaemic control, Outcome 2 Caesarean section.

Comparison 3 Tight‐moderate versus loose glycaemic control, Outcome 3 Perinatal mortality.

Comparison 3 Tight‐moderate versus loose glycaemic control, Outcome 4 Transient maternal hypertension.
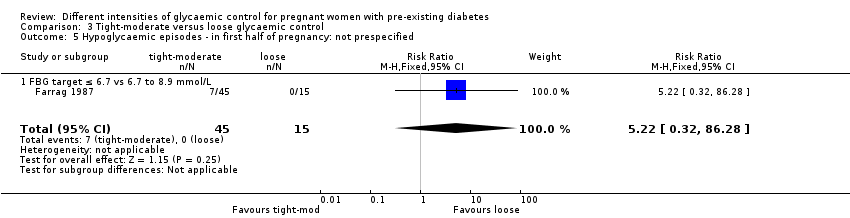
Comparison 3 Tight‐moderate versus loose glycaemic control, Outcome 5 Hypoglycaemic episodes ‐ in first half of pregnancy: not prespecified.

Comparison 3 Tight‐moderate versus loose glycaemic control, Outcome 6 Large‐for‐gestational age (birthweight > 90th centile).
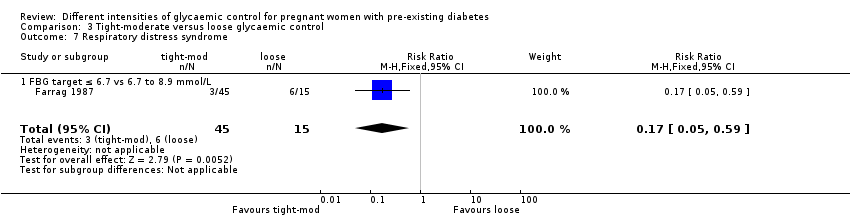
Comparison 3 Tight‐moderate versus loose glycaemic control, Outcome 7 Respiratory distress syndrome.
| Very tight versus tight‐moderate glycaemic control (FBG target 3.33 to 5.0 versus 5.27 to 6.38 mmol/L) | ||||||
| Patient or population: pregnant women with pre‐existing type 1 diabetes | ||||||
| Outcomes | Anticipated absolute effects* (95% CI) | Relative effect | No. of participants | Quality of the evidence | Comments | |
| Risk with tight‐moderate glycaemic control | Risk with very tight glycaemic control | |||||
| Pre‐eclampsia | not reported | |||||
| Caesarean section | Study population | RR 0.92 | 22 | ⊕⊝⊝⊝ | FBG target 3.3 to 5.0 versus 5.27 to 6.38 mmol/L | |
| 667 per 1000 | 613 per 1000 | |||||
| Perineal trauma | not reported | |||||
| Gestational weight gain | The mean difference in gestational weight gain (kg/week) was 0 | The mean difference in gestational weight gain (kg/week) was 0.02 kg/week more (0.23 fewer to 0.27 more) | 22 | ⊕⊝⊝⊝ | FBG target 3.3 to 5.0 versus 5.27 to 6.38 mmol/L | |
| Postnatal depression | not reported | |||||
| Induction of labour | not reported | |||||
| Later development of cardiovascular disease | not reported | |||||
| *The risk in the intervention group (and its 95% confidence interval) is based on the assumed risk in the comparison group and the relative effect of the intervention (and its 95% CI). | ||||||
| GRADE Working Group grades of evidence | ||||||
| 1 One study with design limitations. 2 Wide confidence interval crossing the line of no effect, and small sample size. | ||||||
| Very tight versus tight‐moderate glycaemic control (FBG target 3.33 to 5.0 versus 5.27 to 6.38 mmol/L or FBG target < 4.44 versus < 5.55 mmol/L) | ||||||
| Patient or population: pregnant women with pre‐existing type 1 diabetes | ||||||
| Outcomes | Anticipated absolute effects* (95% CI) | Relative effect | No. of participants | Quality of the evidence | Comments | |
| Risk with tight‐moderate glycaemic control | Risk with very tight glycaemic control | |||||
| Large‐for‐gestational age | not reported | |||||
| Perinatal mortality | Study population | not estimable | 22 | ⊕⊕⊝⊝ | FBG target 3.33 to 5.0 versus 5.27 to 6.38 mmol/L | |
| 0 per 1000 | 0 per 1000 | |||||
| Serious perinatal morbidity | Study population | not estimable | 22 | ⊕⊕⊝⊝ | FBG target 3.33 to 5.0 versus 5.27 to 6.38 mmol/L | |
| 0 per 1000 | 0 per 1000 | |||||
| Neonatal hypoglycaemia | not reported | |||||
| Childhood/adulthood adiposity | not reported | |||||
| Childhood/adulthood diabetes | not reported | |||||
| Childhood/adulthood neurosensory disability | not reported | |||||
| *The risk in the intervention group (and its 95% confidence interval) is based on the assumed risk in the comparison group and the relative effect of the intervention (and its 95% CI). | ||||||
| GRADE Working Group grades of evidence | ||||||
| 1 One study with design limitations. 2 Small sample size, no events. | ||||||
| Tight versus moderate glycaemic control (FBG target ≤ 5.6 mmol/L versus 5.6 to 6.7 mmol/L) ‐ Maternal outcomes | ||||||
| Patient or population: pregnant women with pre‐existing type 1 diabetes | ||||||
| Outcomes | Anticipated absolute effects* (95% CI) | Relative effect | No. of participants | Quality of the evidence | Comments | |
| Risk with moderate glycaemic control | Risk with tight glycaemic control | |||||
| Pre‐eclampsia | Study population | RR 5.29 | 45 | ⊕⊝⊝⊝ | FBG target ≤ 5.6 versus 5.6 to 6.7 mmol/L Moderate: 0 out of 29 women, Tight: 1 out of 16 women. | |
| not estimable | not estimable | |||||
| Caesarean section | Study population | RR 1.21 | 45 | ⊕⊝⊝⊝ | FBG target ≤ 5.6 versus 5.6 to 6.7 mmol/L | |
| 103 per 1000 | 125 per 1000 | |||||
| Perineal trauma | not reported | |||||
| Gestational weight gain | not reported | |||||
| Postnatal depression | not reported | |||||
| Induction of labour | not reported | |||||
| Later development of cardiovascular disease | not reported | |||||
| 1 One study with design limitations. 2 Wide confidence interval crossing the line of no effect, few events and small sample size. | ||||||
| Tight versus moderate glycaemic control (FBG target ≤ 5.6 mmol/L versus 5.6 to 6.7 mmol/L) ‐ Infant outcomes | ||||||
| Patient or population: pregnant women with pre‐existing type 1 diabetes | ||||||
| Outcomes | Anticipated absolute effects* (95% CI) | Relative effect | No. of participants | Quality of the evidence | Comments | |
| Risk with moderate glycaemic control | Risk with tight glycaemic control | |||||
| Large‐for‐gestational age (birthweight > 90th centile) | Study population | not estimable | 45 | ⊕⊝⊝⊝ | FBG target ≤ 5.6 versus 5.6 to 6.7 mmol/L | |
| 0 per 1000 | 0 per 1000 | |||||
| Perinatal mortality | Study population | not estimable | 45 | ⊕⊝⊝⊝ | FBG target ≤ 5.6 versus 5.6 to 6.7 mmol/L | |
| 0 per 1000 | 0 per 1000 | |||||
| Serious perinatal morbidity | not reported | |||||
| Neonatal hypoglycaemia | not reported | |||||
| Childhood/adulthood adiposity | not reported | |||||
| Childhood/adulthood diabetes | not reported | |||||
| Childhood/adulthood neurosensory disability | not reported | |||||
| *The risk in the intervention group (and its 95% confidence interval) is based on the assumed risk in the comparison group and the relative effect of the intervention (and its 95% CI). | ||||||
| GRADE Working Group grades of evidence | ||||||
| 1 One study with design limitations. 2 No events & small sample size. | ||||||
| Tight‐moderate versus loose glycaemic control (FBG ≤ 6.7 mmol/L versus 6.7 to 8.9 mmol/L) ‐ Maternal outcomes | ||||||
| Patient or population: pregnant women with pre‐existing type 1 diabetes | ||||||
| Outcomes | Anticipated absolute effects* (95% CI) | Relative effect | No. of participants | Quality of the evidence | Comments | |
| Risk with loose glycaemic control (mother) | Risk with Tight‐moderate | |||||
| Pre‐eclampsia | Study population | RR 0.11 | 60 | ⊕⊕⊝⊝ | FBG target ≤ 6.7 mmol/L versus 6.7 to 8.9 mmol/L | |
| 200 per 1000 | 22 per 1000 | |||||
| Caesarean section | Study population | RR 0.28 | 60 | ⊕⊕⊝⊝ | FBG target ≤ 6.7 versus 6.7 to 8.9 mmol/L | |
| 400 per 1000 | 112 per 1000 | |||||
| Perineal trauma | not reported | |||||
| Gestational weight gain | not reported | |||||
| Postnatal depression | not reported | |||||
| Induction of labour | not reported | |||||
| Later development of cardiovascular disease | not reported | |||||
| *The risk in the intervention group (and its 95% confidence interval) is based on the assumed risk in the comparison group and the relative effect of the intervention (and its 95% CI). | ||||||
| GRADE Working Group grades of evidence | ||||||
| 1 One study with design limitations. 2 Few events and small sample size. 3 Small sample size. | ||||||
| Tight‐moderate versus loose glycaemic control (FBG ≤ 6.7 mmol/L versus 6.7 to 8.9 mmol/L) ‐ Infant outcomes | ||||||
| Patient or population: pregnant women with pre‐existing type 1 diabetes | ||||||
| Outcomes | Anticipated absolute effects* (95% CI) | Relative effect | No. of participants | Quality of the evidence | Comments | |
| Risk with loose glycaemic control | Risk with tight‐moderate glycaemic control | |||||
| Large‐for‐gestational age (birthweight > 90th centile) | Study population | RR 0.01 | 60 | ⊕⊕⊝⊝ | FBG target ≤ 6.7 versus 6.7 to 8.9 mmol/L | |
| 867 per 1000 | 9 per 1000 | |||||
| Perinatal mortality | Study population | RR 0.07 | 60 | ⊕⊝⊝⊝ | FBG target ≤ 6.7 versus 6.7 to 8.9 mmol/L | |
| 133 per 1000 | 9 per 1000 | |||||
| Serious perinatal morbidity | not reported | |||||
| Neonatal hypoglycaemia | not reported | |||||
| Childhood/adulthood adiposity | not reported | |||||
| Childhood/adulthood diabetes | not reported | |||||
| Childhood/adulthood neurosensory disability | not reported | |||||
| *The risk in the intervention group (and its 95% confidence interval) is based on the assumed risk in the comparison group and the relative effect of the intervention (and its 95% CI). | ||||||
| GRADE Working Group grades of evidence | ||||||
| 1 One study with design limitations. 2 Small sample size. 3 Wide confidence interval crossing the line of no effect, few events and small sample size. | ||||||
| Outcome or subgroup title | No. of studies | No. of participants | Statistical method | Effect size |
| 1 Caesarean section Show forest plot | 1 | 22 | Risk Ratio (M‐H, Fixed, 95% CI) | 0.92 [0.49, 1.73] |
| 1.1 FBG target 3.33 to 5.0 vs 5.27 to 6.38 mmol/L | 1 | 22 | Risk Ratio (M‐H, Fixed, 95% CI) | 0.92 [0.49, 1.73] |
| 2 Perinatal mortality Show forest plot | 1 | 22 | Risk Ratio (M‐H, Fixed, 95% CI) | 0.0 [0.0, 0.0] |
| 2.1 FBG target 3.33 to 5.0 vs 5.27 to 6.38 mmol/L | 1 | 22 | Risk Ratio (M‐H, Fixed, 95% CI) | 0.0 [0.0, 0.0] |
| 3 Serious perinatal morbidity Show forest plot | 1 | 22 | Risk Ratio (M‐H, Fixed, 95% CI) | 0.0 [0.0, 0.0] |
| 3.1 FBG target 3.33 to 5.0 vs 5.27 to 6.38 mmol/L | 1 | 22 | Risk Ratio (M‐H, Fixed, 95% CI) | 0.0 [0.0, 0.0] |
| 4 Congenital fetal anomaly Show forest plot | 1 | 22 | Risk Ratio (M‐H, Fixed, 95% CI) | 3.57 [0.19, 66.61] |
| 4.1 FBG target 3.33 to 5.0 vs 5.27 to 6.38 mmol/L | 1 | 22 | Risk Ratio (M‐H, Fixed, 95% CI) | 3.57 [0.19, 66.61] |
| 5 Pregnancy‐induced hypertension Show forest plot | 1 | 137 | Risk Ratio (M‐H, Fixed, 95% CI) | 1.40 [0.60, 3.25] |
| 5.1 FBG target < 4.44 vs < 5.55 mmol/L | 1 | 137 | Risk Ratio (M‐H, Fixed, 95% CI) | 1.40 [0.60, 3.25] |
| 6 Chronic hypertension: not prespecified Show forest plot | 1 | 22 | Risk Ratio (M‐H, Fixed, 95% CI) | 0.0 [0.0, 0.0] |
| 6.1 FBG target 3.33 to 5.0 mmol/L vs 5.27 to 6.38 mmol/L | 1 | 22 | Risk Ratio (M‐H, Fixed, 95% CI) | 0.0 [0.0, 0.0] |
| 7 Glycaemic control ‐ Self‐monitored blood glucose (mean, mmol/L) Show forest plot | 1 | Mean Difference (IV, Fixed, 95% CI) | Subtotals only | |
| 7.1 FBG target 3.33 to 5.0 vs 5.27 to 6.38 mmol/L: first trimester | 1 | 22 | Mean Difference (IV, Fixed, 95% CI) | ‐1.23 [‐2.19, ‐0.27] |
| 7.2 FBG target 3.33 to 5.0 vs 5.27 to 6.38 mmol/L: second trimester | 1 | 22 | Mean Difference (IV, Fixed, 95% CI) | ‐0.99 [‐1.64, ‐0.34] |
| 7.3 FBG target 3.33 to 5.0 vs 5.27 to 6.38 mmol/L: third trimester | 1 | 22 | Mean Difference (IV, Fixed, 95% CI) | ‐0.66 [‐1.60, 0.28] |
| 8 Glycaemic control ‐ Self‐monitored blood glucose tests/day Show forest plot | 1 | 22 | Mean Difference (IV, Fixed, 95% CI) | 1.60 [‐0.15, 3.35] |
| 8.1 FBG target 3.33 to 5.0 vs 5.27 to 6.39 mmol/L | 1 | 22 | Mean Difference (IV, Fixed, 95% CI) | 1.60 [‐0.15, 3.35] |
| 9 Glycaemic control ‐ HbA1c (%): first trimester Show forest plot | 2 | Mean Difference (IV, Fixed, 95% CI) | Subtotals only | |
| 9.1 FBG target 3.33 to 5.0 vs 5.27 to 6.38 mmol/L | 1 | 22 | Mean Difference (IV, Fixed, 95% CI) | ‐1.20 [‐2.25, ‐0.15] |
| 9.2 FBG target < 4.44 vs < 5.55 mmol/L | 1 | 137 | Mean Difference (IV, Fixed, 95% CI) | 0.0 [‐0.62, 0.62] |
| 10 Glycaemic control ‐ HbA1c (%): second trimester Show forest plot | 2 | Mean Difference (IV, Fixed, 95% CI) | Subtotals only | |
| 10.1 FBG target 3.33 to 5.0 vs 5.27 to 6.38 mmol/L | 1 | 22 | Mean Difference (IV, Fixed, 95% CI) | ‐0.5 [‐1.09, 0.09] |
| 10.2 FBG target < 4.44 vs < 5.55 mmol/L | 1 | 137 | Mean Difference (IV, Fixed, 95% CI) | 0.10 [‐0.37, 0.57] |
| 11 Glycaemic control ‐ HbA1c (%): third trimester Show forest plot | 2 | Mean Difference (IV, Fixed, 95% CI) | Subtotals only | |
| 11.1 FBG target 3.33 to 5.0 vs 5.27 to 6.38 mmol/L | 1 | 22 | Mean Difference (IV, Fixed, 95% CI) | ‐0.30 [‐0.92, 0.32] |
| 11.2 FBG target < 4.44 vs < 5.55 mmol/L | 1 | 137 | Mean Difference (IV, Fixed, 95% CI) | ‐0.10 [‐0.49, 0.29] |
| 12 Glycaemic control ‐ Mean preprandial glucose (mmol/L) Show forest plot | 1 | Mean Difference (IV, Fixed, 95% CI) | Subtotals only | |
| 12.1 FBG target < 4.44 vs < 5.55 mmol/L: first trimester | 1 | 137 | Mean Difference (IV, Fixed, 95% CI) | ‐0.39 [‐1.33, 0.55] |
| 12.2 FBG target < 4.44 vs < 5.55 mmol/L: second trimester | 1 | 137 | Mean Difference (IV, Fixed, 95% CI) | ‐0.27 [‐1.19, 0.65] |
| 12.3 FBG target < 4.44 vs < 5.55 mmol/L: third trimester | 1 | 137 | Mean Difference (IV, Fixed, 95% CI) | ‐0.34 [‐1.40, 0.72] |
| 13 Glycaemic control ‐ Mean postprandial glucose (mmol/L) Show forest plot | 1 | Mean Difference (IV, Fixed, 95% CI) | Subtotals only | |
| 13.1 FBG target < 4.44 vs < 5.55 mmol/L: first trimester | 1 | 137 | Mean Difference (IV, Fixed, 95% CI) | ‐0.94 [‐2.05, 0.17] |
| 13.2 FBG target < 4.44 vs < 5.55 mmol/L: second trimester | 1 | 137 | Mean Difference (IV, Fixed, 95% CI) | ‐0.56 [‐1.38, 0.26] |
| 13.3 FBG target < 4.44 vs < 5.55 mmol/L: third trimester | 1 | 137 | Mean Difference (IV, Fixed, 95% CI) | ‐0.11 [‐1.26, 1.04] |
| 14 Glycaemic control ‐ Below FBG threshold (% days) Show forest plot | 1 | Mean Difference (IV, Fixed, 95% CI) | Subtotals only | |
| 14.1 < 3.33 mmol/L | 1 | 22 | Mean Difference (IV, Fixed, 95% CI) | 20.0 [7.00, 33.00] |
| 14.2 < 2.78 mmol/L | 1 | 22 | Mean Difference (IV, Fixed, 95% CI) | 17.0 [4.04, 29.96] |
| 14.3 < 2.22 mmol/L | 1 | 22 | Mean Difference (IV, Fixed, 95% CI) | 8.0 [‐3.56, 19.56] |
| 15 Hypoglycaemic episodes ‐ > 1 subjective (% of days): not prespecified Show forest plot | 1 | 22 | Mean Difference (IV, Fixed, 95% CI) | 22.0 [11.07, 32.93] |
| 15.1 FBG target 3.33 to 5.0 vs 5.27 to 6.38 mmol/L | 1 | 22 | Mean Difference (IV, Fixed, 95% CI) | 22.0 [11.07, 32.93] |
| 16 Gestational weight gain (kg/week) Show forest plot | 1 | 22 | Mean Difference (IV, Fixed, 95% CI) | 0.02 [‐0.23, 0.27] |
| 16.1 FBG target 3.3 to 5.0 vs 5.27 to 6.38 mmol/L | 1 | 22 | Mean Difference (IV, Fixed, 95% CI) | 0.02 [‐0.23, 0.27] |
| 17 Fetal distress: not prespecified Show forest plot | 1 | 137 | Risk Ratio (M‐H, Fixed, 95% CI) | 1.15 [0.63, 2.11] |
| 17.1 FBG target < 4.44 vs < 5.55 mmol/L | 1 | 137 | Risk Ratio (M‐H, Fixed, 95% CI) | 1.15 [0.63, 2.11] |
| 18 Gestational age at birth (weeks) Show forest plot | 2 | 159 | Mean Difference (IV, Fixed, 95% CI) | 0.43 [‐0.23, 1.08] |
| 18.1 FBG target 3.33 to 5.0 vs 5.27 to 6.38 mmol/L | 1 | 22 | Mean Difference (IV, Fixed, 95% CI) | ‐0.30 [‐2.44, 1.84] |
| 18.2 FBG target < 4.44 vs < 5.55 mmol/L | 1 | 137 | Mean Difference (IV, Fixed, 95% CI) | 0.5 [‐0.19, 1.19] |
| 19 Birthweight (g) Show forest plot | 2 | 159 | Mean Difference (IV, Fixed, 95% CI) | ‐2.62 [‐179.83, 174.59] |
| 19.1 FBG target 3.33 to 5.0 vs 5.27 to 6.38 mmol/L | 1 | 22 | Mean Difference (IV, Fixed, 95% CI) | ‐272.0 [‐803.99, 259.99] |
| 19.2 FBG target < 4.44 vs < 5.55 mmol/L | 1 | 137 | Mean Difference (IV, Fixed, 95% CI) | 31.0 [‐156.95, 218.95] |
| 20 Apgar score Show forest plot | 1 | Risk Ratio (M‐H, Fixed, 95% CI) | Subtotals only | |
| 20.1 < 7 at 1 minute: FBG target < 4.44 vs < 5.55 mmol/L | 1 | 137 | Risk Ratio (M‐H, Fixed, 95% CI) | 1.01 [0.40, 2.55] |
| 20.2 < 7 at 5 minutes: FBG target < 4.44 vs < 5.55 mmol/L | 1 | 137 | Risk Ratio (M‐H, Fixed, 95% CI) | 0.0 [0.0, 0.0] |
| 21 Asphyxia: not prespecified Show forest plot | 1 | 137 | Risk Ratio (M‐H, Fixed, 95% CI) | 1.01 [0.58, 1.78] |
| 21.1 FBG target < 4.44 vs < 5.55 mmol/L | 1 | 137 | Risk Ratio (M‐H, Fixed, 95% CI) | 1.01 [0.58, 1.78] |
| 22 Neonatal hypocalcaemia Show forest plot | 1 | 137 | Risk Ratio (M‐H, Fixed, 95% CI) | 0.55 [0.30, 1.03] |
| 22.1 FBG target < 4.44 vs < 5.55 mmol/L | 1 | 137 | Risk Ratio (M‐H, Fixed, 95% CI) | 0.55 [0.30, 1.03] |
| 23 Neonatal hypomagnesaemia: not prespecified Show forest plot | 1 | 127 | Risk Ratio (M‐H, Fixed, 95% CI) | 0.65 [0.25, 1.68] |
| 23.1 FBG target < 4.44 vs < 5.55 mmol/L | 1 | 127 | Risk Ratio (M‐H, Fixed, 95% CI) | 0.65 [0.25, 1.68] |
| 24 Maternal hospitalisation (days) Show forest plot | 1 | 137 | Mean Difference (IV, Fixed, 95% CI) | 10.60 [9.53, 11.67] |
| 24.1 FBG target < 4.44 vs < 5.55 mmol/L | 1 | 137 | Mean Difference (IV, Fixed, 95% CI) | 10.60 [9.53, 11.67] |
| Outcome or subgroup title | No. of studies | No. of participants | Statistical method | Effect size |
| 1 Pre‐eclampsia Show forest plot | 1 | 45 | Risk Ratio (M‐H, Fixed, 95% CI) | 5.29 [0.23, 122.91] |
| 1.1 FBG target ≤ 5.6 mmol/L vs 5.6 to 6.7 mmol/L | 1 | 45 | Risk Ratio (M‐H, Fixed, 95% CI) | 5.29 [0.23, 122.91] |
| 2 Caesarean section Show forest plot | 1 | 45 | Risk Ratio (M‐H, Fixed, 95% CI) | 1.21 [0.22, 6.50] |
| 2.1 FBG target ≤ 5.6 vs 5.6 to 6.7 mmol/L | 1 | 45 | Risk Ratio (M‐H, Fixed, 95% CI) | 1.21 [0.22, 6.50] |
| 3 Perinatal mortality Show forest plot | 1 | 45 | Risk Ratio (M‐H, Fixed, 95% CI) | 0.0 [0.0, 0.0] |
| 3.1 FBG target ≤ 5.6 vs 5.6 to 6.7 mmol/L | 1 | 45 | Risk Ratio (M‐H, Fixed, 95% CI) | 0.0 [0.0, 0.0] |
| 4 Transient maternal hypertension Show forest plot | 1 | 45 | Risk Ratio (M‐H, Fixed, 95% CI) | 0.59 [0.03, 13.66] |
| 4.1 FBG target ≤ 5.6 vs 5.6 to 6.7 mmol/L | 1 | 45 | Risk Ratio (M‐H, Fixed, 95% CI) | 0.59 [0.03, 13.66] |
| 5 Hypoglycaemic epispodes ‐ first half of pregnancy: not prespecified Show forest plot | 1 | 45 | Risk Ratio (M‐H, Fixed, 95% CI) | 26.47 [1.61, 435.38] |
| 5.1 FBG target ≤ 5.6 vs 5.6 to 6.7 mmol/L | 1 | 45 | Risk Ratio (M‐H, Fixed, 95% CI) | 26.47 [1.61, 435.38] |
| 6 Large‐for‐gestational age (birthweight > 90th centile) Show forest plot | 1 | 45 | Risk Ratio (M‐H, Fixed, 95% CI) | 0.0 [0.0, 0.0] |
| 6.1 FBG target ≤ 5.6 vs 5.6 to 6.7 mmol/L | 1 | 45 | Risk Ratio (M‐H, Fixed, 95% CI) | 0.0 [0.0, 0.0] |
| 7 Respiratory distress syndrome Show forest plot | 1 | 45 | Risk Ratio (M‐H, Fixed, 95% CI) | 0.91 [0.09, 9.24] |
| 7.1 FBG target ≤ 5.6 v 5.6 to 6.7 mmol/L | 1 | 45 | Risk Ratio (M‐H, Fixed, 95% CI) | 0.91 [0.09, 9.24] |
| Outcome or subgroup title | No. of studies | No. of participants | Statistical method | Effect size |
| 1 Pre‐eclampsia Show forest plot | 1 | 60 | Risk Ratio (M‐H, Fixed, 95% CI) | 0.11 [0.01, 0.99] |
| 1.1 FBG ≤ 6.7 mmol/L vs 6.7 to 8.9 mmol/L | 1 | 60 | Risk Ratio (M‐H, Fixed, 95% CI) | 0.11 [0.01, 0.99] |
| 2 Caesarean section Show forest plot | 1 | 60 | Risk Ratio (M‐H, Fixed, 95% CI) | 0.28 [0.10, 0.78] |
| 2.1 FBG target ≤ 6.7 vs 6.7 to 8.9 mmol/L | 1 | 60 | Risk Ratio (M‐H, Fixed, 95% CI) | 0.28 [0.10, 0.78] |
| 3 Perinatal mortality Show forest plot | 1 | 60 | Risk Ratio (M‐H, Fixed, 95% CI) | 0.07 [0.00, 1.37] |
| 3.1 FBG target ≤ 6.7 vs 6.7 to 8.9 mmol/L | 1 | 60 | Risk Ratio (M‐H, Fixed, 95% CI) | 0.07 [0.00, 1.37] |
| 4 Transient maternal hypertension Show forest plot | 1 | 45 | Risk Ratio (M‐H, Fixed, 95% CI) | 1.81 [0.12, 27.07] |
| 4.1 FBG target ≤ 6.7 vs 6.7 to 8.9 mmol/L | 1 | 45 | Risk Ratio (M‐H, Fixed, 95% CI) | 1.81 [0.12, 27.07] |
| 5 Hypoglycaemic episodes ‐ in first half of pregnancy: not prespecified Show forest plot | 1 | 60 | Risk Ratio (M‐H, Fixed, 95% CI) | 5.22 [0.32, 86.28] |
| 5.1 FBG target ≤ 6.7 vs 6.7 to 8.9 mmol/L | 1 | 60 | Risk Ratio (M‐H, Fixed, 95% CI) | 5.22 [0.32, 86.28] |
| 6 Large‐for‐gestational age (birthweight > 90th centile) Show forest plot | 1 | 60 | Risk Ratio (M‐H, Fixed, 95% CI) | 0.01 [0.00, 0.20] |
| 6.1 FBG target ≤ 6.7 vs 6.7 to 8.9 mmol/L | 1 | 60 | Risk Ratio (M‐H, Fixed, 95% CI) | 0.01 [0.00, 0.20] |
| 7 Respiratory distress syndrome Show forest plot | 1 | 60 | Risk Ratio (M‐H, Fixed, 95% CI) | 0.17 [0.05, 0.59] |
| 7.1 FBG target ≤ 6.7 vs 6.7 to 8.9 mmol/L | 1 | 60 | Risk Ratio (M‐H, Fixed, 95% CI) | 0.17 [0.05, 0.59] |