Diferentes intensidades para el control de la glucemia en embarazadas con diabetes preexistente
Información
- DOI:
- https://doi.org/10.1002/14651858.CD008540.pub4Copiar DOI

- Base de datos:
-
- Cochrane Database of Systematic Reviews
- Versión publicada:
-
- 04 mayo 2016see what's new
- Tipo:
-
- Intervention
- Etapa:
-
- Review
- Grupo Editorial Cochrane:
-
Grupo Cochrane de Embarazo y parto
- Copyright:
-
- Copyright © 2016 The Cochrane Collaboration. Published by John Wiley & Sons, Ltd.
Cifras del artículo
Altmetric:
Citado por:
Autores
Contributions of authors
Philippa Middleton drafted the protocol with assistance from Lucy Simmonds. Philippa Middleton and Lucy Simmonds assessed studies for inclusion/exclusion; carried out data extraction and assessed the risk of bias components. Philippa Middleton wrote and updated the review with editorial or clinical input or both from Caroline Crowther and Lucy Simmonds.
Sources of support
Internal sources
-
ARCH: Australian Research Centre for Health of Women and Babies, Robinson Research Institute, Discipline of Obstetrics and Gynaecology, The University of Adelaide, Australia.
External sources
-
NHMRC: National Health and Medical Research Council, Australia Funding for the PCG Australian and New Zealand Satellite, Australia.
-
NIHR Cochrane Programme Grant Project: 13/89/05 – Pregnancy and childbirth systematic reviews to support clinical guidelines, UK.
Declarations of interest
None known.
Acknowledgements
Jessica Ainge Allen, Rachel Earl and Rebecca Tooher helped with drafting early versions of the protocol. Peter Muller for clinical input during the development of the 2012 update.
Denise Atherton for administrative assistance; Lynn Hampson for the literature search; Helen West for assistance with the 2015 revision.
Helen West's contribution to this project was supported by the National Institute for Health Research, via Cochrane Programme Grant funding to Cochrane Pregnancy and Childbirth. The views and opinions expressed therein are those of the authors and do not necessarily reflect those of the Systematic Reviews Programme, NIHR, NHS or the Department of Health.
Version history
| Published | Title | Stage | Authors | Version |
| 2016 May 04 | Different intensities of glycaemic control for pregnant women with pre‐existing diabetes | Review | Philippa Middleton, Caroline A Crowther, Lucy Simmonds | |
| 2012 Aug 15 | Different intensities of glycaemic control for pregnant women with pre‐existing diabetes | Review | Philippa Middleton, Caroline A Crowther, Lucy Simmonds | |
| 2010 Sep 08 | Different intensities of glycaemic control for pregnant women with pre‐existing diabetes | Review | Philippa Middleton, Caroline A Crowther, Lucy Simmonds, Peter Muller | |
| 2010 Jun 16 | Different intensities of glycaemic control (tight versus very tight) for pregnant women with pre‐existing diabetes | Protocol | Philippa Middleton, Caroline A Crowther, Lucy Simmonds, Peter Muller | |
Differences between protocol and review
2015 update
-
We have updated the Background with some more recent data and references.
-
We have added additional outcomes (Later development of cardiovascular disease (maternal); Length of postnatal stay (mother); Apgar score; and Childhood/adulthood diabetes) and reworded other outcomes to be in line with the list of core outcomes for diabetes in pregnancy.
-
We have added some additional outcomes and labelled these as 'not prespecified' (chronic hypertension; transient hypertension; hypoglycaemic episodes; fetal distress; asphyxia; neonatal hypomagnesaemia).
-
We have deleted the maternal primary outcome of hyperglycaemia requiring changes in management during pregnancy and the neonatal secondary outcome of macrosomia, as both are now redundant.
-
'Summary of findings' tables have been incorporated.
2012 review version
-
The scope of the review has been expanded to include moderate and loose glycaemic control as well as tight and very tight control, resulting in a title change and changes to the objectives.
-
The Methods were updated to current Pregnancy and Childbirth Group standard text.
Keywords
MeSH
Medical Subject Headings (MeSH) Keywords
- Blood Glucose [*metabolism];
- Diabetes Mellitus, Type 1 [blood, *therapy];
- Diabetes Mellitus, Type 2 [blood];
- Fasting [blood];
- Glycated Hemoglobin [metabolism];
- Hyperglycemia [blood, therapy];
- Hypoglycemic Agents [therapeutic use];
- Insulin [therapeutic use];
- Pregnancy in Diabetics [blood, *therapy];
- Randomized Controlled Trials as Topic;
- Reference Values;
Medical Subject Headings Check Words
Female; Humans; Infant, Newborn; Pregnancy;
PICO

Study flow diagram.
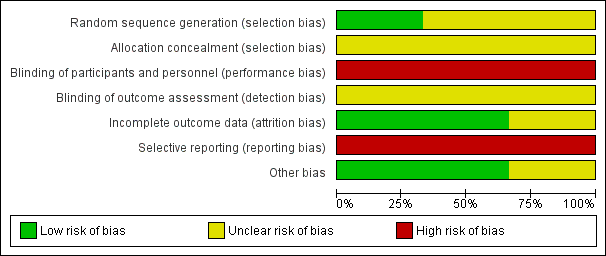
Methodological quality graph: review authors' judgements about each methodological quality item presented as percentages across all included studies.
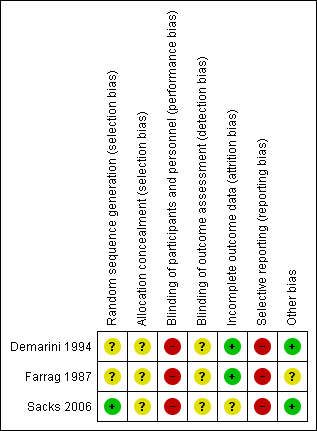
Methodological quality summary: review authors' judgements about each methodological quality item for each included study.

Comparison 1 Very tight versus tight‐moderate glycaemic control, Outcome 1 Caesarean section.

Comparison 1 Very tight versus tight‐moderate glycaemic control, Outcome 2 Perinatal mortality.
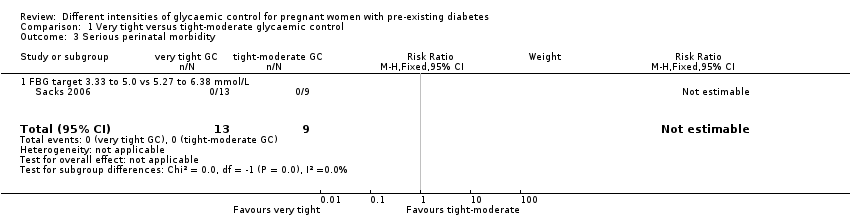
Comparison 1 Very tight versus tight‐moderate glycaemic control, Outcome 3 Serious perinatal morbidity.

Comparison 1 Very tight versus tight‐moderate glycaemic control, Outcome 4 Congenital fetal anomaly.
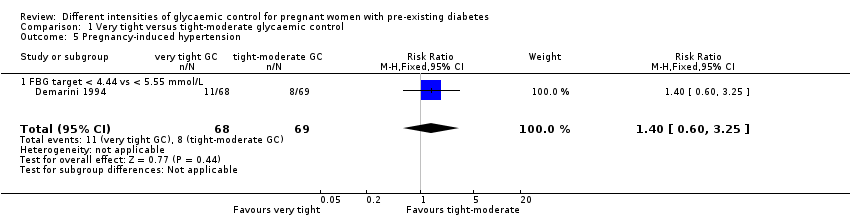
Comparison 1 Very tight versus tight‐moderate glycaemic control, Outcome 5 Pregnancy‐induced hypertension.

Comparison 1 Very tight versus tight‐moderate glycaemic control, Outcome 6 Chronic hypertension: not prespecified.

Comparison 1 Very tight versus tight‐moderate glycaemic control, Outcome 7 Glycaemic control ‐ Self‐monitored blood glucose (mean, mmol/L).

Comparison 1 Very tight versus tight‐moderate glycaemic control, Outcome 8 Glycaemic control ‐ Self‐monitored blood glucose tests/day.
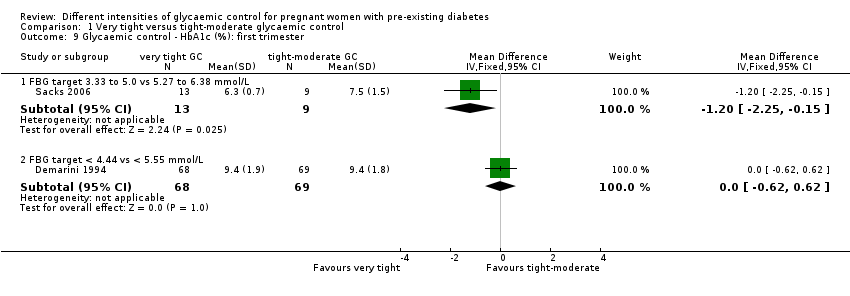
Comparison 1 Very tight versus tight‐moderate glycaemic control, Outcome 9 Glycaemic control ‐ HbA1c (%): first trimester.

Comparison 1 Very tight versus tight‐moderate glycaemic control, Outcome 10 Glycaemic control ‐ HbA1c (%): second trimester.

Comparison 1 Very tight versus tight‐moderate glycaemic control, Outcome 11 Glycaemic control ‐ HbA1c (%): third trimester.

Comparison 1 Very tight versus tight‐moderate glycaemic control, Outcome 12 Glycaemic control ‐ Mean preprandial glucose (mmol/L).

Comparison 1 Very tight versus tight‐moderate glycaemic control, Outcome 13 Glycaemic control ‐ Mean postprandial glucose (mmol/L).
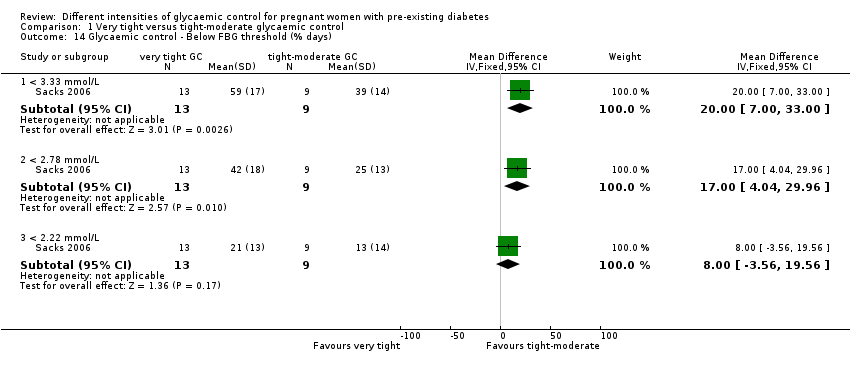
Comparison 1 Very tight versus tight‐moderate glycaemic control, Outcome 14 Glycaemic control ‐ Below FBG threshold (% days).

Comparison 1 Very tight versus tight‐moderate glycaemic control, Outcome 15 Hypoglycaemic episodes ‐ > 1 subjective (% of days): not prespecified.
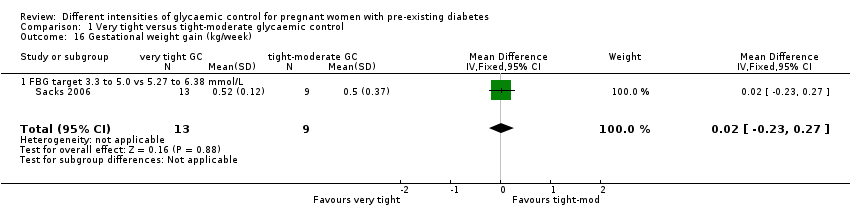
Comparison 1 Very tight versus tight‐moderate glycaemic control, Outcome 16 Gestational weight gain (kg/week).
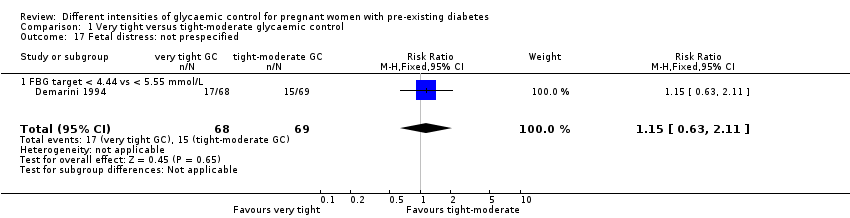
Comparison 1 Very tight versus tight‐moderate glycaemic control, Outcome 17 Fetal distress: not prespecified.

Comparison 1 Very tight versus tight‐moderate glycaemic control, Outcome 18 Gestational age at birth (weeks).

Comparison 1 Very tight versus tight‐moderate glycaemic control, Outcome 19 Birthweight (g).

Comparison 1 Very tight versus tight‐moderate glycaemic control, Outcome 20 Apgar score.

Comparison 1 Very tight versus tight‐moderate glycaemic control, Outcome 21 Asphyxia: not prespecified.
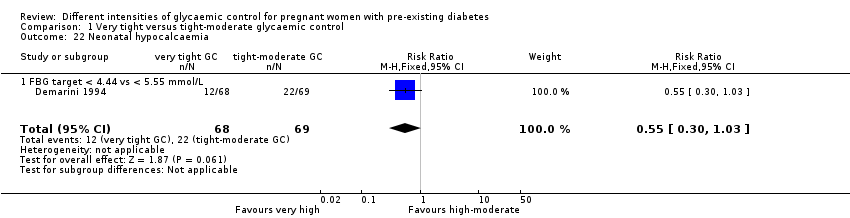
Comparison 1 Very tight versus tight‐moderate glycaemic control, Outcome 22 Neonatal hypocalcaemia.
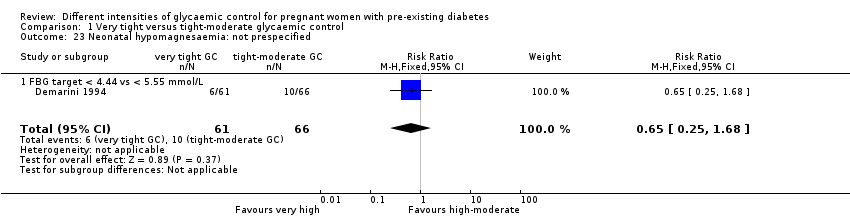
Comparison 1 Very tight versus tight‐moderate glycaemic control, Outcome 23 Neonatal hypomagnesaemia: not prespecified.

Comparison 1 Very tight versus tight‐moderate glycaemic control, Outcome 24 Maternal hospitalisation (days).

Comparison 2 Tight versus moderate glycaemic control, Outcome 1 Pre‐eclampsia.

Comparison 2 Tight versus moderate glycaemic control, Outcome 2 Caesarean section.

Comparison 2 Tight versus moderate glycaemic control, Outcome 3 Perinatal mortality.

Comparison 2 Tight versus moderate glycaemic control, Outcome 4 Transient maternal hypertension.

Comparison 2 Tight versus moderate glycaemic control, Outcome 5 Hypoglycaemic epispodes ‐ first half of pregnancy: not prespecified.

Comparison 2 Tight versus moderate glycaemic control, Outcome 6 Large‐for‐gestational age (birthweight > 90th centile).

Comparison 2 Tight versus moderate glycaemic control, Outcome 7 Respiratory distress syndrome.
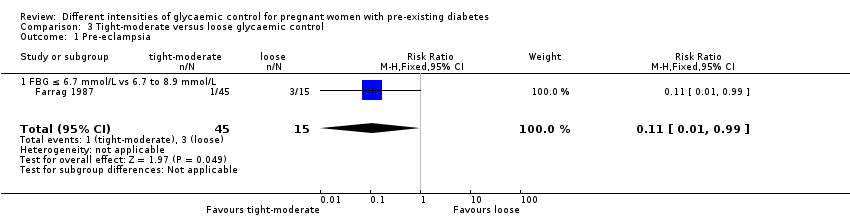
Comparison 3 Tight‐moderate versus loose glycaemic control, Outcome 1 Pre‐eclampsia.

Comparison 3 Tight‐moderate versus loose glycaemic control, Outcome 2 Caesarean section.

Comparison 3 Tight‐moderate versus loose glycaemic control, Outcome 3 Perinatal mortality.

Comparison 3 Tight‐moderate versus loose glycaemic control, Outcome 4 Transient maternal hypertension.
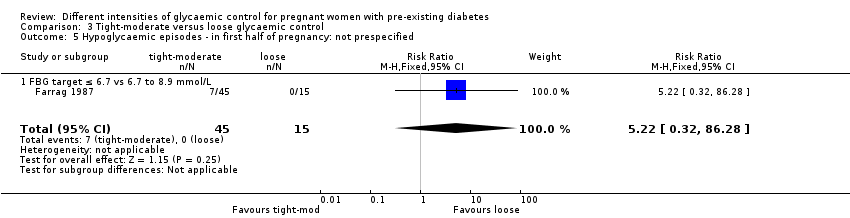
Comparison 3 Tight‐moderate versus loose glycaemic control, Outcome 5 Hypoglycaemic episodes ‐ in first half of pregnancy: not prespecified.
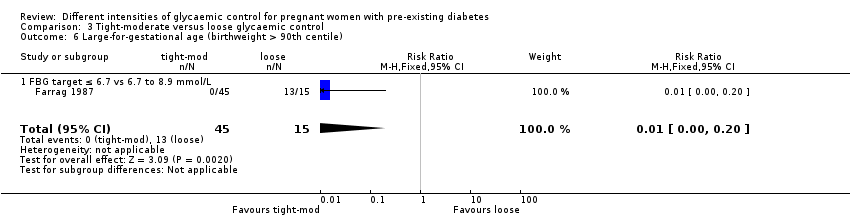
Comparison 3 Tight‐moderate versus loose glycaemic control, Outcome 6 Large‐for‐gestational age (birthweight > 90th centile).
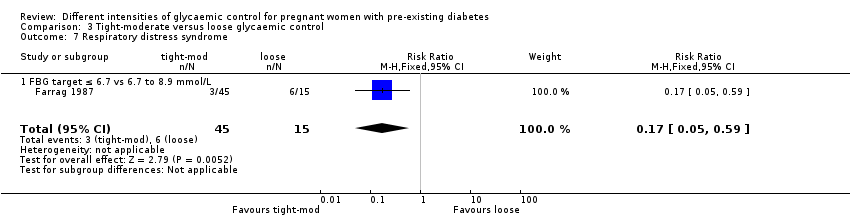
Comparison 3 Tight‐moderate versus loose glycaemic control, Outcome 7 Respiratory distress syndrome.
| Very tight versus tight‐moderate glycaemic control (FBG target 3.33 to 5.0 versus 5.27 to 6.38 mmol/L) | ||||||
| Patient or population: pregnant women with pre‐existing type 1 diabetes | ||||||
| Outcomes | Anticipated absolute effects* (95% CI) | Relative effect | No. of participants | Quality of the evidence | Comments | |
| Risk with tight‐moderate glycaemic control | Risk with very tight glycaemic control | |||||
| Pre‐eclampsia | not reported | |||||
| Caesarean section | Study population | RR 0.92 | 22 | ⊕⊝⊝⊝ | FBG target 3.3 to 5.0 versus 5.27 to 6.38 mmol/L | |
| 667 per 1000 | 613 per 1000 | |||||
| Perineal trauma | not reported | |||||
| Gestational weight gain | The mean difference in gestational weight gain (kg/week) was 0 | The mean difference in gestational weight gain (kg/week) was 0.02 kg/week more (0.23 fewer to 0.27 more) | 22 | ⊕⊝⊝⊝ | FBG target 3.3 to 5.0 versus 5.27 to 6.38 mmol/L | |
| Postnatal depression | not reported | |||||
| Induction of labour | not reported | |||||
| Later development of cardiovascular disease | not reported | |||||
| *The risk in the intervention group (and its 95% confidence interval) is based on the assumed risk in the comparison group and the relative effect of the intervention (and its 95% CI). | ||||||
| GRADE Working Group grades of evidence | ||||||
| 1 One study with design limitations. 2 Wide confidence interval crossing the line of no effect, and small sample size. | ||||||
| Very tight versus tight‐moderate glycaemic control (FBG target 3.33 to 5.0 versus 5.27 to 6.38 mmol/L or FBG target < 4.44 versus < 5.55 mmol/L) | ||||||
| Patient or population: pregnant women with pre‐existing type 1 diabetes | ||||||
| Outcomes | Anticipated absolute effects* (95% CI) | Relative effect | No. of participants | Quality of the evidence | Comments | |
| Risk with tight‐moderate glycaemic control | Risk with very tight glycaemic control | |||||
| Large‐for‐gestational age | not reported | |||||
| Perinatal mortality | Study population | not estimable | 22 | ⊕⊕⊝⊝ | FBG target 3.33 to 5.0 versus 5.27 to 6.38 mmol/L | |
| 0 per 1000 | 0 per 1000 | |||||
| Serious perinatal morbidity | Study population | not estimable | 22 | ⊕⊕⊝⊝ | FBG target 3.33 to 5.0 versus 5.27 to 6.38 mmol/L | |
| 0 per 1000 | 0 per 1000 | |||||
| Neonatal hypoglycaemia | not reported | |||||
| Childhood/adulthood adiposity | not reported | |||||
| Childhood/adulthood diabetes | not reported | |||||
| Childhood/adulthood neurosensory disability | not reported | |||||
| *The risk in the intervention group (and its 95% confidence interval) is based on the assumed risk in the comparison group and the relative effect of the intervention (and its 95% CI). | ||||||
| GRADE Working Group grades of evidence | ||||||
| 1 One study with design limitations. 2 Small sample size, no events. | ||||||
| Tight versus moderate glycaemic control (FBG target ≤ 5.6 mmol/L versus 5.6 to 6.7 mmol/L) ‐ Maternal outcomes | ||||||
| Patient or population: pregnant women with pre‐existing type 1 diabetes | ||||||
| Outcomes | Anticipated absolute effects* (95% CI) | Relative effect | No. of participants | Quality of the evidence | Comments | |
| Risk with moderate glycaemic control | Risk with tight glycaemic control | |||||
| Pre‐eclampsia | Study population | RR 5.29 | 45 | ⊕⊝⊝⊝ | FBG target ≤ 5.6 versus 5.6 to 6.7 mmol/L Moderate: 0 out of 29 women, Tight: 1 out of 16 women. | |
| not estimable | not estimable | |||||
| Caesarean section | Study population | RR 1.21 | 45 | ⊕⊝⊝⊝ | FBG target ≤ 5.6 versus 5.6 to 6.7 mmol/L | |
| 103 per 1000 | 125 per 1000 | |||||
| Perineal trauma | not reported | |||||
| Gestational weight gain | not reported | |||||
| Postnatal depression | not reported | |||||
| Induction of labour | not reported | |||||
| Later development of cardiovascular disease | not reported | |||||
| 1 One study with design limitations. 2 Wide confidence interval crossing the line of no effect, few events and small sample size. | ||||||
| Tight versus moderate glycaemic control (FBG target ≤ 5.6 mmol/L versus 5.6 to 6.7 mmol/L) ‐ Infant outcomes | ||||||
| Patient or population: pregnant women with pre‐existing type 1 diabetes | ||||||
| Outcomes | Anticipated absolute effects* (95% CI) | Relative effect | No. of participants | Quality of the evidence | Comments | |
| Risk with moderate glycaemic control | Risk with tight glycaemic control | |||||
| Large‐for‐gestational age (birthweight > 90th centile) | Study population | not estimable | 45 | ⊕⊝⊝⊝ | FBG target ≤ 5.6 versus 5.6 to 6.7 mmol/L | |
| 0 per 1000 | 0 per 1000 | |||||
| Perinatal mortality | Study population | not estimable | 45 | ⊕⊝⊝⊝ | FBG target ≤ 5.6 versus 5.6 to 6.7 mmol/L | |
| 0 per 1000 | 0 per 1000 | |||||
| Serious perinatal morbidity | not reported | |||||
| Neonatal hypoglycaemia | not reported | |||||
| Childhood/adulthood adiposity | not reported | |||||
| Childhood/adulthood diabetes | not reported | |||||
| Childhood/adulthood neurosensory disability | not reported | |||||
| *The risk in the intervention group (and its 95% confidence interval) is based on the assumed risk in the comparison group and the relative effect of the intervention (and its 95% CI). | ||||||
| GRADE Working Group grades of evidence | ||||||
| 1 One study with design limitations. 2 No events & small sample size. | ||||||
| Tight‐moderate versus loose glycaemic control (FBG ≤ 6.7 mmol/L versus 6.7 to 8.9 mmol/L) ‐ Maternal outcomes | ||||||
| Patient or population: pregnant women with pre‐existing type 1 diabetes | ||||||
| Outcomes | Anticipated absolute effects* (95% CI) | Relative effect | No. of participants | Quality of the evidence | Comments | |
| Risk with loose glycaemic control (mother) | Risk with Tight‐moderate | |||||
| Pre‐eclampsia | Study population | RR 0.11 | 60 | ⊕⊕⊝⊝ | FBG target ≤ 6.7 mmol/L versus 6.7 to 8.9 mmol/L | |
| 200 per 1000 | 22 per 1000 | |||||
| Caesarean section | Study population | RR 0.28 | 60 | ⊕⊕⊝⊝ | FBG target ≤ 6.7 versus 6.7 to 8.9 mmol/L | |
| 400 per 1000 | 112 per 1000 | |||||
| Perineal trauma | not reported | |||||
| Gestational weight gain | not reported | |||||
| Postnatal depression | not reported | |||||
| Induction of labour | not reported | |||||
| Later development of cardiovascular disease | not reported | |||||
| *The risk in the intervention group (and its 95% confidence interval) is based on the assumed risk in the comparison group and the relative effect of the intervention (and its 95% CI). | ||||||
| GRADE Working Group grades of evidence | ||||||
| 1 One study with design limitations. 2 Few events and small sample size. 3 Small sample size. | ||||||
| Tight‐moderate versus loose glycaemic control (FBG ≤ 6.7 mmol/L versus 6.7 to 8.9 mmol/L) ‐ Infant outcomes | ||||||
| Patient or population: pregnant women with pre‐existing type 1 diabetes | ||||||
| Outcomes | Anticipated absolute effects* (95% CI) | Relative effect | No. of participants | Quality of the evidence | Comments | |
| Risk with loose glycaemic control | Risk with tight‐moderate glycaemic control | |||||
| Large‐for‐gestational age (birthweight > 90th centile) | Study population | RR 0.01 | 60 | ⊕⊕⊝⊝ | FBG target ≤ 6.7 versus 6.7 to 8.9 mmol/L | |
| 867 per 1000 | 9 per 1000 | |||||
| Perinatal mortality | Study population | RR 0.07 | 60 | ⊕⊝⊝⊝ | FBG target ≤ 6.7 versus 6.7 to 8.9 mmol/L | |
| 133 per 1000 | 9 per 1000 | |||||
| Serious perinatal morbidity | not reported | |||||
| Neonatal hypoglycaemia | not reported | |||||
| Childhood/adulthood adiposity | not reported | |||||
| Childhood/adulthood diabetes | not reported | |||||
| Childhood/adulthood neurosensory disability | not reported | |||||
| *The risk in the intervention group (and its 95% confidence interval) is based on the assumed risk in the comparison group and the relative effect of the intervention (and its 95% CI). | ||||||
| GRADE Working Group grades of evidence | ||||||
| 1 One study with design limitations. 2 Small sample size. 3 Wide confidence interval crossing the line of no effect, few events and small sample size. | ||||||
| Outcome or subgroup title | No. of studies | No. of participants | Statistical method | Effect size |
| 1 Caesarean section Show forest plot | 1 | 22 | Risk Ratio (M‐H, Fixed, 95% CI) | 0.92 [0.49, 1.73] |
| 1.1 FBG target 3.33 to 5.0 vs 5.27 to 6.38 mmol/L | 1 | 22 | Risk Ratio (M‐H, Fixed, 95% CI) | 0.92 [0.49, 1.73] |
| 2 Perinatal mortality Show forest plot | 1 | 22 | Risk Ratio (M‐H, Fixed, 95% CI) | 0.0 [0.0, 0.0] |
| 2.1 FBG target 3.33 to 5.0 vs 5.27 to 6.38 mmol/L | 1 | 22 | Risk Ratio (M‐H, Fixed, 95% CI) | 0.0 [0.0, 0.0] |
| 3 Serious perinatal morbidity Show forest plot | 1 | 22 | Risk Ratio (M‐H, Fixed, 95% CI) | 0.0 [0.0, 0.0] |
| 3.1 FBG target 3.33 to 5.0 vs 5.27 to 6.38 mmol/L | 1 | 22 | Risk Ratio (M‐H, Fixed, 95% CI) | 0.0 [0.0, 0.0] |
| 4 Congenital fetal anomaly Show forest plot | 1 | 22 | Risk Ratio (M‐H, Fixed, 95% CI) | 3.57 [0.19, 66.61] |
| 4.1 FBG target 3.33 to 5.0 vs 5.27 to 6.38 mmol/L | 1 | 22 | Risk Ratio (M‐H, Fixed, 95% CI) | 3.57 [0.19, 66.61] |
| 5 Pregnancy‐induced hypertension Show forest plot | 1 | 137 | Risk Ratio (M‐H, Fixed, 95% CI) | 1.40 [0.60, 3.25] |
| 5.1 FBG target < 4.44 vs < 5.55 mmol/L | 1 | 137 | Risk Ratio (M‐H, Fixed, 95% CI) | 1.40 [0.60, 3.25] |
| 6 Chronic hypertension: not prespecified Show forest plot | 1 | 22 | Risk Ratio (M‐H, Fixed, 95% CI) | 0.0 [0.0, 0.0] |
| 6.1 FBG target 3.33 to 5.0 mmol/L vs 5.27 to 6.38 mmol/L | 1 | 22 | Risk Ratio (M‐H, Fixed, 95% CI) | 0.0 [0.0, 0.0] |
| 7 Glycaemic control ‐ Self‐monitored blood glucose (mean, mmol/L) Show forest plot | 1 | Mean Difference (IV, Fixed, 95% CI) | Subtotals only | |
| 7.1 FBG target 3.33 to 5.0 vs 5.27 to 6.38 mmol/L: first trimester | 1 | 22 | Mean Difference (IV, Fixed, 95% CI) | ‐1.23 [‐2.19, ‐0.27] |
| 7.2 FBG target 3.33 to 5.0 vs 5.27 to 6.38 mmol/L: second trimester | 1 | 22 | Mean Difference (IV, Fixed, 95% CI) | ‐0.99 [‐1.64, ‐0.34] |
| 7.3 FBG target 3.33 to 5.0 vs 5.27 to 6.38 mmol/L: third trimester | 1 | 22 | Mean Difference (IV, Fixed, 95% CI) | ‐0.66 [‐1.60, 0.28] |
| 8 Glycaemic control ‐ Self‐monitored blood glucose tests/day Show forest plot | 1 | 22 | Mean Difference (IV, Fixed, 95% CI) | 1.60 [‐0.15, 3.35] |
| 8.1 FBG target 3.33 to 5.0 vs 5.27 to 6.39 mmol/L | 1 | 22 | Mean Difference (IV, Fixed, 95% CI) | 1.60 [‐0.15, 3.35] |
| 9 Glycaemic control ‐ HbA1c (%): first trimester Show forest plot | 2 | Mean Difference (IV, Fixed, 95% CI) | Subtotals only | |
| 9.1 FBG target 3.33 to 5.0 vs 5.27 to 6.38 mmol/L | 1 | 22 | Mean Difference (IV, Fixed, 95% CI) | ‐1.20 [‐2.25, ‐0.15] |
| 9.2 FBG target < 4.44 vs < 5.55 mmol/L | 1 | 137 | Mean Difference (IV, Fixed, 95% CI) | 0.0 [‐0.62, 0.62] |
| 10 Glycaemic control ‐ HbA1c (%): second trimester Show forest plot | 2 | Mean Difference (IV, Fixed, 95% CI) | Subtotals only | |
| 10.1 FBG target 3.33 to 5.0 vs 5.27 to 6.38 mmol/L | 1 | 22 | Mean Difference (IV, Fixed, 95% CI) | ‐0.5 [‐1.09, 0.09] |
| 10.2 FBG target < 4.44 vs < 5.55 mmol/L | 1 | 137 | Mean Difference (IV, Fixed, 95% CI) | 0.10 [‐0.37, 0.57] |
| 11 Glycaemic control ‐ HbA1c (%): third trimester Show forest plot | 2 | Mean Difference (IV, Fixed, 95% CI) | Subtotals only | |
| 11.1 FBG target 3.33 to 5.0 vs 5.27 to 6.38 mmol/L | 1 | 22 | Mean Difference (IV, Fixed, 95% CI) | ‐0.30 [‐0.92, 0.32] |
| 11.2 FBG target < 4.44 vs < 5.55 mmol/L | 1 | 137 | Mean Difference (IV, Fixed, 95% CI) | ‐0.10 [‐0.49, 0.29] |
| 12 Glycaemic control ‐ Mean preprandial glucose (mmol/L) Show forest plot | 1 | Mean Difference (IV, Fixed, 95% CI) | Subtotals only | |
| 12.1 FBG target < 4.44 vs < 5.55 mmol/L: first trimester | 1 | 137 | Mean Difference (IV, Fixed, 95% CI) | ‐0.39 [‐1.33, 0.55] |
| 12.2 FBG target < 4.44 vs < 5.55 mmol/L: second trimester | 1 | 137 | Mean Difference (IV, Fixed, 95% CI) | ‐0.27 [‐1.19, 0.65] |
| 12.3 FBG target < 4.44 vs < 5.55 mmol/L: third trimester | 1 | 137 | Mean Difference (IV, Fixed, 95% CI) | ‐0.34 [‐1.40, 0.72] |
| 13 Glycaemic control ‐ Mean postprandial glucose (mmol/L) Show forest plot | 1 | Mean Difference (IV, Fixed, 95% CI) | Subtotals only | |
| 13.1 FBG target < 4.44 vs < 5.55 mmol/L: first trimester | 1 | 137 | Mean Difference (IV, Fixed, 95% CI) | ‐0.94 [‐2.05, 0.17] |
| 13.2 FBG target < 4.44 vs < 5.55 mmol/L: second trimester | 1 | 137 | Mean Difference (IV, Fixed, 95% CI) | ‐0.56 [‐1.38, 0.26] |
| 13.3 FBG target < 4.44 vs < 5.55 mmol/L: third trimester | 1 | 137 | Mean Difference (IV, Fixed, 95% CI) | ‐0.11 [‐1.26, 1.04] |
| 14 Glycaemic control ‐ Below FBG threshold (% days) Show forest plot | 1 | Mean Difference (IV, Fixed, 95% CI) | Subtotals only | |
| 14.1 < 3.33 mmol/L | 1 | 22 | Mean Difference (IV, Fixed, 95% CI) | 20.0 [7.00, 33.00] |
| 14.2 < 2.78 mmol/L | 1 | 22 | Mean Difference (IV, Fixed, 95% CI) | 17.0 [4.04, 29.96] |
| 14.3 < 2.22 mmol/L | 1 | 22 | Mean Difference (IV, Fixed, 95% CI) | 8.0 [‐3.56, 19.56] |
| 15 Hypoglycaemic episodes ‐ > 1 subjective (% of days): not prespecified Show forest plot | 1 | 22 | Mean Difference (IV, Fixed, 95% CI) | 22.0 [11.07, 32.93] |
| 15.1 FBG target 3.33 to 5.0 vs 5.27 to 6.38 mmol/L | 1 | 22 | Mean Difference (IV, Fixed, 95% CI) | 22.0 [11.07, 32.93] |
| 16 Gestational weight gain (kg/week) Show forest plot | 1 | 22 | Mean Difference (IV, Fixed, 95% CI) | 0.02 [‐0.23, 0.27] |
| 16.1 FBG target 3.3 to 5.0 vs 5.27 to 6.38 mmol/L | 1 | 22 | Mean Difference (IV, Fixed, 95% CI) | 0.02 [‐0.23, 0.27] |
| 17 Fetal distress: not prespecified Show forest plot | 1 | 137 | Risk Ratio (M‐H, Fixed, 95% CI) | 1.15 [0.63, 2.11] |
| 17.1 FBG target < 4.44 vs < 5.55 mmol/L | 1 | 137 | Risk Ratio (M‐H, Fixed, 95% CI) | 1.15 [0.63, 2.11] |
| 18 Gestational age at birth (weeks) Show forest plot | 2 | 159 | Mean Difference (IV, Fixed, 95% CI) | 0.43 [‐0.23, 1.08] |
| 18.1 FBG target 3.33 to 5.0 vs 5.27 to 6.38 mmol/L | 1 | 22 | Mean Difference (IV, Fixed, 95% CI) | ‐0.30 [‐2.44, 1.84] |
| 18.2 FBG target < 4.44 vs < 5.55 mmol/L | 1 | 137 | Mean Difference (IV, Fixed, 95% CI) | 0.5 [‐0.19, 1.19] |
| 19 Birthweight (g) Show forest plot | 2 | 159 | Mean Difference (IV, Fixed, 95% CI) | ‐2.62 [‐179.83, 174.59] |
| 19.1 FBG target 3.33 to 5.0 vs 5.27 to 6.38 mmol/L | 1 | 22 | Mean Difference (IV, Fixed, 95% CI) | ‐272.0 [‐803.99, 259.99] |
| 19.2 FBG target < 4.44 vs < 5.55 mmol/L | 1 | 137 | Mean Difference (IV, Fixed, 95% CI) | 31.0 [‐156.95, 218.95] |
| 20 Apgar score Show forest plot | 1 | Risk Ratio (M‐H, Fixed, 95% CI) | Subtotals only | |
| 20.1 < 7 at 1 minute: FBG target < 4.44 vs < 5.55 mmol/L | 1 | 137 | Risk Ratio (M‐H, Fixed, 95% CI) | 1.01 [0.40, 2.55] |
| 20.2 < 7 at 5 minutes: FBG target < 4.44 vs < 5.55 mmol/L | 1 | 137 | Risk Ratio (M‐H, Fixed, 95% CI) | 0.0 [0.0, 0.0] |
| 21 Asphyxia: not prespecified Show forest plot | 1 | 137 | Risk Ratio (M‐H, Fixed, 95% CI) | 1.01 [0.58, 1.78] |
| 21.1 FBG target < 4.44 vs < 5.55 mmol/L | 1 | 137 | Risk Ratio (M‐H, Fixed, 95% CI) | 1.01 [0.58, 1.78] |
| 22 Neonatal hypocalcaemia Show forest plot | 1 | 137 | Risk Ratio (M‐H, Fixed, 95% CI) | 0.55 [0.30, 1.03] |
| 22.1 FBG target < 4.44 vs < 5.55 mmol/L | 1 | 137 | Risk Ratio (M‐H, Fixed, 95% CI) | 0.55 [0.30, 1.03] |
| 23 Neonatal hypomagnesaemia: not prespecified Show forest plot | 1 | 127 | Risk Ratio (M‐H, Fixed, 95% CI) | 0.65 [0.25, 1.68] |
| 23.1 FBG target < 4.44 vs < 5.55 mmol/L | 1 | 127 | Risk Ratio (M‐H, Fixed, 95% CI) | 0.65 [0.25, 1.68] |
| 24 Maternal hospitalisation (days) Show forest plot | 1 | 137 | Mean Difference (IV, Fixed, 95% CI) | 10.60 [9.53, 11.67] |
| 24.1 FBG target < 4.44 vs < 5.55 mmol/L | 1 | 137 | Mean Difference (IV, Fixed, 95% CI) | 10.60 [9.53, 11.67] |
| Outcome or subgroup title | No. of studies | No. of participants | Statistical method | Effect size |
| 1 Pre‐eclampsia Show forest plot | 1 | 45 | Risk Ratio (M‐H, Fixed, 95% CI) | 5.29 [0.23, 122.91] |
| 1.1 FBG target ≤ 5.6 mmol/L vs 5.6 to 6.7 mmol/L | 1 | 45 | Risk Ratio (M‐H, Fixed, 95% CI) | 5.29 [0.23, 122.91] |
| 2 Caesarean section Show forest plot | 1 | 45 | Risk Ratio (M‐H, Fixed, 95% CI) | 1.21 [0.22, 6.50] |
| 2.1 FBG target ≤ 5.6 vs 5.6 to 6.7 mmol/L | 1 | 45 | Risk Ratio (M‐H, Fixed, 95% CI) | 1.21 [0.22, 6.50] |
| 3 Perinatal mortality Show forest plot | 1 | 45 | Risk Ratio (M‐H, Fixed, 95% CI) | 0.0 [0.0, 0.0] |
| 3.1 FBG target ≤ 5.6 vs 5.6 to 6.7 mmol/L | 1 | 45 | Risk Ratio (M‐H, Fixed, 95% CI) | 0.0 [0.0, 0.0] |
| 4 Transient maternal hypertension Show forest plot | 1 | 45 | Risk Ratio (M‐H, Fixed, 95% CI) | 0.59 [0.03, 13.66] |
| 4.1 FBG target ≤ 5.6 vs 5.6 to 6.7 mmol/L | 1 | 45 | Risk Ratio (M‐H, Fixed, 95% CI) | 0.59 [0.03, 13.66] |
| 5 Hypoglycaemic epispodes ‐ first half of pregnancy: not prespecified Show forest plot | 1 | 45 | Risk Ratio (M‐H, Fixed, 95% CI) | 26.47 [1.61, 435.38] |
| 5.1 FBG target ≤ 5.6 vs 5.6 to 6.7 mmol/L | 1 | 45 | Risk Ratio (M‐H, Fixed, 95% CI) | 26.47 [1.61, 435.38] |
| 6 Large‐for‐gestational age (birthweight > 90th centile) Show forest plot | 1 | 45 | Risk Ratio (M‐H, Fixed, 95% CI) | 0.0 [0.0, 0.0] |
| 6.1 FBG target ≤ 5.6 vs 5.6 to 6.7 mmol/L | 1 | 45 | Risk Ratio (M‐H, Fixed, 95% CI) | 0.0 [0.0, 0.0] |
| 7 Respiratory distress syndrome Show forest plot | 1 | 45 | Risk Ratio (M‐H, Fixed, 95% CI) | 0.91 [0.09, 9.24] |
| 7.1 FBG target ≤ 5.6 v 5.6 to 6.7 mmol/L | 1 | 45 | Risk Ratio (M‐H, Fixed, 95% CI) | 0.91 [0.09, 9.24] |
| Outcome or subgroup title | No. of studies | No. of participants | Statistical method | Effect size |
| 1 Pre‐eclampsia Show forest plot | 1 | 60 | Risk Ratio (M‐H, Fixed, 95% CI) | 0.11 [0.01, 0.99] |
| 1.1 FBG ≤ 6.7 mmol/L vs 6.7 to 8.9 mmol/L | 1 | 60 | Risk Ratio (M‐H, Fixed, 95% CI) | 0.11 [0.01, 0.99] |
| 2 Caesarean section Show forest plot | 1 | 60 | Risk Ratio (M‐H, Fixed, 95% CI) | 0.28 [0.10, 0.78] |
| 2.1 FBG target ≤ 6.7 vs 6.7 to 8.9 mmol/L | 1 | 60 | Risk Ratio (M‐H, Fixed, 95% CI) | 0.28 [0.10, 0.78] |
| 3 Perinatal mortality Show forest plot | 1 | 60 | Risk Ratio (M‐H, Fixed, 95% CI) | 0.07 [0.00, 1.37] |
| 3.1 FBG target ≤ 6.7 vs 6.7 to 8.9 mmol/L | 1 | 60 | Risk Ratio (M‐H, Fixed, 95% CI) | 0.07 [0.00, 1.37] |
| 4 Transient maternal hypertension Show forest plot | 1 | 45 | Risk Ratio (M‐H, Fixed, 95% CI) | 1.81 [0.12, 27.07] |
| 4.1 FBG target ≤ 6.7 vs 6.7 to 8.9 mmol/L | 1 | 45 | Risk Ratio (M‐H, Fixed, 95% CI) | 1.81 [0.12, 27.07] |
| 5 Hypoglycaemic episodes ‐ in first half of pregnancy: not prespecified Show forest plot | 1 | 60 | Risk Ratio (M‐H, Fixed, 95% CI) | 5.22 [0.32, 86.28] |
| 5.1 FBG target ≤ 6.7 vs 6.7 to 8.9 mmol/L | 1 | 60 | Risk Ratio (M‐H, Fixed, 95% CI) | 5.22 [0.32, 86.28] |
| 6 Large‐for‐gestational age (birthweight > 90th centile) Show forest plot | 1 | 60 | Risk Ratio (M‐H, Fixed, 95% CI) | 0.01 [0.00, 0.20] |
| 6.1 FBG target ≤ 6.7 vs 6.7 to 8.9 mmol/L | 1 | 60 | Risk Ratio (M‐H, Fixed, 95% CI) | 0.01 [0.00, 0.20] |
| 7 Respiratory distress syndrome Show forest plot | 1 | 60 | Risk Ratio (M‐H, Fixed, 95% CI) | 0.17 [0.05, 0.59] |
| 7.1 FBG target ≤ 6.7 vs 6.7 to 8.9 mmol/L | 1 | 60 | Risk Ratio (M‐H, Fixed, 95% CI) | 0.17 [0.05, 0.59] |