| 1 Caesarean section Show forest plot | 1 | 22 | Risk Ratio (M‐H, Fixed, 95% CI) | 0.92 [0.49, 1.73] |
|
| 1.1 FBG target 3.33 to 5.0 vs 5.27 to 6.38 mmol/L | 1 | 22 | Risk Ratio (M‐H, Fixed, 95% CI) | 0.92 [0.49, 1.73] |
| 2 Perinatal mortality Show forest plot | 1 | 22 | Risk Ratio (M‐H, Fixed, 95% CI) | 0.0 [0.0, 0.0] |
|
| 2.1 FBG target 3.33 to 5.0 vs 5.27 to 6.38 mmol/L | 1 | 22 | Risk Ratio (M‐H, Fixed, 95% CI) | 0.0 [0.0, 0.0] |
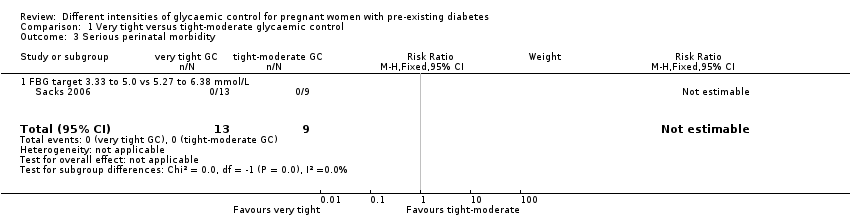
| 3 Serious perinatal morbidity Show forest plot | 1 | 22 | Risk Ratio (M‐H, Fixed, 95% CI) | 0.0 [0.0, 0.0] |
|
| 3.1 FBG target 3.33 to 5.0 vs 5.27 to 6.38 mmol/L | 1 | 22 | Risk Ratio (M‐H, Fixed, 95% CI) | 0.0 [0.0, 0.0] |
| 4 Congenital fetal anomaly Show forest plot | 1 | 22 | Risk Ratio (M‐H, Fixed, 95% CI) | 3.57 [0.19, 66.61] |
|
| 4.1 FBG target 3.33 to 5.0 vs 5.27 to 6.38 mmol/L | 1 | 22 | Risk Ratio (M‐H, Fixed, 95% CI) | 3.57 [0.19, 66.61] |
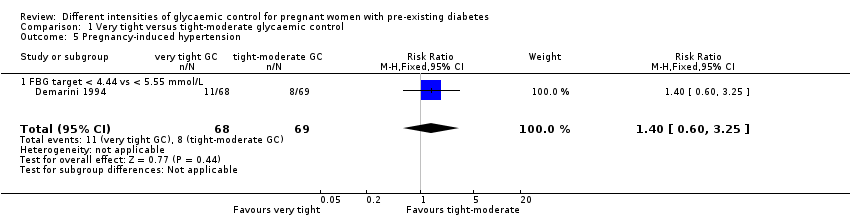
| 5 Pregnancy‐induced hypertension Show forest plot | 1 | 137 | Risk Ratio (M‐H, Fixed, 95% CI) | 1.40 [0.60, 3.25] |
|
| 5.1 FBG target < 4.44 vs < 5.55 mmol/L | 1 | 137 | Risk Ratio (M‐H, Fixed, 95% CI) | 1.40 [0.60, 3.25] |
| 6 Chronic hypertension: not prespecified Show forest plot | 1 | 22 | Risk Ratio (M‐H, Fixed, 95% CI) | 0.0 [0.0, 0.0] |
|
| 6.1 FBG target 3.33 to 5.0 mmol/L vs 5.27 to 6.38 mmol/L | 1 | 22 | Risk Ratio (M‐H, Fixed, 95% CI) | 0.0 [0.0, 0.0] |
| 7 Glycaemic control ‐ Self‐monitored blood glucose (mean, mmol/L) Show forest plot | 1 | | Mean Difference (IV, Fixed, 95% CI) | Subtotals only |
|
| 7.1 FBG target 3.33 to 5.0 vs 5.27 to 6.38 mmol/L: first trimester | 1 | 22 | Mean Difference (IV, Fixed, 95% CI) | ‐1.23 [‐2.19, ‐0.27] |
| 7.2 FBG target 3.33 to 5.0 vs 5.27 to 6.38 mmol/L: second trimester | 1 | 22 | Mean Difference (IV, Fixed, 95% CI) | ‐0.99 [‐1.64, ‐0.34] |
| 7.3 FBG target 3.33 to 5.0 vs 5.27 to 6.38 mmol/L: third trimester | 1 | 22 | Mean Difference (IV, Fixed, 95% CI) | ‐0.66 [‐1.60, 0.28] |
| 8 Glycaemic control ‐ Self‐monitored blood glucose tests/day Show forest plot | 1 | 22 | Mean Difference (IV, Fixed, 95% CI) | 1.60 [‐0.15, 3.35] |
|
| 8.1 FBG target 3.33 to 5.0 vs 5.27 to 6.39 mmol/L | 1 | 22 | Mean Difference (IV, Fixed, 95% CI) | 1.60 [‐0.15, 3.35] |
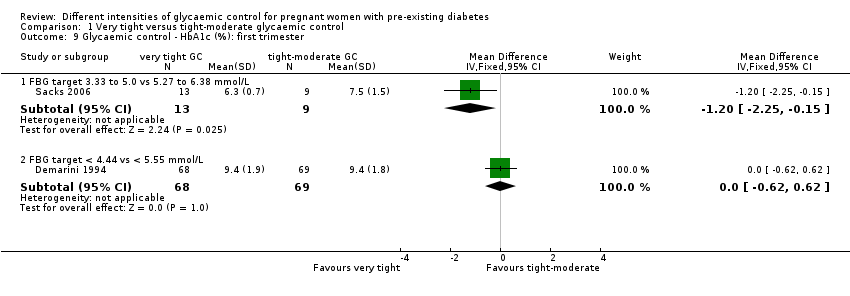
| 9 Glycaemic control ‐ HbA1c (%): first trimester Show forest plot | 2 | | Mean Difference (IV, Fixed, 95% CI) | Subtotals only |
|
| 9.1 FBG target 3.33 to 5.0 vs 5.27 to 6.38 mmol/L | 1 | 22 | Mean Difference (IV, Fixed, 95% CI) | ‐1.20 [‐2.25, ‐0.15] |
| 9.2 FBG target < 4.44 vs < 5.55 mmol/L | 1 | 137 | Mean Difference (IV, Fixed, 95% CI) | 0.0 [‐0.62, 0.62] |
| 10 Glycaemic control ‐ HbA1c (%): second trimester Show forest plot | 2 | | Mean Difference (IV, Fixed, 95% CI) | Subtotals only |
|
| 10.1 FBG target 3.33 to 5.0 vs 5.27 to 6.38 mmol/L | 1 | 22 | Mean Difference (IV, Fixed, 95% CI) | ‐0.5 [‐1.09, 0.09] |
| 10.2 FBG target < 4.44 vs < 5.55 mmol/L | 1 | 137 | Mean Difference (IV, Fixed, 95% CI) | 0.10 [‐0.37, 0.57] |
| 11 Glycaemic control ‐ HbA1c (%): third trimester Show forest plot | 2 | | Mean Difference (IV, Fixed, 95% CI) | Subtotals only |
|
| 11.1 FBG target 3.33 to 5.0 vs 5.27 to 6.38 mmol/L | 1 | 22 | Mean Difference (IV, Fixed, 95% CI) | ‐0.30 [‐0.92, 0.32] |
| 11.2 FBG target < 4.44 vs < 5.55 mmol/L | 1 | 137 | Mean Difference (IV, Fixed, 95% CI) | ‐0.10 [‐0.49, 0.29] |
| 12 Glycaemic control ‐ Mean preprandial glucose (mmol/L) Show forest plot | 1 | | Mean Difference (IV, Fixed, 95% CI) | Subtotals only |
|
| 12.1 FBG target < 4.44 vs < 5.55 mmol/L: first trimester | 1 | 137 | Mean Difference (IV, Fixed, 95% CI) | ‐0.39 [‐1.33, 0.55] |
| 12.2 FBG target < 4.44 vs < 5.55 mmol/L: second trimester | 1 | 137 | Mean Difference (IV, Fixed, 95% CI) | ‐0.27 [‐1.19, 0.65] |
| 12.3 FBG target < 4.44 vs < 5.55 mmol/L: third trimester | 1 | 137 | Mean Difference (IV, Fixed, 95% CI) | ‐0.34 [‐1.40, 0.72] |
| 13 Glycaemic control ‐ Mean postprandial glucose (mmol/L) Show forest plot | 1 | | Mean Difference (IV, Fixed, 95% CI) | Subtotals only |
|
| 13.1 FBG target < 4.44 vs < 5.55 mmol/L: first trimester | 1 | 137 | Mean Difference (IV, Fixed, 95% CI) | ‐0.94 [‐2.05, 0.17] |
| 13.2 FBG target < 4.44 vs < 5.55 mmol/L: second trimester | 1 | 137 | Mean Difference (IV, Fixed, 95% CI) | ‐0.56 [‐1.38, 0.26] |
| 13.3 FBG target < 4.44 vs < 5.55 mmol/L: third trimester | 1 | 137 | Mean Difference (IV, Fixed, 95% CI) | ‐0.11 [‐1.26, 1.04] |
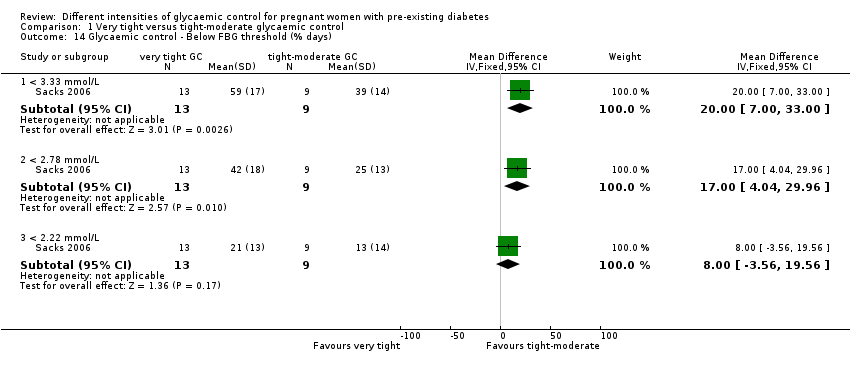
| 14 Glycaemic control ‐ Below FBG threshold (% days) Show forest plot | 1 | | Mean Difference (IV, Fixed, 95% CI) | Subtotals only |
|
| 14.1 < 3.33 mmol/L | 1 | 22 | Mean Difference (IV, Fixed, 95% CI) | 20.0 [7.00, 33.00] |
| 14.2 < 2.78 mmol/L | 1 | 22 | Mean Difference (IV, Fixed, 95% CI) | 17.0 [4.04, 29.96] |
| 14.3 < 2.22 mmol/L | 1 | 22 | Mean Difference (IV, Fixed, 95% CI) | 8.0 [‐3.56, 19.56] |
| 15 Hypoglycaemic episodes ‐ > 1 subjective (% of days): not prespecified Show forest plot | 1 | 22 | Mean Difference (IV, Fixed, 95% CI) | 22.0 [11.07, 32.93] |
|
| 15.1 FBG target 3.33 to 5.0 vs 5.27 to 6.38 mmol/L | 1 | 22 | Mean Difference (IV, Fixed, 95% CI) | 22.0 [11.07, 32.93] |
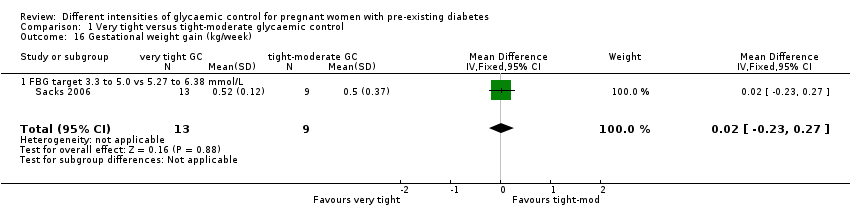
| 16 Gestational weight gain (kg/week) Show forest plot | 1 | 22 | Mean Difference (IV, Fixed, 95% CI) | 0.02 [‐0.23, 0.27] |
|
| 16.1 FBG target 3.3 to 5.0 vs 5.27 to 6.38 mmol/L | 1 | 22 | Mean Difference (IV, Fixed, 95% CI) | 0.02 [‐0.23, 0.27] |
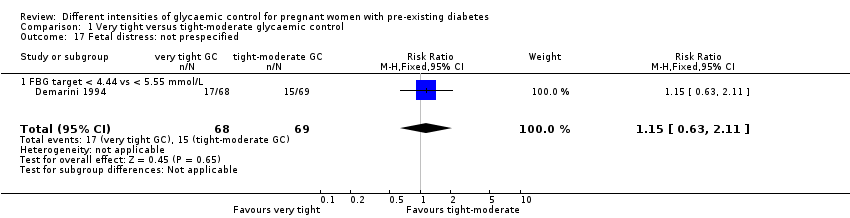
| 17 Fetal distress: not prespecified Show forest plot | 1 | 137 | Risk Ratio (M‐H, Fixed, 95% CI) | 1.15 [0.63, 2.11] |
|
| 17.1 FBG target < 4.44 vs < 5.55 mmol/L | 1 | 137 | Risk Ratio (M‐H, Fixed, 95% CI) | 1.15 [0.63, 2.11] |
| 18 Gestational age at birth (weeks) Show forest plot | 2 | 159 | Mean Difference (IV, Fixed, 95% CI) | 0.43 [‐0.23, 1.08] |
|
| 18.1 FBG target 3.33 to 5.0 vs 5.27 to 6.38 mmol/L | 1 | 22 | Mean Difference (IV, Fixed, 95% CI) | ‐0.30 [‐2.44, 1.84] |
| 18.2 FBG target < 4.44 vs < 5.55 mmol/L | 1 | 137 | Mean Difference (IV, Fixed, 95% CI) | 0.5 [‐0.19, 1.19] |
| 19 Birthweight (g) Show forest plot | 2 | 159 | Mean Difference (IV, Fixed, 95% CI) | ‐2.62 [‐179.83, 174.59] |
|
| 19.1 FBG target 3.33 to 5.0 vs 5.27 to 6.38 mmol/L | 1 | 22 | Mean Difference (IV, Fixed, 95% CI) | ‐272.0 [‐803.99, 259.99] |
| 19.2 FBG target < 4.44 vs < 5.55 mmol/L | 1 | 137 | Mean Difference (IV, Fixed, 95% CI) | 31.0 [‐156.95, 218.95] |
| 20 Apgar score Show forest plot | 1 | | Risk Ratio (M‐H, Fixed, 95% CI) | Subtotals only |
|
| 20.1 < 7 at 1 minute: FBG target < 4.44 vs < 5.55 mmol/L | 1 | 137 | Risk Ratio (M‐H, Fixed, 95% CI) | 1.01 [0.40, 2.55] |
| 20.2 < 7 at 5 minutes: FBG target < 4.44 vs < 5.55 mmol/L | 1 | 137 | Risk Ratio (M‐H, Fixed, 95% CI) | 0.0 [0.0, 0.0] |
| 21 Asphyxia: not prespecified Show forest plot | 1 | 137 | Risk Ratio (M‐H, Fixed, 95% CI) | 1.01 [0.58, 1.78] |
|
| 21.1 FBG target < 4.44 vs < 5.55 mmol/L | 1 | 137 | Risk Ratio (M‐H, Fixed, 95% CI) | 1.01 [0.58, 1.78] |
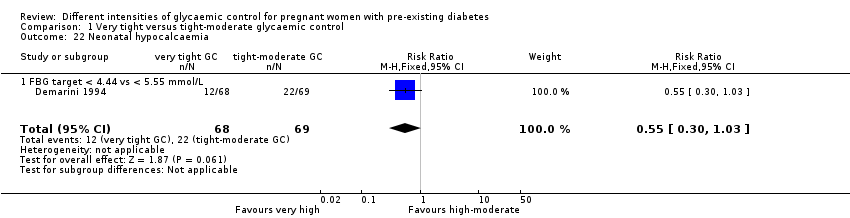
| 22 Neonatal hypocalcaemia Show forest plot | 1 | 137 | Risk Ratio (M‐H, Fixed, 95% CI) | 0.55 [0.30, 1.03] |
|
| 22.1 FBG target < 4.44 vs < 5.55 mmol/L | 1 | 137 | Risk Ratio (M‐H, Fixed, 95% CI) | 0.55 [0.30, 1.03] |
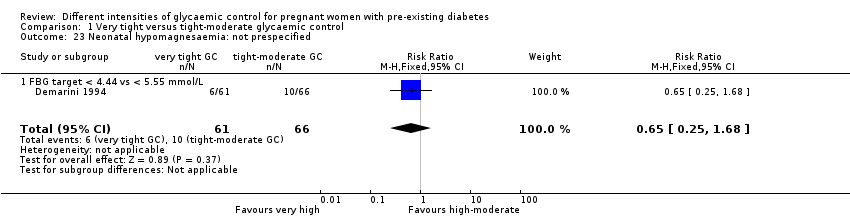
| 23 Neonatal hypomagnesaemia: not prespecified Show forest plot | 1 | 127 | Risk Ratio (M‐H, Fixed, 95% CI) | 0.65 [0.25, 1.68] |
|
| 23.1 FBG target < 4.44 vs < 5.55 mmol/L | 1 | 127 | Risk Ratio (M‐H, Fixed, 95% CI) | 0.65 [0.25, 1.68] |
| 24 Maternal hospitalisation (days) Show forest plot | 1 | 137 | Mean Difference (IV, Fixed, 95% CI) | 10.60 [9.53, 11.67] |
|
| 24.1 FBG target < 4.44 vs < 5.55 mmol/L | 1 | 137 | Mean Difference (IV, Fixed, 95% CI) | 10.60 [9.53, 11.67] |