Diferentes intensidades para el control de la glucemia en embarazadas con diabetes preexistente
Resumen
Antecedentes
No queda claro cuál es el control óptimo de la glucemia en embarazadas con diabetes preexistente, aunque hay una relación evidente entre las concentraciones de glucosa elevadas y los resultados adversos durante el parto.
Objetivos
Evaluar los efectos de las diferentes intensidades de control de la glucemia en embarazadas con diabetes tipo 1 o tipo 2 preexistente.
Métodos de búsqueda
Se hicieron búsquedas en el registro de ensayos del Grupo Cochrane de Embarazo y Parto (Cochrane Pregnancy and Childbirth Group) (31 de enero 2016) y en las listas de referencias de los estudios recuperados.
Criterios de selección
Se incluyeron los ensayos controlados aleatorizados que compararon diferentes objetivos de control de la glucemia en embarazadas con diabetes preexistente.
Obtención y análisis de los datos
Dos autores de la revisión de forma independiente evaluaron los ensayos para inclusión, realizaron la extracción de datos, evaluaron el riesgo de sesgo y verificaron la exactitud. La calidad de la evidencia se evaluó mediante los criterios GRADE.
Resultados principales
Se incluyeron tres ensayos, todos en mujeres con diabetes tipo 1 (223 mujeres y recién nacidos). Los tres ensayos tuvieron alto riesgo de sesgo debido a la falta de cegamiento, a los métodos poco claros de asignación al azar y al informe selectivo de los resultados. Dos ensayos compararon objetivos de control glucémico muy estrictos (3,33 a 5,0 mmol/l de glucosa en sangre en ayunas [GSA]) con objetivos de control glucémico estrictos‐moderados (4,45 a 6,38 mmol/l), y un ensayo de 22 recién nacidos no informó muertes perinatales nimorbilidad perinatal grave (la calidad de la evidencia se calificó baja para ambos resultados). En el mismo ensayo, hubo dos anomalías congénitas en el grupo de muy estrecho y ninguna en el grupo de estrecho‐moderado, sin diferencias significativas en la cesárea entre los grupos (riesgo relativo [RR] 0,92; intervalo de confianza [IC] del 95%: 0,49 a 1,73; la calidad de la evidencia se calificó como muy baja). En ambos ensayos, el control de la glucemia no varió significativamente entre los grupos muy estricto y estricto‐moderado hacia el tercer trimestre, aunque un ensayo con 22 pacientes encontró un número significativamente inferior de hipoglucemia materna en el grupo estricto‐moderado.
En un ensayo de 60 mujeres y recién nacidos que comparó objetivos de control glucémico estrictos (≤ 5,6 mmol/l GSA); moderados (5,6 a 6,7 mmol/l); y poco estrictos (6,7 a 8,9 mmol/l), hubo dos muertes neonatales en los grupos de poco estrictos y ninguna en los grupos de estrictos o moderados (la calidad de la evidencia se calificó muy baja). Hubo significativamente menos mujeres con preeclampsia (la calidad de la evidencia se calificó como baja ), menos cesáreas ( la calidad de la evidencia se calificó como baja) y menos recién nacidos con un peso al nacer superior al percentil 90 (la calidad de la evidencia se calificó como baja) en el grupo combinado estricto‐moderado en comparación con el grupo poco estricto.
La calidad de la evidencia se calificó como baja o muy baja para los resultados importantes debido a las limitaciones de diseño de los estudios, al pequeño número de mujeres incluidas y a los amplios intervalos de confianza que cruzan la línea de falta de ningún efecto. Muchos de los resultados importantes no se informaron en estos estudios.
Conclusiones de los autores
En un conjunto de evidencia muy limitado, se observaron escasas diferencias en los resultados entre los objetivos de control de la glucemia muy estrictos y estricto‐moderado en embarazadas con diabetes tipo 1 preexistente, incluido el control de la glucemia realmente alcanzado. Existe evidencia de lesiones (aumento de la preeclampsia, cesáreas y peso al nacer superior al percentil 90) con el control "poco estricto" (GSA superior a 7 mmol/l). Tal vez sea más factible realizar en el futuro ensayos en los que se comparen intervenciones, en lugar de objetivos de control de la glucemia. Se requieren ensayos en embarazadas con diabetes tipo 2 preexistente.
PICO
Resumen en términos sencillos
¿Cuál es el mejor objetivo de glucosa en sangre para las embarazadas que tienen diabetes de tipo 1 o tipo 2 antes de quedar embarazadas?
¿Cuál es el problema?
Las embarazadas con diabetes necesitan mantener estables sus niveles de glucosa en sangre mediante la dieta, el ejercicio, la insulina u otros medicamentos, las visitas a la clínica y la monitorización. Esta revisión examinó el mejor objetivo de glucemia para las embarazadas con diabetes.
¿Por qué es esto importante?
Las mujeres que tienen diabetes tipo 1 o tipo 2 antes de quedar embarazadas tienen un mayor riesgo de perder el embarazo, de tener recién nacidos grandes y de que éstos mueran. El hecho de que una embarazada tenga un alto nivel de glucosa en la sangre y resistencia a la insulina, puede afectar el desarrollo del corazón y otros órganos del recién nacido. Los recién nacidos de madres diabéticas también pueden tener un mayor riesgo de desarrollar obesidad y diabetes tipo 2.
Controlar el nivel de glucosa en la sangre de una mujer embarazada con diabetes y mantenerse dentro de un rango objetivo puede ayudar a reducir estos riesgos. Se deseaba conocer cuál es el mejor objetivo de glucosa en sangre para las embarazadas que tenían diabetes tipo 1 o tipo 2 antes de quedar embarazadas.
¿Qué evidencia se encontró?
Se encontraron tres ensayos pequeños (223 embarazadas con diabetes tipo 1) que analizaron diferentes objetivos de glucosa en sangre: muy estrictos, estrictos, moderados y poco estrictos. La calidad de los estudios y, por lo tanto, la fuerza de la evidencia, fue muy baja o escasa, por lo que es posible que los estudios de investigación futuros cambien los resultados.
Hubo muy pocas diferencias entre los objetivos de glucosa en sangre muy estrictos y los objetivos de glucosa en sangre estrictos‐moderados en dos ensayos, aunque hubo más casos de glucosa en sangre baja (hipoglucemia) y estancias hospitalarias más prolongadas para las mujeres que tuvieron un control muy estricto de la glucosa en sangre.
Un solo ensayo comparó los objetivos de glucosa en sangre estrictos, moderados y poco estrictos. En el grupo de objetivo poco estricto más mujeres tuvieron preeclampsia y hubo más cesáreas y recién nacidos grandes. Hubo pocas diferencias entre los grupos estricto y moderado, aunque más mujeres en el grupo de control estricto tuvieron glucosa baja en la sangre en la primera mitad del embarazo.
¿Qué significa esto?
La evidencia no muestra mucha diferencia entre los objetivos de glucosa en sangre moderados, estrictos y muy estrictos, aunque un objetivo de glucosa en sangre poco estricto puede ser peor para las madres y los recién nacidos. Sin embargo, los estudios fueron pequeños y la evidencia es débil, por lo que todavía no se conoce cuál es el mejor objetivo de glucosa en sangre para las mujeres que tienen diabetes antes de quedar embarazadas.
Authors' conclusions
Summary of findings
| Very tight versus tight‐moderate glycaemic control (FBG target 3.33 to 5.0 versus 5.27 to 6.38 mmol/L) | ||||||
| Patient or population: pregnant women with pre‐existing type 1 diabetes | ||||||
| Outcomes | Anticipated absolute effects* (95% CI) | Relative effect | No. of participants | Quality of the evidence | Comments | |
| Risk with tight‐moderate glycaemic control | Risk with very tight glycaemic control | |||||
| Pre‐eclampsia | not reported | |||||
| Caesarean section | Study population | RR 0.92 | 22 | ⊕⊝⊝⊝ | FBG target 3.3 to 5.0 versus 5.27 to 6.38 mmol/L | |
| 667 per 1000 | 613 per 1000 | |||||
| Perineal trauma | not reported | |||||
| Gestational weight gain | The mean difference in gestational weight gain (kg/week) was 0 | The mean difference in gestational weight gain (kg/week) was 0.02 kg/week more (0.23 fewer to 0.27 more) | 22 | ⊕⊝⊝⊝ | FBG target 3.3 to 5.0 versus 5.27 to 6.38 mmol/L | |
| Postnatal depression | not reported | |||||
| Induction of labour | not reported | |||||
| Later development of cardiovascular disease | not reported | |||||
| *The risk in the intervention group (and its 95% confidence interval) is based on the assumed risk in the comparison group and the relative effect of the intervention (and its 95% CI). | ||||||
| GRADE Working Group grades of evidence | ||||||
| 1 One study with design limitations. 2 Wide confidence interval crossing the line of no effect, and small sample size. | ||||||
| Very tight versus tight‐moderate glycaemic control (FBG target 3.33 to 5.0 versus 5.27 to 6.38 mmol/L or FBG target < 4.44 versus < 5.55 mmol/L) | ||||||
| Patient or population: pregnant women with pre‐existing type 1 diabetes | ||||||
| Outcomes | Anticipated absolute effects* (95% CI) | Relative effect | No. of participants | Quality of the evidence | Comments | |
| Risk with tight‐moderate glycaemic control | Risk with very tight glycaemic control | |||||
| Large‐for‐gestational age | not reported | |||||
| Perinatal mortality | Study population | not estimable | 22 | ⊕⊕⊝⊝ | FBG target 3.33 to 5.0 versus 5.27 to 6.38 mmol/L | |
| 0 per 1000 | 0 per 1000 | |||||
| Serious perinatal morbidity | Study population | not estimable | 22 | ⊕⊕⊝⊝ | FBG target 3.33 to 5.0 versus 5.27 to 6.38 mmol/L | |
| 0 per 1000 | 0 per 1000 | |||||
| Neonatal hypoglycaemia | not reported | |||||
| Childhood/adulthood adiposity | not reported | |||||
| Childhood/adulthood diabetes | not reported | |||||
| Childhood/adulthood neurosensory disability | not reported | |||||
| *The risk in the intervention group (and its 95% confidence interval) is based on the assumed risk in the comparison group and the relative effect of the intervention (and its 95% CI). | ||||||
| GRADE Working Group grades of evidence | ||||||
| 1 One study with design limitations. 2 Small sample size, no events. | ||||||
| Tight versus moderate glycaemic control (FBG target ≤ 5.6 mmol/L versus 5.6 to 6.7 mmol/L) ‐ Maternal outcomes | ||||||
| Patient or population: pregnant women with pre‐existing type 1 diabetes | ||||||
| Outcomes | Anticipated absolute effects* (95% CI) | Relative effect | No. of participants | Quality of the evidence | Comments | |
| Risk with moderate glycaemic control | Risk with tight glycaemic control | |||||
| Pre‐eclampsia | Study population | RR 5.29 | 45 | ⊕⊝⊝⊝ | FBG target ≤ 5.6 versus 5.6 to 6.7 mmol/L Moderate: 0 out of 29 women, Tight: 1 out of 16 women. | |
| not estimable | not estimable | |||||
| Caesarean section | Study population | RR 1.21 | 45 | ⊕⊝⊝⊝ | FBG target ≤ 5.6 versus 5.6 to 6.7 mmol/L | |
| 103 per 1000 | 125 per 1000 | |||||
| Perineal trauma | not reported | |||||
| Gestational weight gain | not reported | |||||
| Postnatal depression | not reported | |||||
| Induction of labour | not reported | |||||
| Later development of cardiovascular disease | not reported | |||||
| 1 One study with design limitations. 2 Wide confidence interval crossing the line of no effect, few events and small sample size. | ||||||
| Tight versus moderate glycaemic control (FBG target ≤ 5.6 mmol/L versus 5.6 to 6.7 mmol/L) ‐ Infant outcomes | ||||||
| Patient or population: pregnant women with pre‐existing type 1 diabetes | ||||||
| Outcomes | Anticipated absolute effects* (95% CI) | Relative effect | No. of participants | Quality of the evidence | Comments | |
| Risk with moderate glycaemic control | Risk with tight glycaemic control | |||||
| Large‐for‐gestational age (birthweight > 90th centile) | Study population | not estimable | 45 | ⊕⊝⊝⊝ | FBG target ≤ 5.6 versus 5.6 to 6.7 mmol/L | |
| 0 per 1000 | 0 per 1000 | |||||
| Perinatal mortality | Study population | not estimable | 45 | ⊕⊝⊝⊝ | FBG target ≤ 5.6 versus 5.6 to 6.7 mmol/L | |
| 0 per 1000 | 0 per 1000 | |||||
| Serious perinatal morbidity | not reported | |||||
| Neonatal hypoglycaemia | not reported | |||||
| Childhood/adulthood adiposity | not reported | |||||
| Childhood/adulthood diabetes | not reported | |||||
| Childhood/adulthood neurosensory disability | not reported | |||||
| *The risk in the intervention group (and its 95% confidence interval) is based on the assumed risk in the comparison group and the relative effect of the intervention (and its 95% CI). | ||||||
| GRADE Working Group grades of evidence | ||||||
| 1 One study with design limitations. 2 No events & small sample size. | ||||||
| Tight‐moderate versus loose glycaemic control (FBG ≤ 6.7 mmol/L versus 6.7 to 8.9 mmol/L) ‐ Maternal outcomes | ||||||
| Patient or population: pregnant women with pre‐existing type 1 diabetes | ||||||
| Outcomes | Anticipated absolute effects* (95% CI) | Relative effect | No. of participants | Quality of the evidence | Comments | |
| Risk with loose glycaemic control (mother) | Risk with Tight‐moderate | |||||
| Pre‐eclampsia | Study population | RR 0.11 | 60 | ⊕⊕⊝⊝ | FBG target ≤ 6.7 mmol/L versus 6.7 to 8.9 mmol/L | |
| 200 per 1000 | 22 per 1000 | |||||
| Caesarean section | Study population | RR 0.28 | 60 | ⊕⊕⊝⊝ | FBG target ≤ 6.7 versus 6.7 to 8.9 mmol/L | |
| 400 per 1000 | 112 per 1000 | |||||
| Perineal trauma | not reported | |||||
| Gestational weight gain | not reported | |||||
| Postnatal depression | not reported | |||||
| Induction of labour | not reported | |||||
| Later development of cardiovascular disease | not reported | |||||
| *The risk in the intervention group (and its 95% confidence interval) is based on the assumed risk in the comparison group and the relative effect of the intervention (and its 95% CI). | ||||||
| GRADE Working Group grades of evidence | ||||||
| 1 One study with design limitations. 2 Few events and small sample size. 3 Small sample size. | ||||||
| Tight‐moderate versus loose glycaemic control (FBG ≤ 6.7 mmol/L versus 6.7 to 8.9 mmol/L) ‐ Infant outcomes | ||||||
| Patient or population: pregnant women with pre‐existing type 1 diabetes | ||||||
| Outcomes | Anticipated absolute effects* (95% CI) | Relative effect | No. of participants | Quality of the evidence | Comments | |
| Risk with loose glycaemic control | Risk with tight‐moderate glycaemic control | |||||
| Large‐for‐gestational age (birthweight > 90th centile) | Study population | RR 0.01 | 60 | ⊕⊕⊝⊝ | FBG target ≤ 6.7 versus 6.7 to 8.9 mmol/L | |
| 867 per 1000 | 9 per 1000 | |||||
| Perinatal mortality | Study population | RR 0.07 | 60 | ⊕⊝⊝⊝ | FBG target ≤ 6.7 versus 6.7 to 8.9 mmol/L | |
| 133 per 1000 | 9 per 1000 | |||||
| Serious perinatal morbidity | not reported | |||||
| Neonatal hypoglycaemia | not reported | |||||
| Childhood/adulthood adiposity | not reported | |||||
| Childhood/adulthood diabetes | not reported | |||||
| Childhood/adulthood neurosensory disability | not reported | |||||
| *The risk in the intervention group (and its 95% confidence interval) is based on the assumed risk in the comparison group and the relative effect of the intervention (and its 95% CI). | ||||||
| GRADE Working Group grades of evidence | ||||||
| 1 One study with design limitations. 2 Small sample size. 3 Wide confidence interval crossing the line of no effect, few events and small sample size. | ||||||
Background
Description of the condition
Diabetes and pregnancy
Type 1 diabetes usually occurs early in life with a sudden onset of insulin deficiency, thought to be a result of an autoimmune attack of the insulin producing pancreatic beta‐cells (Galerneau 2004; Griffith 2004). Type 2 diabetes mellitus tends to occur later in adulthood rather than in childhood and is characterised by tissue resistance to the action of insulin as well as abnormalities of insulin secretion, thereby increasing the levels of glucose in the blood (Dunne 2005). (Gestational diabetes is characterised by glucose intolerance that begins or is first detected during pregnancy and is not covered in this review.)
Recent figures from the USA indicate that up to 0.9% of pregnant women have pre‐existing diabetes (type 1 or type 2) (Correa 2015). Earlier figures from Albrecht 2010 note that the rate of pre‐existing type 2 diabetes in pregnant women in the USA more than quadrupled in the period from 1994 to 2004, overtaking the rates of pre‐existing type 1 diabetes (0.42% versus 0.33%). After a pregnancy with gestational diabetes, a 2% risk of progression to 'pre‐existing' diabetes (i.e. type 2 diabetes) in the next pregnancy has been seen (Khambalia 2013). The increase in type 2 diabetes in pregnant women has been partly attributed to increasing obesity and older mothers (ACOG 2005; Zhu 2016). Others have noted the striking association between type 2 diabetes and socio‐economic status (Correa 2015; Murphy 2009).
Pregnancies with pre‐existing diabetes are high risk, with increased risk of poorer fetal and neonatal outcomes, as well as the risk of poorer outcomes for the mother (Owens 2015). Women with type 1 diabetes have an elevated risk of pregnancy loss, perinatal mortality, fetal macrosomia (a fetus which is large‐for‐gestational age) and congenital malformations (NICE 2015; Platt 2002). This is also the case for women with pre‐existing type 2 diabetes (CEMACH 2007; Inkster 2006), although neonatal outcomes may be poorer when the mother has type 1 diabetes (Owens 2015). However, a systematic review found perinatal mortality to be higher for women with type 2 compared with type 1 diabetes ‐ odds ratio 1.50, 95% confidence interval 1.15 to 1.96 (Balsells 2009).
Metabolic disruptions resulting from a hyperglycaemic and insulin‐resistant fetal environment can affect organogenesis (development of organs) in early pregnancy. Cardiovascular malformations are the most common birth defects in infants born to diabetic mothers (Inkster 2006). Apart from macrosomia (high birthweight, often defined as greater than 4000 g), other adverse outcomes for infants may include large‐for‐gestational age, shoulder dystocia (difficulty in delivering shoulders of baby), neonatal hypoglycaemia (blood sugar which is lower than normal), preterm birth, hyperbilirubinaemia (excess bilirubin), hypocalcaemia (lower than normal calcium) and neonatal intensive care admission (Jensen 2004; Macintosh 2006; Ray 2001; Walkinshaw 2005; Weintrob 1996). Furthermore, long‐term follow‐up of infants of diabetic mothers suggests that exposure to maternal diabetes in utero increases the risk of obesity and type 2 diabetes for these children in the future (Dabelea 2000).
In pregnant women with type 1 (insulin‐dependent) diabetes, insulin is used to control fluctuations in blood glucose concentrations throughout the day (Galerneau 2004). In type 2 diabetes, lifestyle changes (including diet and exercise) are the first line of treatment, with the option of using oral hypoglycaemic agents or insulin to lower blood glucose if necessary. Management of diabetes in pregnancy therefore aims for control of glucose concentrations using careful combinations of diet, exercise and insulin or other anti‐diabetogenic drugs, if required (ACOG 2005; NICE 2015).
Description of the intervention
The intervention of interest in this review is treatment to achieve different glycaemic control targets (e.g. low or tight versus very low or very tight) rather than comparing different treatment strategies, the more usual intervention employed in diabetes trials (Home 2008). In other words, trials eligible for this review will have randomised women to intensive versus more intensive glycaemic targets, whereas comparisons of different treatments have glycaemic control as an outcome, not an intervention.
Glycaemic control
The goal of glycaemic control is to keep glucose concentrations as close to normal as possible by monitoring glycated haemoglobin (haemoglobin A1c (HbA1c)) which reflects glycaemic control over the preceding 60 to 90 days (Colman 1997); or by measuring blood glucose concentrations (e.g. fasting or postprandial concentrations, or from clinic or self‐monitoring measurements), or both.
Ideally, women with type 1 or type 2 diabetes would be aiming for normal glucose concentrations before embarking on a pregnancy, but this is frequently not the case since many pregnancies are unplanned. In addition, some women with type 2 diabetes may not be aware that they are diabetic until they are screened later in pregnancy.
Ways of achieving more intensive glycaemic control regimens might include more frequent hospital visits, more intensive insulin therapy, home‐based systems that involve setting specific targets, as well as higher level system changes such as regional standard setting, audit and feedback (Bell 2008).
Glycated haemoglobin (HbA1c)
Glycated haemoglobins are formed when glucose in the blood spontaneously reacts with the amino groups of the haemoglobin protein (Schneider 2007). HbA1c became firmly established as a critical diabetes control measure through the findings of the landmark Diabetes Control and Complications Trial which conclusively demonstrated that a sustained lowering of HbA1c was associated with significantly fewer microvascular complications, a marker of disease control (DCCT 1993; Schneider 2007).
For diabetic women of reproductive age, intensive periconceptional glycaemic control was subsequently shown to reduce the incidence of congenital anomalies and spontaneous abortions (DCCT 1996b; Ray 2001; Steel 1990; Willhoite 2007).
Some guidelines advise pregnant women with pre‐existing type 1 and type 2 diabetes to monitor their HbA1c concentrations levels every four to eight weeks, aiming to keep them within the normal range (ADIPS 2005). Although HbA1c is normally lower in pregnancy, most laboratories do not report a pregnancy‐specific reference range (ADIPS 2005). Generally 6% to 7% (42 mmol/mol to 53 mmol/mol) for type 1 and type 2 diabetic women who are pregnant, or planning a pregnancy, is regarded as a threshold below which complications are less likely (representing good or optimal control) (Jones 2011). Above 8% (64 mmol/mol) (poor control) may indicate a need to change treatment and management, but there is variation in the thresholds adopted by different bodies. NICE has recently recommended measuring HbA1c in all pregnant women with pre‐existing diabetes at booking; to consider measuring HbA1c levels in the second and third trimesters of pregnancy for women with pre‐existing diabetes and advises that level of risk for the pregnancy for women with pre‐existing diabetes increases with an HbA1c level above 6.5% (48 mmol/mol) (NICE 2015).
Blood glucose concentrations
The UK NICE Guidelines recommend that women with diabetes should aim to keep fasting blood glucose below 5.3 mmol/L; one‐hour postprandial blood glucose below 7.8 mmol/L; and two‐hour postprandial glucose below 6.4 mmol/L during pregnancy, if this can be achieved without increasing the risk of hypoglycaemia (NICE 2015).
The American College of Obstetricians and Gynecologists recommends similar (but not identical) targets for women with pregestational type 1 or type 2 diabetes: fasting < 95 mg/dL (5.3 mmol/L); one‐hour postprandial < 140 mg/dL (7.8 mmol/L); two‐hour postprandial < 120 mg/dL (6.7 mmol/L) (ACOG 2005 ‐ reaffirmed 2014). The American Diabetes Association suggests less stringent targets based on clinical experience and individualisation of care, if women cannot achieve these targets without significant hypoglycaemia (ADA 2016).
Women with type 1 and type 2 diabetes are advised to self‐monitor their blood glucose throughout pregnancy (ADIPS 2005). One method of self‐monitoring is to use a memory‐based glucose meter to record capillary glucose measurements several times a day which can be then downloaded into data collection systems (Sacks 2006).
Other related Cochrane reviews
Several Cochrane reviews address treatments or regimens for pregnant women with pre‐existing diabetes. For example, Tieu 2010 has assessed 'Oral anti‐diabetic agents for women with pre‐existing diabetes mellitus/impaired glucose tolerance or previous gestational diabetes mellitus'; Farrar 2007 has assessed 'Continuous subcutaneous insulin infusion versus multiple daily injections of insulin for pregnant women with diabetes' and Moy 2014 has assessed 'Techniques of monitoring blood glucose during pregnancy for women with pre‐existing diabetes'.
While many other Cochrane reviews cover aspects of diabetes management in general (e.g. dietary advice, exercise, education, adherence, weight loss), it is not clear if the conclusions apply to pregnant women; and indeed some of the reviews have specifically excluded studies in pregnant women.
A Cochrane review 'Intensive glucose control versus conventional glucose control for type 1 diabetes mellitus' found that while microvascular complications could be reduced with tight glucose control in people with type 1 diabetes, treatment goals need to be individualised taking into account age, disease progression, macrovascular risk, as well as the patient's lifestyle and disease management capabilities (Fullerton 2014). In people with type 2 diabetes, intensive therapy compared with standard glycaemic control was associated with increased all‐cause and cardiovascular mortality and severe hypoglycaemia in North American randomised controlled trials but not in those conducted in the rest of the world (Sardar 2015).
How the intervention might work
Improving poor glycaemic control
In a small US study of 55 women, 61% with pre‐existing diabetes entered their pregnancy with suboptimal control (HbA1c greater than 8%); and women who had not been advised to achieve target levels were more likely to have suboptimal HbA1c levels at the beginning of their pregnancy (Casele 1998). A systematic review of 13 observational studies with a total of 5480 women showed that poor glycated haemoglobin control during pregnancy was associated with increased risk of congenital malformations, miscarriage and perinatal mortality compared with optimal control (Inkster 2006). The authors of this review note that the association between adverse perinatal outcomes and HbA1c levels may be influenced by related confounders, such as women already having established microvascular complications. Kinsley 2007 also questions the link between poor glycaemic control and adverse birth outcomes, suggesting that other factors, such as mother's weight and age, and timing and type of care, may also have an influence.
Potential risks of tight glycaemic control
There is some concern that as glycaemic or metabolic control improves, the risk of hypoglycaemia increases (DCCT 1993). While animal studies have linked hypoglycaemia early in gestation with congenital abnormalities, this does not seem to be the case in humans, even when hypoglycaemic episodes occur during organogenesis (Steel 1990). Maternal deaths due to hypoglycaemia have been reported rarely (ADIPS 2005).
Recent trials in non‐pregnant populations of people with type 2 diabetes have failed to show that the benefits of very tight glycaemic control outweigh the harms, with one trial stopping early due to excess deaths (Montori 2009). The interventions needed to achieve very tight glycaemic control may in addition be onerous, overwhelming people's "capacity to cope clinically, psychologically and financially" (Montori 2009). Pregnant women with diabetes are also likely to experience similar problems in trying to control their blood glucose concentrations (King 2009).
Why it is important to do this review
In 1989, the St Vincent Declaration set a five‐year target for women with diabetes to achieve similar pregnancy outcomes to those achieved by women without diabetes; over 20 years later, that target has not yet been met (Modder 2008).
In assessing evidence related to determining the optimal degree of glycaemic control, this review will contribute to knowledge which can be used by pregnant women with pre‐existing diabetes and their clinicians to minimise the risk of adverse birth outcomes and diabetic complications for mothers.
Objectives
To assess the effects of different intensities of glycaemic control (loose, moderate, tight, and very tight) in pregnant women with pre‐existing type 1 or type 2 diabetes.
Methods
Criteria for considering studies for this review
Types of studies
Randomised controlled trials or quasi‐randomised controlled trials; including abstracts.
Types of participants
Pregnant women with established diabetes (type 1 or type 2) as diagnosed according to each included study.
Types of interventions
Studies comparing different intensities of glycaemic control which have predefined definitions of intensity of control. We planned to accept studies that used different target thresholds in their definitions. If blood glucose levels were used as the measure of glycaemic control, we used the definition of 'tight' and 'very tight' used in each individual study. Methods of achieving targets could include more frequent hospital visits, dietary changes, exercise, more intensive insulin therapy, and/or home‐based monitoring systems that involve setting specific targets.
Types of outcome measures
The following outcomes include those agreed by consensus between the review authors and other review authors of Cochrane systematic reviews for prevention and treatment of gestational diabetes mellitus (GDM) and pre‐existing diabetes.
Primary outcomes
Maternal
-
Pre‐eclampsia.
-
Mode of birth (normal vaginal birth, operative vaginal birth, caesarean section).
Neonatal
-
Perinatal (fetal and neonatal) and postneonatal mortality.
-
Death or morbidity composite (variously defined by trials, e.g. infant death, shoulder dystocia, bone fracture or nerve palsy).
-
Congenital fetal anomaly.
Secondary outcomes
Maternal
-
Maternal mortality.
-
Pregnancy‐induced hypertension.
-
Chronic hypertension: not prespecified.
-
Transient hypertension: not prespecified.
-
Cardiovascular events.
-
Glycaemic control achieved (e.g. blood glucose or HbA1c concentrations).
-
Hypoglycaemia requiring treatment during pregnancy.
-
Hypoglycaemic episodes: not prespecified.
-
Induction of labour.
-
Augmentation of labour.
-
Perineal trauma.
-
Gestational weight gain.
-
Postpartum haemorrhage.
-
Postpartum infection.
-
Placental abruption.
-
Depression.
-
Anxiety.
-
Breastfeeding.
-
Satisfaction with treatment/management.
-
Adherence with treatment/management.
-
Diabetic ketoacidosis.
-
Later development of cardiovascular disease.
Neonatal
-
Large‐for‐gestational age (birthweight greater than 90th centile; or as defined by individual trial).
-
Shoulder dystocia.
-
Bone fracture.
-
Nerve palsy.
-
Fetal distress: not prespecified.
-
Gestational age at birth.
-
Birthweight.
-
Head circumference.
-
Length.
-
Small‐for‐gestational age.
-
Preterm birth.
-
Apgar score.
-
Asphyxia: not prespecified.
-
Neonatal hypoglycaemia.
-
Neonatal hypomagnesaemia: not prespecified.
-
Neonatal infection.
-
Neonatal hyperglycaemia.
-
Respiratory distress syndrome.
-
Neonatal jaundice (hyperbilirubinaemia).
-
Hypocalcaemia.
Infant/childhood/adult outcomes
-
Childhood/adulthood adiposity.
-
Childhood/adulthood diabetes.
-
Childhood/adulthood neurosensory disability.
Health service use
-
Hospital or health professional visits for the mother.
-
Length of postnatal stay (mother).
-
Additional requirements for families (such as change of diet, exercise, extra antenatal visits).
-
Admission to neonatal intensive care unit/nursery.
-
Length of stay in neonatal intensive care unit/nursery.
Search methods for identification of studies
The following methods section of this review is based on a standard template used by the Cochrane Pregnancy and Childbirth Group.
Electronic searches
We searched the Cochrane Pregnancy and Childbirth Group’s Trials Register by contacting the Trials Search Co‐ordinator (31 January 2016).
The Register is a database containing over 21,000 reports of controlled trials in the field of pregnancy and childbirth. For full search methods used to populate the Pregnancy and Childbirth Group’s Trials Register including the detailed search strategies for CENTRAL, MEDLINE, Embase and CINAHL; the list of handsearched journals and conference proceedings, and the list of journals reviewed via the current awareness service, please follow this link to the editorial information about the Cochrane Pregnancy and Childbirth Group in The Cochrane Library and select the ‘Specialized Register ’ section from the options on the left side of the screen.
Briefly, the Cochrane Pregnancy and Childbirth Group’s Trials Register is maintained by the Trials Search Co‐ordinator and contains trials identified from:
-
monthly searches of the Cochrane Central Register of Controlled Trials (CENTRAL);
-
weekly searches of MEDLINE (Ovid);
-
weekly searches of Embase (Ovid);
-
monthly searches of CINAHL (EBSCO);
-
handsearches of 30 journals and the proceedings of major conferences;
-
weekly current awareness alerts for a further 44 journals plus monthly BioMed Central email alerts.
Search results are screened by two people and the full text of all relevant trial reports identified through the searching activities described above is reviewed. Based on the intervention described, each trial report is assigned a number that corresponds to a specific Pregnancy and Childbirth Group review topic (or topics), and is then added to the Register. The Trials Search Co‐ordinator searches the Register for each review using this topic number rather than keywords. This results in a more specific search set which has been fully accounted for in the relevant review sections (Included studies; Excluded studies).
Searching other resources
We searched reference lists of retrieved studies.
We did not apply any language or date restrictions.
Data collection and analysis
For methods used in the previous version of this review, seeMiddleton 2012.
For this update, we planned to use the following methods to assess reports that we identified as a result of the updated search. Unfortunately, no new reports were identified.
The following methods section of this review is based on a standard template used by the Cochrane Pregnancy and Childbirth Group.
Selection of studies
Two review authors intended to independently assess for inclusion all the potential studies identified as a result of the search strategy. We planned to resolve any disagreements through discussion.
Data extraction and management
We designed a form to extract data. For eligible studies, at least two review authors would have extracted the data using the agreed form. We planned to resolve discrepancies through discussion. We would have entered data into Review Manager software (RevMan 2014) and checked for accuracy.
Assessment of risk of bias in included studies
Two review authors planned to assess independently the risk of bias for each study using the criteria outlined in the Cochrane Handbook for Systematic Reviews of Interventions (Higgins 2011). We would have resolved any disagreement by discussion.
(1) Sequence generation (checking for possible selection bias)
For each included study we planned to describe the methods used to generate the allocation sequence in sufficient detail to allow an assessment of whether it should produce comparable groups.
We would have assessed the methods as:
-
low risk of bias (any truly random process, e.g. random number table; computer random number generator);
-
high risk of bias (any non‐random process, e.g. odd or even date of birth; hospital or clinic record number);
-
unclear risk of bias.
(2) Allocation concealment (checking for possible selection bias)
For each included study we planned to describe the method used to conceal the allocation sequence and determined whether intervention allocation could have been foreseen in advance of, or during recruitment, or changed after assignment.
We would have assessed the methods as:
-
low risk of bias (e.g. telephone or central randomisation; consecutively numbered sealed opaque envelopes);
-
high risk of bias (open random allocation; unsealed or non‐opaque envelopes, alternation; date of birth);
-
unclear risk of bias.
(3.1) Blinding of participants and personnel (checking for possible performance bias)
We planned to describe for each included study the methods used, if any, to blind study participants and personnel from knowledge of which intervention a participant received.
We would have considered that studies were at low risk of bias if they were blinded, or if we judged that the lack of blinding unlikely to affect results.
We would have assessed blinding separately for different outcomes or classes of outcomes.
We would have assessed the methods as:
-
low, high or unclear risk of bias for participants;
-
low, high or unclear risk of bias for personnel.
(3.2) Blinding of outcome assessment (checking for possible detection bias)
It is not possible to blind the intervention of glycaemic control targets, but assessment of some outcomes is feasible. However, none of the three included trials reported blinding of outcome assessment.
In future updates, we will describe for each included study the methods used, if any, to blind outcome assessors from knowledge of which intervention a participant received. We will assess blinding separately for different outcomes or classes of outcomes.
We will assess methods used to blind outcome assessment as:
-
low, high or unclear risk of bias.
(4) Incomplete outcome data (checking for possible attrition bias through withdrawals, dropouts, protocol deviations)
For each included trial and for each outcome or class of outcomes we planned to describe the completeness of data including attrition and exclusions from the analysis. We would have stated whether attrition and exclusions were reported, the numbers included in the analysis at each stage (compared with the total randomised participants), reasons for attrition or exclusion where reported, and whether missing data were balanced across groups or were related to outcomes. We would have assessed the methods as:
-
low risk of bias (e.g. no missing outcome data; missing outcome data balanced across groups);
-
high risk of bias (e.g. numbers or reasons for missing data imbalanced across groups; ‘as treated’ analysis carried out with substantial departure of intervention received from that assigned at randomisation);
-
unclear risk of bias.
(5) Selective reporting bias
For each included trial we planned to describe how we investigated the possibility of selective outcome reporting bias and what we found.
We would have assessed the methods as:
-
low risk of bias (where it is clear that all of the study’s pre‐specified outcomes and all expected outcomes of interest to the review have been reported);
-
high risk of bias (where not all the study’s pre‐specified outcomes have been reported; one or more reported primary outcomes were not prespecified; outcomes of interest are reported incompletely and so cannot be used; study fails to include results of a key outcome that would have been expected to have been reported);
-
unclear risk of bias.
(6) Other sources of bias
For each included trial we planned to describe any important concerns we had about other possible sources of bias.
We would have assessed whether each trial was free of other problems that could put it at risk of bias:
-
low risk of other bias;
-
high risk of other bias;
-
unclear whether there is risk of other bias.
(7) Overall risk of bias
We intended to make explicit judgements about whether trials were at high risk of bias, according to the criteria given in the Handbook (Higgins 2011). With reference to (1) to (6) above, we planned to assess the likely magnitude and direction of the bias and whether we considered it likely to impact on the findings. We intended to explore the impact of the level of bias through undertaking sensitivity analyses ‐ seeSensitivity analysis but there were insufficient data to do so.
Assessment of the quality of the evidence using the GRADE approach
For this update we assessed the quality of the evidence using the GRADE approach as outlined in the GRADE Handbook in order to assess the quality of the body of evidence relating to the following outcomes for the main comparisons.
-
Very tight versus tight‐moderate glycaemic control
-
Tight versus moderate glycaemic control
-
Tight‐moderate versus loose glycaemic control
The following seven maternal and seven infant outcomes were agreed by consensus between the review authors and other review authors of Cochrane systematic reviews for treatment and prevention of GDM and pre‐existing diabetes.
Maternal outcomes
-
Pre‐eclampsia
-
Caesarean section
-
Perineal trauma
-
Gestational weight gain
-
Postnatal depression
-
Induction of labour
-
Later development of cardiovascular disease
Infant outcomes
-
Large‐for‐gestational age
-
Perinatal mortality
-
Composite of serious neonatal outcomes
-
Neonatal hypoglycaemia
-
Childhood/adulthood adiposity
-
Childhood/adulthood diabetes
-
Childhood/adulthood neurosensory disability
We used the GRADEpro Guideline Development Tool to import data from Review Manager 5.3 (RevMan 2014) in order to create ’Summary of findings’ tables. A summary of the intervention effect and a measure of quality for each of the above outcomes was produced using the GRADE approach. The GRADE approach uses five considerations (study limitations, consistency of effect, imprecision, indirectness and publication bias) to assess the quality of the body of evidence for each outcome. The evidence can be downgraded from 'high quality' by one level for serious (or by two levels for very serious) limitations, depending on assessments for risk of bias, indirectness of evidence, serious inconsistency, imprecision of effect estimates or potential publication bias.
Measures of treatment effect
Dichotomous data
For dichotomous data, we presented results as summary risk ratio with 95% confidence intervals.
Continuous data
For continuous data, we used the mean difference with 95% confidence intervals where outcomes were measured in the same way between trials.
Unit of analysis issues
Cluster‐randomised trials
We did not identify any cluster‐randomised trials. In future updates of the review, if cluster‐randomised trials are included, we will adjust their sample sizes using the methods described in the Handbook using an estimate of the intracluster correlation co‐efficient (ICC) derived from the trial (if possible), from a similar trial or from a study of a similar population. If we use ICCs from other sources, we will report this and conduct sensitivity analyses to investigate the effect of variation in the ICC. If we identify both cluster‐randomised trials and individually‐randomised trials, we plan to synthesise the relevant information. We consider it reasonable to combine the results from both if there is little heterogeneity between the study designs and the interaction between the effect of intervention and the choice of randomisation unit is considered to be unlikely.
We will also acknowledge heterogeneity in the randomisation unit and we will perform a sensitivity analysis to investigate the effects of the randomisation unit.
Cross‐over trials
Cross‐over trials are an inappropriate design for this intervention.
Other unit of analysis issues
Farrag 1987 was a three‐arm trial, comparing tight, moderate and loose glycaemic control. We therefore used two separate comparisons (tight versus moderate; and moderate versus loose) to analyse the results of this trial.
Dealing with missing data
For included studies, we noted levels of attrition.
The denominator for each outcome in each trial was the number randomised minus any participants whose outcomes were known to be missing.
Assessment of heterogeneity
We assessed statistical heterogeneity in each meta‐analysis using the I² and Chi² statistics. We regarded heterogeneity to be substantial if either the I² was greater than 30% or there was a low P value (less than 0.10) in the Chi² test for heterogeneity.
Assessment of reporting biases
As there were fewer than 10 trials included in the analyses, we were unable to investigate reporting biases (such as publication bias) using funnel plots.
Data synthesis
We carried out statistical analyses using the Review Manager software (RevMan 2014). We presented the primary analysis by the method used to achieve glycaemic control.
We used fixed‐effect meta‐analysis where it was reasonable to assume that trials were estimating the same underlying treatment effect: i.e. where trials were examining the same intervention, and the trials' populations and methods were judged to be sufficiently similar. Where the average treatment effect was not clinically meaningful, we did not combine trials.
In future updates, with more included studies, if there is clinical heterogeneity sufficient to expect that the underlying treatment effects differ between trials, or if substantial statistical heterogeneity is detected, we will use random‐effects meta‐analysis to produce an overall summary, if an average treatment effect across trials is considered clinically meaningful. The random‐effects summary will be treated as the average of the range of possible treatment effects and we will discuss the clinical implications of treatment effects differing between trials. If the average treatment effect is not clinically meaningful, we will not combine trials. Where we use random‐effects analyses, the results will be presented as the average treatment effect with 95% confidence intervals, and the estimates of Tau² and I².
Subgroup analysis and investigation of heterogeneity
We planned to carry out the following subgroup analyses (on primary outcomes only) but there were insufficient data to do so:
-
whether the trial includes women with type 1 or type 2 diabetes, or both;
-
gestational age when women were recruited to the trial;
-
different measures and targets for glycaemic control;
-
type(s) of strategies used to target and/or achieve glycaemic control.
In future updates, we plan to assess differences between subgroups by interaction tests available in RevMan 2014. We will report the results of subgroup analyses quoting the Chi² statistic and P value, and the interaction test I² value.
Sensitivity analysis
We planned to carry out sensitivity analyses to explore the effects of adequacy of allocation concealment (including quasi‐randomisation) and other risk of bias components, but there were insufficient data to do this.
Results
Description of studies
See Characteristics of included studies.
Results of the search
Updated searches (February 2012 and January 2016) identified no new studies to consider. From the original search, we included three trials and excluded one trial (see Figure 1).
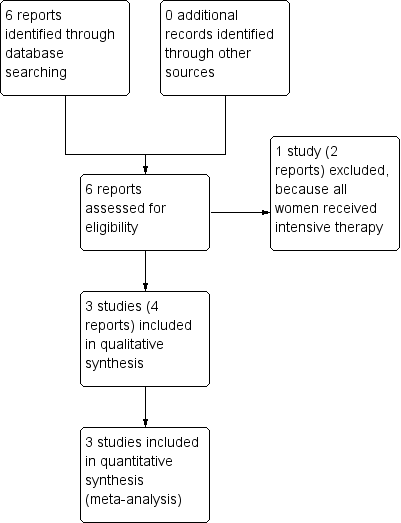
Study flow diagram.
Included studies
Setting
Two trials (Demarini 1994; Sacks 2006) were conducted in the USA, and the third (Farrag 1987) was conducted in Saudi Arabia.
Type of diabetes
All three included trials were in women with type 1 diabetes (Demarini 1994; Farrag 1987; Sacks 2006).
Baseline glycaemic control concentrations were not reported, but first trimester HbA1c ranged from a mean of approximately 7% in Sacks 2006, with a corresponding mean of 9.4% in Demarini 1994. Farrag 1987 only reported first trimester mean blood glucose concentrations ranging from 5.6 to 8.9 mmol/L (assumed to be fasting blood glucose, but this was not explicitly stated).
Interventions
Interventions were classified by degree of glycaemic control as follows.
Very tight glycaemic control
-
Fasting blood glucose (FBG) less than 4.44 mmol/L (Demarini 1994).
-
FBG 3.33 to 5.0 mmol/L (Sacks 2006).
Tight glycaemic control
-
FBG less than 5.5 mmol/L (Demarini 1994).
-
FBG of 5.6 mmol/L or less (Farrag 1987).
Moderate glycaemic control
-
FBG 5.27 to 6.38 mmol/L (Sacks 2006).
-
FBG 5.6 to 6.7 mmol/L (Farrag 1987).
Loose glycaemic control
-
FBG 6.7 to 8.9 mmol/L (Farrag 1987).
These interventions were therefore grouped into the following comparisons.
-
Very tight versus tight‐moderate glycaemic control (Demarini 1994; Sacks 2006).
-
Tight versus moderate glycaemic control (Farrag 1987).
-
Tight‐moderate versus loose glycaemic control (Farrag 1987).
Method of achieving glycaemic control targets
Each of the trials used different method to achieve glycaemic control targets, with Demarini 1994 focusing on clinician monitoring and several hospital admissions throughout pregnancy. Farrag 1987 used insulin adjustment (one unit for each 0.6 mmol/L above the set target), whereas the most recent trial (Sacks 2006) focused on diet and insulin adjustment based on self‐monitoring.
Excluded studies
We excluded the DCCT 1996a trial because all pregnant women received intensive therapy.
Risk of bias in included studies
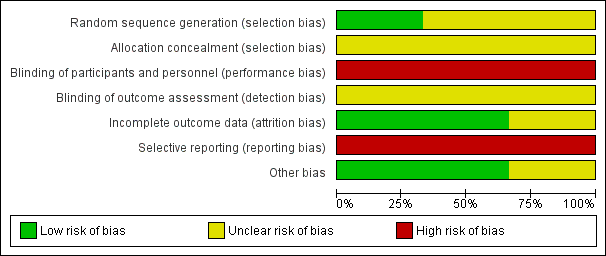
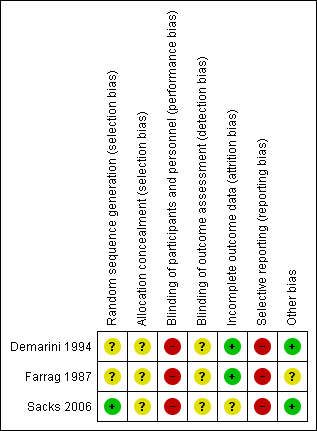
Overall, the three trials had a high risk of bias (Figure 2; Figure 3), due to lack of blinding, unclear methods of randomisation and selective reporting of outcomes.

Methodological quality graph: review authors' judgements about each methodological quality item presented as percentages across all included studies.

Methodological quality summary: review authors' judgements about each methodological quality item for each included study.
Allocation
None of the three trials described their method of allocation concealment in sufficient detail and only Sacks 2006 specified an adequate method of sequence generation (computer‐generated randomisation).
Blinding
The intervention of glycaemic control targets was not feasible to blind; and although assessment of some outcomes could have been blinded, none of the three trials reported doing so.
Incomplete outcome data
Two trials did not report losses to follow‐up and one, Sacks 2006, had a 15% loss to follow‐up (with all four women lost from the very tight glucose control target group).
Selective reporting
All three trials were at high risk of selective outcome reporting bias.
Other potential sources of bias
The Farrag 1987 trial varied in numbers randomised per group. This may have been part of the trial design (1:2:1 ratio), but no mention of this was made in the paper.
Effects of interventions
See: Summary of findings for the main comparison Very tight versus tight‐moderate glycaemic control (maternal outcomes); Summary of findings 2 Very tight versus tight‐moderate glycaemic control (infant outcomes); Summary of findings 3 Tight versus moderate glycaemic control (maternal outcomes); Summary of findings 4 Tight versus moderate glycaemic control (infant outcomes); Summary of findings 5 Tight‐moderate versus loose glycaemic control (maternal outcomes); Summary of findings 6 Tight‐moderate versus loose glycaemic control (infant outcomes)
1. Very tight versus tight‐moderate glycaemic control targets
See summary of findings Table for the main comparison and summary of findings Table 2.
We included two trials in this comparison (Demarini 1994; Sacks 2006) involving a total of 163 women, jointly spanning fasting blood glucose targets of 3.33 to 5.0 mmol/L for very tight glycaemic control targets versus 4.45 to 6.38 mmol/L for tight‐moderate glycaemic control targets.
Primary outcomes
In one trial of 22 women and babies (Sacks 2006), no significant differences in caesarean sections were seen between very tight and tight‐moderate glycaemic control (risk ratio (RR) 0.92, 95% confidence interval) CI 0.49 to 1.73; evidence graded very low;Analysis 1.1). In the same trial, there were no perinatal deaths or instances of serious perinatal morbidity (both outcomes: evidence graded low; Analysis 1.2; Analysis 1.3). In this trial, two babies in the very tight control group had congenital fetal anomalies compared with none in the tight‐moderate glycaemic control group (RR 3.57, 95% CI 0.19 to 66.61; Analysis 1.4).
Neither trial reported the other primary outcome of pre‐eclampsia.
Secondary outcomes
In one trial of 137 women, no significant difference in pregnancy‐induced hypertension was seen between the very tight and tight‐moderate glycaemic control groups (RR 1.40, 95% CI 0.60 to 3.25, Analysis 1.5; Demarini 1994). In the other trial of 22 women, no cases of chronic hypertension were reported (Analysis 1.6; Sacks 2006).
In the two trials, glycaemic control was assessed in a number of ways.
Sacks 2006 (22 women) reported mean self‐monitored blood glucose each trimester; finding significantly better control in the very tight target group in the first (mean difference (MD) ‐1.23 mmol/L, 95% CI ‐2.19 to ‐0.27) and second trimesters (MD ‐0.99 mmol/L, 95% CI ‐1.64 to ‐0.34); but no difference in the third trimester (MD ‐0.66 mmol/L, 95% CI ‐1.60 to 0.28; Analysis 1.7). In this trial, no significant differences in daily blood glucose tests were seen between the very tight and the tight‐moderate target group (MD 1.60 fewer tests/day, 95% CI ‐0.15 to 3.35; Analysis 1.8).
Both trials assessed HbA1c concentrations each trimester. In the first trimester, Sacks 2006 found HbA1c to be significantly lower on the very tight target group compared with the tight‐moderate target group (MD ‐1.20%, 95% CI ‐2.25 to ‐0.15), while no differences between groups were seen for Demarini 1994 (MD 0%, 95% CI ‐0.62 to 0.62; Analysis 1.9). In the second and third trimesters, there were no significant differences in HbA1c concentration between very tight and tight‐moderate groups in either trial (Analysis 1.10; Analysis 1.11). We did not pool the results of these two trials as there was substantial statistical heterogeneity for HbA1c concentrations in the first and second trimesters, as well as clinical differences between trials such as baseline HbA1c concentrations and differences in the interventions (such as amount of antenatal hospitalisation).
The Demarini 1994 trial also assessed mean preprandial and postprandial glucose concentrations, finding no significant differences between the very tight and tight‐moderate groups in any trimester (Analysis 1.12; Analysis 1.13).
In Sacks 2006, women in the tight‐moderate glycaemic control target group had significantly fewer days with more than one fasting blood glucose reading below 3.3 mmol/L (MD 20% fewer days, 95% CI 7.00 to 33.00) and below 2.78 mmol/L (MD 17%, 95% CI 4.04 to 29.96). No significant differences between the groups were seen with a threshold of more than one reading below 2.22 mmol/L (MD 8%, 95% CI ‐3.56 to 19.56; Analysis 1.14). In the same trial, there were significantly fewer hypoglycaemic episodes in the tight‐moderate glycaemic control target compared with the very tight group (MD 22% fewer days with more than one subjective hypoglycaemic episode, 95% CI 11.07 to 32.93; Analysis 1.15).
Gestational weight gain was not significantly different between the very tight and the tight‐moderate glycaemic control target groups in Sacks 2006 (MD 0.02 kg/week, 95% CI ‐0.23 to 0.27; evidence graded very low;Analysis 1.16).
Gestational age at birth was not significantly different between the very tight and tight‐moderate glycaemic control targets (pooled MD 0.43 weeks, 95% CI ‐0.23 to 1.08; Demarini 1994; Sacks 2006) ‐ Analysis 1.18.
Birthweights pooled across the two trials were not significantly different between the very tight and the tight‐moderate glycaemic control target groups (MD ‐2.62 g, 95% CI ‐179.83 to 174.59; Demarini 1994; Sacks 2006) ‐ Analysis 1.19.
No differences between groups in Apgar scores less than seven at one minute were seen in the Demarini 1994 trial (RR 1.01, 95% CI 0.40 to 2.55), and none of the babies in this trial had Apgar scores of less than seven at five minutes (Analysis 1.20). In this trial no differences between groups were seen for fetal distress (RR 1.15, 95% CI 0.63 to 2.11; Analysis 1.17) or asphyxia (RR 1.01, 95% CI 0.58 to 1.78; Analysis 1.21).
In Demarini 1994 there was a non‐significant trend towards fewer neonates with hypocalcaemia for the very tight compared with the tight‐moderate glucose control target (RR 0.55, 95% CI 0.30 to 1.03; 137 neonates;Analysis 1.22) and no significant differences between groups were seen for neonatal hypomagnesaemia (RR 0.65, 95% CI 0.25 to 1.68; 127 neonates; Analysis 1.23).
In Demarini 1994, women in the tight‐moderate glycaemic control target group had significantly shorter hospital stays compared with the very tight group (MD 10.60 fewer days, 95% CI 9.53 to 11.67; Analysis 1.24).
2. Tight versus moderate glycaemic control targets
See summary of findings Table 3 and summary of findings Table 4.
We used two of the three arms of the Farrag 1987 trial (45 women and babies) for this comparison (FBG 5.6 or less (tight) versus 5.6 to 6.7 (moderate) mmol/L).
Primary outcomes
No significant differences between the tight and moderate glycaemic control target groups were seen for pre‐eclampsia (RR 5.29, 95% CI 0.23 to 122.91; evidence graded very low;Analysis 2.1) or caesarean sections (RR 1.21, 95% CI 0.22 to 6.50; evidence graded very low;Analysis 2.2) in these two arms of the Farrag 1987 trial. (evidence graded very low). In this trial, no perinatal deaths were reported (evidence graded very low).
This trial did not report on the outcomes of congenital fetal abnormalities or serious perinatal morbidities.
Secondary outcomes
Transient maternal hypertension was not significantly different between the high and moderate glycaemic control target groups (RR 0.59, 95% CI 0.03 to 13.66; Farrag 1987) ‐ Analysis 2.4.
There were significantly more instances of maternal hypoglycaemia in the first half of pregnancy in the tight, compared with the moderate glycaemic control target (RR 26.47, 95% CI 1.61 to 435.38; Farrag 1987) ‐ Analysis 2.5.
No infants in these two arms of the Farrag 1987 trial were reported to have a large‐for‐gestational age (birthweight greater than the 90th centile) (evidence graded very low).
No differences between the tight and moderate glycaemic control target groups were seen for neonatal respiratory distress syndrome (RR 0.91, 95% CI 0.09 to 9.24; Farrag 1987) ‐ Analysis 2.7.
3. Tight‐moderate versus loose glycaemic control targets
See summary of findings Table 5 and summary of findings Table 6.
We used all three arms of the Farrag 1987 trial in this comparison, although we combined the 'tight' and 'moderate' arms (6.7 mmol/L or less; 45 women and babies) and compared this with the 'loose' arm (6.7 to 8.9 mmol/L; 15 women and babies).
Primary outcomes
In Farrag 1987, significantly fewer women in the tight‐moderate group compared with the loose glycaemic target group had pre‐eclampsia (RR 0.11, 95% CI 0.01 to 0.99; evidence graded low;Analysis 3.1) and caesarean sections (RR 0.28, 95% CI 0.10 to 0.78; evidence graded low;Analysis 3.2).
Two neonatal deaths were reported in the loose glycaemic control target group, giving no significant differences between the tight‐moderate and loose groups in Farrag 1987 (RR 0.07, 95% CI 0.00 to 1.37; evidence graded very low;Analysis 3.3).
This trial did not report on the outcomes of maternal hyperglycaemia requiring treatment, congenital fetal abnormalities or serious perinatal morbidities.
Secondary outcomes
Transient maternal hypertension was not significantly different between the tight‐moderate and loose glycaemic control target groups (RR 1.81, 95% CI 0.12 to 27.07; Farrag 1987) ‐ Analysis 3.4.
Maternal hypoglycaemia in the first half of pregnancy was not significantly different between the tight‐moderate and loose glycaemic control target groups (RR 5.22, 95% CI 0.32 to 86.28; Farrag 1987) ‐ Analysis 3.5.
In this trial significantly fewer neonates in the tight‐moderate (compared with the loose glycaemic control target group) had large‐for‐gestational age (birthweights greater than the 90th centile) (RR 0.01, 95% CI 0.00 to 0.20; evidence graded low;Analysis 3.6).
In Farrag 1987, significantly fewer neonates had respiratory distress syndrome in the tight‐moderate compared with the loose glycaemic control target groups (RR 0.17, 95% CI 0.05 to 0.59; Analysis 3.7).
Discussion
Summary of main results
Very few differences were seen between very tight (3.33 to 5.0 mmol/L fasting blood glucose (FBG)) and tight‐moderate (4.45 to 6.38 mmol/L FBG) targets in pregnant women with pre‐existing type 1 diabetes in two small trials, although there were significantly more cases of hypoglycaemia and longer hospital stays with very tight control targets.
A single trial comparing tight (5.6 mmol/L or less FBG), moderate (5.6 to 6.7 mmol/L) and loose (6.7 to 8.9 mmol/L) glycaemic control targets found few differences between the tight and moderate groups, although significantly more women in the tight group had hypoglycaemia in the first half of pregnancy. In the loose glycaemic control group, significantly more women had pre‐eclampsia, and there were significantly more caesareans and birthweights greater than 90th centile.
In the very tight and tight‐moderate glycaemic control target comparisons, neither group achieved their targets. In Sacks 2006, women in the very tight group (target of less than 5 mmol/L FBG) had a mean FBG of 7.28 mmol/L and the tight‐moderate group (less than 6.28 mmol/L FBG) had a mean FBG of 7.94 mmol/L in the third trimester. The corresponding figures for Demarini 1994 were less than 4.44 mmol/L and a mean 6.99 mmol/L FBG for the very tight group and less than 5.55 mmol/L and a mean 7.33 mmol/L FBG for the tight‐moderate group.
Overall completeness and applicability of evidence
Only three small trials of 223 women with pre‐existing type 1 diabetes were able to be included in this review. No trials in pregnant women with pre‐existing type 2 diabetes were located. The trials reviewed do not give information on women's views.
Quality of the evidence
All three included trials were at high risk of bias particularly in regard to unclear allocation concealment methods, and selective outcome reporting (for example, pre‐eclampsia was reported in only one of the trials). However, any potential bias is likely to have been overshadowed by the small number and size of trials with their different designs, interventions and reported outcomes.
The trials are far too small to show differences in important but rare outcomes such as perinatal mortality, and even the more common ones such as caesarean sections.
The level of the evidence for very tight versus tight‐moderate glycaemic control was graded low (perinatal mortality, serious perinatal morbidity), or very low (caesarean section, maternal weight gain during pregnancy, neonatal hypocalcaemia) (summary of findings Table for the main comparison; summary of findings Table 2). For tight versus moderate glycaemic control the level of the evidence was graded very low (pre‐eclampsia, caesarean section, large‐for‐gestational age, perinatal mortality) (summary of findings Table 3; summary of findings Table 4). For tight‐moderate versus loose glycaemic control it was graded low (caesarean section, large‐for‐gestational age, pre‐eclampsia) or very low (perinatal mortality) (summary of findings Table 5; summary of findings Table 6). The outcomes were down‐graded because of the small numbers of women in the trials, few or no events in the case of rare outcomes such as perinatal mortality and pre‐eclampsia, wide confidence intervals crossing the line of no effect, and design limitations in the studies.
Potential biases in the review process
The assessment of risk of bias involves subjective judgements. This potential limitation is minimised by following the procedures in the Cochrane Handbook for Systematic Reviews of Interventions (Higgins 2011), with review authors independently assessing studies and resolving any disagreement through discussion, and if required involving a third assessor in the decision.
Agreements and disagreements with other studies or reviews
We used FBG concentrations to assess whether women were meeting their glycaemic control targets, as this was the only measurement common to all three trials. Each of the trials used different definitions and thresholds. While this meant some overlap (and some gaps) in our very tight, tight, moderate and loose categorisation, this approximated less than 5 mmol/L FBG for very tight, less than 6 mmol/L for tight, less than 7 mmol/L for moderate and less than 9 mmol/L for loose glycaemic control. Our tight category is reasonably consistent with recent recommendations from the UK (less than 5.9 mmol/L FBG) and the US (less than 5.56 mmol/L) (ACOG 2005; NICE 2015).
Our findings of lack of achievement in reaching glycaemic targets is consistent with Langer and colleagues' experience where 40% to 50% of pregnant women with type 1 diabetes and 55% to 74% of pregnant women with type 2 diabetes achieved their glycaemic control targets (Langer 2008) and also in Manderson 2003, where glycaemic control success was poor (11% of FBG readings within target ranges) in pregnant women with type 1 diabetes.
There is, however, some indication both in pregnant women with pre‐existing type 1 diabetes (Manderson 2003) and women with gestational diabetes (De Veciana 1995) that postprandial glucose targets may be more achievable than preprandial targets and that using postprandial targets may lead to reductions in outcomes such as pre‐eclampsia (Manderson 2003). In a trial included in this review (Demarini 1994), neither preprandial (see above) or postprandial targets met the current NICE 2015 standard of less than 7.8 mmol/L (postprandial values were 8.55 mmol/L in the very tight group and 8.66 mmol/L in the tight group).
Sacks and colleagues argue that glycaemic targets for type 1 and 2 diabetes should not be identical, and suggest that type 1 targets be relaxed to avoid maternal hypoglycaemia. They observe that many high FBG values may be the result of women trying to combat their hypoglycaemia and that raising glucose targets may therefore actually lower mean glucose values, without worsening maternal and neonatal outcomes (Sacks 1997).
There is debate about the relationship between glycaemic control and birth outcomes, with Langer 1994 finding a reduction in macrosomia with more intensive control in women with gestational diabetes, even though differences in mean glucose concentrations were not apparent between the intensive and conventionally managed groups. In a later paper, Langer and colleagues argue for aggressive management of pregnant women with type 2 diabetes using insulin in combination with oral antidiabetic drugs and glucose self‐monitoring (Langer 2008).
For diabetes in the general (non‐pregnant) population, there is also current debate about the merits (or otherwise) of intensive glycaemic control. A systematic review of intensive versus conventional glucose control (with varying definitions of degree of control) showed a reduced risk for some cardiovascular outcomes such as nonfatal myocardial infarction, no reduced risk for cardiovascular death or all‐cause mortality, and increased risk for severe hypoglycaemia in people with type 2 diabetes (Kelly 2009). In another systematic review in people with type 2 diabetes, intensive therapy compared with standard glycaemic control was associated with increased all‐cause and cardiovascular mortality and severe hypoglycaemia in North American randomised controlled trials but not in those conducted in the rest of the world (Sardar 2015).

Study flow diagram.
Methodological quality graph: review authors' judgements about each methodological quality item presented as percentages across all included studies.
Methodological quality summary: review authors' judgements about each methodological quality item for each included study.

Comparison 1 Very tight versus tight‐moderate glycaemic control, Outcome 1 Caesarean section.

Comparison 1 Very tight versus tight‐moderate glycaemic control, Outcome 2 Perinatal mortality.
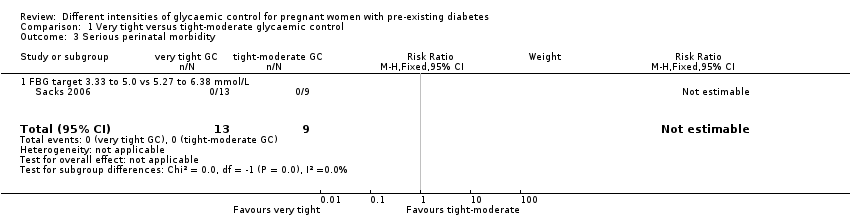
Comparison 1 Very tight versus tight‐moderate glycaemic control, Outcome 3 Serious perinatal morbidity.

Comparison 1 Very tight versus tight‐moderate glycaemic control, Outcome 4 Congenital fetal anomaly.
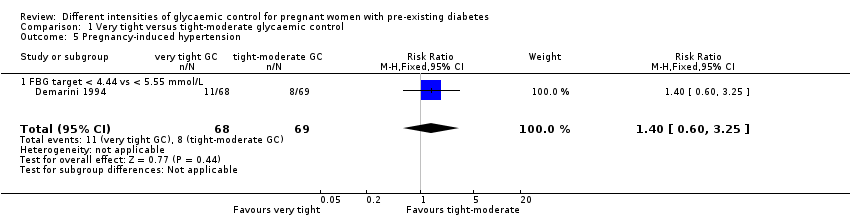
Comparison 1 Very tight versus tight‐moderate glycaemic control, Outcome 5 Pregnancy‐induced hypertension.

Comparison 1 Very tight versus tight‐moderate glycaemic control, Outcome 6 Chronic hypertension: not prespecified.

Comparison 1 Very tight versus tight‐moderate glycaemic control, Outcome 7 Glycaemic control ‐ Self‐monitored blood glucose (mean, mmol/L).

Comparison 1 Very tight versus tight‐moderate glycaemic control, Outcome 8 Glycaemic control ‐ Self‐monitored blood glucose tests/day.
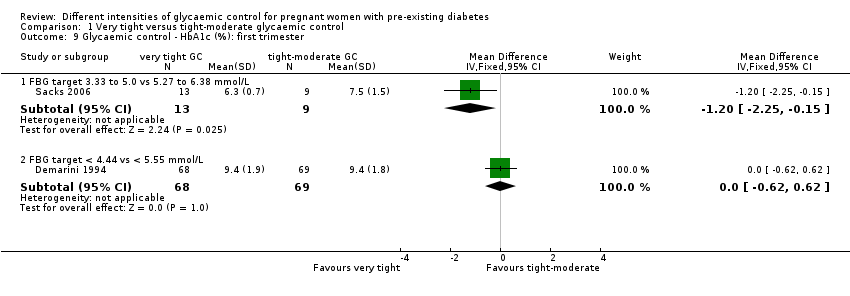
Comparison 1 Very tight versus tight‐moderate glycaemic control, Outcome 9 Glycaemic control ‐ HbA1c (%): first trimester.

Comparison 1 Very tight versus tight‐moderate glycaemic control, Outcome 10 Glycaemic control ‐ HbA1c (%): second trimester.

Comparison 1 Very tight versus tight‐moderate glycaemic control, Outcome 11 Glycaemic control ‐ HbA1c (%): third trimester.

Comparison 1 Very tight versus tight‐moderate glycaemic control, Outcome 12 Glycaemic control ‐ Mean preprandial glucose (mmol/L).

Comparison 1 Very tight versus tight‐moderate glycaemic control, Outcome 13 Glycaemic control ‐ Mean postprandial glucose (mmol/L).
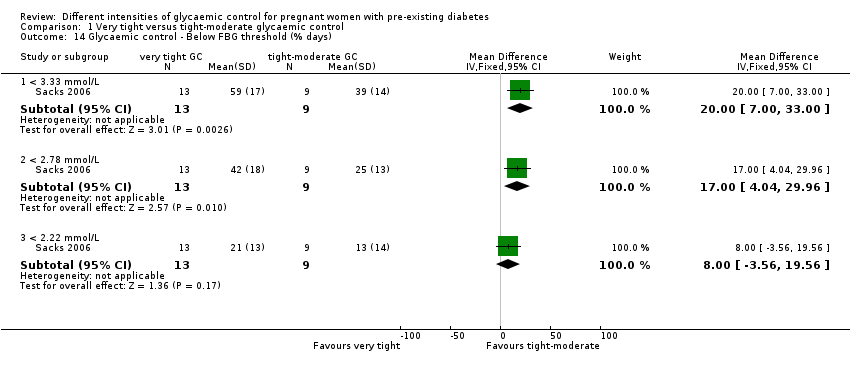
Comparison 1 Very tight versus tight‐moderate glycaemic control, Outcome 14 Glycaemic control ‐ Below FBG threshold (% days).

Comparison 1 Very tight versus tight‐moderate glycaemic control, Outcome 15 Hypoglycaemic episodes ‐ > 1 subjective (% of days): not prespecified.
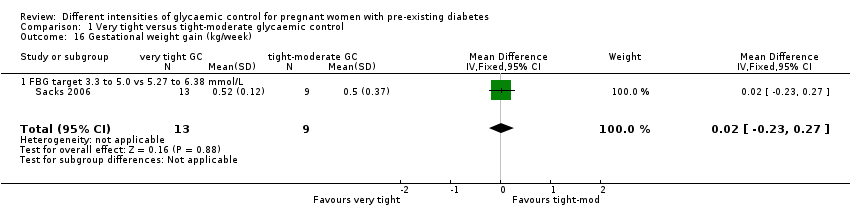
Comparison 1 Very tight versus tight‐moderate glycaemic control, Outcome 16 Gestational weight gain (kg/week).
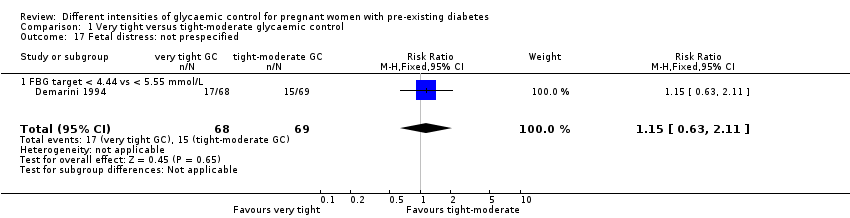
Comparison 1 Very tight versus tight‐moderate glycaemic control, Outcome 17 Fetal distress: not prespecified.

Comparison 1 Very tight versus tight‐moderate glycaemic control, Outcome 18 Gestational age at birth (weeks).

Comparison 1 Very tight versus tight‐moderate glycaemic control, Outcome 19 Birthweight (g).

Comparison 1 Very tight versus tight‐moderate glycaemic control, Outcome 20 Apgar score.

Comparison 1 Very tight versus tight‐moderate glycaemic control, Outcome 21 Asphyxia: not prespecified.
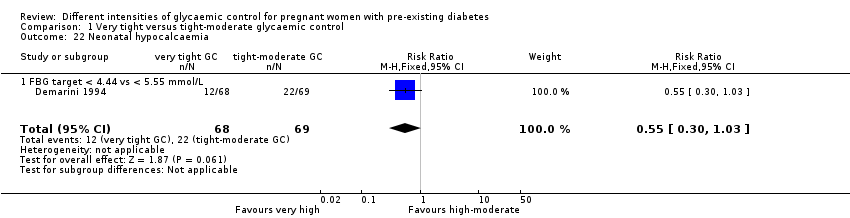
Comparison 1 Very tight versus tight‐moderate glycaemic control, Outcome 22 Neonatal hypocalcaemia.
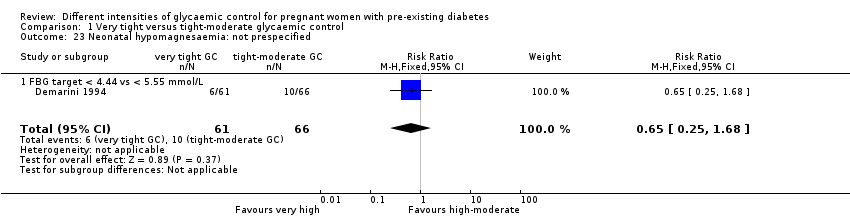
Comparison 1 Very tight versus tight‐moderate glycaemic control, Outcome 23 Neonatal hypomagnesaemia: not prespecified.

Comparison 1 Very tight versus tight‐moderate glycaemic control, Outcome 24 Maternal hospitalisation (days).

Comparison 2 Tight versus moderate glycaemic control, Outcome 1 Pre‐eclampsia.

Comparison 2 Tight versus moderate glycaemic control, Outcome 2 Caesarean section.

Comparison 2 Tight versus moderate glycaemic control, Outcome 3 Perinatal mortality.

Comparison 2 Tight versus moderate glycaemic control, Outcome 4 Transient maternal hypertension.

Comparison 2 Tight versus moderate glycaemic control, Outcome 5 Hypoglycaemic epispodes ‐ first half of pregnancy: not prespecified.

Comparison 2 Tight versus moderate glycaemic control, Outcome 6 Large‐for‐gestational age (birthweight > 90th centile).

Comparison 2 Tight versus moderate glycaemic control, Outcome 7 Respiratory distress syndrome.
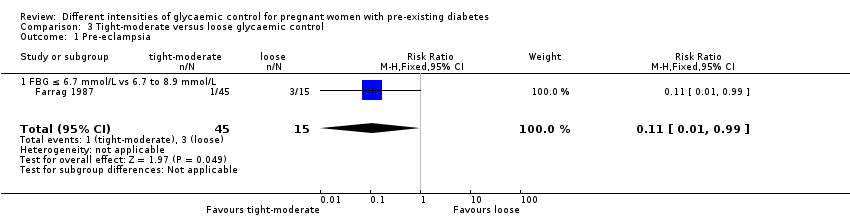
Comparison 3 Tight‐moderate versus loose glycaemic control, Outcome 1 Pre‐eclampsia.

Comparison 3 Tight‐moderate versus loose glycaemic control, Outcome 2 Caesarean section.

Comparison 3 Tight‐moderate versus loose glycaemic control, Outcome 3 Perinatal mortality.

Comparison 3 Tight‐moderate versus loose glycaemic control, Outcome 4 Transient maternal hypertension.
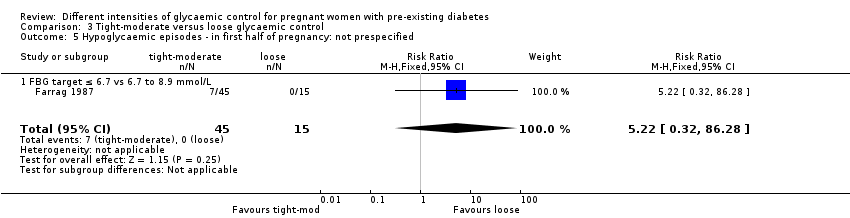
Comparison 3 Tight‐moderate versus loose glycaemic control, Outcome 5 Hypoglycaemic episodes ‐ in first half of pregnancy: not prespecified.
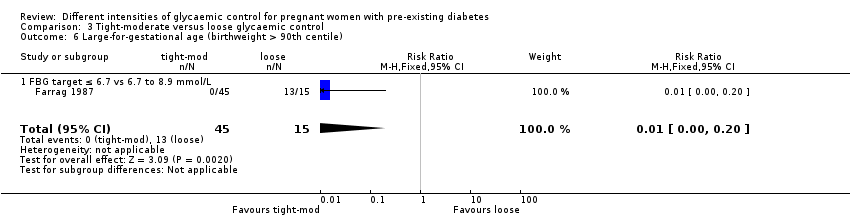
Comparison 3 Tight‐moderate versus loose glycaemic control, Outcome 6 Large‐for‐gestational age (birthweight > 90th centile).
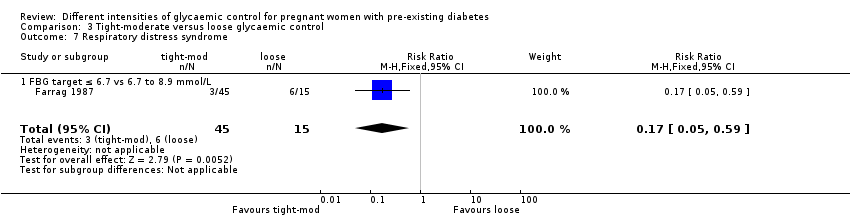
Comparison 3 Tight‐moderate versus loose glycaemic control, Outcome 7 Respiratory distress syndrome.
| Very tight versus tight‐moderate glycaemic control (FBG target 3.33 to 5.0 versus 5.27 to 6.38 mmol/L) | ||||||
| Patient or population: pregnant women with pre‐existing type 1 diabetes | ||||||
| Outcomes | Anticipated absolute effects* (95% CI) | Relative effect | No. of participants | Quality of the evidence | Comments | |
| Risk with tight‐moderate glycaemic control | Risk with very tight glycaemic control | |||||
| Pre‐eclampsia | not reported | |||||
| Caesarean section | Study population | RR 0.92 | 22 | ⊕⊝⊝⊝ | FBG target 3.3 to 5.0 versus 5.27 to 6.38 mmol/L | |
| 667 per 1000 | 613 per 1000 | |||||
| Perineal trauma | not reported | |||||
| Gestational weight gain | The mean difference in gestational weight gain (kg/week) was 0 | The mean difference in gestational weight gain (kg/week) was 0.02 kg/week more (0.23 fewer to 0.27 more) | 22 | ⊕⊝⊝⊝ | FBG target 3.3 to 5.0 versus 5.27 to 6.38 mmol/L | |
| Postnatal depression | not reported | |||||
| Induction of labour | not reported | |||||
| Later development of cardiovascular disease | not reported | |||||
| *The risk in the intervention group (and its 95% confidence interval) is based on the assumed risk in the comparison group and the relative effect of the intervention (and its 95% CI). | ||||||
| GRADE Working Group grades of evidence | ||||||
| 1 One study with design limitations. 2 Wide confidence interval crossing the line of no effect, and small sample size. | ||||||
| Very tight versus tight‐moderate glycaemic control (FBG target 3.33 to 5.0 versus 5.27 to 6.38 mmol/L or FBG target < 4.44 versus < 5.55 mmol/L) | ||||||
| Patient or population: pregnant women with pre‐existing type 1 diabetes | ||||||
| Outcomes | Anticipated absolute effects* (95% CI) | Relative effect | No. of participants | Quality of the evidence | Comments | |
| Risk with tight‐moderate glycaemic control | Risk with very tight glycaemic control | |||||
| Large‐for‐gestational age | not reported | |||||
| Perinatal mortality | Study population | not estimable | 22 | ⊕⊕⊝⊝ | FBG target 3.33 to 5.0 versus 5.27 to 6.38 mmol/L | |
| 0 per 1000 | 0 per 1000 | |||||
| Serious perinatal morbidity | Study population | not estimable | 22 | ⊕⊕⊝⊝ | FBG target 3.33 to 5.0 versus 5.27 to 6.38 mmol/L | |
| 0 per 1000 | 0 per 1000 | |||||
| Neonatal hypoglycaemia | not reported | |||||
| Childhood/adulthood adiposity | not reported | |||||
| Childhood/adulthood diabetes | not reported | |||||
| Childhood/adulthood neurosensory disability | not reported | |||||
| *The risk in the intervention group (and its 95% confidence interval) is based on the assumed risk in the comparison group and the relative effect of the intervention (and its 95% CI). | ||||||
| GRADE Working Group grades of evidence | ||||||
| 1 One study with design limitations. 2 Small sample size, no events. | ||||||
| Tight versus moderate glycaemic control (FBG target ≤ 5.6 mmol/L versus 5.6 to 6.7 mmol/L) ‐ Maternal outcomes | ||||||
| Patient or population: pregnant women with pre‐existing type 1 diabetes | ||||||
| Outcomes | Anticipated absolute effects* (95% CI) | Relative effect | No. of participants | Quality of the evidence | Comments | |
| Risk with moderate glycaemic control | Risk with tight glycaemic control | |||||
| Pre‐eclampsia | Study population | RR 5.29 | 45 | ⊕⊝⊝⊝ | FBG target ≤ 5.6 versus 5.6 to 6.7 mmol/L Moderate: 0 out of 29 women, Tight: 1 out of 16 women. | |
| not estimable | not estimable | |||||
| Caesarean section | Study population | RR 1.21 | 45 | ⊕⊝⊝⊝ | FBG target ≤ 5.6 versus 5.6 to 6.7 mmol/L | |
| 103 per 1000 | 125 per 1000 | |||||
| Perineal trauma | not reported | |||||
| Gestational weight gain | not reported | |||||
| Postnatal depression | not reported | |||||
| Induction of labour | not reported | |||||
| Later development of cardiovascular disease | not reported | |||||
| 1 One study with design limitations. 2 Wide confidence interval crossing the line of no effect, few events and small sample size. | ||||||
| Tight versus moderate glycaemic control (FBG target ≤ 5.6 mmol/L versus 5.6 to 6.7 mmol/L) ‐ Infant outcomes | ||||||
| Patient or population: pregnant women with pre‐existing type 1 diabetes | ||||||
| Outcomes | Anticipated absolute effects* (95% CI) | Relative effect | No. of participants | Quality of the evidence | Comments | |
| Risk with moderate glycaemic control | Risk with tight glycaemic control | |||||
| Large‐for‐gestational age (birthweight > 90th centile) | Study population | not estimable | 45 | ⊕⊝⊝⊝ | FBG target ≤ 5.6 versus 5.6 to 6.7 mmol/L | |
| 0 per 1000 | 0 per 1000 | |||||
| Perinatal mortality | Study population | not estimable | 45 | ⊕⊝⊝⊝ | FBG target ≤ 5.6 versus 5.6 to 6.7 mmol/L | |
| 0 per 1000 | 0 per 1000 | |||||
| Serious perinatal morbidity | not reported | |||||
| Neonatal hypoglycaemia | not reported | |||||
| Childhood/adulthood adiposity | not reported | |||||
| Childhood/adulthood diabetes | not reported | |||||
| Childhood/adulthood neurosensory disability | not reported | |||||
| *The risk in the intervention group (and its 95% confidence interval) is based on the assumed risk in the comparison group and the relative effect of the intervention (and its 95% CI). | ||||||
| GRADE Working Group grades of evidence | ||||||
| 1 One study with design limitations. 2 No events & small sample size. | ||||||
| Tight‐moderate versus loose glycaemic control (FBG ≤ 6.7 mmol/L versus 6.7 to 8.9 mmol/L) ‐ Maternal outcomes | ||||||
| Patient or population: pregnant women with pre‐existing type 1 diabetes | ||||||
| Outcomes | Anticipated absolute effects* (95% CI) | Relative effect | No. of participants | Quality of the evidence | Comments | |
| Risk with loose glycaemic control (mother) | Risk with Tight‐moderate | |||||
| Pre‐eclampsia | Study population | RR 0.11 | 60 | ⊕⊕⊝⊝ | FBG target ≤ 6.7 mmol/L versus 6.7 to 8.9 mmol/L | |
| 200 per 1000 | 22 per 1000 | |||||
| Caesarean section | Study population | RR 0.28 | 60 | ⊕⊕⊝⊝ | FBG target ≤ 6.7 versus 6.7 to 8.9 mmol/L | |
| 400 per 1000 | 112 per 1000 | |||||
| Perineal trauma | not reported | |||||
| Gestational weight gain | not reported | |||||
| Postnatal depression | not reported | |||||
| Induction of labour | not reported | |||||
| Later development of cardiovascular disease | not reported | |||||
| *The risk in the intervention group (and its 95% confidence interval) is based on the assumed risk in the comparison group and the relative effect of the intervention (and its 95% CI). | ||||||
| GRADE Working Group grades of evidence | ||||||
| 1 One study with design limitations. 2 Few events and small sample size. 3 Small sample size. | ||||||
| Tight‐moderate versus loose glycaemic control (FBG ≤ 6.7 mmol/L versus 6.7 to 8.9 mmol/L) ‐ Infant outcomes | ||||||
| Patient or population: pregnant women with pre‐existing type 1 diabetes | ||||||
| Outcomes | Anticipated absolute effects* (95% CI) | Relative effect | No. of participants | Quality of the evidence | Comments | |
| Risk with loose glycaemic control | Risk with tight‐moderate glycaemic control | |||||
| Large‐for‐gestational age (birthweight > 90th centile) | Study population | RR 0.01 | 60 | ⊕⊕⊝⊝ | FBG target ≤ 6.7 versus 6.7 to 8.9 mmol/L | |
| 867 per 1000 | 9 per 1000 | |||||
| Perinatal mortality | Study population | RR 0.07 | 60 | ⊕⊝⊝⊝ | FBG target ≤ 6.7 versus 6.7 to 8.9 mmol/L | |
| 133 per 1000 | 9 per 1000 | |||||
| Serious perinatal morbidity | not reported | |||||
| Neonatal hypoglycaemia | not reported | |||||
| Childhood/adulthood adiposity | not reported | |||||
| Childhood/adulthood diabetes | not reported | |||||
| Childhood/adulthood neurosensory disability | not reported | |||||
| *The risk in the intervention group (and its 95% confidence interval) is based on the assumed risk in the comparison group and the relative effect of the intervention (and its 95% CI). | ||||||
| GRADE Working Group grades of evidence | ||||||
| 1 One study with design limitations. 2 Small sample size. 3 Wide confidence interval crossing the line of no effect, few events and small sample size. | ||||||
| Outcome or subgroup title | No. of studies | No. of participants | Statistical method | Effect size |
| 1 Caesarean section Show forest plot | 1 | 22 | Risk Ratio (M‐H, Fixed, 95% CI) | 0.92 [0.49, 1.73] |
| 1.1 FBG target 3.33 to 5.0 vs 5.27 to 6.38 mmol/L | 1 | 22 | Risk Ratio (M‐H, Fixed, 95% CI) | 0.92 [0.49, 1.73] |
| 2 Perinatal mortality Show forest plot | 1 | 22 | Risk Ratio (M‐H, Fixed, 95% CI) | 0.0 [0.0, 0.0] |
| 2.1 FBG target 3.33 to 5.0 vs 5.27 to 6.38 mmol/L | 1 | 22 | Risk Ratio (M‐H, Fixed, 95% CI) | 0.0 [0.0, 0.0] |
| 3 Serious perinatal morbidity Show forest plot | 1 | 22 | Risk Ratio (M‐H, Fixed, 95% CI) | 0.0 [0.0, 0.0] |
| 3.1 FBG target 3.33 to 5.0 vs 5.27 to 6.38 mmol/L | 1 | 22 | Risk Ratio (M‐H, Fixed, 95% CI) | 0.0 [0.0, 0.0] |
| 4 Congenital fetal anomaly Show forest plot | 1 | 22 | Risk Ratio (M‐H, Fixed, 95% CI) | 3.57 [0.19, 66.61] |
| 4.1 FBG target 3.33 to 5.0 vs 5.27 to 6.38 mmol/L | 1 | 22 | Risk Ratio (M‐H, Fixed, 95% CI) | 3.57 [0.19, 66.61] |
| 5 Pregnancy‐induced hypertension Show forest plot | 1 | 137 | Risk Ratio (M‐H, Fixed, 95% CI) | 1.40 [0.60, 3.25] |
| 5.1 FBG target < 4.44 vs < 5.55 mmol/L | 1 | 137 | Risk Ratio (M‐H, Fixed, 95% CI) | 1.40 [0.60, 3.25] |
| 6 Chronic hypertension: not prespecified Show forest plot | 1 | 22 | Risk Ratio (M‐H, Fixed, 95% CI) | 0.0 [0.0, 0.0] |
| 6.1 FBG target 3.33 to 5.0 mmol/L vs 5.27 to 6.38 mmol/L | 1 | 22 | Risk Ratio (M‐H, Fixed, 95% CI) | 0.0 [0.0, 0.0] |
| 7 Glycaemic control ‐ Self‐monitored blood glucose (mean, mmol/L) Show forest plot | 1 | Mean Difference (IV, Fixed, 95% CI) | Subtotals only | |
| 7.1 FBG target 3.33 to 5.0 vs 5.27 to 6.38 mmol/L: first trimester | 1 | 22 | Mean Difference (IV, Fixed, 95% CI) | ‐1.23 [‐2.19, ‐0.27] |
| 7.2 FBG target 3.33 to 5.0 vs 5.27 to 6.38 mmol/L: second trimester | 1 | 22 | Mean Difference (IV, Fixed, 95% CI) | ‐0.99 [‐1.64, ‐0.34] |
| 7.3 FBG target 3.33 to 5.0 vs 5.27 to 6.38 mmol/L: third trimester | 1 | 22 | Mean Difference (IV, Fixed, 95% CI) | ‐0.66 [‐1.60, 0.28] |
| 8 Glycaemic control ‐ Self‐monitored blood glucose tests/day Show forest plot | 1 | 22 | Mean Difference (IV, Fixed, 95% CI) | 1.60 [‐0.15, 3.35] |
| 8.1 FBG target 3.33 to 5.0 vs 5.27 to 6.39 mmol/L | 1 | 22 | Mean Difference (IV, Fixed, 95% CI) | 1.60 [‐0.15, 3.35] |
| 9 Glycaemic control ‐ HbA1c (%): first trimester Show forest plot | 2 | Mean Difference (IV, Fixed, 95% CI) | Subtotals only | |
| 9.1 FBG target 3.33 to 5.0 vs 5.27 to 6.38 mmol/L | 1 | 22 | Mean Difference (IV, Fixed, 95% CI) | ‐1.20 [‐2.25, ‐0.15] |
| 9.2 FBG target < 4.44 vs < 5.55 mmol/L | 1 | 137 | Mean Difference (IV, Fixed, 95% CI) | 0.0 [‐0.62, 0.62] |
| 10 Glycaemic control ‐ HbA1c (%): second trimester Show forest plot | 2 | Mean Difference (IV, Fixed, 95% CI) | Subtotals only | |
| 10.1 FBG target 3.33 to 5.0 vs 5.27 to 6.38 mmol/L | 1 | 22 | Mean Difference (IV, Fixed, 95% CI) | ‐0.5 [‐1.09, 0.09] |
| 10.2 FBG target < 4.44 vs < 5.55 mmol/L | 1 | 137 | Mean Difference (IV, Fixed, 95% CI) | 0.10 [‐0.37, 0.57] |
| 11 Glycaemic control ‐ HbA1c (%): third trimester Show forest plot | 2 | Mean Difference (IV, Fixed, 95% CI) | Subtotals only | |
| 11.1 FBG target 3.33 to 5.0 vs 5.27 to 6.38 mmol/L | 1 | 22 | Mean Difference (IV, Fixed, 95% CI) | ‐0.30 [‐0.92, 0.32] |
| 11.2 FBG target < 4.44 vs < 5.55 mmol/L | 1 | 137 | Mean Difference (IV, Fixed, 95% CI) | ‐0.10 [‐0.49, 0.29] |
| 12 Glycaemic control ‐ Mean preprandial glucose (mmol/L) Show forest plot | 1 | Mean Difference (IV, Fixed, 95% CI) | Subtotals only | |
| 12.1 FBG target < 4.44 vs < 5.55 mmol/L: first trimester | 1 | 137 | Mean Difference (IV, Fixed, 95% CI) | ‐0.39 [‐1.33, 0.55] |
| 12.2 FBG target < 4.44 vs < 5.55 mmol/L: second trimester | 1 | 137 | Mean Difference (IV, Fixed, 95% CI) | ‐0.27 [‐1.19, 0.65] |
| 12.3 FBG target < 4.44 vs < 5.55 mmol/L: third trimester | 1 | 137 | Mean Difference (IV, Fixed, 95% CI) | ‐0.34 [‐1.40, 0.72] |
| 13 Glycaemic control ‐ Mean postprandial glucose (mmol/L) Show forest plot | 1 | Mean Difference (IV, Fixed, 95% CI) | Subtotals only | |
| 13.1 FBG target < 4.44 vs < 5.55 mmol/L: first trimester | 1 | 137 | Mean Difference (IV, Fixed, 95% CI) | ‐0.94 [‐2.05, 0.17] |
| 13.2 FBG target < 4.44 vs < 5.55 mmol/L: second trimester | 1 | 137 | Mean Difference (IV, Fixed, 95% CI) | ‐0.56 [‐1.38, 0.26] |
| 13.3 FBG target < 4.44 vs < 5.55 mmol/L: third trimester | 1 | 137 | Mean Difference (IV, Fixed, 95% CI) | ‐0.11 [‐1.26, 1.04] |
| 14 Glycaemic control ‐ Below FBG threshold (% days) Show forest plot | 1 | Mean Difference (IV, Fixed, 95% CI) | Subtotals only | |
| 14.1 < 3.33 mmol/L | 1 | 22 | Mean Difference (IV, Fixed, 95% CI) | 20.0 [7.00, 33.00] |
| 14.2 < 2.78 mmol/L | 1 | 22 | Mean Difference (IV, Fixed, 95% CI) | 17.0 [4.04, 29.96] |
| 14.3 < 2.22 mmol/L | 1 | 22 | Mean Difference (IV, Fixed, 95% CI) | 8.0 [‐3.56, 19.56] |
| 15 Hypoglycaemic episodes ‐ > 1 subjective (% of days): not prespecified Show forest plot | 1 | 22 | Mean Difference (IV, Fixed, 95% CI) | 22.0 [11.07, 32.93] |
| 15.1 FBG target 3.33 to 5.0 vs 5.27 to 6.38 mmol/L | 1 | 22 | Mean Difference (IV, Fixed, 95% CI) | 22.0 [11.07, 32.93] |
| 16 Gestational weight gain (kg/week) Show forest plot | 1 | 22 | Mean Difference (IV, Fixed, 95% CI) | 0.02 [‐0.23, 0.27] |
| 16.1 FBG target 3.3 to 5.0 vs 5.27 to 6.38 mmol/L | 1 | 22 | Mean Difference (IV, Fixed, 95% CI) | 0.02 [‐0.23, 0.27] |
| 17 Fetal distress: not prespecified Show forest plot | 1 | 137 | Risk Ratio (M‐H, Fixed, 95% CI) | 1.15 [0.63, 2.11] |
| 17.1 FBG target < 4.44 vs < 5.55 mmol/L | 1 | 137 | Risk Ratio (M‐H, Fixed, 95% CI) | 1.15 [0.63, 2.11] |
| 18 Gestational age at birth (weeks) Show forest plot | 2 | 159 | Mean Difference (IV, Fixed, 95% CI) | 0.43 [‐0.23, 1.08] |
| 18.1 FBG target 3.33 to 5.0 vs 5.27 to 6.38 mmol/L | 1 | 22 | Mean Difference (IV, Fixed, 95% CI) | ‐0.30 [‐2.44, 1.84] |
| 18.2 FBG target < 4.44 vs < 5.55 mmol/L | 1 | 137 | Mean Difference (IV, Fixed, 95% CI) | 0.5 [‐0.19, 1.19] |
| 19 Birthweight (g) Show forest plot | 2 | 159 | Mean Difference (IV, Fixed, 95% CI) | ‐2.62 [‐179.83, 174.59] |
| 19.1 FBG target 3.33 to 5.0 vs 5.27 to 6.38 mmol/L | 1 | 22 | Mean Difference (IV, Fixed, 95% CI) | ‐272.0 [‐803.99, 259.99] |
| 19.2 FBG target < 4.44 vs < 5.55 mmol/L | 1 | 137 | Mean Difference (IV, Fixed, 95% CI) | 31.0 [‐156.95, 218.95] |
| 20 Apgar score Show forest plot | 1 | Risk Ratio (M‐H, Fixed, 95% CI) | Subtotals only | |
| 20.1 < 7 at 1 minute: FBG target < 4.44 vs < 5.55 mmol/L | 1 | 137 | Risk Ratio (M‐H, Fixed, 95% CI) | 1.01 [0.40, 2.55] |
| 20.2 < 7 at 5 minutes: FBG target < 4.44 vs < 5.55 mmol/L | 1 | 137 | Risk Ratio (M‐H, Fixed, 95% CI) | 0.0 [0.0, 0.0] |
| 21 Asphyxia: not prespecified Show forest plot | 1 | 137 | Risk Ratio (M‐H, Fixed, 95% CI) | 1.01 [0.58, 1.78] |
| 21.1 FBG target < 4.44 vs < 5.55 mmol/L | 1 | 137 | Risk Ratio (M‐H, Fixed, 95% CI) | 1.01 [0.58, 1.78] |
| 22 Neonatal hypocalcaemia Show forest plot | 1 | 137 | Risk Ratio (M‐H, Fixed, 95% CI) | 0.55 [0.30, 1.03] |
| 22.1 FBG target < 4.44 vs < 5.55 mmol/L | 1 | 137 | Risk Ratio (M‐H, Fixed, 95% CI) | 0.55 [0.30, 1.03] |
| 23 Neonatal hypomagnesaemia: not prespecified Show forest plot | 1 | 127 | Risk Ratio (M‐H, Fixed, 95% CI) | 0.65 [0.25, 1.68] |
| 23.1 FBG target < 4.44 vs < 5.55 mmol/L | 1 | 127 | Risk Ratio (M‐H, Fixed, 95% CI) | 0.65 [0.25, 1.68] |
| 24 Maternal hospitalisation (days) Show forest plot | 1 | 137 | Mean Difference (IV, Fixed, 95% CI) | 10.60 [9.53, 11.67] |
| 24.1 FBG target < 4.44 vs < 5.55 mmol/L | 1 | 137 | Mean Difference (IV, Fixed, 95% CI) | 10.60 [9.53, 11.67] |
| Outcome or subgroup title | No. of studies | No. of participants | Statistical method | Effect size |
| 1 Pre‐eclampsia Show forest plot | 1 | 45 | Risk Ratio (M‐H, Fixed, 95% CI) | 5.29 [0.23, 122.91] |
| 1.1 FBG target ≤ 5.6 mmol/L vs 5.6 to 6.7 mmol/L | 1 | 45 | Risk Ratio (M‐H, Fixed, 95% CI) | 5.29 [0.23, 122.91] |
| 2 Caesarean section Show forest plot | 1 | 45 | Risk Ratio (M‐H, Fixed, 95% CI) | 1.21 [0.22, 6.50] |
| 2.1 FBG target ≤ 5.6 vs 5.6 to 6.7 mmol/L | 1 | 45 | Risk Ratio (M‐H, Fixed, 95% CI) | 1.21 [0.22, 6.50] |
| 3 Perinatal mortality Show forest plot | 1 | 45 | Risk Ratio (M‐H, Fixed, 95% CI) | 0.0 [0.0, 0.0] |
| 3.1 FBG target ≤ 5.6 vs 5.6 to 6.7 mmol/L | 1 | 45 | Risk Ratio (M‐H, Fixed, 95% CI) | 0.0 [0.0, 0.0] |
| 4 Transient maternal hypertension Show forest plot | 1 | 45 | Risk Ratio (M‐H, Fixed, 95% CI) | 0.59 [0.03, 13.66] |
| 4.1 FBG target ≤ 5.6 vs 5.6 to 6.7 mmol/L | 1 | 45 | Risk Ratio (M‐H, Fixed, 95% CI) | 0.59 [0.03, 13.66] |
| 5 Hypoglycaemic epispodes ‐ first half of pregnancy: not prespecified Show forest plot | 1 | 45 | Risk Ratio (M‐H, Fixed, 95% CI) | 26.47 [1.61, 435.38] |
| 5.1 FBG target ≤ 5.6 vs 5.6 to 6.7 mmol/L | 1 | 45 | Risk Ratio (M‐H, Fixed, 95% CI) | 26.47 [1.61, 435.38] |
| 6 Large‐for‐gestational age (birthweight > 90th centile) Show forest plot | 1 | 45 | Risk Ratio (M‐H, Fixed, 95% CI) | 0.0 [0.0, 0.0] |
| 6.1 FBG target ≤ 5.6 vs 5.6 to 6.7 mmol/L | 1 | 45 | Risk Ratio (M‐H, Fixed, 95% CI) | 0.0 [0.0, 0.0] |
| 7 Respiratory distress syndrome Show forest plot | 1 | 45 | Risk Ratio (M‐H, Fixed, 95% CI) | 0.91 [0.09, 9.24] |
| 7.1 FBG target ≤ 5.6 v 5.6 to 6.7 mmol/L | 1 | 45 | Risk Ratio (M‐H, Fixed, 95% CI) | 0.91 [0.09, 9.24] |
| Outcome or subgroup title | No. of studies | No. of participants | Statistical method | Effect size |
| 1 Pre‐eclampsia Show forest plot | 1 | 60 | Risk Ratio (M‐H, Fixed, 95% CI) | 0.11 [0.01, 0.99] |
| 1.1 FBG ≤ 6.7 mmol/L vs 6.7 to 8.9 mmol/L | 1 | 60 | Risk Ratio (M‐H, Fixed, 95% CI) | 0.11 [0.01, 0.99] |
| 2 Caesarean section Show forest plot | 1 | 60 | Risk Ratio (M‐H, Fixed, 95% CI) | 0.28 [0.10, 0.78] |
| 2.1 FBG target ≤ 6.7 vs 6.7 to 8.9 mmol/L | 1 | 60 | Risk Ratio (M‐H, Fixed, 95% CI) | 0.28 [0.10, 0.78] |
| 3 Perinatal mortality Show forest plot | 1 | 60 | Risk Ratio (M‐H, Fixed, 95% CI) | 0.07 [0.00, 1.37] |
| 3.1 FBG target ≤ 6.7 vs 6.7 to 8.9 mmol/L | 1 | 60 | Risk Ratio (M‐H, Fixed, 95% CI) | 0.07 [0.00, 1.37] |
| 4 Transient maternal hypertension Show forest plot | 1 | 45 | Risk Ratio (M‐H, Fixed, 95% CI) | 1.81 [0.12, 27.07] |
| 4.1 FBG target ≤ 6.7 vs 6.7 to 8.9 mmol/L | 1 | 45 | Risk Ratio (M‐H, Fixed, 95% CI) | 1.81 [0.12, 27.07] |
| 5 Hypoglycaemic episodes ‐ in first half of pregnancy: not prespecified Show forest plot | 1 | 60 | Risk Ratio (M‐H, Fixed, 95% CI) | 5.22 [0.32, 86.28] |
| 5.1 FBG target ≤ 6.7 vs 6.7 to 8.9 mmol/L | 1 | 60 | Risk Ratio (M‐H, Fixed, 95% CI) | 5.22 [0.32, 86.28] |
| 6 Large‐for‐gestational age (birthweight > 90th centile) Show forest plot | 1 | 60 | Risk Ratio (M‐H, Fixed, 95% CI) | 0.01 [0.00, 0.20] |
| 6.1 FBG target ≤ 6.7 vs 6.7 to 8.9 mmol/L | 1 | 60 | Risk Ratio (M‐H, Fixed, 95% CI) | 0.01 [0.00, 0.20] |
| 7 Respiratory distress syndrome Show forest plot | 1 | 60 | Risk Ratio (M‐H, Fixed, 95% CI) | 0.17 [0.05, 0.59] |
| 7.1 FBG target ≤ 6.7 vs 6.7 to 8.9 mmol/L | 1 | 60 | Risk Ratio (M‐H, Fixed, 95% CI) | 0.17 [0.05, 0.59] |