Tratamiento combinado con artemisinina para el tratamiento del paludismo por Plasmodium vivax no complicado
Referencias
References to studies included in this review
References to studies excluded from this review
References to studies awaiting assessment
Additional references
Characteristics of studies
Characteristics of included studies [ordered by study ID]
| Methods | Trial design: A 3‐arm randomized controlled trial (RCT) Follow‐up: Temperature and blood smears daily until clearance of fever and parasites, then weekly attendance until day 63 Adverse event monitoring: Adverse events defined as signs or symptoms that occurred or became more severe after treatment started | |
| Participants | Number: 32 participants had P. vivax parasitaemia at baseline in treatment groups included in this review, all were co‐infections with P. falciparum (530 randomized in total) Inclusion criteria: Age 1 to 65 yrs, symptomatic P. falciparum parasitaemia, informed consent Exclusion criteria: Pregnancy or lactation, signs or symptoms of severe malaria, > 4% of red blood cells parasitized, contraindication to mefloquine, treatment with mefloquine in the previous 60 days | |
| Interventions | 1. Dihydroartemisinin‐piperaquine, fixed‐dose combination: 40 mg/320 mg (Artekin: Holleykin)
2. Artesunate plus mefloquine, loose combination (Artesunate: Guilin, Mequin: Atlantic)
All doses supervised Primaquine was not given | |
| Outcomes |
Not included in this review:
| |
| Notes | Country: Thailand Setting: 4 rural clinics on the Thai‐Myanmar border Transmission: Low and unstable Resistance: CQ resistance amongst P. vivax has not been widely reported in Thailand Dates: Jul 2002 to Apr 2003 Funding: Wellcome Trust of Great Britain. DHA‐P supplied by Holleykin Pharmaceutical. | |
| Risk of bias | ||
| Bias | Authors' judgement | Support for judgement |
| Random sequence generation (selection bias) | Low risk | 'The randomisation was computer generated (STATA; version 7; Statacorp)'. Randomized in blocks of 9. |
| Allocation concealment (selection bias) | Low risk | 'The treatment allocation was concealed in sealed envelopes labelled with the study code'. |
| Blinding (performance bias and detection bias) | Low risk | 'Laboratory staff reading the blood smears had no knowledge of the treatment received'. No other blinding described. |
| Incomplete outcome data (attrition bias) | High risk | The included sample size was very low. Although attrition was low in absolute numbers they represent up to 50% of the P. vivax patients. |
| Selective reporting (reporting bias) | Low risk | No evidence of selective reporting. |
| Other bias | High risk | For the purpose of this review we are including only a small subset of the original randomized patients. This sample may not therefore be truly randomized and the small sample size means that prognostic balance between groups is unlikely. |
| Methods | Trial design: A 3‐arm RCT Follow‐up: Temperature and blood smears daily until clearance of fever and parasites, then weekly attendance for examination, symptom enquiry, malaria smear and hematocrit until day 63 Adverse event monitoring: Adverse events defined as signs or symptoms that occurred or became more severe after treatment started. Symptoms were screened at each visit | |
| Participants | Number: 47 participants had P. vivax parasitaemia at baseline and are included in this review (499 randomized in total). Inclusion criteria: Age 1 to 65 yrs, symptomatic P. falciparum infection (only mixed infections included in this review), informed consent Exclusion criteria: Pregnancy or lactation, signs or symptoms of severe malaria, > 4% of red blood cells parasitized, treatment with mefloquine in the previous 60 days | |
| Interventions | 1. Dihydroartemisinin‐piperaquine, fixed‐dose combination: 40 mg/320 mg (Artekin: Holleykin)
2. Dihydroartemisinin‐piperaquine, fixed‐dose combination: 40 mg/320 mg (Artekin: Holleykin)
3. Artesunate plus mefloquine, loose combination (Artesunate: Guilin, Mequin: Atlantic)
All doses supervised Primaquine was not given | |
| Outcomes |
Not included in this review:
| |
| Notes | Country: Thailand Setting: 4 clinics on the Thai‐Myanmar border Transmission: Low and unstable Resistance: CQ resistance amongst P. vivax has not been widely reported in Thailand Dates: Apr 2003 to Apr 2004 Funding: Medicines for Malaria Venture, Wellcome Trust of Great Britain | |
| Risk of bias | ||
| Bias | Authors' judgement | Support for judgement |
| Random sequence generation (selection bias) | Low risk | 'The randomisation list was generated using STATA; version 7 (Stata)'. Randomized in blocks of 9. |
| Allocation concealment (selection bias) | Low risk | 'The treatment allocation was concealed in sealed envelopes labelled with the study code'. |
| Blinding (performance bias and detection bias) | Low risk | 'Laboratory staff reading the blood smears had no knowledge of the treatment received'. No other blinding described. |
| Incomplete outcome data (attrition bias) | Low risk | The included sample size is very low. Attrition is low in absolute numbers and unlikely to have introduced significant bias. |
| Selective reporting (reporting bias) | Low risk | No evidence of selective reporting. |
| Other bias | High risk | For the purpose of this review we are including only a small subset of the original randomized patients. This sample may not therefore be truly randomized and the small sample size means that prognostic balance between groups is unlikely. |
| Methods | Trial design: An open‐label RCT Follow‐up: Clinical assessment, blood smears and haemoglobin on days 0 to 3 then weekly until day 56 Adverse event monitoring: Astandard symptom questionnaire at each visit | |
| Participants | Number: 536 randomized Inclusion criteria: Febrile patients aged > 3 months, slide confirmed P. vivax mono‐infection, a negative pregnancy test, informed consent Exclusion criteria: Pregnancy or lactation, clinical or laboratory features of severe malaria, haemoglobin < 7 g/dL, concomitant disease that would mask treatment responses, known allergy to study drugs, antimalarial treatment in the past month, anticipated inability or unwillingness to complete the 56 day follow‐up | |
| Interventions | 1. Dihydroartemisinin‐piperaquine, fixed‐dose combination: 40 mg/320 mg (Artekin: Holleypharm)
2. Chloroquine (IDA)
All doses supervised Primaquine was not given | |
| Outcomes |
Not included in this review:
| |
| Notes | Country: Afghanistan Setting: 3 provincial malaria control centres, one in the east and two in the north Transmission: Seasonal Resistance: CQ resistance amongst P. vivax has not been widely reported in Afghanistan Dates: Jul 2007 to Feb 2009 Funding: Mahidol‐Oxford Research Unit, Thailand International Development and Cooperation Agnecy, UK MRC Clinical Science Fellowship, Wellcome Trust of Great Britain | |
| Risk of bias | ||
| Bias | Authors' judgement | Support for judgement |
| Random sequence generation (selection bias) | Low risk | 'a pre‐generated randomization list made in blocks of 20 that was produced and held independently of the field teams by a statistician'. |
| Allocation concealment (selection bias) | Low risk | 'The individual allocations were kept in sealed opaque envelopes and opened only after enrolment'. |
| Blinding (performance bias and detection bias) | Low risk | 'Patients and clinical field workers were not blinded to the treatment arm after allocation. Microscopists were blinded to treatment allocation at follow‐up examinations'. |
| Incomplete outcome data (attrition bias) | Low risk | Losses to follow‐up were low: 25/268 (9.3%) DHA‐P versus 13/268 (4.9%) CQ. |
| Selective reporting (reporting bias) | Low risk | No evidence of selective reporting. |
| Other bias | Low risk | No other bias detected. |
| Methods | Trial design: An open label RCT Follow‐up: Daily until fever and parasites cleared then weekly until day 42, for a physical examination, a symptom questionnaire and malaria film. Haemoglobin measured on days 0, 7, 28 and day of failure. Adverse event monitoring: Assessed at each follow‐up visit | |
| Participants | Number: 114 had P. vivax parasitaemia at baseline (340 randomized in total) Inclusion criteria: Age > 1 yr, weight > 5 kg, slide confirmed malaria (P. falciparum, P. vivax or both), fever or history of fever in the preceding 48 hours Exclusion criteria: Pregnancy or lactation, danger signs or signs of severe malaria, > 4% red blood cells parasitized, concomitant disease that required hospital admission | |
| Interventions | 1. Dihydroartemisinin‐piperaquine, fixed‐dose combination:40 mg/320 mg (Artekin: Holley)
2. Artesunate plus amodiaquine, loose combination (Arsumax: Guilin, Flavoquine: Aventis)
All doses supervised Both groups were offered an unsupervised course of Primaquine 0.3mg base/kg for 14 days, on completion of the study regimen | |
| Outcomes |
Not included in the review:
| |
| Notes | Country: Indonesia Setting: Rural clinics Transmission: High Resistance: CQ resistance among P. vivax is high at this study site Dates: Jul 2005 to Dec 2005 Funding: Wellcome Trust ‐ National Health and Medical Research Council | |
| Risk of bias | ||
| Bias | Authors' judgement | Support for judgement |
| Random sequence generation (selection bias) | Low risk | 'A randomisation list was generated in blocks of 20 by an independent statistician'. |
| Allocation concealment (selection bias) | Low risk | 'Treatment allocation concealed in an opaque, sealed envelope that was opened once the patient had been enrolled'. |
| Blinding (performance bias and detection bias) | Low risk | 'All slides were read by a certified microscopist who was blinded to treatment allocation'. An open label trial. |
| Incomplete outcome data (attrition bias) | High risk | The primary outcome data are unpublished data including only participants with P. vivax mono‐infection at baseline. Attrition although balanced between groups was > 15% at day 28 and > 20% at day 42. |
| Selective reporting (reporting bias) | Low risk | No evidence of selective reporting. |
| Other bias | Low risk | No other bias detected. |
| Methods | Trial design: An open‐label RCT Follow‐up: Examination and malaria film daily until fever and parasites cleared then weekly to day 42 or any other day they became unwell Adverse event monitoring: At each visit a questionnaire on adverse events was completed | |
| Participants | Number: 24 participants had P. vivax co‐infections at baseline (490 randomized) Inclusion criteria: Weight > 10 kg, slide confirmed P. falciparum +/‐ P. vivax, informed consent Exclusion criteria: Pregnancy, clinical or laboratory signs of severe illness and/or severe and complicated malaria severe malaria, treatment with mefloquine in previous 63 days | |
| Interventions | 1. Artemether‐lumefantrine, fixed dose combination, 20 mg/120 mg tablets (Coartem: Novartis)
2. Artesunate plus mefloquine, loose combination (Artesunate: Guilan, Lariam: Hoffman‐La Roche)
All doses supervised Primaquine not given | |
| Outcomes |
Not included in the review:
| |
| Notes | Country: Thailand Setting: Malaria clinics of the Shoklo Malaria Research Unit Transmission: Low and unstable Resistance: CQ resistance amongst P. vivax has not been widely reported in Thailand Dates: July 2001 to June 2002 Funding: Wellcome Trust of Great Britain | |
| Risk of bias | ||
| Bias | Authors' judgement | Support for judgement |
| Random sequence generation (selection bias) | Low risk | 'Computerized randomisation was in blocks of ten'. |
| Allocation concealment (selection bias) | Unclear risk | None described. |
| Blinding (performance bias and detection bias) | Unclear risk | An open label trial. No comment on blinding of laboratory staff. |
| Incomplete outcome data (attrition bias) | Low risk | The included sample size is very low. Attrition was low in absolute numbers and unlikely to have significantly biased the result. |
| Selective reporting (reporting bias) | Low risk | No evidence of selective reporting. |
| Other bias | High risk | For the purpose of this review we are including only a small subset of the original randomized patients. This sample may not therefore be truly randomized and the small sample size means that prognostic balance between groups is unlikely. |
| Methods | Trial design: A 4‐arm open label RCT Follow‐up: Standardized follow‐up including temperature and malaria film on days 0, 1, 2, 3, 7, 14, 28, and 42. Drug levels assayed on day 7. Adverse event monitoring: None described | |
| Participants | Number: 195 had P. vivax parasitaemia at baseline (372 randomized in total) Inclusion criteria: Age 0.5 to 5 years, axillary temp > 37.5 ºC or history of fever in the preceding 24 hours, > 1000/µL asexual P. falciparum or > 250/µL asexual P. vivax, P. ovale or P. malariae, informed consent Exclusion criteria: Features of severe malaria, evidence of another infection or coexisting condition including malnutrition, intake of study drug in previous 14 days | |
| Interventions | 1. Artesunate plus sulphadoxine‐pyrimethamine, loose combination (Sanofi‐Aventis, Roche)
2. Dihydroartemisinin‐piperaquine, fixed dose combination: 40 mg/320 mg (Beijing Holley‐Cotec)
3. Artemether‐lumefantrine, fixed dose combination, 20 mg/120 mg (Novartis), given with milk
4. Chloroquine plus sulphadoxine‐pyrimethamine, loose combination (Aspen Healthcare, Roche)
All doses supervised except the evening dose of AL6 Primaquine was not given | |
| Outcomes |
Not included in this review:
| |
| Notes | Country: Papua New Guinea Setting: Health centres Transmission: High Resistance: CQ resistance among P. vivax rising since 1980s Dates: Apr 2005 to Jul 2007 Funding: WHO Western Pacific Region, Rotary against Malaria in Papua New Guinea, National Health and Medical Research Council of Australia | |
| Risk of bias | ||
| Bias | Authors' judgement | Support for judgement |
| Random sequence generation (selection bias) | Low risk | 'Computer‐generated randomised assignment with blocks of 24 for each site'. |
| Allocation concealment (selection bias) | Low risk | Information from authors ‐ allocation was concealed in sealed opaque envelopes. |
| Blinding (performance bias and detection bias) | Low risk | 'All blood smears were subsequently reexamined independently by two skilled microscopists who were unaware of the treatment assignments'. An open label trial. |
| Incomplete outcome data (attrition bias) | High risk | Attrition was high (> 10%) in all groups and could have introduced bias into the result. |
| Selective reporting (reporting bias) | Low risk | No evidence of selective reporting. |
| Other bias | Low risk | No other bias detected. |
| Methods | Trial design: An open label RCT Follow‐up: Clinical symptoms, temperature and malaria film recorded on days 0, 1, 2, 3, 7, 14, 28, 42 and when ill. PCV recorded on Day 0, and day 28 or day of failure Adverse event monitoring: None described | |
| Participants | Number: 190 randomized Inclusion criteria: Age > 2 years, Weight > 5 kg, microscopically confirmed P. vivax mono‐infection > 1 asexual parasite per 10 fields, informed consent Exclusion criteria: Pregnancy, severe malaria, evidence of concomitant infection or serious disease, recent use of antimalarial drugs, known allergy to study drugs | |
| Interventions | 1. Artesunate plus sulphadoxine‐pyrimethamine, loose combination (Plasmotrim, Mepha: Fansidar, Roche)
2. Chloroquine (Nivaquine; Beacon)
All doses supervised Primaquine was not given | |
| Outcomes |
| |
| Notes | Country: Afghanistan ‐ Jalalabad, Nangahar Province Setting: Malaria reference centre Transmission: Seasonal and unstable Resistance: Substantial CQ resistance has not been reported from Afghanistan (Author communication) Dates: Mar 2004 to Aug 2004 Funding: UNDP, World Bank, WHO Special Programme for Research on Tropical Disease | |
| Risk of bias | ||
| Bias | Authors' judgement | Support for judgement |
| Random sequence generation (selection bias) | Low risk | 'A computer‐generated randomisation list (generated using Microsoft Excel; Microsoft Corp., Redmond, WA, USA) was used to randomly assign vivax cases within gender and age groups to one of two treatment regimens'. |
| Allocation concealment (selection bias) | High risk | 'After determining suitability for inclusion, the study clinician enrolled each patient and allocated them to the treatment arm next indicated in the randomisation list. The allocation sequence was not concealed from the study clinician'. |
| Blinding (performance bias and detection bias) | Low risk | 'The clinical assistants responsible for directly observed treatment and clinical assessment during follow‐up were blind to the nature of the treatment arms but were aware of the arm code to which patients were allocated (e.g. ‘arm 1’, ‘arm 2’; differences in dosages and tablet appearance would not have allowed complete concealment). The microscopists and laboratory technicians were blind to treatment allocations'. |
| Incomplete outcome data (attrition bias) | Low risk | 10 participants were lost to follow‐up with similar numbers in each group. This is unlikely to have a major effect on the result. |
| Selective reporting (reporting bias) | Low risk | No evidence of selective reporting. |
| Other bias | Low risk | No other bias detected. |
| Methods | Trial design: An open label RCT Follow‐up: Admitted to hospital for 28 days. Temperature and malaria film recorded every 12 hours until parasite and fever clearance then on days 3, 7, 14, 21, and 28 Adverse event monitoring: None described | |
| Participants | Number: 98 randomized Inclusion criteria: Age > 15 years, Weight > 40 kg, microscopically confirmed P. vivax mono‐infection, informed consent Exclusion criteria: Pregnancy or lactation, severe malaria, concomitant febrile illness, severe malnutrition, ingestion of antimalarial drugs in the past 14 days, known allergy or intolerance to study drugs | |
| Interventions | 1. Artemether‐lumefantrine, fixed‐dose combination: 120/20 mg (Coartem, Novartis)
2. Chloroquine (Government Pharmaceutical Organisation)
All doses supervised Both regimens received additional primaquine (Government Pharmaceutical Organization)
| |
| Outcomes |
| |
| Notes | Country: Thailand Setting: Bangkok Hospital for Tropical Diseases Transmission: Low endemicity Resistance: CQ resistance amongst P. vivax has not been widely reported in Thailand Dates: Jun 2004 to May 2005 Funding: WHO, Ministry of Health, Labor, and Welfare of Japan, and Mahidol University Research Grants. | |
| Risk of bias | ||
| Bias | Authors' judgement | Support for judgement |
| Random sequence generation (selection bias) | Unclear risk | 'The patients were randomly assigned', no further description. |
| Allocation concealment (selection bias) | Unclear risk | Not described. |
| Blinding (performance bias and detection bias) | Unclear risk | Not described. |
| Incomplete outcome data (attrition bias) | High risk | Participants lost to follow‐up were high in both groups ≈ 18%. |
| Selective reporting (reporting bias) | Low risk | No evidence of selective reporting. |
| Other bias | Low risk | No other bias detected. |
| Methods | Trial design: Assessor blind RCT Follow‐up: daily until afebrile and aparasitaemic and then weekly until day 63. Temperature, malaria film, hematocrit, and chloroquine plasma concentration at every visit. Adverse event monitoring: At each visit a symptom questionnaire was completed. | |
| Participants | Number: 500 randomized Incusion criteria: Age > 1 yr; Body weight > 5 kg; Microscopically confirmed monoinfection of P. vivax parasitaemia (> 5/500 WBC); Febrile (axillary temperature, > 37.5 °C) or had history of fever Exclusion criteria: Known hypersensitivity to the study drugs; intercurrent illness; pregnant, lactating; severely anaemic (hematocrit < 20%); received mefloquine in the past 60 days; received dihydroartemisinin piperaquine in the past 3 months | |
| Interventions | 1. Dihydroartemisinin‐piperaquine, fixed‐dose combination: 40 mg/320 mg (Duocotexin: Holley)
2. Chloroquine (Government Pharmaceutical Organization, Thailand)
All patients with normal G6PD were administered Primaquine at the target dose of 0.5 mg/kg/day for a period of 14 days at the end of the follow‐up period | |
| Outcomes | 1. Recurrence of P. vivax on day 28, 63 2. Fever clearance 3. Parasite clearance within 24, 48, 72, and 96 hours 4. Adverse events | |
| Notes | Country: Thailand‐Myanmar border Setting: Malaria Research Unit Clinic Transmission: low and seasonal Resistance: Decreased susceptibility to CQ in some isolates. Dates: Jan 2007 to Dec 2008 Funding: Holley Pharm; Wellcome Trust | |
| Risk of bias | ||
| Bias | Authors' judgement | Support for judgement |
| Random sequence generation (selection bias) | Low risk | 'Pateints were allocated to the treatment arms on a pre generated randomization list in blocks of 20'. |
| Allocation concealment (selection bias) | Low risk | 'The individual allocations were concealed in sealed envelopes and opened only after enrollment'. |
| Blinding (performance bias and detection bias) | Low risk | 'Patients and clinic workers were not blinded. Laboratory technicians were unaware of treatment allocation'. |
| Incomplete outcome data (attrition bias) | Low risk | 35 lost to follow‐up or excluded from analysis in the DHA‐P arm (14%) and 37(14.8%) lost to follow‐up or excluded from the chloroquine arm. |
| Selective reporting (reporting bias) | Low risk | No evidence of selective reporting. |
| Other bias | Low risk | No evidence of other bias. |
| Methods | Trial design: Double‐blind RCT Follow‐up: All participants were hospitalized for 3 days then seen for follow‐up at day 7, 14, 21, 28, 35, and 42. Adverse event monitoring: Monitored throughout the study, 12‐lead ECGs at day 0 2, 7, 14, and 42 if clinically indicated, laboratory tests at day 0, 3, 7, 28, and 42 if clinically indicated | |
| Participants | Number: 456 randomized Inclusion criteria: Age 3 to 60 years, weight 20 to 90 kg, uncomplicated P. vivax mono‐infection with a parasite density > 250 mL, fever or documented history of fever in the previous 24 hours Exclusion criteria: pregnancy or lactation, any other condition requiring hospitalisation; haemoglobin < 8 g/dL; hepatic or renal impairment; malnutrition; presence or history of clinically significant disorders; known hypersensitivity to study drugs; known active hepatitis A IgM, hepatitis B surface antigen, hepatitis C antibody or seropositive for HIV antibody; used an antimalarial within the previous two weeks; used an antibacterial with anti‐malarial activity within the previous two weeks | |
| Interventions | 1. Artesunate‐pyronaridine, fixed‐dose combination 60 mg/180 mg (Shin Poong)
2. Chloroquine tablets 155 mg (Shin Poong)
All doses supervised Primaquine was given for 14 days starting on day 28 | |
| Outcomes |
| |
| Notes | Country: 5 study sites in Cambodia, Thailand, India and Indonesia Setting: Local hospitals Transmission: Not stated Resistance: Not stated Dates: Mar 2007 to Mar 2008 Funding: Shin Poong Pharmaceutical Company, Seoul, Republic of Korea, and the Medicines for Malaria Venture, Geneva, Switzerland | |
| Risk of bias | ||
| Bias | Authors' judgement | Support for judgement |
| Random sequence generation (selection bias) | Low risk | 'A computer‐generated randomization scheme was provided by the sponsor'. |
| Allocation concealment (selection bias) | Low risk | 'Randomization numbers were assigned in ascending order to each subject according to the order recruited. The subject was allocated an individually numbered treatment pack, which contained sufficient tablets for 3 days’ therapy plus an overage bottle containing tablets in case the subject vomited the first dose'. |
| Blinding (performance bias and detection bias) | Low risk | 'Study drugs were administered on a double‐blind, double‐dummy basis. The investigator calculated the appropriate dose and study drug was administered by a different member of staff, designated by the investigator. All study investigators, laboratory technicians and patients were blind to treatment assignment. Active drugs and placebos were packaged similarly'. |
| Incomplete outcome data (attrition bias) | Low risk | Number of participants lost to follow‐up was low and balanced between groups: 4% AS‐Py versus 8% CQ. |
| Selective reporting (reporting bias) | Low risk | No evidence of selective reporting. |
| Other bias | High risk | 'The study sponsors were responsible for data collection, statistical analysis and interpretation'. |
| Methods | Trial design: An open‐label RCT Follow‐up: A symptom questionnaire, physical examination, malaria film and haemoglobin measurement daily until fever and parasites cleared then weekly to day 42 Adverse event monitoring: A symptom questionnaire at each visit | |
| Participants | Number: 175 had P. vivax parasitaemia at baseline (774 randomized in total) Inclusion criteria: Weight >10 kg, fever or a history of fever in the preceding 48 hrs, slide confirmed malaria (P. falciparum, P. vivax or mixed infections) Exclusion criteria: Pregnancy or lactation, danger signs or signs of severity, parasitaemia > 4%, concomitant disease requiring hospital admission | |
| Interventions | 1. Dihydroartemisinin‐piperaquine, fixed‐dose combination: 40 mg/320 mg (Artekin: Holleykin)
2. Artemether‐lumefantrine, fixed‐dose combination: 20 mg/120 mg (Coartem: Novartis)
Only the first dose of each day was supervised. All participants advised to take each dose with a biscuit or milk. All patients were also given primaquine
| |
| Outcomes |
Not included in the review:
| |
| Notes | Country: Indonesia Setting: Rural outpatient clinics Transmission: High Resistance: CQ resistance is high at this study site Dates: Jul 2004 to Jun 2005 Funding: Wellcome Trust UK and National Health and Medical Research Council Australia | |
| Risk of bias | ||
| Bias | Authors' judgement | Support for judgement |
| Random sequence generation (selection bias) | Low risk | 'A randomisation list was generated in blocks of 20 patients by an independent statistician'. |
| Allocation concealment (selection bias) | Low risk | 'Treatment allocation concealed in an opaque sealed envelope that was opened once the patient had been enrolled'. |
| Blinding (performance bias and detection bias) | Low risk | 'All slides were read by a certified microscopist with at least 10 years experience, who was blinded to treatment allocation'. No other blinding was conducted. |
| Incomplete outcome data (attrition bias) | High risk | The primary outcome data are unpublished data including only participants with P. vivax mono‐infection at baseline. Attrition although balanced between groups was >10% at day 28 and >15% at day 42. |
| Selective reporting (reporting bias) | Low risk | No evidence of selective reporting. |
| Other bias | Low risk | No other bias detected. |
| Methods | Trial design: A 4‐arm open‐label RCT Follow‐up: A symptom questionnaire, malaria film, and gametocyte count on days 0, 1, 2, 3, 7, 14, 21, 28, 35, and 42. Haemoglobin was measured on days 0 and 28. Adverse event monitoring: A symptom questionnaire at each visit | |
| Participants | Number: 87 patients had P. vivax parasitaemia at baseline (652 randomized in total) Inclusion criteria: Age > 1 year, axillary temperature > 37.5 ºC or history of fever in the previous 48 hours, P. falciparum mono‐infection 500 to 100,000 parasites/µL or co‐infection with P. vivax, informed consent Exclusion criteria: Pregnancy, signs of severe malaria, signs or symptoms of other diseases, history of taking mefloquine in the previous 2 months or any other antimalarial in the previous 48 hours, history of psychiatric disease | |
| Interventions | 1. Dihydroartemisinin‐piperaquine, fixed‐dose combination: 40 mg/320 mg (Artekin: Holleykin)
2. Dihydroartemisinin‐piperaquine, fixed‐dose combination: 40 mg/320 mg (Artekin: Holleykin)
3. Artesunate plus mefloquine, loose combination (artesunate: Guilin, Lariam: Hoffman‐La Roche)
4. Artesunate plus mefloquine, loose combination (artesunate: Guilin, Lariam: Hoffman‐La Roche)
Primaquine was not given | |
| Outcomes |
Not included in the review:
| |
| Notes | Country: Myanmar Setting: Rural village tracts Transmission: Low and seasonal Resistance: CQ resistance amongst P. vivax has not been widely reported in Myanmar Dates: Nov 2003 to Feb 2004 Funding: Médecins sans Frontières (Holland) | |
| Risk of bias | ||
| Bias | Authors' judgement | Support for judgement |
| Random sequence generation (selection bias) | Low risk | 'At both study locations three boxes were prepared, one for each of the three age groups, by an administrator who was otherwise not connected with the study. In each box, 40 unmarked and sealed opaque envelopes were deposited. Each envelope contained a card that described the treatment assignment, and each treatment allocation had an equal number of cards (ten). Each new patient (or his or her carer) was asked to take one of the envelopes from the box for their age group. Treatment was then dispensed in accordance with the treatment allocation in the envelope. Whenever a box became empty, another 40 envelopes were put in that box'. |
| Allocation concealment (selection bias) | Low risk | See above. |
| Blinding (performance bias and detection bias) | Unclear risk | An open label trial. No comment on blinding of laboratory staff. |
| Incomplete outcome data (attrition bias) | Low risk | The included sample size is low. Attrition is low in absolute numbers and unlikely to have introduced significant bias. |
| Selective reporting (reporting bias) | Low risk | No evidence of selective reporting. |
| Other bias | High risk | For the purpose of this review we are including only a small subset of the original randomized patients. This sample may not therefore be truly randomized and the small sample size means that prognostic balance between groups is unlikely. |
| Methods | Trial design: A 10‐arm RCT Follow‐up: Patients were asked to return weekly for 9 weeks for assessment and at any other time they were unwell. Haemoglobin was measured on days 0 and 63. Adverse event monitoring: Not described | |
| Participants | Number: 66 participants had P. vivax co‐infections at baseline and are included in this review. The participants who received the one‐off dose of primaquine are excluded from this review. Inclusion criteria: Age > 6 months, weight > 5 kg, P. falciparum mono‐infection 500 to 200,000 parasites/µL or co‐infection with P. vivax, informed consent Exclusion criteria: Pregnancy, signs of severe malaria, severe malnutrition, history of hypersensitivity to any of the study drugs, severe malnutrition, concomitant febrile illness, history of psychiatric disorder, a full course of mefloquine in the previous 9 weeks or any other antimalarial in the previous 48 hours | |
| Interventions | Each of the five study arms were also divided into two where one half also received a one‐off dose of 0.75 mg/kg primaquine. 1. Dihydroartemisinin‐piperaquine, fixed‐dose combination: 40 mg/320 mg or 20 mg/160 mg tablets (Artekin: Holleykin)
2. Artesunate plus amodiaquine, fixed dose combination: 25 mg/67.5 mg or 50 mg/135 mg or 100 mg/270 mg tablets.
3. Artemether‐lumefantrine, fixed dose combination: 20 mg/120 mg tablets.
4. Artesunate plus mefloquine, fixed dose combination: 25 mg/55 mg or 100 mg/220 mg tablets (artesunate: Guilin, Lariam: Hoffman‐La Roche)
5. Artesunate plus mefloquine, loose combination (artesunate: Guilin, Lariam: Hoffman‐La Roche)
First dose supervised, all others unsupervised. Primaquine was not given | |
| Outcomes |
Not included in the review:
| |
| Notes | Country: Myanmar Setting: Clinics Transmission: Not described Resistance: CQ resistance amongst P. vivax has not been widely reported in Myanmar Dates: Dec 2008 to March 2009 Funding: Médecins sans Frontières (Holland) | |
| Risk of bias | ||
| Bias | Authors' judgement | Support for judgement |
| Random sequence generation (selection bias) | Low risk | 'They were stratified prospectively into three age groups...patients were randomly assigned in equal numbers to receive one of the five different treatments'. |
| Allocation concealment (selection bias) | Low risk | 'Treatment allocations were put in sealed envelopes in blocks of 50 for each age‐group...patients drawing an envelope from a box after enrolment'. |
| Blinding (performance bias and detection bias) | Low risk | An open label trial. 'Microscopists examining blood films were unaware of treatment allocation'. |
| Incomplete outcome data (attrition bias) | Low risk | Attrition is low in absolute numbers and unlikely to have introduced significant bias. |
| Selective reporting (reporting bias) | Low risk | No evidence of selective reporting. |
| Other bias | High risk | For the purpose of this review we are including only a small subset of the original randomized patients. This sample may not therefore be truly randomized and the small sample size means that prognostic balance between groups is unlikely. |
| Methods | Trial design: An open‐label RCT Follow‐up: Routine blood films were taken on days 3, 7, 14, 21, 28, 35, 41, 56, 63, 70, 84, 126, 140, 180, and 365, plus other visits to the clinic with illness Adverse event monitoring: Symptom questionnaire and hematology and biochemistry investigations (WBC, RBC, MCV, MCHC, LFT, RFT, gamma glutathione hydroxylase, pyruvic transaminase, creatine kinase, serum electrolytes, G6PD) were performed on days 3, 7, 14, 28, 41, and 84 | |
| Participants | Number: 116 randomized (41, 39, and 36 in each of the three arms) Inclusion criteria: Indonesian soldiers after a year of duty in malarious Papua, Indonesia diagnosed with P. Vivax malaria by microscopy Exclusion criteria: Refusal to consent; any condition requiring hospitalization; G6PD deficiency; SGOT, SGPT > 2.5 times upper limit of normal; QTcF > 450ms; anaemia (haemoglobin < 8 g/dL); definite plans for absence from the site in 28 days | |
| Interventions | 1. Quinine 200mg tablets (Quinine: Kimia Pharma)
2. Dihydroartemisinin‐piperaquine, fixed‐dose combination: 40 mg/320 mg (Eurartemisim: Sigma Tau)
The third study arm received artesunate alone and was excluded from this review | |
| Outcomes | 1. Recurrence of P. vivax at day 28 2. Recurrence of P. vivax between days 29 to 163 3. Parasite clearance at 72 hours 4. Anaemia 5. Adverse events | |
| Notes | Country: Indonesia Setting: Army base Transmission: Soldiers had returned from endemic Papua, Indomesia to East Java, Indonesia where there is no endemic P. vivax. Resistance: CQ resistance amongst P. vivax is prevalent in Papua Dates: Enrolment Nov 2010 to Apr 2011 Funding: Medicines for Malaria Venture, Wellcome Trust. Sigma Tau provided the DHA‐P. | |
| Risk of bias | ||
| Bias | Authors' judgement | Support for judgement |
| Random sequence generation (selection bias) | Unclear risk | 'A randomized list of study numbers that were block allocated was generated by varying the blocking number at random'. |
| Allocation concealment (selection bias) | Low risk | 'An envelope revealing the assigned therapy was opened after informed consent'. |
| Blinding (performance bias and detection bias) | Unclear risk | An open label trial. No comment on blinding of laboratory staff. |
| Incomplete outcome data (attrition bias) | Low risk | Three were lost to follow‐up in the quinine + primaquine arm (8%) and none in the other two arms. |
| Selective reporting (reporting bias) | Low risk | No evidence of selective reporting. |
| Other bias | Low risk | No evidence of any other bias. |
Characteristics of excluded studies [ordered by study ID]
| Study | Reason for exclusion |
| No ACT given. A pharmacokinetic study of artesunate monotherapy. | |
| There was no arm that has received ACT. | |
| Not randomized. A single arm study of artesunate plus primaquine. | |
| This study is a cost‐effectiveness study already published in NEJM in 2008. We included the data from this study in the previous review. | |
| A review article, not a RCT. | |
| No ACT given. An RCT of artesunate plus primaquine versus chloroquine plus primaquine. | |
| Participants did not have uncomplicated P. vivax at baseline. An RCT of artesunate‐naphthoquine versus chloroquine plus sulfadoxine‐pyrimethamine in P. falciparum malaria. | |
| Although the study reports outcome measures for different arms including one with ACT, there is no mention on whether the study is randomized. | |
| Not randomized. Trial authors gave all participants with P. vivax a single dose of mefloquine. | |
| Review article. | |
| Uses data from Hasugian 2007 IDN and Ratcliff 2007 IDN. No new efficacy or safety data. | |
| No ACT given. A RCT of eight different monotherapies. | |
| The participants of this study had only P. falciparum infection. | |
| This study is on intermittent preventive treatment in infants (IPTi). | |
| Participants did not have uncomplicated P. vivax malaria. RCT of different treatment combinations for P. falciparum. | |
| Not randomized. Two separate trials are reported: a quasi‐RCT of chloroquine versus chloroquine plus sulfadoxine‐pyrimethamine, followed by a single arm study of artesunate plus sulfadoxine‐pyrimethamine. | |
| Trial authors only gave the comparator artemisinin‐napthoquine as a single dose ACT. | |
| Artesunate plus mefloquine versus a four‐dose course of artemther‐lumefantrine. This regimen is no longer recommended as it was shown to be inferior to six doses for treating P. falciparum. | |
| No participants received ACT. | |
| Quasi‐RCT: alternate allocation. | |
| An individual patient data meta‐analysis of six clinical trials including Ashley 2004 THA, Ashley 2005 THA, Janssens 2007a, Smithuis 2010 MMR and two other trials which did not include patients with P. vivax at baseline. No new efficacy data. |
Characteristics of studies awaiting assessment [ordered by study ID]
| Methods | Trial design: Open label RCT Follow‐up: Monitored daily until fever and parasites cleared then weekly to day 63. Temperature, symptom questionnaire, malaria film, and hematocrit at each visit. Adverse event monitoring: An adverse event defined as any new sign or symptom appearing after treatment started. At each visit a symptom questionnaire was completed. |
| Participants | Number: It is unclear whether any participants had P. vivax infection at baseline (464 randomized in total) Inclusion criteria: Age > 1 yr, axillary temp > 37.5 ºC or history of fever, signs and symptoms of uncomplicated malaria, P. falciparum mono or mixed infections, written informed consent Exclusion criteria: Pregnancy or lactation, signs or symptoms of severe malaria, > 4% red blood cells parasitized, a history of convulsions or neuropsychiatric disorder, treatment with mefloquine in the past 60 days |
| Interventions | 1. Dihydroartemisinin‐piperaquine, fixed‐dose combination, 40 mg/320 mg tablets (Artekin: Holleykin)
2. Artesunate plus mefloquine, loose combination (Artesunate: Guilin, Mefloquine: Mepha)
All doses supervised Primaquine was not given |
| Outcomes |
Not included in the review:
|
| Notes | Country: Cambodia Setting: Rural health centres and outreach malaria clinics Transmission: Low and seasonal Resistance: Not stated Dates: Oct 2002 to March 2003 Funding: Médecins sans Frontières |
| Methods | Trial design: Randomized, double‐blind, double‐dummy, comparative study Inclusion criteria: Age between 3 and 60 years; body weight between 20 and 90 kg; acute uncomplicated P. vivax mono‐infection confirmed with fever and positive microscopy of P. vivax with parasite density = 250/µL of blood and a rapid negative test for P. falciparum. |
| Participants | Number: 30 |
| Interventions | Pyronaridine (180 mg) + artesunate (60 mg) once a day for 3 days Chloroquine (155 mg) once a day for 3 days |
| Outcomes | 1. Cure rate at Day 14 2. Proportion of patients cured at day 28 and day 42 3. Parasite clearance time 4. Fever clearance time 5. Proportion of patients aparasitaemic on days 1, 2 and 3 6. Adverse events |
| Notes | This is a conference abstract and no details of either the study or the contact information of the authors are available |
| Methods | Trial design: Open label RCT Follow‐up: Monitored daily until fever and parasites cleared then weekly to day 42. Clinical examination, symptom questionnaire, malaria film, and hematocrit at each visit. Adverse event monitoring: At each visit a symptom questionnaire was completed. |
| Participants | Number: It is unclear whether any participants had P. vivax infection at baseline (1596 were randomized in total) Inclusion criteria: Weight >10 kg, slide confirmed acute P. falciparum malaria, written informed consent Exclusion criteria: Pregnancy, not obtunded or vomiting, no other clinical or laboratory signs of severe illness, treatment with mefloquine in the past 63 days |
| Interventions | 1. Artesunate plus mefloquine, loose combination
2. Artesunate plus atavoquone‐proguanil
3. Atavoquone‐proguanil
All doses supervised Primaquine was not given |
| Outcomes |
Not included in the review:
|
| Notes | Country: Thailand Setting: Malaria clinics of the Shoklo Malaria Research Unit Transmission: Low transmission Resistance: Not stated Dates: July 1998 to July 2000 Funding: Atavoquine‐proguanil was donated by Glaxo‐SmithKline. The Wellcome Trust of Great Britain |
Data and analyses
| Outcome or subgroup title | No. of studies | No. of participants | Statistical method | Effect size |
| 1 Parasite clearance Show forest plot | 4 | Risk Ratio (M‐H, Random, 95% CI) | Subtotals only | |
| Analysis 1.1  Comparison 1 ACT versus Chloroquine, Outcome 1 Parasite clearance. | ||||
| 1.1 Remaining parasitaemic after 24 hours | 4 | 1652 | Risk Ratio (M‐H, Random, 95% CI) | 0.42 [0.36, 0.50] |
| 1.2 Remaining parasitaemic after 48 hours | 4 | 1648 | Risk Ratio (M‐H, Random, 95% CI) | 0.18 [0.05, 0.74] |
| 1.3 Remaining parasitaemic after 72 hours | 4 | 1648 | Risk Ratio (M‐H, Random, 95% CI) | 0.08 [0.01, 0.43] |
| 2 Fever clearance Show forest plot | 3 | Risk Ratio (M‐H, Random, 95% CI) | Subtotals only | |
| Analysis 1.2  Comparison 1 ACT versus Chloroquine, Outcome 2 Fever clearance. | ||||
| 2.1 Remaining febrile after 24 hours | 2 | 990 | Risk Ratio (M‐H, Random, 95% CI) | 0.55 [0.43, 0.70] |
| 2.2 Remaining febrile after 48 hours | 3 | 1390 | Risk Ratio (M‐H, Random, 95% CI) | 0.53 [0.31, 0.91] |
| 2.3 Remaining febrile after 72 hours | 2 | 985 | Risk Ratio (M‐H, Random, 95% CI) | 0.60 [0.27, 1.36] |
| 3 Recurrence of parasitaemia Show forest plot | 5 | Risk Ratio (M‐H, Random, 95% CI) | Subtotals only | |
| Analysis 1.3  Comparison 1 ACT versus Chloroquine, Outcome 3 Recurrence of parasitaemia. | ||||
| 3.1 Before day 14 | 1 | 427 | Risk Ratio (M‐H, Random, 95% CI) | 2.88 [0.12, 70.22] |
| 3.2 Before day 28 | 5 | 1622 | Risk Ratio (M‐H, Random, 95% CI) | 0.58 [0.18, 1.90] |
| 3.3 After day 28 (primaquine not given) | 3 | 1066 | Risk Ratio (M‐H, Random, 95% CI) | 0.57 [0.40, 0.82] |
| 3.4 After day 28 (primaquine given) | 1 | 376 | Risk Ratio (M‐H, Random, 95% CI) | 0.27 [0.08, 0.94] |
| 3.5 During full follow‐up period (42 or 56 days) | 4 | 1460 | Risk Ratio (M‐H, Random, 95% CI) | 0.59 [0.44, 0.78] |
| 4 Gametocytemia Show forest plot | 2 | Risk Ratio (M‐H, Fixed, 95% CI) | Totals not selected | |
| Analysis 1.4  Comparison 1 ACT versus Chloroquine, Outcome 4 Gametocytemia. | ||||
| 4.1 On Day 0 | 2 | Risk Ratio (M‐H, Fixed, 95% CI) | 0.0 [0.0, 0.0] | |
| 4.2 On Day 1 | 1 | Risk Ratio (M‐H, Fixed, 95% CI) | 0.0 [0.0, 0.0] | |
| 4.3 On Day 2 | 2 | Risk Ratio (M‐H, Fixed, 95% CI) | 0.0 [0.0, 0.0] | |
| 4.4 On Day 3 | 1 | Risk Ratio (M‐H, Fixed, 95% CI) | 0.0 [0.0, 0.0] | |
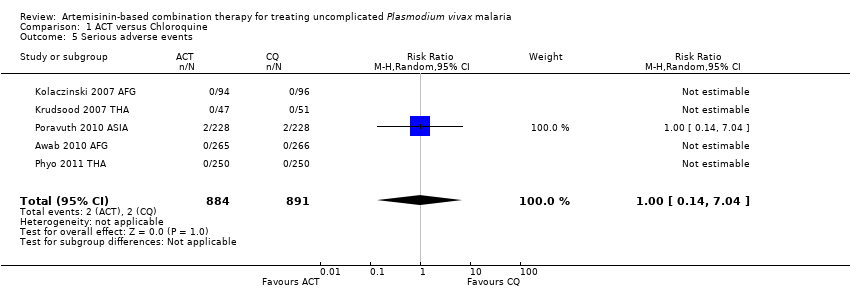
| 5 Serious adverse events Show forest plot | 5 | 1775 | Risk Ratio (M‐H, Random, 95% CI) | 1.0 [0.14, 7.04] |
| Analysis 1.5  Comparison 1 ACT versus Chloroquine, Outcome 5 Serious adverse events. | ||||
| Outcome or subgroup title | No. of studies | No. of participants | Statistical method | Effect size |
| 1 Parasite clearance Show forest plot | 1 | Risk Ratio (M‐H, Random, 95% CI) | Subtotals only | |
| Analysis 2.1  Comparison 2 ACT versus Chloroquine plus Sulfadoxine‐pyrimethamine, Outcome 1 Parasite clearance. | ||||
| 1.1 Remaining parasitaemic after 24 hours | 1 | 195 | Risk Ratio (M‐H, Random, 95% CI) | 0.22 [0.15, 0.34] |
| 1.2 Remaining parasitaemic after 48 hours | 1 | 195 | Risk Ratio (M‐H, Random, 95% CI) | 0.09 [0.03, 0.27] |
| 1.3 Remaining parasitaemic after 72 hours | 1 | 195 | Risk Ratio (M‐H, Random, 95% CI) | 0.17 [0.03, 0.81] |
| 2 Fever clearance Show forest plot | 1 | Risk Ratio (M‐H, Random, 95% CI) | Subtotals only | |
| Analysis 2.2  Comparison 2 ACT versus Chloroquine plus Sulfadoxine‐pyrimethamine, Outcome 2 Fever clearance. | ||||
| 2.1 Remaining febrile after 24 hours | 1 | 195 | Risk Ratio (M‐H, Random, 95% CI) | 1.05 [0.75, 1.48] |
| 2.2 Remaining febrile after 48 hours | 1 | 195 | Risk Ratio (M‐H, Random, 95% CI) | 0.62 [0.31, 1.23] |
| 2.3 Remaining febrile after 72 hours | 1 | 195 | Risk Ratio (M‐H, Random, 95% CI) | 0.77 [0.29, 2.02] |
| 3 Recurrence of parasitaemia Show forest plot | 1 | Risk Ratio (M‐H, Random, 95% CI) | Totals not selected | |
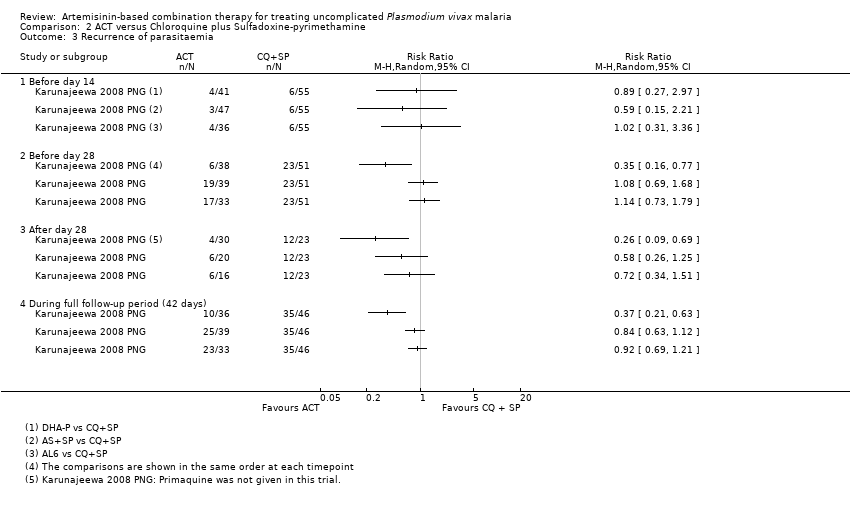
| Analysis 2.3  Comparison 2 ACT versus Chloroquine plus Sulfadoxine‐pyrimethamine, Outcome 3 Recurrence of parasitaemia. | ||||
| 3.1 Before day 14 | 1 | Risk Ratio (M‐H, Random, 95% CI) | 0.0 [0.0, 0.0] | |
| 3.2 Before day 28 | 1 | Risk Ratio (M‐H, Random, 95% CI) | 0.0 [0.0, 0.0] | |
| 3.3 After day 28 | 1 | Risk Ratio (M‐H, Random, 95% CI) | 0.0 [0.0, 0.0] | |
| 3.4 During full follow‐up period (42 days) | 1 | Risk Ratio (M‐H, Random, 95% CI) | 0.0 [0.0, 0.0] | |
| 4 Serious adverse events Show forest plot | 1 | 209 | Risk Ratio (M‐H, Fixed, 95% CI) | 0.0 [0.0, 0.0] |
| Analysis 2.4  Comparison 2 ACT versus Chloroquine plus Sulfadoxine‐pyrimethamine, Outcome 4 Serious adverse events. | ||||
| Outcome or subgroup title | No. of studies | No. of participants | Statistical method | Effect size |
| 1 Parasite clearance Show forest plot | 1 | 72 | Risk Ratio (M‐H, Fixed, 95% CI) | 2.0 [0.19, 21.09] |
| Analysis 3.1  Comparison 3 ACT versus Quinine, Outcome 1 Parasite clearance. | ||||
| 1.1 Remaining parasitaemia after 72 hours | 1 | 72 | Risk Ratio (M‐H, Fixed, 95% CI) | 2.0 [0.19, 21.09] |
| 2 Recurrence of parasitaemia Show forest plot | 1 | Risk Ratio (M‐H, Random, 95% CI) | Totals not selected | |
| Analysis 3.2  Comparison 3 ACT versus Quinine, Outcome 2 Recurrence of parasitaemia. | ||||
| 2.1 Before day 14 | 1 | Risk Ratio (M‐H, Random, 95% CI) | 0.0 [0.0, 0.0] | |
| 2.2 Before day 28 | 1 | Risk Ratio (M‐H, Random, 95% CI) | 0.0 [0.0, 0.0] | |
| 2.3 After day 28 | 1 | Risk Ratio (M‐H, Random, 95% CI) | 0.0 [0.0, 0.0] | |
| 2.4 During full follow‐up period (42 days) | 1 | Risk Ratio (M‐H, Random, 95% CI) | 0.0 [0.0, 0.0] | |
| Outcome or subgroup title | No. of studies | No. of participants | Statistical method | Effect size |
| 1 Remaining parasitemic after 24 hours Show forest plot | 5 | Risk Ratio (M‐H, Random, 95% CI) | Subtotals only | |
| Analysis 4.1  Comparison 4 ACT versus ACT, Outcome 1 Remaining parasitemic after 24 hours. | ||||
| 1.1 DHA‐P versus AS+MQ | 3 | 120 | Risk Ratio (M‐H, Random, 95% CI) | 1.18 [0.28, 4.92] |
| 1.2 DHA‐P versus AL6 | 1 | 83 | Risk Ratio (M‐H, Random, 95% CI) | 0.78 [0.31, 1.94] |
| 1.3 AS+MQ versus AL6 | 1 | 24 | Risk Ratio (M‐H, Random, 95% CI) | 1.02 [0.60, 1.72] |
| 1.4 DHA‐P versus AS+SP | 1 | 95 | Risk Ratio (M‐H, Random, 95% CI) | 1.35 [0.49, 3.72] |
| 2 Remaining parasitemic after 48 hours Show forest plot | 5 | Risk Ratio (M‐H, Random, 95% CI) | Subtotals only | |
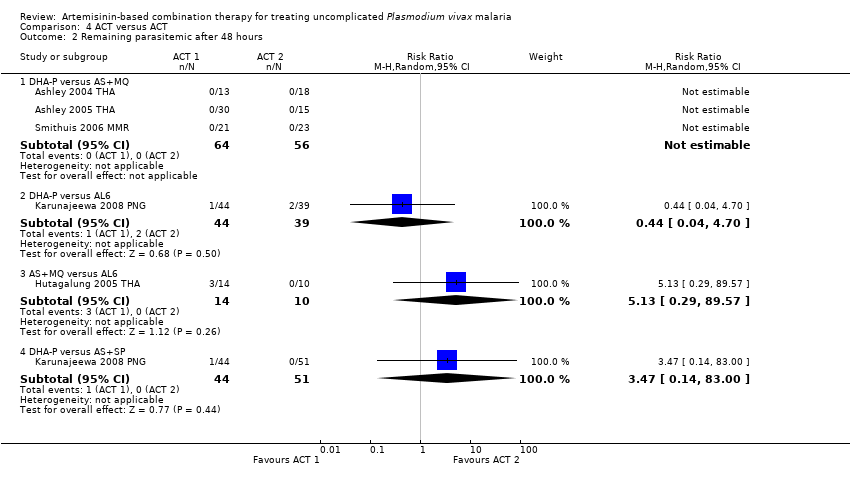
| Analysis 4.2  Comparison 4 ACT versus ACT, Outcome 2 Remaining parasitemic after 48 hours. | ||||
| 2.1 DHA‐P versus AS+MQ | 3 | 120 | Risk Ratio (M‐H, Random, 95% CI) | 0.0 [0.0, 0.0] |
| 2.2 DHA‐P versus AL6 | 1 | 83 | Risk Ratio (M‐H, Random, 95% CI) | 0.44 [0.04, 4.70] |
| 2.3 AS+MQ versus AL6 | 1 | 24 | Risk Ratio (M‐H, Random, 95% CI) | 5.13 [0.29, 89.57] |
| 2.4 DHA‐P versus AS+SP | 1 | 95 | Risk Ratio (M‐H, Random, 95% CI) | 3.47 [0.14, 83.00] |
| 3 Remaining febrile after 24 hours Show forest plot | 1 | Risk Ratio (M‐H, Random, 95% CI) | Subtotals only | |
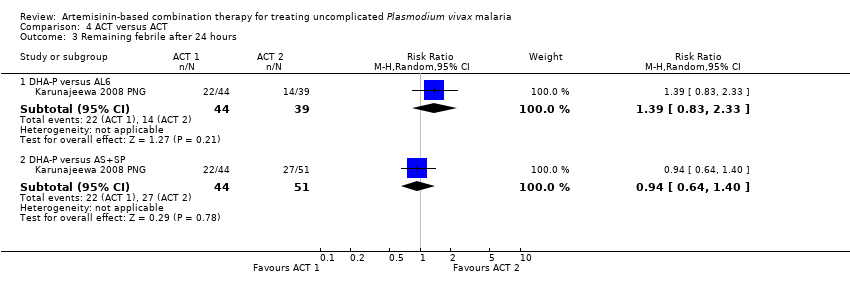
| Analysis 4.3  Comparison 4 ACT versus ACT, Outcome 3 Remaining febrile after 24 hours. | ||||
| 3.1 DHA‐P versus AL6 | 1 | 83 | Risk Ratio (M‐H, Random, 95% CI) | 1.39 [0.83, 2.33] |
| 3.2 DHA‐P versus AS+SP | 1 | 95 | Risk Ratio (M‐H, Random, 95% CI) | 0.94 [0.64, 1.40] |
| 4 Remaining febrile after 48 hours Show forest plot | 1 | Risk Ratio (M‐H, Random, 95% CI) | Subtotals only | |
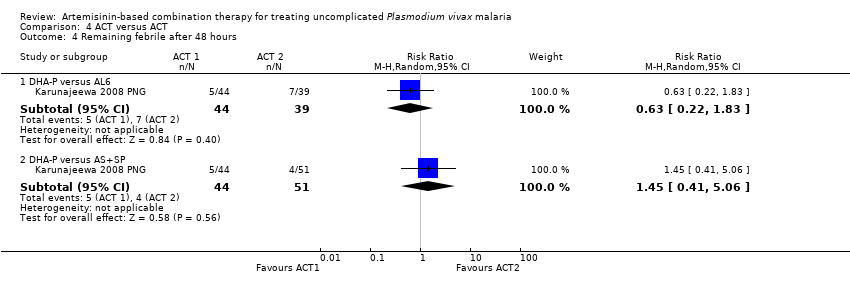
| Analysis 4.4  Comparison 4 ACT versus ACT, Outcome 4 Remaining febrile after 48 hours. | ||||
| 4.1 DHA‐P versus AL6 | 1 | 83 | Risk Ratio (M‐H, Random, 95% CI) | 0.63 [0.22, 1.83] |
| 4.2 DHA‐P versus AS+SP | 1 | 95 | Risk Ratio (M‐H, Random, 95% CI) | 1.45 [0.41, 5.06] |
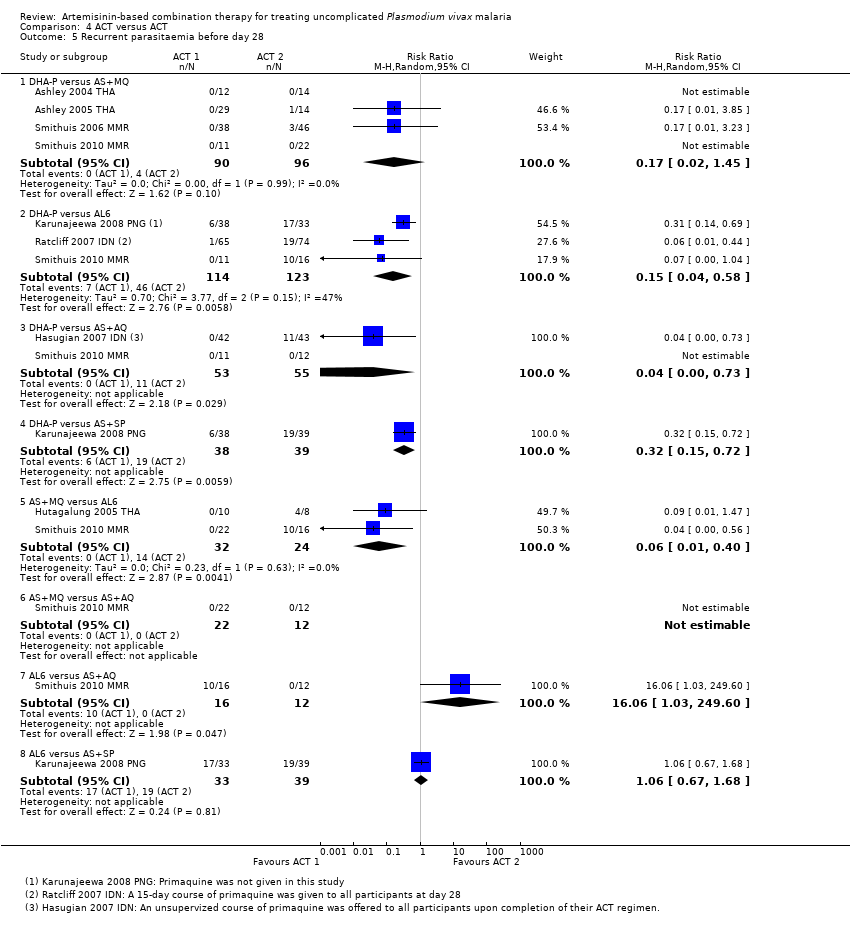
| 5 Recurrent parasitaemia before day 28 Show forest plot | 8 | Risk Ratio (M‐H, Random, 95% CI) | Subtotals only | |
| Analysis 4.5  Comparison 4 ACT versus ACT, Outcome 5 Recurrent parasitaemia before day 28. | ||||
| 5.1 DHA‐P versus AS+MQ | 4 | 186 | Risk Ratio (M‐H, Random, 95% CI) | 0.17 [0.02, 1.45] |
| 5.2 DHA‐P versus AL6 | 3 | 237 | Risk Ratio (M‐H, Random, 95% CI) | 0.15 [0.04, 0.58] |
| 5.3 DHA‐P versus AS+AQ | 2 | 108 | Risk Ratio (M‐H, Random, 95% CI) | 0.04 [0.00, 0.73] |
| 5.4 DHA‐P versus AS+SP | 1 | 77 | Risk Ratio (M‐H, Random, 95% CI) | 0.32 [0.15, 0.72] |
| 5.5 AS+MQ versus AL6 | 2 | 56 | Risk Ratio (M‐H, Random, 95% CI) | 0.06 [0.01, 0.40] |
| 5.6 AS+MQ versus AS+AQ | 1 | 34 | Risk Ratio (M‐H, Random, 95% CI) | 0.0 [0.0, 0.0] |
| 5.7 AL6 versus AS+AQ | 1 | 28 | Risk Ratio (M‐H, Random, 95% CI) | 16.06 [1.03, 249.60] |
| 5.8 AL6 versus AS+SP | 1 | 72 | Risk Ratio (M‐H, Random, 95% CI) | 1.06 [0.67, 1.68] |
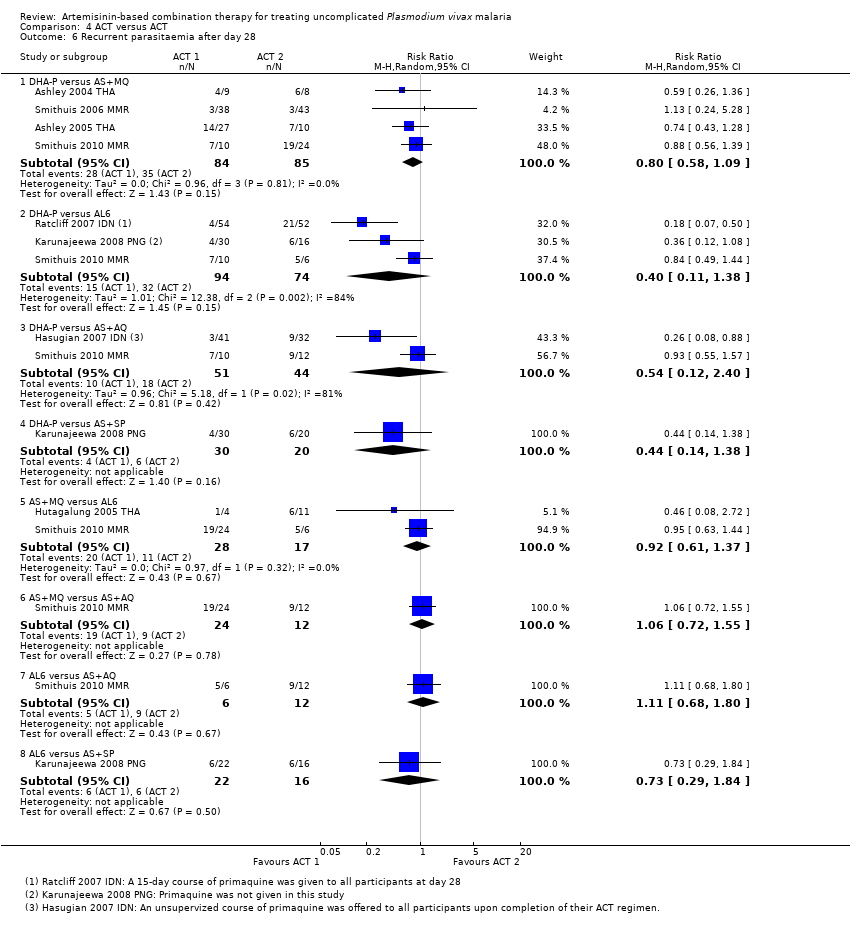
| 6 Recurrent parasitaemia after day 28 Show forest plot | 8 | Risk Ratio (M‐H, Random, 95% CI) | Subtotals only | |
| Analysis 4.6  Comparison 4 ACT versus ACT, Outcome 6 Recurrent parasitaemia after day 28. | ||||
| 6.1 DHA‐P versus AS+MQ | 4 | 169 | Risk Ratio (M‐H, Random, 95% CI) | 0.80 [0.58, 1.09] |
| 6.2 DHA‐P versus AL6 | 3 | 168 | Risk Ratio (M‐H, Random, 95% CI) | 0.40 [0.11, 1.38] |
| 6.3 DHA‐P versus AS+AQ | 2 | 95 | Risk Ratio (M‐H, Random, 95% CI) | 0.54 [0.12, 2.40] |
| 6.4 DHA‐P versus AS+SP | 1 | 50 | Risk Ratio (M‐H, Random, 95% CI) | 0.44 [0.14, 1.38] |
| 6.5 AS+MQ versus AL6 | 2 | 45 | Risk Ratio (M‐H, Random, 95% CI) | 0.92 [0.61, 1.37] |
| 6.6 AS+MQ versus AS+AQ | 1 | 36 | Risk Ratio (M‐H, Random, 95% CI) | 1.06 [0.72, 1.55] |
| 6.7 AL6 versus AS+AQ | 1 | 18 | Risk Ratio (M‐H, Random, 95% CI) | 1.11 [0.68, 1.80] |
| 6.8 AL6 versus AS+SP | 1 | 38 | Risk Ratio (M‐H, Random, 95% CI) | 0.73 [0.29, 1.84] |
| 7 Recurrent parasitaemia during full follow‐up period (0 to 42 or 63 days) Show forest plot | 8 | Risk Ratio (M‐H, Random, 95% CI) | Subtotals only | |
| Analysis 4.7  Comparison 4 ACT versus ACT, Outcome 7 Recurrent parasitaemia during full follow‐up period (0 to 42 or 63 days). | ||||
| 7.1 DHA‐P versus AS+MQ | 4 | 186 | Risk Ratio (M‐H, Random, 95% CI) | 0.17 [0.02, 1.45] |
| 7.2 DHA‐P versus AL6 | 3 | 237 | Risk Ratio (M‐H, Random, 95% CI) | 0.15 [0.04, 0.58] |
| 7.3 DHA‐P versus AS+AQ | 2 | 108 | Risk Ratio (M‐H, Random, 95% CI) | 0.04 [0.00, 0.73] |
| 7.4 DHA‐P versus AS+SP | 1 | 77 | Risk Ratio (M‐H, Random, 95% CI) | 0.32 [0.15, 0.72] |
| 7.5 AS+MQ versus AL6 | 2 | 56 | Risk Ratio (M‐H, Random, 95% CI) | 0.06 [0.01, 0.40] |
| 7.6 AS+MQ versus AS+AQ | 1 | 34 | Risk Ratio (M‐H, Random, 95% CI) | 0.0 [0.0, 0.0] |
| 7.7 AL6 versus AS+AQ | 1 | 28 | Risk Ratio (M‐H, Random, 95% CI) | 16.06 [1.03, 249.60] |
| 7.8 AL6 versus AS+SP | 1 | 72 | Risk Ratio (M‐H, Random, 95% CI) | 1.06 [0.67, 1.68] |
| Outcome or subgroup title | No. of studies | No. of participants | Statistical method | Effect size |
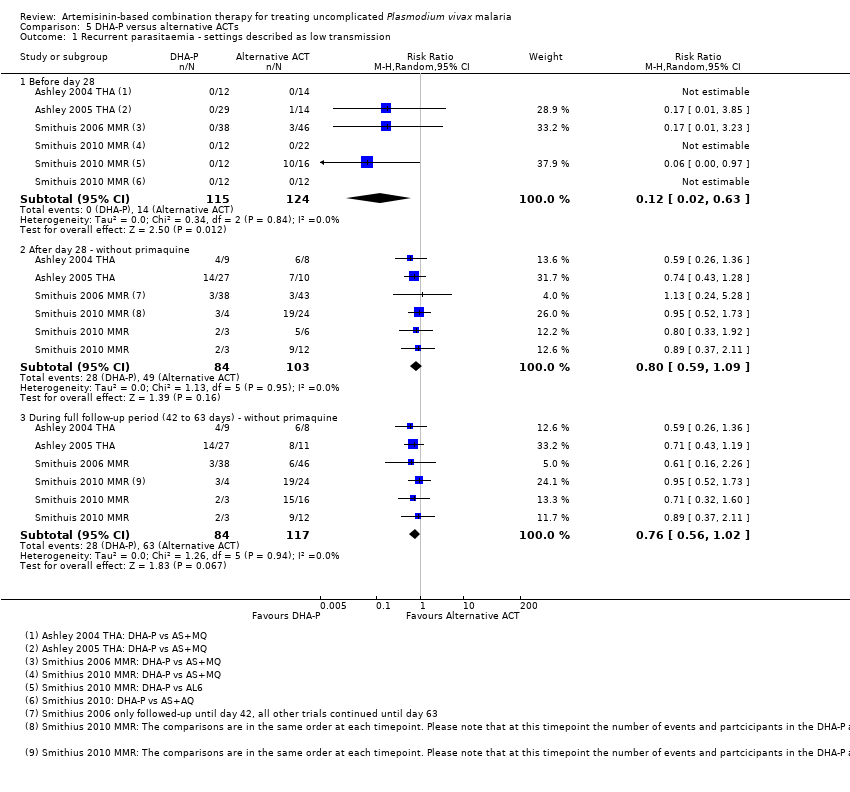
| 1 Recurrent parasitaemia ‐ settings described as low transmission Show forest plot | 4 | Risk Ratio (M‐H, Random, 95% CI) | Subtotals only | |
| Analysis 5.1  Comparison 5 DHA‐P versus alternative ACTs, Outcome 1 Recurrent parasitaemia ‐ settings described as low transmission. | ||||
| 1.1 Before day 28 | 4 | 239 | Risk Ratio (M‐H, Random, 95% CI) | 0.12 [0.02, 0.63] |
| 1.2 After day 28 ‐ without primaquine | 4 | 187 | Risk Ratio (M‐H, Random, 95% CI) | 0.80 [0.59, 1.09] |
| 1.3 During full follow‐up period (42 to 63 days) ‐ without primaquine | 4 | 201 | Risk Ratio (M‐H, Random, 95% CI) | 0.76 [0.56, 1.02] |
| 2 Recurrent parasitaemia ‐ settings described as high transmission Show forest plot | 3 | Risk Ratio (M‐H, Random, 95% CI) | Subtotals only | |
| Analysis 5.2  Comparison 5 DHA‐P versus alternative ACTs, Outcome 2 Recurrent parasitaemia ‐ settings described as high transmission. | ||||
| 2.1 Before day 28 | 3 | 334 | Risk Ratio (M‐H, Random, 95% CI) | 0.20 [0.08, 0.49] |
| 2.2 After day 28 ‐ with primaquine | 2 | 179 | Risk Ratio (M‐H, Random, 95% CI) | 0.21 [0.10, 0.46] |
| 2.3 After day 28 ‐ without primaquine | 1 | 66 | Risk Ratio (M‐H, Random, 95% CI) | 0.40 [0.14, 1.10] |
| 2.4 During full follow‐up period (42 days) ‐ with primaquine | 2 | 210 | Risk Ratio (M‐H, Random, 95% CI) | 0.16 [0.08, 0.32] |
| 2.5 During full follow‐up period (42 days) ‐ without primaquine | 1 | 108 | Risk Ratio (M‐H, Random, 95% CI) | 0.42 [0.24, 0.72] |

Study flow diagram.

Risk of bias summary: review authors' judgements about each risk of bias item for each included study.
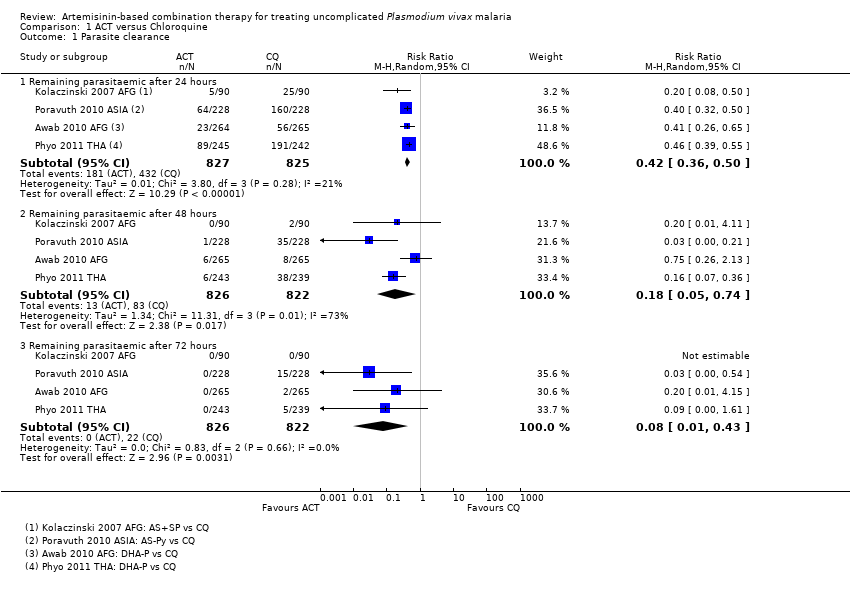
Comparison 1 ACT versus Chloroquine, Outcome 1 Parasite clearance.
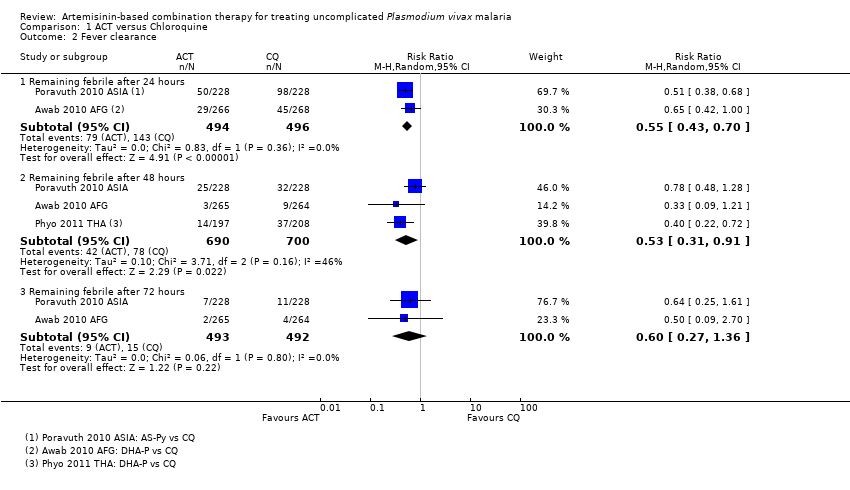
Comparison 1 ACT versus Chloroquine, Outcome 2 Fever clearance.

Comparison 1 ACT versus Chloroquine, Outcome 3 Recurrence of parasitaemia.
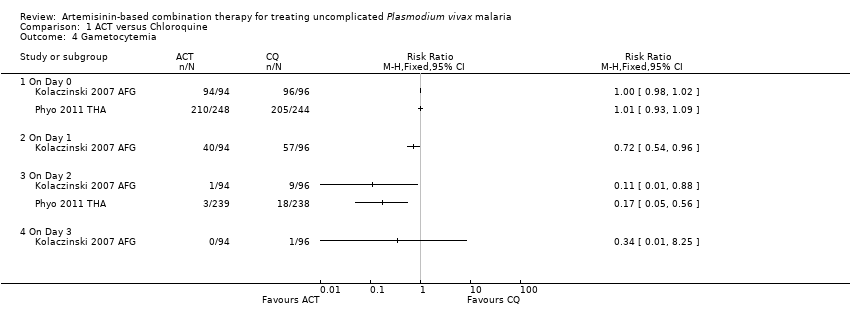
Comparison 1 ACT versus Chloroquine, Outcome 4 Gametocytemia.
Comparison 1 ACT versus Chloroquine, Outcome 5 Serious adverse events.

Comparison 2 ACT versus Chloroquine plus Sulfadoxine‐pyrimethamine, Outcome 1 Parasite clearance.

Comparison 2 ACT versus Chloroquine plus Sulfadoxine‐pyrimethamine, Outcome 2 Fever clearance.
Comparison 2 ACT versus Chloroquine plus Sulfadoxine‐pyrimethamine, Outcome 3 Recurrence of parasitaemia.

Comparison 2 ACT versus Chloroquine plus Sulfadoxine‐pyrimethamine, Outcome 4 Serious adverse events.

Comparison 3 ACT versus Quinine, Outcome 1 Parasite clearance.

Comparison 3 ACT versus Quinine, Outcome 2 Recurrence of parasitaemia.

Comparison 4 ACT versus ACT, Outcome 1 Remaining parasitemic after 24 hours.
Comparison 4 ACT versus ACT, Outcome 2 Remaining parasitemic after 48 hours.
Comparison 4 ACT versus ACT, Outcome 3 Remaining febrile after 24 hours.
Comparison 4 ACT versus ACT, Outcome 4 Remaining febrile after 48 hours.
Comparison 4 ACT versus ACT, Outcome 5 Recurrent parasitaemia before day 28.
Comparison 4 ACT versus ACT, Outcome 6 Recurrent parasitaemia after day 28.

Comparison 4 ACT versus ACT, Outcome 7 Recurrent parasitaemia during full follow‐up period (0 to 42 or 63 days).
Comparison 5 DHA‐P versus alternative ACTs, Outcome 1 Recurrent parasitaemia ‐ settings described as low transmission.

Comparison 5 DHA‐P versus alternative ACTs, Outcome 2 Recurrent parasitaemia ‐ settings described as high transmission.
| Artemisinin‐based combination therapy compared with chloroquine for uncomplicated P. vivax malaria | |||||
| Patient or population: Adults and children with uncomplicated P. vivax malaria Settings: Endemic areas where chloroquine is still an effective treatment for the first 28 days Intervention: Artemisinin‐based combination therapy Comparison: Chloroquine | |||||
| Outcomes | Illustrative comparative risks* (95% CI) | Relative effect | No of participants | Quality of the evidence | |
| Assumed risk | Corresponding risk | ||||
| Chloroquine | ACT | ||||
| Remaining parasitaemic at 24 hours | 52 per 100 | 22 per 100 | RR 0.42 | 1652 | high2,3,4,5 |
| Remaining febrile after 24 hours | 29 per 100 | 16 per 100 | RR 0.55 | 990 | moderate2,4,5,7 |
| Effective treatment of the blood stage parasite As assessed by: Recurrent parasitaemia before day 28 | 3 per 100 | 2 per 100 | RR 0.58 | 1622 | high2,3,4,9 |
| Post‐treatment prophylaxis As assessed by: Recurrent parasitaemia between day 28 and day 42/56/63 | With primaquine | RR 0.27 | 376 (1 study10) | low11,12 | |
| 6 per 100 | 2 per 100 | ||||
| Without primaquine | RR 0.57 | 1066 | moderate3,5,14 | ||
| 40 per 100 | 23 per 100 | ||||
| Serious adverse events | 0 per 100 | 0 per 100 | RR 1 | 1775 | high2,3,4,9 |
| *The basis for the assumed risk (for example, the median control group risk across studies) is provided in footnotes. The corresponding risk (and its 95% CI) is based on the assumed risk in the comparison group and the relative effect of the intervention (and its 95% CI). | |||||
| GRADE Working Group grades of evidence | |||||
| 1Awab 2010 AFG (Afghanistan), Kolaczinski 2007 AFG (Afghanistan), Poravuth 2010 ASIA (multi‐site), and Phyo 2011 THA (Thailand). | |||||
| Dihydroartemisinin‐piperaquine compared with alternative artemisinin‐based combination treatments for uncomplicated P. vivax malaria | |||||
| Patient or population: Adults and children with uncomplicated P. vivax malaria Settings: Settings with high transmission of P. vivax (chloroquine resistance is also reported as high) Intervention: Dihydroartemisinin‐piperaquine Comparison: Alternative ACTs | |||||
| Outcomes | Illustrative comparative risks* (95% CI) | Relative effect | No of participants | Quality of the evidence | |
| Assumed risk | Corresponding risk | ||||
| Alternative ACT | DHA‐P | ||||
| Effective treatment of the blood stage parasite As assessed by: Recurrent parasitaemia before day 28 | 35 per 100 | 7 per 100 | RR 0.20 | 334 | moderate3,4,5,6 |
| Post‐treatment prophylaxis As assessed by: Recurrent parasitaemia between day 28 and 42 | With primaquine | RR 0.21 | 179 | low6,7,8,9 | |
| 34 per 100 | 7 per 100 | ||||
| Without primaquine | RR 0.40 | 66 | very low10,11,12 | ||
| 33 per 100 | 13 per 100 | ||||
| *The basis for the assumed risk (for example, the median control group risk across studies) is provided in footnotes. The corresponding risk (and its 95% CI) is based on the assumed risk in the comparison group and the relative effect of the intervention (and its 95% CI). | |||||
| GRADE Working Group grades of evidence | |||||
| 1Karunajeewa 2008 PNG (Papua New Guinea). | |||||
| Search set | Search terms used for all databases1 |
| 1 | vivax |
| 2 | Arte* |
| 3 | Dihydroarte* |
| 4 | 2 or 3 |
| 5 | 1 and 4 |
| 6 | (search terms for RCTs) |
| 7 | 5 and 6 |
| 8 | Limit 7 to Human |
| 1 Cochrane Infectious Disease Group Specialized Register; Cochrane Central Register of Controlled Trials (CENTRAL), published in The Cochrane Library; MEDLINE; EMBASE; and LILACS. | |
| Study ID | Comparison | Median parasite clearance time (range) | P value | |
| ACT | CQ | |||
| AL6 versus CQ | 41.6 hrs | 55.8 hrs | < 0.01 | |
| AS‐Py versus CQ | 23.0 hrs (7.0 to 55.9) | 32.0 hrs (7.5 to 63.9) | < 0.0001 | |
| Study ID | Comparison | Median fever clearance time (range) | P value | |
| ACT | CQ | |||
| AL6 versus CQ | 21.8 hrs | 25.3 hrs | 0.12 | |
| AS‐Py versus CQ | 15.9 hrs | 23.8 hrs | 0.0017 | |
| Outcome or subgroup title | No. of studies | No. of participants | Statistical method | Effect size |
| 1 Parasite clearance Show forest plot | 4 | Risk Ratio (M‐H, Random, 95% CI) | Subtotals only | |
| 1.1 Remaining parasitaemic after 24 hours | 4 | 1652 | Risk Ratio (M‐H, Random, 95% CI) | 0.42 [0.36, 0.50] |
| 1.2 Remaining parasitaemic after 48 hours | 4 | 1648 | Risk Ratio (M‐H, Random, 95% CI) | 0.18 [0.05, 0.74] |
| 1.3 Remaining parasitaemic after 72 hours | 4 | 1648 | Risk Ratio (M‐H, Random, 95% CI) | 0.08 [0.01, 0.43] |
| 2 Fever clearance Show forest plot | 3 | Risk Ratio (M‐H, Random, 95% CI) | Subtotals only | |
| 2.1 Remaining febrile after 24 hours | 2 | 990 | Risk Ratio (M‐H, Random, 95% CI) | 0.55 [0.43, 0.70] |
| 2.2 Remaining febrile after 48 hours | 3 | 1390 | Risk Ratio (M‐H, Random, 95% CI) | 0.53 [0.31, 0.91] |
| 2.3 Remaining febrile after 72 hours | 2 | 985 | Risk Ratio (M‐H, Random, 95% CI) | 0.60 [0.27, 1.36] |
| 3 Recurrence of parasitaemia Show forest plot | 5 | Risk Ratio (M‐H, Random, 95% CI) | Subtotals only | |
| 3.1 Before day 14 | 1 | 427 | Risk Ratio (M‐H, Random, 95% CI) | 2.88 [0.12, 70.22] |
| 3.2 Before day 28 | 5 | 1622 | Risk Ratio (M‐H, Random, 95% CI) | 0.58 [0.18, 1.90] |
| 3.3 After day 28 (primaquine not given) | 3 | 1066 | Risk Ratio (M‐H, Random, 95% CI) | 0.57 [0.40, 0.82] |
| 3.4 After day 28 (primaquine given) | 1 | 376 | Risk Ratio (M‐H, Random, 95% CI) | 0.27 [0.08, 0.94] |
| 3.5 During full follow‐up period (42 or 56 days) | 4 | 1460 | Risk Ratio (M‐H, Random, 95% CI) | 0.59 [0.44, 0.78] |
| 4 Gametocytemia Show forest plot | 2 | Risk Ratio (M‐H, Fixed, 95% CI) | Totals not selected | |
| 4.1 On Day 0 | 2 | Risk Ratio (M‐H, Fixed, 95% CI) | 0.0 [0.0, 0.0] | |
| 4.2 On Day 1 | 1 | Risk Ratio (M‐H, Fixed, 95% CI) | 0.0 [0.0, 0.0] | |
| 4.3 On Day 2 | 2 | Risk Ratio (M‐H, Fixed, 95% CI) | 0.0 [0.0, 0.0] | |
| 4.4 On Day 3 | 1 | Risk Ratio (M‐H, Fixed, 95% CI) | 0.0 [0.0, 0.0] | |
| 5 Serious adverse events Show forest plot | 5 | 1775 | Risk Ratio (M‐H, Random, 95% CI) | 1.0 [0.14, 7.04] |
| Outcome or subgroup title | No. of studies | No. of participants | Statistical method | Effect size |
| 1 Parasite clearance Show forest plot | 1 | Risk Ratio (M‐H, Random, 95% CI) | Subtotals only | |
| 1.1 Remaining parasitaemic after 24 hours | 1 | 195 | Risk Ratio (M‐H, Random, 95% CI) | 0.22 [0.15, 0.34] |
| 1.2 Remaining parasitaemic after 48 hours | 1 | 195 | Risk Ratio (M‐H, Random, 95% CI) | 0.09 [0.03, 0.27] |
| 1.3 Remaining parasitaemic after 72 hours | 1 | 195 | Risk Ratio (M‐H, Random, 95% CI) | 0.17 [0.03, 0.81] |
| 2 Fever clearance Show forest plot | 1 | Risk Ratio (M‐H, Random, 95% CI) | Subtotals only | |
| 2.1 Remaining febrile after 24 hours | 1 | 195 | Risk Ratio (M‐H, Random, 95% CI) | 1.05 [0.75, 1.48] |
| 2.2 Remaining febrile after 48 hours | 1 | 195 | Risk Ratio (M‐H, Random, 95% CI) | 0.62 [0.31, 1.23] |
| 2.3 Remaining febrile after 72 hours | 1 | 195 | Risk Ratio (M‐H, Random, 95% CI) | 0.77 [0.29, 2.02] |
| 3 Recurrence of parasitaemia Show forest plot | 1 | Risk Ratio (M‐H, Random, 95% CI) | Totals not selected | |
| 3.1 Before day 14 | 1 | Risk Ratio (M‐H, Random, 95% CI) | 0.0 [0.0, 0.0] | |
| 3.2 Before day 28 | 1 | Risk Ratio (M‐H, Random, 95% CI) | 0.0 [0.0, 0.0] | |
| 3.3 After day 28 | 1 | Risk Ratio (M‐H, Random, 95% CI) | 0.0 [0.0, 0.0] | |
| 3.4 During full follow‐up period (42 days) | 1 | Risk Ratio (M‐H, Random, 95% CI) | 0.0 [0.0, 0.0] | |
| 4 Serious adverse events Show forest plot | 1 | 209 | Risk Ratio (M‐H, Fixed, 95% CI) | 0.0 [0.0, 0.0] |
| Outcome or subgroup title | No. of studies | No. of participants | Statistical method | Effect size |
| 1 Parasite clearance Show forest plot | 1 | 72 | Risk Ratio (M‐H, Fixed, 95% CI) | 2.0 [0.19, 21.09] |
| 1.1 Remaining parasitaemia after 72 hours | 1 | 72 | Risk Ratio (M‐H, Fixed, 95% CI) | 2.0 [0.19, 21.09] |
| 2 Recurrence of parasitaemia Show forest plot | 1 | Risk Ratio (M‐H, Random, 95% CI) | Totals not selected | |
| 2.1 Before day 14 | 1 | Risk Ratio (M‐H, Random, 95% CI) | 0.0 [0.0, 0.0] | |
| 2.2 Before day 28 | 1 | Risk Ratio (M‐H, Random, 95% CI) | 0.0 [0.0, 0.0] | |
| 2.3 After day 28 | 1 | Risk Ratio (M‐H, Random, 95% CI) | 0.0 [0.0, 0.0] | |
| 2.4 During full follow‐up period (42 days) | 1 | Risk Ratio (M‐H, Random, 95% CI) | 0.0 [0.0, 0.0] | |
| Outcome or subgroup title | No. of studies | No. of participants | Statistical method | Effect size |
| 1 Remaining parasitemic after 24 hours Show forest plot | 5 | Risk Ratio (M‐H, Random, 95% CI) | Subtotals only | |
| 1.1 DHA‐P versus AS+MQ | 3 | 120 | Risk Ratio (M‐H, Random, 95% CI) | 1.18 [0.28, 4.92] |
| 1.2 DHA‐P versus AL6 | 1 | 83 | Risk Ratio (M‐H, Random, 95% CI) | 0.78 [0.31, 1.94] |
| 1.3 AS+MQ versus AL6 | 1 | 24 | Risk Ratio (M‐H, Random, 95% CI) | 1.02 [0.60, 1.72] |
| 1.4 DHA‐P versus AS+SP | 1 | 95 | Risk Ratio (M‐H, Random, 95% CI) | 1.35 [0.49, 3.72] |
| 2 Remaining parasitemic after 48 hours Show forest plot | 5 | Risk Ratio (M‐H, Random, 95% CI) | Subtotals only | |
| 2.1 DHA‐P versus AS+MQ | 3 | 120 | Risk Ratio (M‐H, Random, 95% CI) | 0.0 [0.0, 0.0] |
| 2.2 DHA‐P versus AL6 | 1 | 83 | Risk Ratio (M‐H, Random, 95% CI) | 0.44 [0.04, 4.70] |
| 2.3 AS+MQ versus AL6 | 1 | 24 | Risk Ratio (M‐H, Random, 95% CI) | 5.13 [0.29, 89.57] |
| 2.4 DHA‐P versus AS+SP | 1 | 95 | Risk Ratio (M‐H, Random, 95% CI) | 3.47 [0.14, 83.00] |
| 3 Remaining febrile after 24 hours Show forest plot | 1 | Risk Ratio (M‐H, Random, 95% CI) | Subtotals only | |
| 3.1 DHA‐P versus AL6 | 1 | 83 | Risk Ratio (M‐H, Random, 95% CI) | 1.39 [0.83, 2.33] |
| 3.2 DHA‐P versus AS+SP | 1 | 95 | Risk Ratio (M‐H, Random, 95% CI) | 0.94 [0.64, 1.40] |
| 4 Remaining febrile after 48 hours Show forest plot | 1 | Risk Ratio (M‐H, Random, 95% CI) | Subtotals only | |
| 4.1 DHA‐P versus AL6 | 1 | 83 | Risk Ratio (M‐H, Random, 95% CI) | 0.63 [0.22, 1.83] |
| 4.2 DHA‐P versus AS+SP | 1 | 95 | Risk Ratio (M‐H, Random, 95% CI) | 1.45 [0.41, 5.06] |
| 5 Recurrent parasitaemia before day 28 Show forest plot | 8 | Risk Ratio (M‐H, Random, 95% CI) | Subtotals only | |
| 5.1 DHA‐P versus AS+MQ | 4 | 186 | Risk Ratio (M‐H, Random, 95% CI) | 0.17 [0.02, 1.45] |
| 5.2 DHA‐P versus AL6 | 3 | 237 | Risk Ratio (M‐H, Random, 95% CI) | 0.15 [0.04, 0.58] |
| 5.3 DHA‐P versus AS+AQ | 2 | 108 | Risk Ratio (M‐H, Random, 95% CI) | 0.04 [0.00, 0.73] |
| 5.4 DHA‐P versus AS+SP | 1 | 77 | Risk Ratio (M‐H, Random, 95% CI) | 0.32 [0.15, 0.72] |
| 5.5 AS+MQ versus AL6 | 2 | 56 | Risk Ratio (M‐H, Random, 95% CI) | 0.06 [0.01, 0.40] |
| 5.6 AS+MQ versus AS+AQ | 1 | 34 | Risk Ratio (M‐H, Random, 95% CI) | 0.0 [0.0, 0.0] |
| 5.7 AL6 versus AS+AQ | 1 | 28 | Risk Ratio (M‐H, Random, 95% CI) | 16.06 [1.03, 249.60] |
| 5.8 AL6 versus AS+SP | 1 | 72 | Risk Ratio (M‐H, Random, 95% CI) | 1.06 [0.67, 1.68] |
| 6 Recurrent parasitaemia after day 28 Show forest plot | 8 | Risk Ratio (M‐H, Random, 95% CI) | Subtotals only | |
| 6.1 DHA‐P versus AS+MQ | 4 | 169 | Risk Ratio (M‐H, Random, 95% CI) | 0.80 [0.58, 1.09] |
| 6.2 DHA‐P versus AL6 | 3 | 168 | Risk Ratio (M‐H, Random, 95% CI) | 0.40 [0.11, 1.38] |
| 6.3 DHA‐P versus AS+AQ | 2 | 95 | Risk Ratio (M‐H, Random, 95% CI) | 0.54 [0.12, 2.40] |
| 6.4 DHA‐P versus AS+SP | 1 | 50 | Risk Ratio (M‐H, Random, 95% CI) | 0.44 [0.14, 1.38] |
| 6.5 AS+MQ versus AL6 | 2 | 45 | Risk Ratio (M‐H, Random, 95% CI) | 0.92 [0.61, 1.37] |
| 6.6 AS+MQ versus AS+AQ | 1 | 36 | Risk Ratio (M‐H, Random, 95% CI) | 1.06 [0.72, 1.55] |
| 6.7 AL6 versus AS+AQ | 1 | 18 | Risk Ratio (M‐H, Random, 95% CI) | 1.11 [0.68, 1.80] |
| 6.8 AL6 versus AS+SP | 1 | 38 | Risk Ratio (M‐H, Random, 95% CI) | 0.73 [0.29, 1.84] |
| 7 Recurrent parasitaemia during full follow‐up period (0 to 42 or 63 days) Show forest plot | 8 | Risk Ratio (M‐H, Random, 95% CI) | Subtotals only | |
| 7.1 DHA‐P versus AS+MQ | 4 | 186 | Risk Ratio (M‐H, Random, 95% CI) | 0.17 [0.02, 1.45] |
| 7.2 DHA‐P versus AL6 | 3 | 237 | Risk Ratio (M‐H, Random, 95% CI) | 0.15 [0.04, 0.58] |
| 7.3 DHA‐P versus AS+AQ | 2 | 108 | Risk Ratio (M‐H, Random, 95% CI) | 0.04 [0.00, 0.73] |
| 7.4 DHA‐P versus AS+SP | 1 | 77 | Risk Ratio (M‐H, Random, 95% CI) | 0.32 [0.15, 0.72] |
| 7.5 AS+MQ versus AL6 | 2 | 56 | Risk Ratio (M‐H, Random, 95% CI) | 0.06 [0.01, 0.40] |
| 7.6 AS+MQ versus AS+AQ | 1 | 34 | Risk Ratio (M‐H, Random, 95% CI) | 0.0 [0.0, 0.0] |
| 7.7 AL6 versus AS+AQ | 1 | 28 | Risk Ratio (M‐H, Random, 95% CI) | 16.06 [1.03, 249.60] |
| 7.8 AL6 versus AS+SP | 1 | 72 | Risk Ratio (M‐H, Random, 95% CI) | 1.06 [0.67, 1.68] |
| Outcome or subgroup title | No. of studies | No. of participants | Statistical method | Effect size |
| 1 Recurrent parasitaemia ‐ settings described as low transmission Show forest plot | 4 | Risk Ratio (M‐H, Random, 95% CI) | Subtotals only | |
| 1.1 Before day 28 | 4 | 239 | Risk Ratio (M‐H, Random, 95% CI) | 0.12 [0.02, 0.63] |
| 1.2 After day 28 ‐ without primaquine | 4 | 187 | Risk Ratio (M‐H, Random, 95% CI) | 0.80 [0.59, 1.09] |
| 1.3 During full follow‐up period (42 to 63 days) ‐ without primaquine | 4 | 201 | Risk Ratio (M‐H, Random, 95% CI) | 0.76 [0.56, 1.02] |
| 2 Recurrent parasitaemia ‐ settings described as high transmission Show forest plot | 3 | Risk Ratio (M‐H, Random, 95% CI) | Subtotals only | |
| 2.1 Before day 28 | 3 | 334 | Risk Ratio (M‐H, Random, 95% CI) | 0.20 [0.08, 0.49] |
| 2.2 After day 28 ‐ with primaquine | 2 | 179 | Risk Ratio (M‐H, Random, 95% CI) | 0.21 [0.10, 0.46] |
| 2.3 After day 28 ‐ without primaquine | 1 | 66 | Risk Ratio (M‐H, Random, 95% CI) | 0.40 [0.14, 1.10] |
| 2.4 During full follow‐up period (42 days) ‐ with primaquine | 2 | 210 | Risk Ratio (M‐H, Random, 95% CI) | 0.16 [0.08, 0.32] |
| 2.5 During full follow‐up period (42 days) ‐ without primaquine | 1 | 108 | Risk Ratio (M‐H, Random, 95% CI) | 0.42 [0.24, 0.72] |