Tratamiento combinado con artemisinina para el tratamiento del paludismo por Plasmodium vivax no complicado
Información
- DOI:
- https://doi.org/10.1002/14651858.CD008492.pub3Copiar DOI

- Base de datos:
-
- Cochrane Database of Systematic Reviews
- Versión publicada:
-
- 25 octubre 2013see what's new
- Tipo:
-
- Intervention
- Etapa:
-
- Review
- Grupo Editorial Cochrane:
-
Grupo Cochrane de Enfermedades infecciosas
- Clasificada:
-
- Pendiente de actualización
Authors currently updating
The update is due to be published in 2019.Evaluada: 22 March 2019
- Pendiente de actualización
- Copyright:
-
- Copyright © 2013 The Cochrane Collaboration. Published by John Wiley & Sons, Ltd.
Cifras del artículo
Altmetric:
Citado por:
Autores
Contributions of authors
David Sinclair, Felicity Brand, and Piero Olliaro conceived and designed the protocol. For the original review David Sinclair, Felicity Brand, and Nithya Gogtay extracted the data, and David Sinclair analysed the data and wrote the first draft with Nithya Gogtay. For this update. Nithya Gogtay, Kannan Sridharan, and Urmila Thatte screened the search articles, extracted data, and analysed the data. David Sinclair and Piero Olliaro assisted with revising subsequent drafts and preparing the final draft for publication.
Sources of support
Internal sources
-
Department for International Development (DFID), UK.
External sources
-
No sources of support supplied
Declarations of interest
None known.
Acknowledgements
We thank Felicity Brand who was an author on the first version of this review. We thank Richard Kirubakaran for his assistance in analysing the data sets from Smithuis 2006 MMR and Smithuis 2010 MMR.
The editorial base for the Cochrane Infectious Disease Group is funded by the Department for International Development (DFID), UK, for the benefit of low‐ and middle‐income countries.
Version history
| Published | Title | Stage | Authors | Version |
| 2013 Oct 25 | Artemisinin‐based combination therapy for treating uncomplicated <i>Plasmodium vivax</i> malaria | Review | Nithya Gogtay, Sridharan Kannan, Urmila M Thatte, Piero L Olliaro, David Sinclair | |
| 2011 Jul 06 | Artemisinin‐based combination therapy for treating uncomplicated <i>Plasmodium vivax</i> malaria | Review | David Sinclair, Nithya Gogtay, Felicity Brand, Piero L Olliaro | |
| 2010 Apr 14 | Artemisinin‐based combination therapy for the treatment of uncomplicated <i>Plasmodium vivax</i> malaria and the prevention of relapses | Protocol | Nithya Gogtay, Felicity Brand, Piero Olliaro, David Sinclair | |
Differences between protocol and review
We made the following adjustments:
The protocol stated: 'For the primary outcome 'Recurrence of P. vivax by day 14 or 28' we will subgroup trials according to those which also gave primaquine and those which did not'. In conducting the review we found that there were too few trials to make this subgroup analysis informative.
The protocol stated: 'For the secondary outcome with prolonged follow‐up 'Recurrence of P. vivax parasitaemia at 1 to 12 months' we will only include trials which also give the WHO recommended dose of primaquine to both treatment arms'. We chose to include the trials where primaquine was not given as this is informative for settings where primaquine is not administered routinely due to either a high local prevalence of G6PD or very high transmission intensity.
When analysing the data for'Recurrent parasitemias after day 28' we excluded the participants who had experienced a recurrence before day 28 from both the numerator and the denominator. This was not explicitly stated in the protocol. The reasoning for this change was to prevent a drug which was superior in the first 28 days (more indicative of treatment of the blood stage) appearing superior at 42 days or longer (more indicative of an effect on relapse or re‐infection) even if there was no difference during the second period.
Keywords
MeSH
Medical Subject Headings (MeSH) Keywords
- Antimalarials [*therapeutic use];
- Artemether, Lumefantrine Drug Combination;
- Artemisinins [*therapeutic use];
- Drug Combinations;
- Drug Resistance;
- Drug Therapy, Combination [methods];
- Ethanolamines [therapeutic use];
- Fluorenes [therapeutic use];
- Malaria, Vivax [*drug therapy, prevention & control];
- Parasitemia [*drug therapy];
- Primaquine [therapeutic use];
- Pyrimethamine [therapeutic use];
- Quinolines [therapeutic use];
- Randomized Controlled Trials as Topic;
- Secondary Prevention;
- Sulfadoxine [therapeutic use];
Medical Subject Headings Check Words
Humans;
PICO

Study flow diagram.

Risk of bias summary: review authors' judgements about each risk of bias item for each included study.
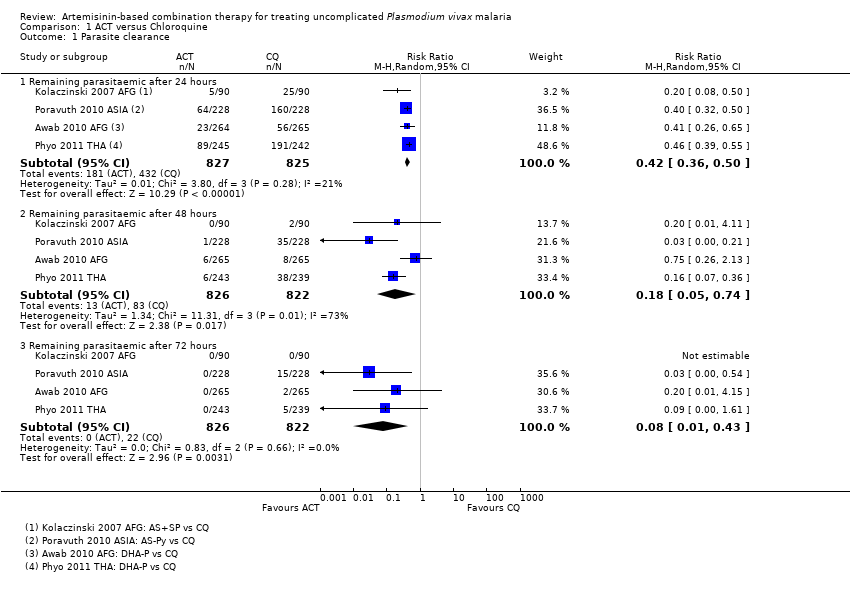
Comparison 1 ACT versus Chloroquine, Outcome 1 Parasite clearance.
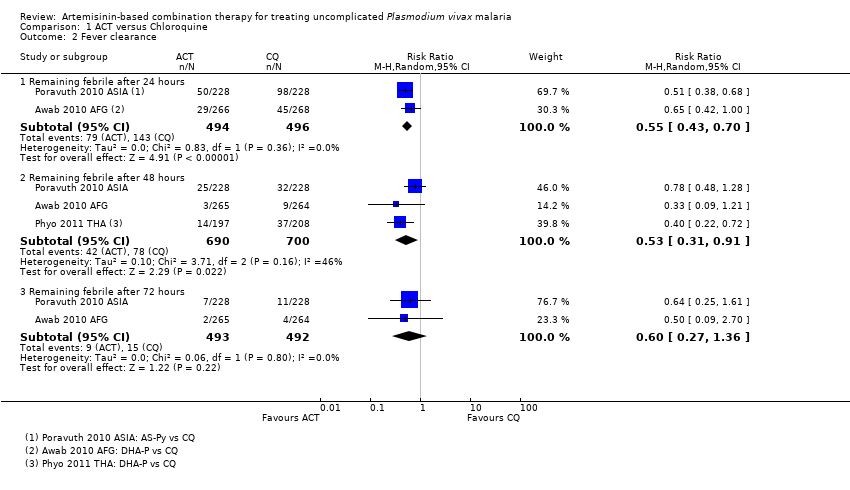
Comparison 1 ACT versus Chloroquine, Outcome 2 Fever clearance.

Comparison 1 ACT versus Chloroquine, Outcome 3 Recurrence of parasitaemia.
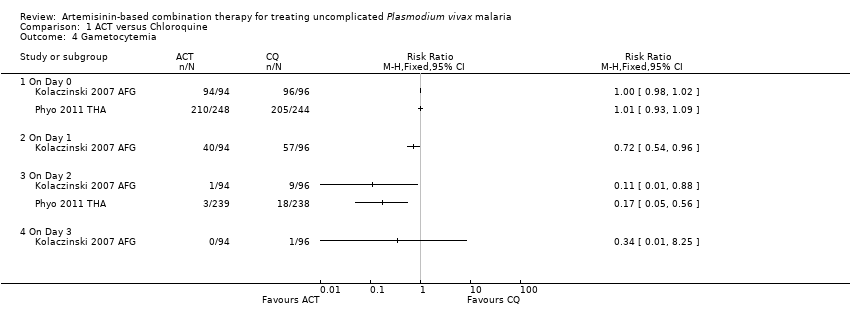
Comparison 1 ACT versus Chloroquine, Outcome 4 Gametocytemia.
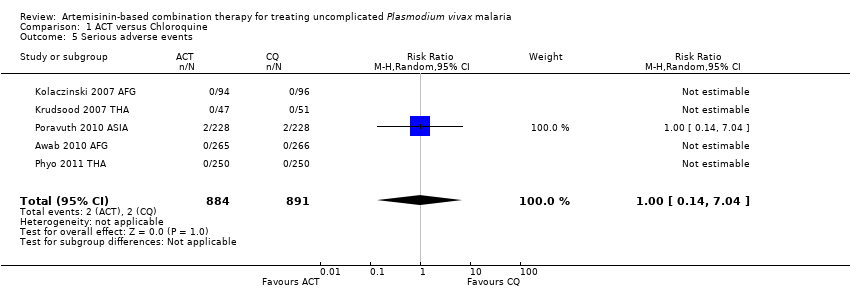
Comparison 1 ACT versus Chloroquine, Outcome 5 Serious adverse events.

Comparison 2 ACT versus Chloroquine plus Sulfadoxine‐pyrimethamine, Outcome 1 Parasite clearance.

Comparison 2 ACT versus Chloroquine plus Sulfadoxine‐pyrimethamine, Outcome 2 Fever clearance.
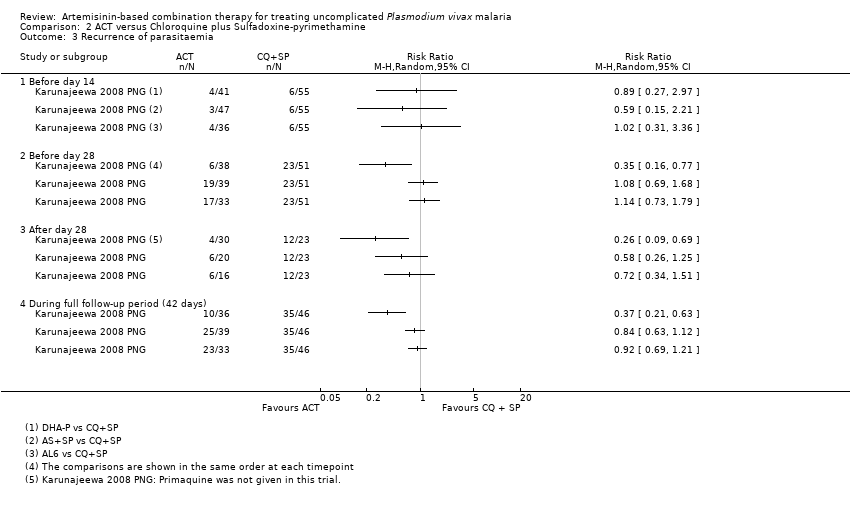
Comparison 2 ACT versus Chloroquine plus Sulfadoxine‐pyrimethamine, Outcome 3 Recurrence of parasitaemia.

Comparison 2 ACT versus Chloroquine plus Sulfadoxine‐pyrimethamine, Outcome 4 Serious adverse events.

Comparison 3 ACT versus Quinine, Outcome 1 Parasite clearance.

Comparison 3 ACT versus Quinine, Outcome 2 Recurrence of parasitaemia.

Comparison 4 ACT versus ACT, Outcome 1 Remaining parasitemic after 24 hours.
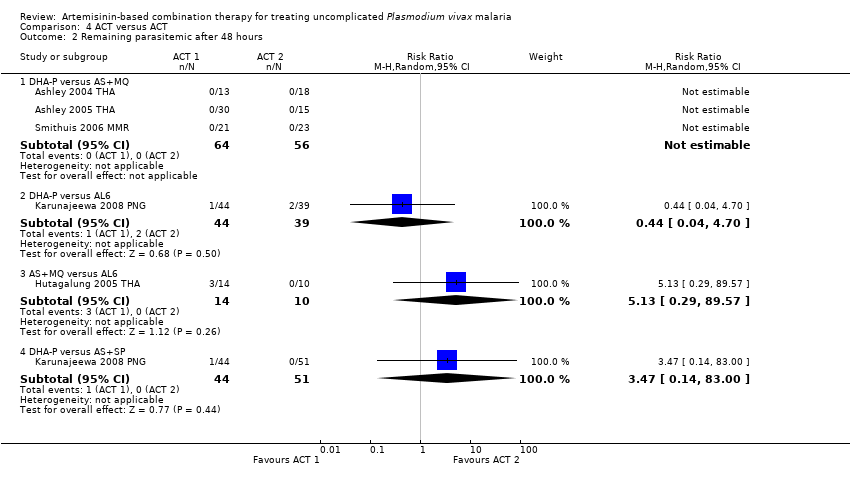
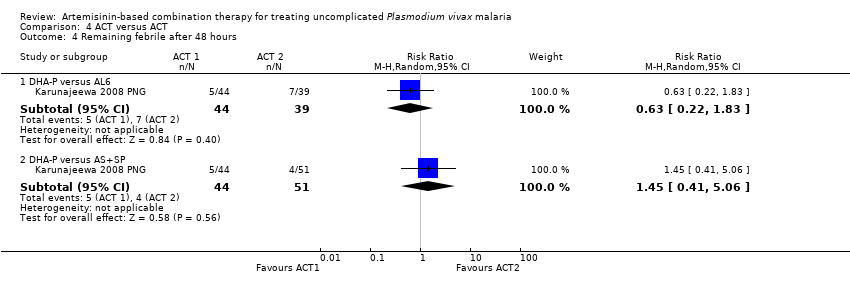
Comparison 4 ACT versus ACT, Outcome 2 Remaining parasitemic after 48 hours.
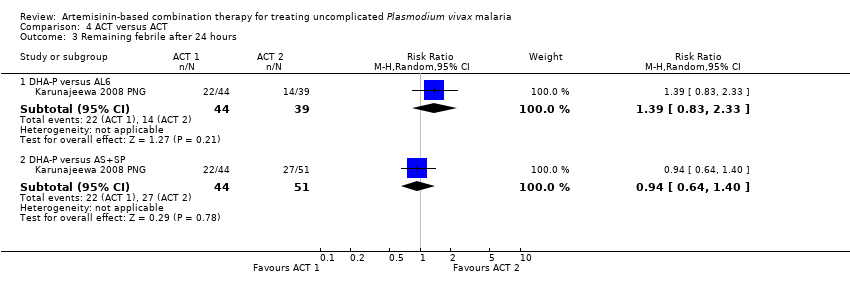
Comparison 4 ACT versus ACT, Outcome 3 Remaining febrile after 24 hours.
Comparison 4 ACT versus ACT, Outcome 4 Remaining febrile after 48 hours.
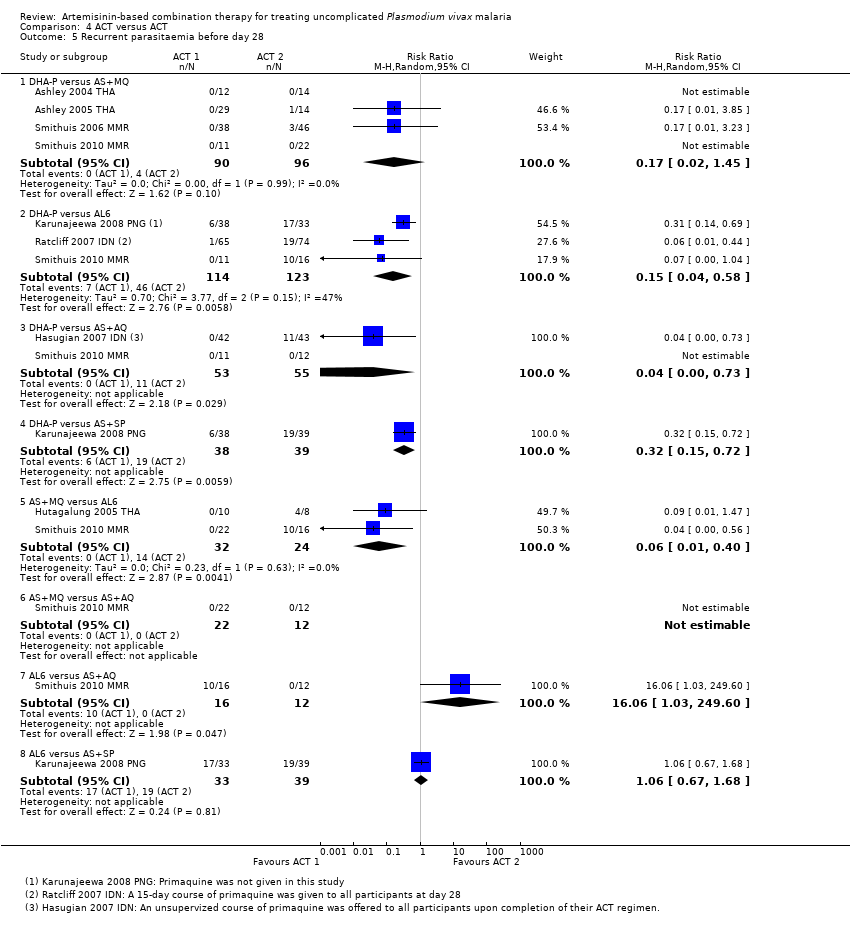
Comparison 4 ACT versus ACT, Outcome 5 Recurrent parasitaemia before day 28.
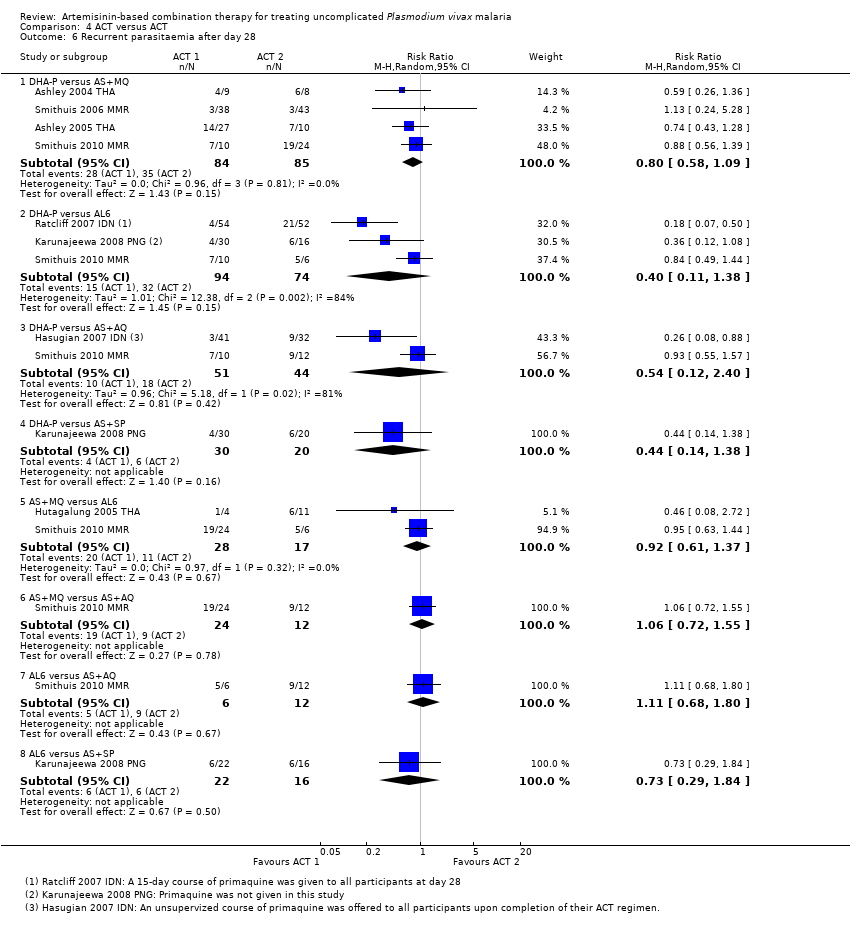
Comparison 4 ACT versus ACT, Outcome 6 Recurrent parasitaemia after day 28.

Comparison 4 ACT versus ACT, Outcome 7 Recurrent parasitaemia during full follow‐up period (0 to 42 or 63 days).
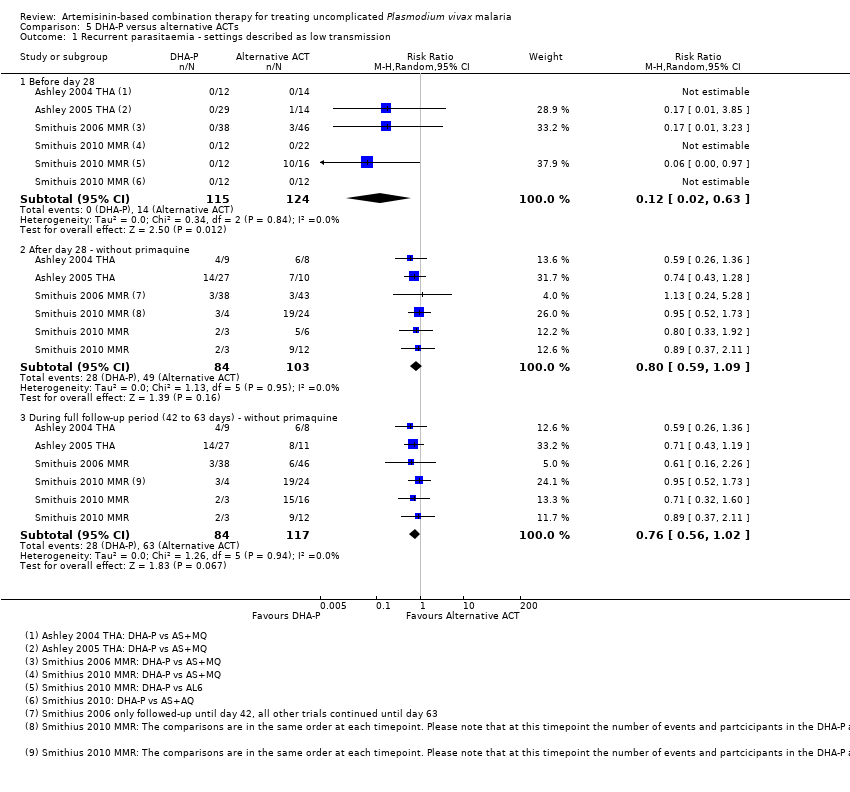
Comparison 5 DHA‐P versus alternative ACTs, Outcome 1 Recurrent parasitaemia ‐ settings described as low transmission.

Comparison 5 DHA‐P versus alternative ACTs, Outcome 2 Recurrent parasitaemia ‐ settings described as high transmission.
| Artemisinin‐based combination therapy compared with chloroquine for uncomplicated P. vivax malaria | |||||
| Patient or population: Adults and children with uncomplicated P. vivax malaria Settings: Endemic areas where chloroquine is still an effective treatment for the first 28 days Intervention: Artemisinin‐based combination therapy Comparison: Chloroquine | |||||
| Outcomes | Illustrative comparative risks* (95% CI) | Relative effect | No of participants | Quality of the evidence | |
| Assumed risk | Corresponding risk | ||||
| Chloroquine | ACT | ||||
| Remaining parasitaemic at 24 hours | 52 per 100 | 22 per 100 | RR 0.42 | 1652 | high2,3,4,5 |
| Remaining febrile after 24 hours | 29 per 100 | 16 per 100 | RR 0.55 | 990 | moderate2,4,5,7 |
| Effective treatment of the blood stage parasite As assessed by: Recurrent parasitaemia before day 28 | 3 per 100 | 2 per 100 | RR 0.58 | 1622 | high2,3,4,9 |
| Post‐treatment prophylaxis As assessed by: Recurrent parasitaemia between day 28 and day 42/56/63 | With primaquine | RR 0.27 | 376 (1 study10) | low11,12 | |
| 6 per 100 | 2 per 100 | ||||
| Without primaquine | RR 0.57 | 1066 | moderate3,5,14 | ||
| 40 per 100 | 23 per 100 | ||||
| Serious adverse events | 0 per 100 | 0 per 100 | RR 1 | 1775 | high2,3,4,9 |
| *The basis for the assumed risk (for example, the median control group risk across studies) is provided in footnotes. The corresponding risk (and its 95% CI) is based on the assumed risk in the comparison group and the relative effect of the intervention (and its 95% CI). | |||||
| GRADE Working Group grades of evidence | |||||
| 1Awab 2010 AFG (Afghanistan), Kolaczinski 2007 AFG (Afghanistan), Poravuth 2010 ASIA (multi‐site), and Phyo 2011 THA (Thailand). | |||||
| Dihydroartemisinin‐piperaquine compared with alternative artemisinin‐based combination treatments for uncomplicated P. vivax malaria | |||||
| Patient or population: Adults and children with uncomplicated P. vivax malaria Settings: Settings with high transmission of P. vivax (chloroquine resistance is also reported as high) Intervention: Dihydroartemisinin‐piperaquine Comparison: Alternative ACTs | |||||
| Outcomes | Illustrative comparative risks* (95% CI) | Relative effect | No of participants | Quality of the evidence | |
| Assumed risk | Corresponding risk | ||||
| Alternative ACT | DHA‐P | ||||
| Effective treatment of the blood stage parasite As assessed by: Recurrent parasitaemia before day 28 | 35 per 100 | 7 per 100 | RR 0.20 | 334 | moderate3,4,5,6 |
| Post‐treatment prophylaxis As assessed by: Recurrent parasitaemia between day 28 and 42 | With primaquine | RR 0.21 | 179 | low6,7,8,9 | |
| 34 per 100 | 7 per 100 | ||||
| Without primaquine | RR 0.40 | 66 | very low10,11,12 | ||
| 33 per 100 | 13 per 100 | ||||
| *The basis for the assumed risk (for example, the median control group risk across studies) is provided in footnotes. The corresponding risk (and its 95% CI) is based on the assumed risk in the comparison group and the relative effect of the intervention (and its 95% CI). | |||||
| GRADE Working Group grades of evidence | |||||
| 1Karunajeewa 2008 PNG (Papua New Guinea). | |||||
| Search set | Search terms used for all databases1 |
| 1 | vivax |
| 2 | Arte* |
| 3 | Dihydroarte* |
| 4 | 2 or 3 |
| 5 | 1 and 4 |
| 6 | (search terms for RCTs) |
| 7 | 5 and 6 |
| 8 | Limit 7 to Human |
| 1 Cochrane Infectious Disease Group Specialized Register; Cochrane Central Register of Controlled Trials (CENTRAL), published in The Cochrane Library; MEDLINE; EMBASE; and LILACS. | |
| Study ID | Comparison | Median parasite clearance time (range) | P value | |
| ACT | CQ | |||
| AL6 versus CQ | 41.6 hrs | 55.8 hrs | < 0.01 | |
| AS‐Py versus CQ | 23.0 hrs (7.0 to 55.9) | 32.0 hrs (7.5 to 63.9) | < 0.0001 | |
| Study ID | Comparison | Median fever clearance time (range) | P value | |
| ACT | CQ | |||
| AL6 versus CQ | 21.8 hrs | 25.3 hrs | 0.12 | |
| AS‐Py versus CQ | 15.9 hrs | 23.8 hrs | 0.0017 | |
| Outcome or subgroup title | No. of studies | No. of participants | Statistical method | Effect size |
| 1 Parasite clearance Show forest plot | 4 | Risk Ratio (M‐H, Random, 95% CI) | Subtotals only | |
| 1.1 Remaining parasitaemic after 24 hours | 4 | 1652 | Risk Ratio (M‐H, Random, 95% CI) | 0.42 [0.36, 0.50] |
| 1.2 Remaining parasitaemic after 48 hours | 4 | 1648 | Risk Ratio (M‐H, Random, 95% CI) | 0.18 [0.05, 0.74] |
| 1.3 Remaining parasitaemic after 72 hours | 4 | 1648 | Risk Ratio (M‐H, Random, 95% CI) | 0.08 [0.01, 0.43] |
| 2 Fever clearance Show forest plot | 3 | Risk Ratio (M‐H, Random, 95% CI) | Subtotals only | |
| 2.1 Remaining febrile after 24 hours | 2 | 990 | Risk Ratio (M‐H, Random, 95% CI) | 0.55 [0.43, 0.70] |
| 2.2 Remaining febrile after 48 hours | 3 | 1390 | Risk Ratio (M‐H, Random, 95% CI) | 0.53 [0.31, 0.91] |
| 2.3 Remaining febrile after 72 hours | 2 | 985 | Risk Ratio (M‐H, Random, 95% CI) | 0.60 [0.27, 1.36] |
| 3 Recurrence of parasitaemia Show forest plot | 5 | Risk Ratio (M‐H, Random, 95% CI) | Subtotals only | |
| 3.1 Before day 14 | 1 | 427 | Risk Ratio (M‐H, Random, 95% CI) | 2.88 [0.12, 70.22] |
| 3.2 Before day 28 | 5 | 1622 | Risk Ratio (M‐H, Random, 95% CI) | 0.58 [0.18, 1.90] |
| 3.3 After day 28 (primaquine not given) | 3 | 1066 | Risk Ratio (M‐H, Random, 95% CI) | 0.57 [0.40, 0.82] |
| 3.4 After day 28 (primaquine given) | 1 | 376 | Risk Ratio (M‐H, Random, 95% CI) | 0.27 [0.08, 0.94] |
| 3.5 During full follow‐up period (42 or 56 days) | 4 | 1460 | Risk Ratio (M‐H, Random, 95% CI) | 0.59 [0.44, 0.78] |
| 4 Gametocytemia Show forest plot | 2 | Risk Ratio (M‐H, Fixed, 95% CI) | Totals not selected | |
| 4.1 On Day 0 | 2 | Risk Ratio (M‐H, Fixed, 95% CI) | 0.0 [0.0, 0.0] | |
| 4.2 On Day 1 | 1 | Risk Ratio (M‐H, Fixed, 95% CI) | 0.0 [0.0, 0.0] | |
| 4.3 On Day 2 | 2 | Risk Ratio (M‐H, Fixed, 95% CI) | 0.0 [0.0, 0.0] | |
| 4.4 On Day 3 | 1 | Risk Ratio (M‐H, Fixed, 95% CI) | 0.0 [0.0, 0.0] | |
| 5 Serious adverse events Show forest plot | 5 | 1775 | Risk Ratio (M‐H, Random, 95% CI) | 1.0 [0.14, 7.04] |
| Outcome or subgroup title | No. of studies | No. of participants | Statistical method | Effect size |
| 1 Parasite clearance Show forest plot | 1 | Risk Ratio (M‐H, Random, 95% CI) | Subtotals only | |
| 1.1 Remaining parasitaemic after 24 hours | 1 | 195 | Risk Ratio (M‐H, Random, 95% CI) | 0.22 [0.15, 0.34] |
| 1.2 Remaining parasitaemic after 48 hours | 1 | 195 | Risk Ratio (M‐H, Random, 95% CI) | 0.09 [0.03, 0.27] |
| 1.3 Remaining parasitaemic after 72 hours | 1 | 195 | Risk Ratio (M‐H, Random, 95% CI) | 0.17 [0.03, 0.81] |
| 2 Fever clearance Show forest plot | 1 | Risk Ratio (M‐H, Random, 95% CI) | Subtotals only | |
| 2.1 Remaining febrile after 24 hours | 1 | 195 | Risk Ratio (M‐H, Random, 95% CI) | 1.05 [0.75, 1.48] |
| 2.2 Remaining febrile after 48 hours | 1 | 195 | Risk Ratio (M‐H, Random, 95% CI) | 0.62 [0.31, 1.23] |
| 2.3 Remaining febrile after 72 hours | 1 | 195 | Risk Ratio (M‐H, Random, 95% CI) | 0.77 [0.29, 2.02] |
| 3 Recurrence of parasitaemia Show forest plot | 1 | Risk Ratio (M‐H, Random, 95% CI) | Totals not selected | |
| 3.1 Before day 14 | 1 | Risk Ratio (M‐H, Random, 95% CI) | 0.0 [0.0, 0.0] | |
| 3.2 Before day 28 | 1 | Risk Ratio (M‐H, Random, 95% CI) | 0.0 [0.0, 0.0] | |
| 3.3 After day 28 | 1 | Risk Ratio (M‐H, Random, 95% CI) | 0.0 [0.0, 0.0] | |
| 3.4 During full follow‐up period (42 days) | 1 | Risk Ratio (M‐H, Random, 95% CI) | 0.0 [0.0, 0.0] | |
| 4 Serious adverse events Show forest plot | 1 | 209 | Risk Ratio (M‐H, Fixed, 95% CI) | 0.0 [0.0, 0.0] |
| Outcome or subgroup title | No. of studies | No. of participants | Statistical method | Effect size |
| 1 Parasite clearance Show forest plot | 1 | 72 | Risk Ratio (M‐H, Fixed, 95% CI) | 2.0 [0.19, 21.09] |
| 1.1 Remaining parasitaemia after 72 hours | 1 | 72 | Risk Ratio (M‐H, Fixed, 95% CI) | 2.0 [0.19, 21.09] |
| 2 Recurrence of parasitaemia Show forest plot | 1 | Risk Ratio (M‐H, Random, 95% CI) | Totals not selected | |
| 2.1 Before day 14 | 1 | Risk Ratio (M‐H, Random, 95% CI) | 0.0 [0.0, 0.0] | |
| 2.2 Before day 28 | 1 | Risk Ratio (M‐H, Random, 95% CI) | 0.0 [0.0, 0.0] | |
| 2.3 After day 28 | 1 | Risk Ratio (M‐H, Random, 95% CI) | 0.0 [0.0, 0.0] | |
| 2.4 During full follow‐up period (42 days) | 1 | Risk Ratio (M‐H, Random, 95% CI) | 0.0 [0.0, 0.0] | |
| Outcome or subgroup title | No. of studies | No. of participants | Statistical method | Effect size |
| 1 Remaining parasitemic after 24 hours Show forest plot | 5 | Risk Ratio (M‐H, Random, 95% CI) | Subtotals only | |
| 1.1 DHA‐P versus AS+MQ | 3 | 120 | Risk Ratio (M‐H, Random, 95% CI) | 1.18 [0.28, 4.92] |
| 1.2 DHA‐P versus AL6 | 1 | 83 | Risk Ratio (M‐H, Random, 95% CI) | 0.78 [0.31, 1.94] |
| 1.3 AS+MQ versus AL6 | 1 | 24 | Risk Ratio (M‐H, Random, 95% CI) | 1.02 [0.60, 1.72] |
| 1.4 DHA‐P versus AS+SP | 1 | 95 | Risk Ratio (M‐H, Random, 95% CI) | 1.35 [0.49, 3.72] |
| 2 Remaining parasitemic after 48 hours Show forest plot | 5 | Risk Ratio (M‐H, Random, 95% CI) | Subtotals only | |
| 2.1 DHA‐P versus AS+MQ | 3 | 120 | Risk Ratio (M‐H, Random, 95% CI) | 0.0 [0.0, 0.0] |
| 2.2 DHA‐P versus AL6 | 1 | 83 | Risk Ratio (M‐H, Random, 95% CI) | 0.44 [0.04, 4.70] |
| 2.3 AS+MQ versus AL6 | 1 | 24 | Risk Ratio (M‐H, Random, 95% CI) | 5.13 [0.29, 89.57] |
| 2.4 DHA‐P versus AS+SP | 1 | 95 | Risk Ratio (M‐H, Random, 95% CI) | 3.47 [0.14, 83.00] |
| 3 Remaining febrile after 24 hours Show forest plot | 1 | Risk Ratio (M‐H, Random, 95% CI) | Subtotals only | |
| 3.1 DHA‐P versus AL6 | 1 | 83 | Risk Ratio (M‐H, Random, 95% CI) | 1.39 [0.83, 2.33] |
| 3.2 DHA‐P versus AS+SP | 1 | 95 | Risk Ratio (M‐H, Random, 95% CI) | 0.94 [0.64, 1.40] |
| 4 Remaining febrile after 48 hours Show forest plot | 1 | Risk Ratio (M‐H, Random, 95% CI) | Subtotals only | |
| 4.1 DHA‐P versus AL6 | 1 | 83 | Risk Ratio (M‐H, Random, 95% CI) | 0.63 [0.22, 1.83] |
| 4.2 DHA‐P versus AS+SP | 1 | 95 | Risk Ratio (M‐H, Random, 95% CI) | 1.45 [0.41, 5.06] |
| 5 Recurrent parasitaemia before day 28 Show forest plot | 8 | Risk Ratio (M‐H, Random, 95% CI) | Subtotals only | |
| 5.1 DHA‐P versus AS+MQ | 4 | 186 | Risk Ratio (M‐H, Random, 95% CI) | 0.17 [0.02, 1.45] |
| 5.2 DHA‐P versus AL6 | 3 | 237 | Risk Ratio (M‐H, Random, 95% CI) | 0.15 [0.04, 0.58] |
| 5.3 DHA‐P versus AS+AQ | 2 | 108 | Risk Ratio (M‐H, Random, 95% CI) | 0.04 [0.00, 0.73] |
| 5.4 DHA‐P versus AS+SP | 1 | 77 | Risk Ratio (M‐H, Random, 95% CI) | 0.32 [0.15, 0.72] |
| 5.5 AS+MQ versus AL6 | 2 | 56 | Risk Ratio (M‐H, Random, 95% CI) | 0.06 [0.01, 0.40] |
| 5.6 AS+MQ versus AS+AQ | 1 | 34 | Risk Ratio (M‐H, Random, 95% CI) | 0.0 [0.0, 0.0] |
| 5.7 AL6 versus AS+AQ | 1 | 28 | Risk Ratio (M‐H, Random, 95% CI) | 16.06 [1.03, 249.60] |
| 5.8 AL6 versus AS+SP | 1 | 72 | Risk Ratio (M‐H, Random, 95% CI) | 1.06 [0.67, 1.68] |
| 6 Recurrent parasitaemia after day 28 Show forest plot | 8 | Risk Ratio (M‐H, Random, 95% CI) | Subtotals only | |
| 6.1 DHA‐P versus AS+MQ | 4 | 169 | Risk Ratio (M‐H, Random, 95% CI) | 0.80 [0.58, 1.09] |
| 6.2 DHA‐P versus AL6 | 3 | 168 | Risk Ratio (M‐H, Random, 95% CI) | 0.40 [0.11, 1.38] |
| 6.3 DHA‐P versus AS+AQ | 2 | 95 | Risk Ratio (M‐H, Random, 95% CI) | 0.54 [0.12, 2.40] |
| 6.4 DHA‐P versus AS+SP | 1 | 50 | Risk Ratio (M‐H, Random, 95% CI) | 0.44 [0.14, 1.38] |
| 6.5 AS+MQ versus AL6 | 2 | 45 | Risk Ratio (M‐H, Random, 95% CI) | 0.92 [0.61, 1.37] |
| 6.6 AS+MQ versus AS+AQ | 1 | 36 | Risk Ratio (M‐H, Random, 95% CI) | 1.06 [0.72, 1.55] |
| 6.7 AL6 versus AS+AQ | 1 | 18 | Risk Ratio (M‐H, Random, 95% CI) | 1.11 [0.68, 1.80] |
| 6.8 AL6 versus AS+SP | 1 | 38 | Risk Ratio (M‐H, Random, 95% CI) | 0.73 [0.29, 1.84] |
| 7 Recurrent parasitaemia during full follow‐up period (0 to 42 or 63 days) Show forest plot | 8 | Risk Ratio (M‐H, Random, 95% CI) | Subtotals only | |
| 7.1 DHA‐P versus AS+MQ | 4 | 186 | Risk Ratio (M‐H, Random, 95% CI) | 0.17 [0.02, 1.45] |
| 7.2 DHA‐P versus AL6 | 3 | 237 | Risk Ratio (M‐H, Random, 95% CI) | 0.15 [0.04, 0.58] |
| 7.3 DHA‐P versus AS+AQ | 2 | 108 | Risk Ratio (M‐H, Random, 95% CI) | 0.04 [0.00, 0.73] |
| 7.4 DHA‐P versus AS+SP | 1 | 77 | Risk Ratio (M‐H, Random, 95% CI) | 0.32 [0.15, 0.72] |
| 7.5 AS+MQ versus AL6 | 2 | 56 | Risk Ratio (M‐H, Random, 95% CI) | 0.06 [0.01, 0.40] |
| 7.6 AS+MQ versus AS+AQ | 1 | 34 | Risk Ratio (M‐H, Random, 95% CI) | 0.0 [0.0, 0.0] |
| 7.7 AL6 versus AS+AQ | 1 | 28 | Risk Ratio (M‐H, Random, 95% CI) | 16.06 [1.03, 249.60] |
| 7.8 AL6 versus AS+SP | 1 | 72 | Risk Ratio (M‐H, Random, 95% CI) | 1.06 [0.67, 1.68] |
| Outcome or subgroup title | No. of studies | No. of participants | Statistical method | Effect size |
| 1 Recurrent parasitaemia ‐ settings described as low transmission Show forest plot | 4 | Risk Ratio (M‐H, Random, 95% CI) | Subtotals only | |
| 1.1 Before day 28 | 4 | 239 | Risk Ratio (M‐H, Random, 95% CI) | 0.12 [0.02, 0.63] |
| 1.2 After day 28 ‐ without primaquine | 4 | 187 | Risk Ratio (M‐H, Random, 95% CI) | 0.80 [0.59, 1.09] |
| 1.3 During full follow‐up period (42 to 63 days) ‐ without primaquine | 4 | 201 | Risk Ratio (M‐H, Random, 95% CI) | 0.76 [0.56, 1.02] |
| 2 Recurrent parasitaemia ‐ settings described as high transmission Show forest plot | 3 | Risk Ratio (M‐H, Random, 95% CI) | Subtotals only | |
| 2.1 Before day 28 | 3 | 334 | Risk Ratio (M‐H, Random, 95% CI) | 0.20 [0.08, 0.49] |
| 2.2 After day 28 ‐ with primaquine | 2 | 179 | Risk Ratio (M‐H, Random, 95% CI) | 0.21 [0.10, 0.46] |
| 2.3 After day 28 ‐ without primaquine | 1 | 66 | Risk Ratio (M‐H, Random, 95% CI) | 0.40 [0.14, 1.10] |
| 2.4 During full follow‐up period (42 days) ‐ with primaquine | 2 | 210 | Risk Ratio (M‐H, Random, 95% CI) | 0.16 [0.08, 0.32] |
| 2.5 During full follow‐up period (42 days) ‐ without primaquine | 1 | 108 | Risk Ratio (M‐H, Random, 95% CI) | 0.42 [0.24, 0.72] |