Scolaris Content Display Scolaris Content Display

Study flow diagram.
Figuras y tablas -
Figure 1

Study flow diagram.

Risk of bias summary: review authors' judgements about each risk of bias item for each included study.
Figuras y tablas -
Figure 2

Risk of bias summary: review authors' judgements about each risk of bias item for each included study.

Comparison 1 ACT versus Chloroquine, Outcome 1 Parasite clearance.
Figuras y tablas -
Analysis 1.1

Comparison 1 ACT versus Chloroquine, Outcome 1 Parasite clearance.

Comparison 1 ACT versus Chloroquine, Outcome 2 Fever clearance.
Figuras y tablas -
Analysis 1.2

Comparison 1 ACT versus Chloroquine, Outcome 2 Fever clearance.

Comparison 1 ACT versus Chloroquine, Outcome 3 Recurrence of parasitaemia.
Figuras y tablas -
Analysis 1.3

Comparison 1 ACT versus Chloroquine, Outcome 3 Recurrence of parasitaemia.

Comparison 1 ACT versus Chloroquine, Outcome 4 Gametocytemia.
Figuras y tablas -
Analysis 1.4

Comparison 1 ACT versus Chloroquine, Outcome 4 Gametocytemia.

Comparison 1 ACT versus Chloroquine, Outcome 5 Serious adverse events.
Figuras y tablas -
Analysis 1.5

Comparison 1 ACT versus Chloroquine, Outcome 5 Serious adverse events.

Comparison 2 ACT versus Chloroquine plus Sulfadoxine‐pyrimethamine, Outcome 1 Parasite clearance.
Figuras y tablas -
Analysis 2.1

Comparison 2 ACT versus Chloroquine plus Sulfadoxine‐pyrimethamine, Outcome 1 Parasite clearance.

Comparison 2 ACT versus Chloroquine plus Sulfadoxine‐pyrimethamine, Outcome 2 Fever clearance.
Figuras y tablas -
Analysis 2.2

Comparison 2 ACT versus Chloroquine plus Sulfadoxine‐pyrimethamine, Outcome 2 Fever clearance.

Comparison 2 ACT versus Chloroquine plus Sulfadoxine‐pyrimethamine, Outcome 3 Recurrence of parasitaemia.
Figuras y tablas -
Analysis 2.3

Comparison 2 ACT versus Chloroquine plus Sulfadoxine‐pyrimethamine, Outcome 3 Recurrence of parasitaemia.

Comparison 2 ACT versus Chloroquine plus Sulfadoxine‐pyrimethamine, Outcome 4 Serious adverse events.
Figuras y tablas -
Analysis 2.4

Comparison 2 ACT versus Chloroquine plus Sulfadoxine‐pyrimethamine, Outcome 4 Serious adverse events.

Comparison 3 ACT versus Quinine, Outcome 1 Parasite clearance.
Figuras y tablas -
Analysis 3.1

Comparison 3 ACT versus Quinine, Outcome 1 Parasite clearance.

Comparison 3 ACT versus Quinine, Outcome 2 Recurrence of parasitaemia.
Figuras y tablas -
Analysis 3.2

Comparison 3 ACT versus Quinine, Outcome 2 Recurrence of parasitaemia.

Comparison 4 ACT versus ACT, Outcome 1 Remaining parasitemic after 24 hours.
Figuras y tablas -
Analysis 4.1

Comparison 4 ACT versus ACT, Outcome 1 Remaining parasitemic after 24 hours.

Comparison 4 ACT versus ACT, Outcome 2 Remaining parasitemic after 48 hours.
Figuras y tablas -
Analysis 4.2

Comparison 4 ACT versus ACT, Outcome 2 Remaining parasitemic after 48 hours.

Comparison 4 ACT versus ACT, Outcome 3 Remaining febrile after 24 hours.
Figuras y tablas -
Analysis 4.3

Comparison 4 ACT versus ACT, Outcome 3 Remaining febrile after 24 hours.

Comparison 4 ACT versus ACT, Outcome 4 Remaining febrile after 48 hours.
Figuras y tablas -
Analysis 4.4

Comparison 4 ACT versus ACT, Outcome 4 Remaining febrile after 48 hours.

Comparison 4 ACT versus ACT, Outcome 5 Recurrent parasitaemia before day 28.
Figuras y tablas -
Analysis 4.5

Comparison 4 ACT versus ACT, Outcome 5 Recurrent parasitaemia before day 28.

Comparison 4 ACT versus ACT, Outcome 6 Recurrent parasitaemia after day 28.
Figuras y tablas -
Analysis 4.6

Comparison 4 ACT versus ACT, Outcome 6 Recurrent parasitaemia after day 28.

Comparison 4 ACT versus ACT, Outcome 7 Recurrent parasitaemia during full follow‐up period (0 to 42 or 63 days).
Figuras y tablas -
Analysis 4.7

Comparison 4 ACT versus ACT, Outcome 7 Recurrent parasitaemia during full follow‐up period (0 to 42 or 63 days).

Comparison 5 DHA‐P versus alternative ACTs, Outcome 1 Recurrent parasitaemia ‐ settings described as low transmission.
Figuras y tablas -
Analysis 5.1

Comparison 5 DHA‐P versus alternative ACTs, Outcome 1 Recurrent parasitaemia ‐ settings described as low transmission.

Comparison 5 DHA‐P versus alternative ACTs, Outcome 2 Recurrent parasitaemia ‐ settings described as high transmission.
Figuras y tablas -
Analysis 5.2

Comparison 5 DHA‐P versus alternative ACTs, Outcome 2 Recurrent parasitaemia ‐ settings described as high transmission.

Summary of findings for the main comparison. Summary of findings: ACT versus CQ

Artemisinin‐based combination therapy compared with chloroquine for uncomplicated P. vivax malaria

Patient or population: Adults and children with uncomplicated P. vivax malaria

Settings: Endemic areas where chloroquine is still an effective treatment for the first 28 days

Intervention: Artemisinin‐based combination therapy

Comparison: Chloroquine

Outcomes

Illustrative comparative risks* (95% CI)

Relative effect
(95% CI)

No of participants
(studies)

Quality of the evidence
(GRADE)

Assumed risk

Corresponding risk

Chloroquine

ACT

Remaining parasitaemic at 24 hours

52 per 100

22 per 100
(19 to 26)

RR 0.42
(0.36 to 0.50)

1652
(4 studies1)

high2,3,4,5

Remaining febrile after 24 hours

29 per 100

16 per 100
(12 to 20)

RR 0.55
(0.43 to 0.7)

990
(2 studies6)

moderate2,4,5,7

Effective treatment of the blood stage parasite

As assessed by: Recurrent parasitaemia before day 28

3 per 100

2 per 100
(1 to 6)

RR 0.58
(0.18 to 1.90)

1622
(5 studies8)

high2,3,4,9

Post‐treatment prophylaxis

As assessed by: Recurrent parasitaemia between day 28 and day 42/56/63

With primaquine

RR 0.27
(0.08 to 0.94)

376

(1 study10)

low11,12

6 per 100

2 per 100
(0 to 6)

Without primaquine

RR 0.57
(0.40 to 0.82)

1066
(3 studies13)

moderate3,5,14

40 per 100

23 per 100
(16 to 33)

Serious adverse events

0 per 100

0 per 100
(0 to 2)

RR 1
(0.14 to 7.04)

1775
(5 studies8)

high2,3,4,9

*The basis for the assumed risk (for example, the median control group risk across studies) is provided in footnotes. The corresponding risk (and its 95% CI) is based on the assumed risk in the comparison group and the relative effect of the intervention (and its 95% CI).

CI: Confidence interval; RR: Risk ratio; ACT: artemisinin‐based combination therapy.

GRADE Working Group grades of evidence
High quality: Further research is very unlikely to change our confidence in the estimate of effect.
Moderate quality: Further research is likely to have an important impact on our confidence in the estimate of effect and may change the estimate.
Low quality: Further research is very likely to have an important impact on our confidence in the estimate of effect and is likely to change the estimate.
Very low quality: We are very uncertain about the estimate.

1Awab 2010 AFG (Afghanistan), Kolaczinski 2007 AFG (Afghanistan), Poravuth 2010 ASIA (multi‐site), and Phyo 2011 THA (Thailand).
2 No serious study limitations: Awab 2010 AFG , Poravuth 2010 ASIA and Phyo 2011 THA adequately concealed allocation, Kolaczinski 2007 AFG did not, and Krudsood 2007 THA did not adequately describe allocation concealment.
3 No serious inconsistency: The findings of all the trials are consistent.
4 No serious indirectness: The findings of these three studies can reasonably be applied to other settings with similar transmission and resistance patterns.
5 No serious imprecision: The finding is of a clinically and statistically significant benefit with ACTs.
6Awab 2010 AFG (Afghanistan) and Poravuth 2010 ASIA (multi‐site).
7 Downgraded by 1 for serious inconsistency: The two additional trials (Kolaczinski 2007 AFG; Krudsood 2007 THA) report that fever clearance was not significantly different between the groups.
8Awab 2010 AFG (Afghanistan), Kolaczinski 2007 AFG (Afghanistan), Krudsood 2007 THA (Thailand), Poravuth 2010 ASIA (multi‐site), and Phyo 2011 THA (Thailand).
9 No serious imprecision: The finding is of no clinically important difference between ACTs and CQ. Although the 95% CI around the relative effect is very wide, recurrent parasitaemia before day 28 and serious adverse events were very rare and consequently the 95% CI around the absolute effect is very narrow.
10Poravuth 2010 ASIA.
11 Downgraded by 1 for serious indirectness: Poravuth 2010 ASIA delayed primaquine until day 28 and so the course will not have completed until day 42 the last day of the trial. The effect seen may not be present if primaquine is given in the usual way (on completion of 3 days of ACT). The period of follow‐up is also not long enough to fully assess this effect, the inevitable relapse may simply be delayed, rather than a reduction in clinical episodes.
12 Downgraded by 1 for serious imprecision: Although statistically significant the 95% CI is wide and includes the possibility of no appreciable benefit.
13Awab 2010 AFG continued until day 56, Kolaczinski 2007 AFG to day 42 and Phyo 2011 THA to day 63 (Primaquine was administered to the participants after day 63).
14 Downgraded by 1 for serious indirectness: Both studies are from Afghanistan Awab 2010 AFG and Kolaczinski 2007 AFG where primaquine is not recommended due to a high prevalence of G6PD. The period of follow‐up is also not long enough to fully assess this effect, the inevitable relapse may simply be delayed, rather than a reduction in clinical episodes.

Figuras y tablas -
Summary of findings for the main comparison. Summary of findings: ACT versus CQ
Summary of findings 2. Summary of findings: DHA‐P versus alternative ACTs in high transmission settings with known CQ resistance

Dihydroartemisinin‐piperaquine compared with alternative artemisinin‐based combination treatments for uncomplicated P. vivax malaria

Patient or population: Adults and children with uncomplicated P. vivax malaria

Settings: Settings with high transmission of P. vivax (chloroquine resistance is also reported as high)

Intervention: Dihydroartemisinin‐piperaquine

Comparison: Alternative ACTs

Outcomes

Illustrative comparative risks* (95% CI)

Relative effect
(95% CI)

No of participants
(studies)

Quality of the evidence
(GRADE)

Assumed risk

Corresponding risk

Alternative ACT

DHA‐P

Effective treatment of the blood stage parasite

As assessed by: Recurrent parasitaemia before day 28

35 per 100

7 per 100
(3 to 17)

RR 0.20
(0.08 to 0.49)

334
(3 studies1,2)

moderate3,4,5,6

Post‐treatment prophylaxis

As assessed by: Recurrent parasitaemia between day 28 and 42

With primaquine

RR 0.21
(0.1 to 0.46)

179
(2 studies2)

low6,7,8,9

34 per 100

7 per 100
(3 to 16)

Without primaquine

RR 0.40
(0.14 to 1.10)

66
(1 study1)

very low10,11,12

33 per 100

13 per 100
(5 to 37)

*The basis for the assumed risk (for example, the median control group risk across studies) is provided in footnotes. The corresponding risk (and its 95% CI) is based on the assumed risk in the comparison group and the relative effect of the intervention (and its 95% CI).

CI: Confidence interval; RR: Risk ratio; DHA‐P: dihydroartemisinin‐piperaquine; ACT: Artemisinin‐based combination therapy.

GRADE Working Group grades of evidence
High quality: Further research is very unlikely to change our confidence in the estimate of effect.
Moderate quality: Further research is likely to have an important impact on our confidence in the estimate of effect and may change the estimate.
Low quality: Further research is very likely to have an important impact on our confidence in the estimate of effect and is likely to change the estimate.
Very low quality: We are very uncertain about the estimate.

1Karunajeewa 2008 PNG (Papua New Guinea).
2Hasugian 2007 IDN and Ratcliff 2007 IDN (Indonesia).
3 No serious risk of bias: Allocation was adequately concealed in these studies to be considered at low risk of bias.
4 Downgraded by 1 for serious inconsistency: There was some clinical heterogeneity between trials. DHA‐P did not perform as well in Papua New Guinea as it has elsewhere, however it was still superior to AL6 and AS+SP.
5 No serious indirectness: Studies include adults and children and were conducted in areas where transmission is high and chloroquine resistance is well documented.
6 No serious imprecision: Both limits of the 95% CI suggest an appreciable clinical benefit with DHA‐P.
7 Downgraded by 1 for serious risk of bias: Losses to follow‐up were high (> 20% at this time‐point).
8 No serious inconsistency: Statistical heterogeneity was low.
9 Downgraded by 1 for serious indirectness: Ratcliff 2007 IDN delayed the administration of Primaquine until day 28 and so the course will not have been completed until the last day of the trial. Hasugian 2007 IDN offered unsupervised primaquine to all participants on completion of their ACT, this reflects normal practice but it is not clear how many participants completed their course. The period of follow‐up is also not long enough to fully assess this effect, the inevitable relapse may simply be delayed, rather than a reduction in clinical episodes.
10 Downgraded by 1 for serious risk of bias: Losses to follow‐up were high (>20% at this time‐point).
11 Downgraded by 1 for serious indirectness: Only one study has assessed this outcome. Recurrent parasitaemia was higher with all three ACTs than seen elsewhere. This trial is therefore not easily extrapolated to other sites.
12 Downgraded by 1 for serious imprecision: The 95% CI of the effect estimate is wide and includes an important clinical benefit and no difference between the treatments.

Figuras y tablas -
Summary of findings 2. Summary of findings: DHA‐P versus alternative ACTs in high transmission settings with known CQ resistance
Table 1. Detailed search strategy

Search set

 Search terms used for all databases1

1

vivax

2

Arte*

3

Dihydroarte*

4

2 or 3

5

1 and 4

6

(search terms for RCTs)

7

5 and 6

8

Limit 7  to Human

1 Cochrane Infectious Disease Group Specialized Register; Cochrane Central Register of Controlled Trials (CENTRAL), published in The Cochrane Library; MEDLINE; EMBASE; and LILACS.

Figuras y tablas -
Table 1. Detailed search strategy
Table 2. Median parasite clearance times

Study ID

Comparison

Median parasite clearance time (range)

P value

ACT

CQ

Krudsood 2007 THA

AL6 versus CQ

41.6 hrs

55.8 hrs

< 0.01

Poravuth 2010 ASIA

AS‐Py versus CQ

23.0 hrs (7.0 to 55.9)

32.0 hrs (7.5 to 63.9)

< 0.0001

Figuras y tablas -
Table 2. Median parasite clearance times
Table 3. Fever clearance times

Study ID

Comparison

Median fever clearance time (range)

P value

ACT

CQ

Krudsood 2007 THA

AL6 versus CQ

21.8 hrs

25.3 hrs

0.12

Poravuth 2010 ASIA

AS‐Py versus CQ

15.9 hrs

23.8 hrs

0.0017

Figuras y tablas -
Table 3. Fever clearance times
Comparison 1. ACT versus Chloroquine

Outcome or subgroup title

No. of studies

No. of participants

Statistical method

Effect size

1 Parasite clearance Show forest plot

4

Risk Ratio (M‐H, Random, 95% CI)

Subtotals only

1.1 Remaining parasitaemic after 24 hours

4

1652

Risk Ratio (M‐H, Random, 95% CI)

0.42 [0.36, 0.50]

1.2 Remaining parasitaemic after 48 hours

4

1648

Risk Ratio (M‐H, Random, 95% CI)

0.18 [0.05, 0.74]

1.3 Remaining parasitaemic after 72 hours

4

1648

Risk Ratio (M‐H, Random, 95% CI)

0.08 [0.01, 0.43]

2 Fever clearance Show forest plot

3

Risk Ratio (M‐H, Random, 95% CI)

Subtotals only

2.1 Remaining febrile after 24 hours

2

990

Risk Ratio (M‐H, Random, 95% CI)

0.55 [0.43, 0.70]

2.2 Remaining febrile after 48 hours

3

1390

Risk Ratio (M‐H, Random, 95% CI)

0.53 [0.31, 0.91]

2.3 Remaining febrile after 72 hours

2

985

Risk Ratio (M‐H, Random, 95% CI)

0.60 [0.27, 1.36]

3 Recurrence of parasitaemia Show forest plot

5

Risk Ratio (M‐H, Random, 95% CI)

Subtotals only

3.1 Before day 14

1

427

Risk Ratio (M‐H, Random, 95% CI)

2.88 [0.12, 70.22]

3.2 Before day 28

5

1622

Risk Ratio (M‐H, Random, 95% CI)

0.58 [0.18, 1.90]

3.3 After day 28 (primaquine not given)

3

1066

Risk Ratio (M‐H, Random, 95% CI)

0.57 [0.40, 0.82]

3.4 After day 28 (primaquine given)

1

376

Risk Ratio (M‐H, Random, 95% CI)

0.27 [0.08, 0.94]

3.5 During full follow‐up period (42 or 56 days)

4

1460

Risk Ratio (M‐H, Random, 95% CI)

0.59 [0.44, 0.78]

4 Gametocytemia Show forest plot

2

Risk Ratio (M‐H, Fixed, 95% CI)

Totals not selected

4.1 On Day 0

2

Risk Ratio (M‐H, Fixed, 95% CI)

0.0 [0.0, 0.0]

4.2 On Day 1

1

Risk Ratio (M‐H, Fixed, 95% CI)

0.0 [0.0, 0.0]

4.3 On Day 2

2

Risk Ratio (M‐H, Fixed, 95% CI)

0.0 [0.0, 0.0]

4.4 On Day 3

1

Risk Ratio (M‐H, Fixed, 95% CI)

0.0 [0.0, 0.0]

5 Serious adverse events Show forest plot

5

1775

Risk Ratio (M‐H, Random, 95% CI)

1.0 [0.14, 7.04]

Figuras y tablas -
Comparison 1. ACT versus Chloroquine
Comparison 2. ACT versus Chloroquine plus Sulfadoxine‐pyrimethamine

Outcome or subgroup title

No. of studies

No. of participants

Statistical method

Effect size

1 Parasite clearance Show forest plot

1

Risk Ratio (M‐H, Random, 95% CI)

Subtotals only

1.1 Remaining parasitaemic after 24 hours

1

195

Risk Ratio (M‐H, Random, 95% CI)

0.22 [0.15, 0.34]

1.2 Remaining parasitaemic after 48 hours

1

195

Risk Ratio (M‐H, Random, 95% CI)

0.09 [0.03, 0.27]

1.3 Remaining parasitaemic after 72 hours

1

195

Risk Ratio (M‐H, Random, 95% CI)

0.17 [0.03, 0.81]

2 Fever clearance Show forest plot

1

Risk Ratio (M‐H, Random, 95% CI)

Subtotals only

2.1 Remaining febrile after 24 hours

1

195

Risk Ratio (M‐H, Random, 95% CI)

1.05 [0.75, 1.48]

2.2 Remaining febrile after 48 hours

1

195

Risk Ratio (M‐H, Random, 95% CI)

0.62 [0.31, 1.23]

2.3 Remaining febrile after 72 hours

1

195

Risk Ratio (M‐H, Random, 95% CI)

0.77 [0.29, 2.02]

3 Recurrence of parasitaemia Show forest plot

1

Risk Ratio (M‐H, Random, 95% CI)

Totals not selected

3.1 Before day 14

1

Risk Ratio (M‐H, Random, 95% CI)

0.0 [0.0, 0.0]

3.2 Before day 28

1

Risk Ratio (M‐H, Random, 95% CI)

0.0 [0.0, 0.0]

3.3 After day 28

1

Risk Ratio (M‐H, Random, 95% CI)

0.0 [0.0, 0.0]

3.4 During full follow‐up period (42 days)

1

Risk Ratio (M‐H, Random, 95% CI)

0.0 [0.0, 0.0]

4 Serious adverse events Show forest plot

1

209

Risk Ratio (M‐H, Fixed, 95% CI)

0.0 [0.0, 0.0]

Figuras y tablas -
Comparison 2. ACT versus Chloroquine plus Sulfadoxine‐pyrimethamine
Comparison 3. ACT versus Quinine

Outcome or subgroup title

No. of studies

No. of participants

Statistical method

Effect size

1 Parasite clearance Show forest plot

1

72

Risk Ratio (M‐H, Fixed, 95% CI)

2.0 [0.19, 21.09]

1.1 Remaining parasitaemia after 72 hours

1

72

Risk Ratio (M‐H, Fixed, 95% CI)

2.0 [0.19, 21.09]

2 Recurrence of parasitaemia Show forest plot

1

Risk Ratio (M‐H, Random, 95% CI)

Totals not selected

2.1 Before day 14

1

Risk Ratio (M‐H, Random, 95% CI)

0.0 [0.0, 0.0]

2.2 Before day 28

1

Risk Ratio (M‐H, Random, 95% CI)

0.0 [0.0, 0.0]

2.3 After day 28

1

Risk Ratio (M‐H, Random, 95% CI)

0.0 [0.0, 0.0]

2.4 During full follow‐up period (42 days)

1

Risk Ratio (M‐H, Random, 95% CI)

0.0 [0.0, 0.0]

Figuras y tablas -
Comparison 3. ACT versus Quinine
Comparison 4. ACT versus ACT

Outcome or subgroup title

No. of studies

No. of participants

Statistical method

Effect size

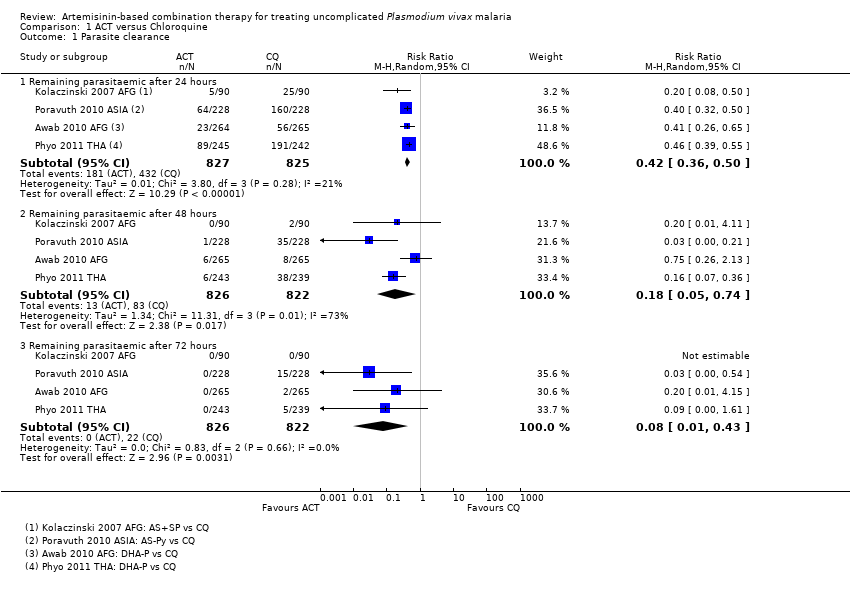
1 Remaining parasitemic after 24 hours Show forest plot

5

Risk Ratio (M‐H, Random, 95% CI)

Subtotals only

1.1 DHA‐P versus AS+MQ

3

120

Risk Ratio (M‐H, Random, 95% CI)

1.18 [0.28, 4.92]

1.2 DHA‐P versus AL6

1

83

Risk Ratio (M‐H, Random, 95% CI)

0.78 [0.31, 1.94]

1.3 AS+MQ versus AL6

1

24

Risk Ratio (M‐H, Random, 95% CI)

1.02 [0.60, 1.72]

1.4 DHA‐P versus AS+SP

1

95

Risk Ratio (M‐H, Random, 95% CI)

1.35 [0.49, 3.72]

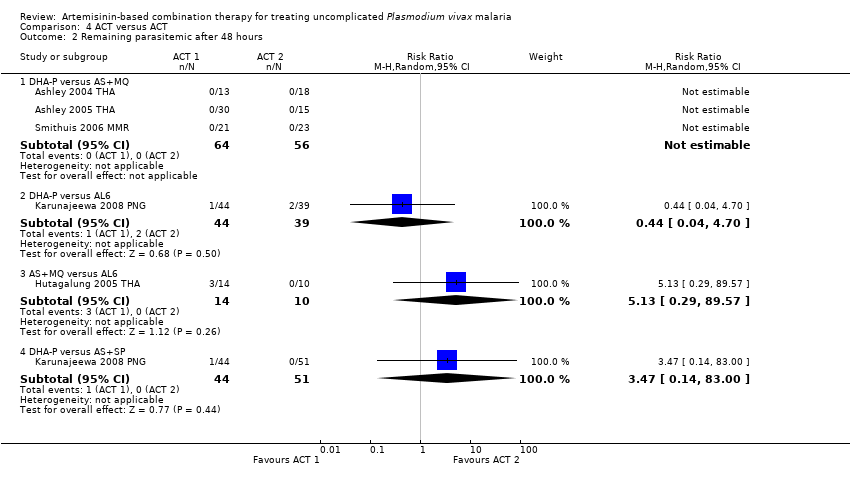
2 Remaining parasitemic after 48 hours Show forest plot

5

Risk Ratio (M‐H, Random, 95% CI)

Subtotals only

2.1 DHA‐P versus AS+MQ

3

120

Risk Ratio (M‐H, Random, 95% CI)

0.0 [0.0, 0.0]

2.2 DHA‐P versus AL6

1

83

Risk Ratio (M‐H, Random, 95% CI)

0.44 [0.04, 4.70]

2.3 AS+MQ versus AL6

1

24

Risk Ratio (M‐H, Random, 95% CI)

5.13 [0.29, 89.57]

2.4 DHA‐P versus AS+SP

1

95

Risk Ratio (M‐H, Random, 95% CI)

3.47 [0.14, 83.00]

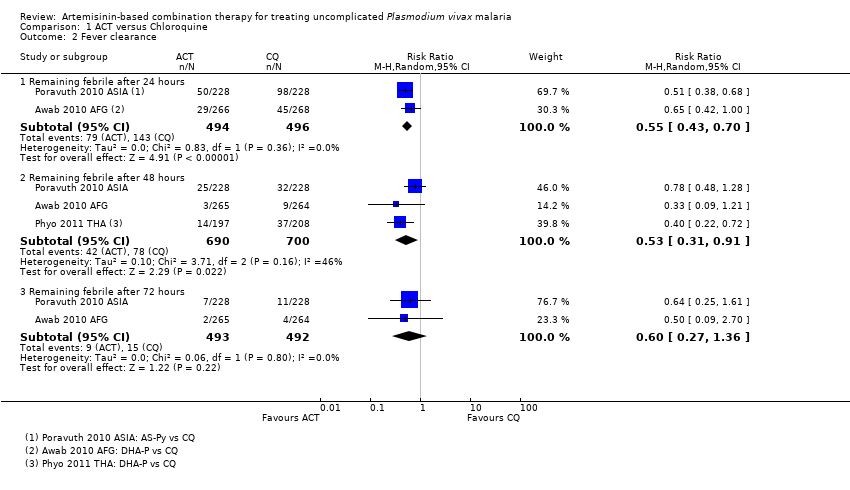
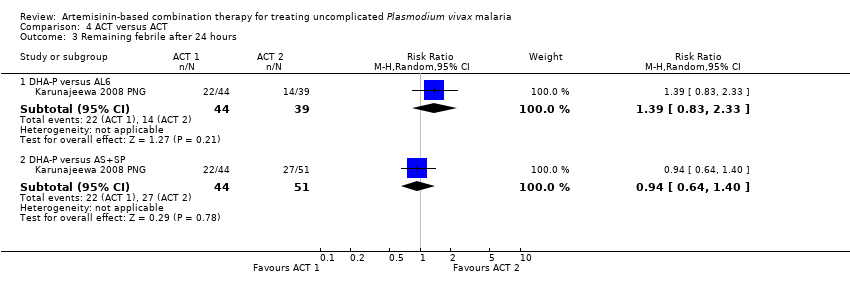
3 Remaining febrile after 24 hours Show forest plot

1

Risk Ratio (M‐H, Random, 95% CI)

Subtotals only

3.1 DHA‐P versus AL6

1

83

Risk Ratio (M‐H, Random, 95% CI)

1.39 [0.83, 2.33]

3.2 DHA‐P versus AS+SP

1

95

Risk Ratio (M‐H, Random, 95% CI)

0.94 [0.64, 1.40]

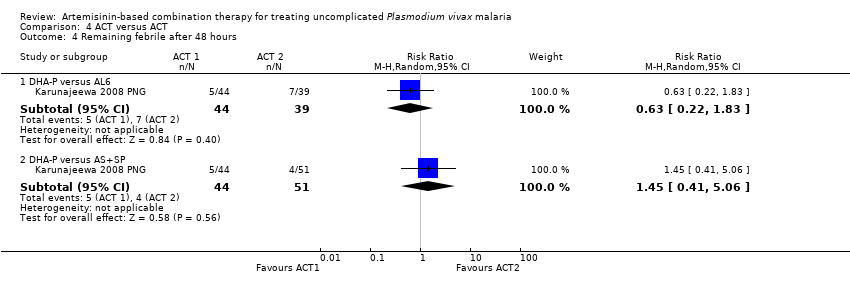
4 Remaining febrile after 48 hours Show forest plot

1

Risk Ratio (M‐H, Random, 95% CI)

Subtotals only

4.1 DHA‐P versus AL6

1

83

Risk Ratio (M‐H, Random, 95% CI)

0.63 [0.22, 1.83]

4.2 DHA‐P versus AS+SP

1

95

Risk Ratio (M‐H, Random, 95% CI)

1.45 [0.41, 5.06]

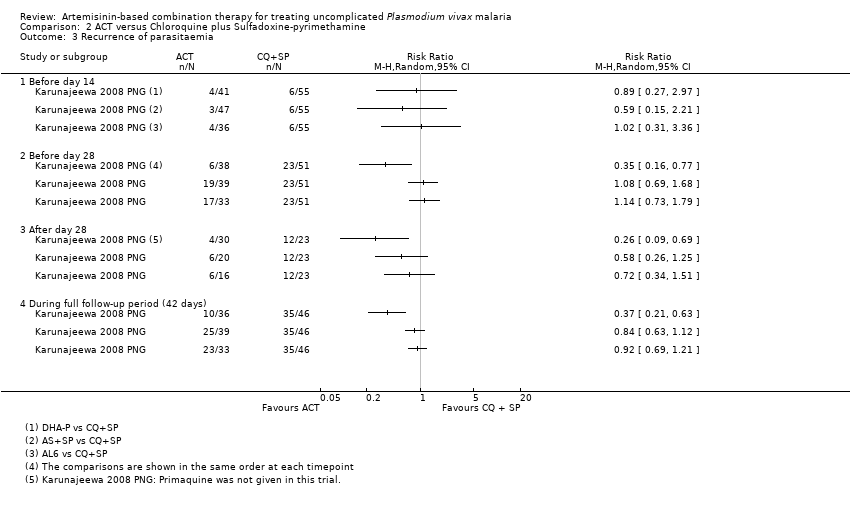
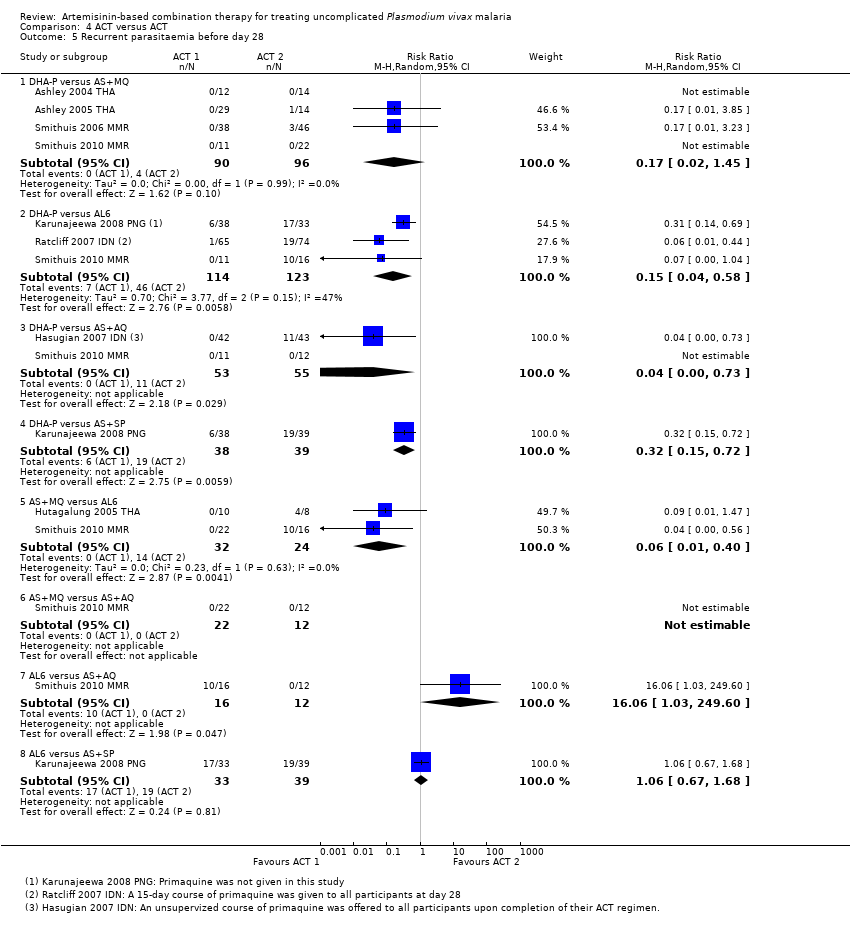
5 Recurrent parasitaemia before day 28 Show forest plot

8

Risk Ratio (M‐H, Random, 95% CI)

Subtotals only

5.1 DHA‐P versus AS+MQ

4

186

Risk Ratio (M‐H, Random, 95% CI)

0.17 [0.02, 1.45]

5.2 DHA‐P versus AL6

3

237

Risk Ratio (M‐H, Random, 95% CI)

0.15 [0.04, 0.58]

5.3 DHA‐P versus AS+AQ

2

108

Risk Ratio (M‐H, Random, 95% CI)

0.04 [0.00, 0.73]

5.4 DHA‐P versus AS+SP

1

77

Risk Ratio (M‐H, Random, 95% CI)

0.32 [0.15, 0.72]

5.5 AS+MQ versus AL6

2

56

Risk Ratio (M‐H, Random, 95% CI)

0.06 [0.01, 0.40]

5.6 AS+MQ versus AS+AQ

1

34

Risk Ratio (M‐H, Random, 95% CI)

0.0 [0.0, 0.0]

5.7 AL6 versus AS+AQ

1

28

Risk Ratio (M‐H, Random, 95% CI)

16.06 [1.03, 249.60]

5.8 AL6 versus AS+SP

1

72

Risk Ratio (M‐H, Random, 95% CI)

1.06 [0.67, 1.68]

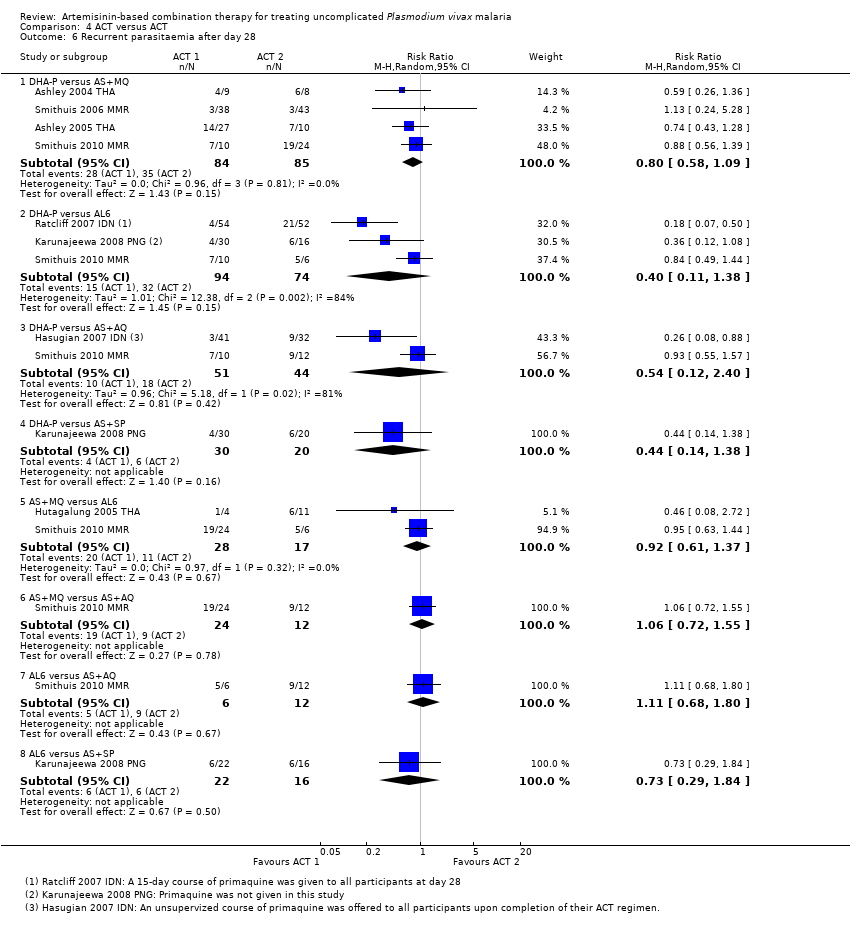
6 Recurrent parasitaemia after day 28 Show forest plot

8

Risk Ratio (M‐H, Random, 95% CI)

Subtotals only

6.1 DHA‐P versus AS+MQ

4

169

Risk Ratio (M‐H, Random, 95% CI)

0.80 [0.58, 1.09]

6.2 DHA‐P versus AL6

3

168

Risk Ratio (M‐H, Random, 95% CI)

0.40 [0.11, 1.38]

6.3 DHA‐P versus AS+AQ

2

95

Risk Ratio (M‐H, Random, 95% CI)

0.54 [0.12, 2.40]

6.4 DHA‐P versus AS+SP

1

50

Risk Ratio (M‐H, Random, 95% CI)

0.44 [0.14, 1.38]

6.5 AS+MQ versus AL6

2

45

Risk Ratio (M‐H, Random, 95% CI)

0.92 [0.61, 1.37]

6.6 AS+MQ versus AS+AQ

1

36

Risk Ratio (M‐H, Random, 95% CI)

1.06 [0.72, 1.55]

6.7 AL6 versus AS+AQ

1

18

Risk Ratio (M‐H, Random, 95% CI)

1.11 [0.68, 1.80]

6.8 AL6 versus AS+SP

1

38

Risk Ratio (M‐H, Random, 95% CI)

0.73 [0.29, 1.84]

7 Recurrent parasitaemia during full follow‐up period (0 to 42 or 63 days) Show forest plot

8

Risk Ratio (M‐H, Random, 95% CI)

Subtotals only

7.1 DHA‐P versus AS+MQ

4

186

Risk Ratio (M‐H, Random, 95% CI)

0.17 [0.02, 1.45]

7.2 DHA‐P versus AL6

3

237

Risk Ratio (M‐H, Random, 95% CI)

0.15 [0.04, 0.58]

7.3 DHA‐P versus AS+AQ

2

108

Risk Ratio (M‐H, Random, 95% CI)

0.04 [0.00, 0.73]

7.4 DHA‐P versus AS+SP

1

77

Risk Ratio (M‐H, Random, 95% CI)

0.32 [0.15, 0.72]

7.5 AS+MQ versus AL6

2

56

Risk Ratio (M‐H, Random, 95% CI)

0.06 [0.01, 0.40]

7.6 AS+MQ versus AS+AQ

1

34

Risk Ratio (M‐H, Random, 95% CI)

0.0 [0.0, 0.0]

7.7 AL6 versus AS+AQ

1

28

Risk Ratio (M‐H, Random, 95% CI)

16.06 [1.03, 249.60]

7.8 AL6 versus AS+SP

1

72

Risk Ratio (M‐H, Random, 95% CI)

1.06 [0.67, 1.68]

Figuras y tablas -
Comparison 4. ACT versus ACT
Comparison 5. DHA‐P versus alternative ACTs

Outcome or subgroup title

No. of studies

No. of participants

Statistical method

Effect size

1 Recurrent parasitaemia ‐ settings described as low transmission Show forest plot

4

Risk Ratio (M‐H, Random, 95% CI)

Subtotals only

1.1 Before day 28

4

239

Risk Ratio (M‐H, Random, 95% CI)

0.12 [0.02, 0.63]

1.2 After day 28 ‐ without primaquine

4

187

Risk Ratio (M‐H, Random, 95% CI)

0.80 [0.59, 1.09]

1.3 During full follow‐up period (42 to 63 days) ‐ without primaquine

4

201

Risk Ratio (M‐H, Random, 95% CI)

0.76 [0.56, 1.02]

2 Recurrent parasitaemia ‐ settings described as high transmission Show forest plot

3

Risk Ratio (M‐H, Random, 95% CI)

Subtotals only

2.1 Before day 28

3

334

Risk Ratio (M‐H, Random, 95% CI)

0.20 [0.08, 0.49]

2.2 After day 28 ‐ with primaquine

2

179

Risk Ratio (M‐H, Random, 95% CI)

0.21 [0.10, 0.46]

2.3 After day 28 ‐ without primaquine

1

66

Risk Ratio (M‐H, Random, 95% CI)

0.40 [0.14, 1.10]

2.4 During full follow‐up period (42 days) ‐ with primaquine

2

210

Risk Ratio (M‐H, Random, 95% CI)

0.16 [0.08, 0.32]

2.5 During full follow‐up period (42 days) ‐ without primaquine

1

108

Risk Ratio (M‐H, Random, 95% CI)

0.42 [0.24, 0.72]

Figuras y tablas -
Comparison 5. DHA‐P versus alternative ACTs