Progesterona para el tratamiento del traumatismo craneoencefálico agudo
Información
- DOI:
- https://doi.org/10.1002/14651858.CD008409.pub4Copiar DOI

- Base de datos:
-
- Cochrane Database of Systematic Reviews
- Versión publicada:
-
- 22 diciembre 2016see what's new
- Tipo:
-
- Intervention
- Etapa:
-
- Review
- Grupo Editorial Cochrane:
-
Grupo Cochrane de Lesiones
- Copyright:
-
- Copyright © 2017 The Cochrane Collaboration. Published by John Wiley & Sons, Ltd.
Cifras del artículo
Altmetric:
Citado por:
Autores
Contributions of authors
JM and YZ undertook partial electronic database searches, screened the citations for eligibility, assessed the quality of papers, extracted data, entered data into RevMan and updated the review.
SH and CY conceived and designed the review, moderated disagreements during data collection, analysed and interpreted data, and helped to write the review.
Sources of support
Internal sources
-
The Sichuan University, China.
External sources
-
National Institute for Health Research (NIHR), UK.
This project was supported by the UK National Institute for Health Research, through Cochrane Infrastructure funding to the Cochrane Injuries Group. The views and opinions expressed are those of the authors and do not necessarily reflect those of the Systematic Reviews Programme, NIHR, NHS or the Department of Health.
Declarations of interest
Junpeng Ma: none known
Siqing Huang: none known
Shu Qin: none known
Chao You: none known
Yunhui Zeng: none known
Acknowledgements
We thank the Cochrane Injuries Group editorial base staff for their support during the production of this review, and to the Information Specialist for developing and running the literature searches.
Version history
| Published | Title | Stage | Authors | Version |
| 2016 Dec 22 | Progesterone for acute traumatic brain injury | Review | Junpeng Ma, Siqing Huang, Shu Qin, Chao You, Yunhui Zeng | |
| 2012 Oct 17 | Progesterone for acute traumatic brain injury | Review | Junpeng Ma, Siqing Huang, Shu Qin, Chao You | |
| 2011 Jan 19 | Progesterone for acute traumatic brain injury | Review | Ma Junpeng, Siqing Huang, Shu Qin | |
| 2010 Mar 17 | Progesterone for acute traumatic brain injury | Protocol | Ma Junpeng, Siqing Huang, Shu Qin | |
Differences between protocol and review
Yunhui Zeng and Chao You have been added as authors.
We have changed the inclusion criteria according to Cochrane Injuries Group policy (Roberts 2015). In order for a study to be eligible for inclusion, if the report of a study was published after 2010 then the study must have been prospectively registered.
We added a 'Summary of findings' table to the review, and described how we did this in the Methods.
For the outcome of disability at the end of follow‐up, measured using the Glasgow Outome Score (GOS), we split GOS data into favourable (moderate disability, good recovery; GOS 4 and 5) and unfavourable (death, vegetative state, severe disability; GOS 1 to 3) outcomes, as these groupings reflect two different disability levels.
Notes
The results of the ongoing trials IRCT2014042017356N1, CTRI/2009/091/000893 and CTRI/2013/02/003396 were not considered to influence the results of the review because of their limited enrolments. We will update the review when other phase III trials are completed.
Keywords
MeSH
Medical Subject Headings (MeSH) Keywords
- Brain Injuries [*drug therapy, *mortality];
- Disability Evaluation;
- Glasgow Coma Scale;
- Injury Severity Score;
- Intracranial Pressure [drug effects];
- Neuroprotective Agents [adverse effects, *therapeutic use];
- Progesterone [adverse effects, *therapeutic use];
- Randomized Controlled Trials as Topic;
- Risk;
Medical Subject Headings Check Words
Humans;
PICO
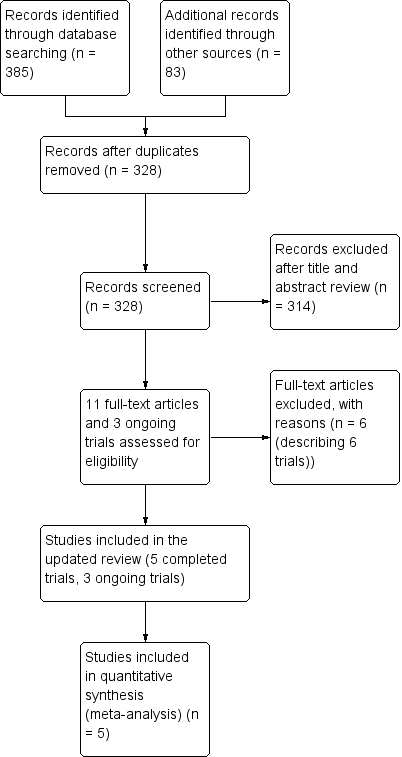
Study flow diagram.

Risk of bias graph: review authors' judgements about each risk of bias item presented as percentages across all included studies. Five studies are included in this review.
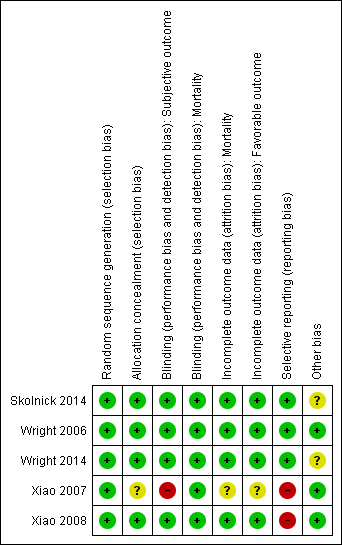
Risk of bias summary: review authors' judgements about each risk of bias item for each included study.
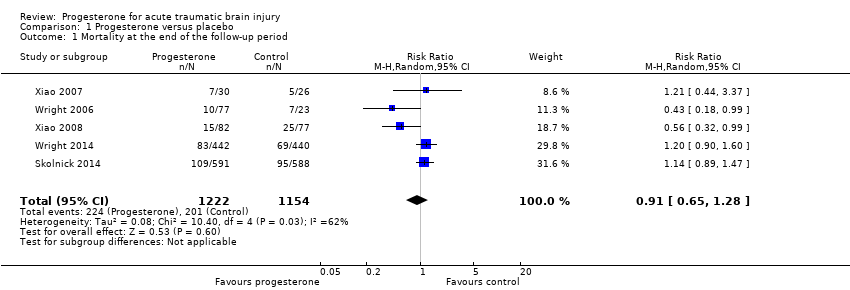
Comparison 1 Progesterone versus placebo, Outcome 1 Mortality at the end of the follow‐up period.

Comparison 1 Progesterone versus placebo, Outcome 2 Death or severe disability (GOS1 to 3) at the end of the follow‐up period.

Comparison 2 Subgroup analysis: severe TBI subgroup (GCS ≤ 8), Outcome 1 Mortality at the end of the follow‐up period.
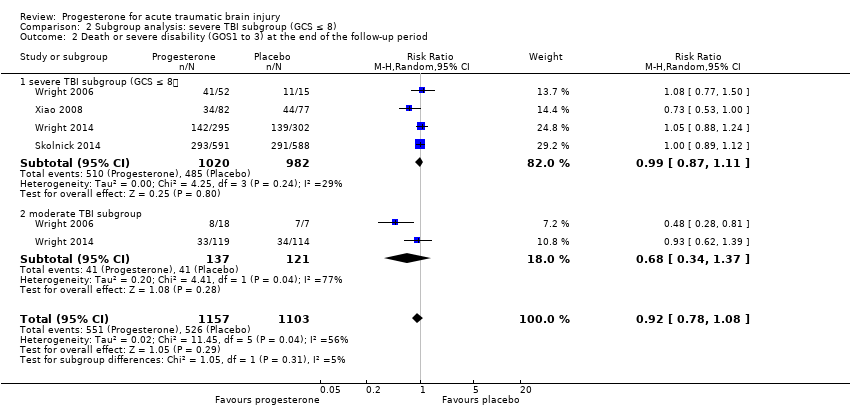
Comparison 2 Subgroup analysis: severe TBI subgroup (GCS ≤ 8), Outcome 2 Death or severe disability (GOS1 to 3) at the end of the follow‐up period.

Comparison 3 Adequate allocation concealment (sensitivity analysis), Outcome 1 Mortality at the end of the follow‐up period.

Comparison 3 Adequate allocation concealment (sensitivity analysis), Outcome 2 Death or severe disability (GOS 1 to 3) at the end of the follow‐up period.
| Progesterone compared with no progesterone or placebo for traumatic brain injury | ||||||
| Patient or population: people with acute TBI secondary to head injury Settings: hospitals, intensive care units Intervention: progesterone therapy Comparison: no progesterone or placebo | ||||||
| Outcomes | Illustrative comparative risks* (95% CI) | Relative effect | No of participants | Quality of the evidence | Comments | |
| Assumed risk | Corresponding risk | |||||
| Control | Progesterone | |||||
| Mortality at end of scheduled follow‐up | 192 per 1000 | 175 per 1000 (125 to 246) | RR 0.91 (0.65 to 1.28) | 2376 | ⊕⊕⊝⊝ | There is no evidence of a reduction of mortality at the end of scheduled follow‐up as a result of progesterone therapy. Our confidence in this evidence is limited as we have assessed it as low quality. |
| Disability (unfavourable outcomes: death, vegetative state, severe disability; GOS 1‐3) at end of scheduled follow‐up | 533 per 1000 | 522 per 1000 (474 to 565) | RR 0.98 (0.89 to 1.06) | 2260 (4 studies) | ⊕⊕⊕⊝ | There is no evidence of a difference in disability (unfavourable outcomes) at the end of scheduled follow‐up as a result of progesterone therapy. Our confidence in this evidence is somewhat limited as we have assessed it as moderate quality. |
| Intracranial pressure (ICP) within the treatment period | ‐ | ‐ | ‐ | 3 studies | ‐ | In Xiao 2008, ICP data were presented as mean values. In Wright 2006, ICP data were presented as the mean frequency of pressures exceeding threshold values. In Skolnick 2014, ICP data were presented as the population with increased ICP. We were therefore not able to perform meta‐analysis. There was no evidence that progesterone therapy has an effect on ICP. |
| Blood pressure | ‐ | ‐ | ‐ | 1 study | ‐ | "Throughout the three‐day infusion interval, there was no difference between the progesterone and placebo groups" (Wright 2006) |
| Body temperature | ‐ | ‐ | ‐ | 1 study | ‐ | "Progesterone group experienced a lower increase in mean temperature than the control group" (Wright 2006) |
| Adverse events | ‐ | ‐ | ‐ | 4 studies | ‐ | Wright 2014 reported that phlebitis or thrombophlebitis was significantly more frequent in the progesterone group than in the placebo group (882 cases, RR 3.03; 95% CI, 1.96 to 4.66). The rates of other serious and non‐serious adverse events were similar in the 4 studies. |
| *The basis for the assumed risk (e.g. the median control group risk across studies) is provided in footnotes. The corresponding risk (and its 95% confidence interval) is based on the assumed risk in the comparison group and the relative effect of the intervention (and its 95% CI). | ||||||
| GRADE Working Group grades of evidence | ||||||
| 1. We judged the overall risk of bias of two studies as high, and two studies as unclear. However, most data were from studies at low or unclear risk of bias, so we did not downgrade for risk of bias. 2. Downgraded once for inconsistency (substantial heterogeneity: I² = 62%, P value 0.03) 3. Downgraded once for inconsistency (the dosage, treatment routine and vehicles of progesterone varied across studies. Different time points were involved in the analysis of mortality and unfavourable outcomes). | ||||||
| Outcome or subgroup title | No. of studies | No. of participants | Statistical method | Effect size |
| 1 Mortality at the end of the follow‐up period Show forest plot | 5 | 2376 | Risk Ratio (M‐H, Random, 95% CI) | 0.91 [0.65, 1.28] |
| 2 Death or severe disability (GOS1 to 3) at the end of the follow‐up period Show forest plot | 4 | 2260 | Risk Ratio (M‐H, Fixed, 95% CI) | 0.98 [0.89, 1.06] |
| Outcome or subgroup title | No. of studies | No. of participants | Statistical method | Effect size |
| 1 Mortality at the end of the follow‐up period Show forest plot | 5 | 2369 | Risk Ratio (M‐H, Random, 95% CI) | 0.95 [0.70, 1.29] |
| 1.1 severe TBI subgroup (GCS ≤ 8) | 5 | 2090 | Risk Ratio (M‐H, Random, 95% CI) | 0.87 [0.60, 1.27] |
| 1.2 moderate TBI subgroup (GCS 9 to 12) | 2 | 279 | Risk Ratio (M‐H, Random, 95% CI) | 1.30 [0.70, 2.41] |
| 2 Death or severe disability (GOS1 to 3) at the end of the follow‐up period Show forest plot | 4 | 2260 | Risk Ratio (M‐H, Random, 95% CI) | 0.92 [0.78, 1.08] |
| 2.1 severe TBI subgroup (GCS ≤ 8) | 4 | 2002 | Risk Ratio (M‐H, Random, 95% CI) | 0.99 [0.87, 1.11] |
| 2.2 moderate TBI subgroup | 2 | 258 | Risk Ratio (M‐H, Random, 95% CI) | 0.68 [0.34, 1.37] |
| Outcome or subgroup title | No. of studies | No. of participants | Statistical method | Effect size |
| 1 Mortality at the end of the follow‐up period Show forest plot | 4 | 2320 | Risk Ratio (M‐H, Random, 95% CI) | 0.88 [0.60, 1.28] |
| 2 Death or severe disability (GOS 1 to 3) at the end of the follow‐up period Show forest plot | 4 | 2260 | Risk Ratio (M‐H, Fixed, 95% CI) | 0.98 [0.89, 1.06] |