鎌状赤血球病患者における下腿潰瘍を治療するための介入
Appendices
Appendix 1. Glossary of medical terms.
| Terms | Definition | Source |
| Hb SS | An abnormal hemoglobin resulting from the substitution of valine for glutamic acid at position 6 of the beta chain of the globin moiety. The heterozygous state results in sickle cell trait, the homozygous in sickle cell anemia. | Nattional Library of Medicine; Mesh home page. |
| Hb SC | One of the sickle cell disorders characterized by the presence of both hemoglobin S and hemoglobin C. It is similar to, but less severe than sickle cell anemia. | Nattional Library of Medicine; Mesh home page. |
| L‐carnitine | A derivative of the amino acid lysine , required for the transport of fatty acids into mitochondria for oxidation. | |
| Solcoseryl®
DuoDerm | Solcoseryl® is a tissue metabolism activator, chemically and biologically standardized and deproteinised, non antigenic and apyrogenic hemodialized extract form the blood of healthy young calf. Solcoseryl® contains a large amount of natural low molecular substances ‐ glycolipides, nucleosides, nucleotides, amino acids, oligopeptides, irreplaceable micro elements, electrolytes.
Duoderm (Granuflex®, Convatec, Uxbridge, UK, marketed as DuoDerm® in the USA) A hydrocolloid dressing containing colloids and elastomeric and adhesive components. |
http://www.drugspro.org/
|
| RGD peptide matrix | Arginine‐glycine‐aspartic acid (RGD). RGD peptide matrix is designed to act as a temporary, topical synthetic extracellular matrix that substitutes for the damaged natural matrix and provides support for cell ingrowth into the ulcer site. This synthetic matrix consists of an RGD‐containing peptide complexed with sodium hyaluronate in a sterile, non preserved viscous gel. Arginine‐glycine–aspartic acid (RGD) peptide matrix (Argidene Gel®, formerly Telio‐Derm Gel®, Telios Pharmaceuticals, San Diego, CA, USA) The peptide matrix contains the | |
| Isoxsuprine | ß‐Adrenergic receptor stimulants drug. | http://dailymed.nlm.nih.gov |
| Oral zinc sulphate | A salt of zinc used as a supplement for treating zinc deficiency |
|
| Arginine butyrate | The butyric acid salt of the amino acid arginine. | http://www.cancer.gov/drugdictionary |
| Haemoglobinopathy | Any of a group of inherited diseases, such as thalassaemia and sickle‐cell disease , in which there is an abnormality in the production of haemoglobin. | |
| Priapism | Persistent and usually painful erection of the penis that requires urgent decompression; occasionally, however, it can be painless, in which case its treatment is less urgent. | |
| Pulmonary hypertension | Condition in which there is raised blood pressure within the blood vessels supplying the lungs (the pulmonary artery blood pressure is normally much lower than the pressure within the aorta and its branches). | |
| Nitric oxide | An important member of the group of gaseous mediators, which – together with amine mediators (e.g. adrenaline, noradrenaline, histamine, acetylcholine) and lipid mediators (e.g. prostaglandins) – produce many physiological responses | |
| Endothelium | The single layer of cells that lines the heart, blood vessels, and lymphatic vessels. | |
| Antithrombin III | Coagulation inhibitory protein |
Appendix 2. Bias definition
| Bias (Porta 2008) | Definition |
| Bias in the presentation of data | Error due to irregularities produced bi digit preference, incomplete data, poor techniques of measurement, technically poor laboratory procedures, or intentional attempts to mislead. |
| Selection bias | Distortions that result from procedures used to select subjects and from factors that influence participation in the study. |
| Reporting bias | Selective revealing or suppression of information. |
| Design bias | The difference between a true value and that obtained as a result of faulty design of a study. |
Appendix 3. Outcome definitions as described by the RCTs' author
| Trials | Assessment of ulcer healing | Change in ulcer size (surface area or volume) | Complete closure |
| "Ulcer was measured in two dimensions and photographs taken for determination of ulcer" as described by Serjeant 1970. | ‐ | ‐ | |
| It was analysed from the measured long and short dimensions of the ulcer, arbitrarily assuming and elliptical shape. | It was expressed as in real changes and percentage changes in area. | ‐ | |
| "During the weekly clinical visits, the ulcer was traced on acetate film and photographed. All ulcer areas were then calculated by computerized planimetry, using the IMAGEJ software (NIH, Bethesda, MD, USA)". | NA | Complete closure of the ulcer (to an area of 0 cm2). | |
| "The ulcer periphery was defined on the photograph, cut out, weighed, and the area of the ulcer calculated from the weight/area ratio of the photographic paper". | Default: "defined as less than 4 months satisfactorily attendance at the trial". Healed ulcers "expressed as a proportion of those ulcers likely to heal on the basis of small size (8 cm2). | ‐ | |
| "Ulcer size was measured by area (measured in square centimeters), computing an assumed ellipse from long and short axis measurements. When more than one ulcer was present, the average area calculated for that patient was used in the analysis". | Period: 12 weeks. "(1) absolute change in area (change in ulcer area over treatment period divided by number of weeks on treatment) x 12 and (2) percentage change in area (absolute change in area + area at start of treatment)". | ‐ | |
| "Changes in percent ulcer closure occurring between study commencement and endpoint". | ‐ | ‐ |
Appendix 4. Unit of randomisation versus unit of analysis
| Study | Unit of randomisation | Unit of analysis |
| participants | ulcer | |
| ulcer | ulcer | |
| participants | ulcer | |
| participants | ulcer | |
| participants | participants | |
| participants | participants |
Appendix 5. LILACS search strategy
| Key words |
| sickle cell disease |
((Pt ENSAYO CONTROLADO ALEATORIO OR Pt ENSAYO CLINICO CONTROLADO OR Mh ENSAYOS CONTROLADOS ALEATORIOS OR Mh DISTRIBUCIÓN ALEATORIA OR Mh METODO DOBLE CIEGO OR Mh METODO SIMPLECIEGO OR Pt ESTUDIO MULTICÉNTRICO) or ((tw ensaio or tw ensayo or tw trial) and (tw azar or tw acaso or tw placebo or tw control$ or tw aleat$ or tw random$ or (tw duplo and tw cego) or (tw doble and tw ciego) or (tw double and tw blind)) and tw clinic$)) AND NOT ((Ct ANIMALES OR Mh ANIMALES OR Ct CONEJOS OR Ct RATÓN OR MH Ratas OR MH Primates OR MH Perros OR MH Conejos OR MH Porcinos) AND NOT (Ct HUMANO AND Ct ANIMALES)) [Palabras] and sickle [Palabras del resumen] and ulcer [Palabras] (Strategy results:10)
Appendix 6. African Index Medicus (AIM) search strategy
| Key words |
| sickle cell disease |
Search result: 0 references.
Appendix 7. ISI Web of Knowledge
| Key words |
| sickle |


Flowchart of last search of the Group's Trials Register: 25 May 2012.

Risk of bias graph: review authors' judgements about each risk of bias domain presented as percentages across all included studies

Risk of bias summary: review authors' judgements about each risk of bias domain for each included study
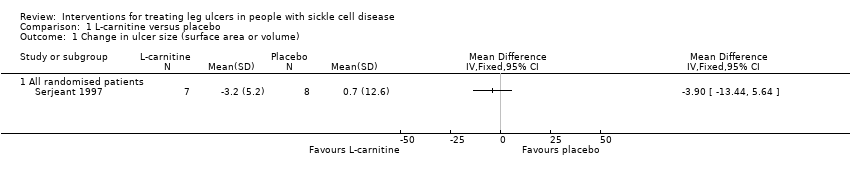
Comparison 1 L‐carnitine versus placebo, Outcome 1 Change in ulcer size (surface area or volume).

Comparison 2 RGD peptide matrix versus placebo, Outcome 1 Incidence of complete closure.

Comparison 2 RGD peptide matrix versus placebo, Outcome 2 Change in size of ulcers healed.

Comparison 2 RGD peptide matrix versus placebo, Outcome 3 Adverse events.
| Isoxuprine compared to placebo for leg ulcer in people with sickle cell disease | ||||||
| Patient or population: patients with leg ulcer in people with sickle cell disease | ||||||
| Outcomes | Illustrative comparative risks* (95% CI) | Relative effect | No of Participants | Quality of the evidence | Comments | |
| Assumed risk | Corresponding risk | |||||
| placebo | Isoxuprine | |||||
| Incidence of complete closure | See comment | See comment | Not estimable | 54 ulcers | ⊕⊝⊝⊝ | This trial shows inconsistency between units of randomisation (30 participants) and unit of analysis (54 ulcers). |
| *The basis for the assumed risk (e.g. the median control group risk across studies) is provided in footnotes. The corresponding risk (and its 95% confidence interval) is based on the assumed risk in the comparison group and the relative effect of the intervention (and its 95% CI). | ||||||
| GRADE Working Group grades of evidence | ||||||
| 1 Sequence generation, allocation concealment, blinding: unclear. Incomplete outcome data and selective report. CI: confidence interval | ||||||
| arginine butyrate plus standard local care compared to standard local care for sickle cell in people with sickle cell disease | ||||||
| Patient or population: sickle cell in people with sickle cell disease | ||||||
| Outcomes | Illustrative comparative risks* (95% CI) | Relative effect | No of Participants | Quality of the evidence | Comments | |
| Assumed risk | Corresponding risk | |||||
| standard local care | arginine butyrate plus standard local care | |||||
| Complete healing | See comment | See comment | Not estimable | 23 participants 62 ulcers | ⊕⊝⊝⊝ | This trial shows inconsistency between units of randomisation (23 participants) and unit of analysis (62 ulcers). |
| Change in ulcer size | See comment | See comment | Not estimable | (1 study; McMahon 2010) | ⊕⊝⊝⊝ | This trial shows inconsistency between units of randomisation (23 participants) and unit of analysis (62 ulcers). |
| *The basis for the assumed risk (e.g. the median control group risk across studies) is provided in footnotes. The corresponding risk (and its 95% CI) is based on the assumed risk in the comparison group and the relative effect of the intervention (and its 95% CI). | ||||||
| GRADE Working Group grades of evidence | ||||||
| 1 Unclear allocation concealment CI: confidence interval | ||||||
| L‐carnitine compared to placebo for leg ulcer in people with sickle cell disease | ||||||
| Patient or population: leg ulcer in people with sickle cell disease | ||||||
| Outcomes | Illustrative comparative risks* (95% CI) | Relative effect | No of Participants | Quality of the evidence | Comments | |
| Assumed risk | Corresponding risk | |||||
| placebo | L‐carnitine | |||||
| Change in ulcer size | See comment | See comment | Not estimable | 15 | ⊕⊝⊝⊝ | Mean difference: ‐3.90 (95% CI ‐13.44 to 5.64). |
| *The basis for the assumed risk (e.g. the median control group risk across studies) is provided in footnotes. The corresponding risk (and its 95% CI) is based on the assumed risk in the comparison group and the relative effect of the intervention (and its 95% CI). | ||||||
| GRADE Working Group grades of evidence | ||||||
| 1 Random sequence generation: unclear. CI: confidence interval | ||||||
| RGD peptide matrix compared to placebo for leg ulcer in people with sickle cell disease | ||||||
| Patient or population: patients with leg ulcer in people with sickle cell disease | ||||||
| Outcomes | Illustrative comparative risks* (95% CI) | Relative effect | No of Participants | Quality of the evidence | Comments | |
| Assumed risk | Corresponding risk | |||||
| placebo | RGD peptide matrix | |||||
| Complete closure | See comment | See comment | Not estimable | 55 | ⊕⊝⊝⊝ | Risk ratio: 0.40 (95% CI 0.15 to 1.04). |
| Change in size ulcers healed | See comment | See comment | Not estimable | 55 | ⊕⊝⊝⊝ | Mean difference: 6.60 (95% CI 5.51 to 7.69). |
| Total adverse events | See comment | See comment | Not estimable | 55 | ⊕⊝⊝⊝ | Risk ratio: 0.76 (95 CI 0.50 to 1.17). |
| Related study treatment adverse events | See comment | See comment | Not estimable | 33 | ⊕⊝⊝⊝ | Risk Ratio: 1.41 (95% CI 0.27 to 7.38). |
| *The basis for the assumed risk (e.g. the median control group risk across studies) is provided in footnotes. The corresponding risk (and its 95% CI) is based on the assumed risk in the comparison group and the relative effect of the intervention (and its 95% CI). | ||||||
| GRADE Working Group grades of evidence | ||||||
| 1 Sequence generation and allocation concealment: unclear CI: confidence interval | ||||||
| Outcome or subgroup title | No. of studies | No. of participants | Statistical method | Effect size |
| 1 Change in ulcer size (surface area or volume) Show forest plot | 1 | Mean Difference (IV, Fixed, 95% CI) | Totals not selected | |
| 1.1 All randomised patients | 1 | Mean Difference (IV, Fixed, 95% CI) | 0.0 [0.0, 0.0] | |
| Outcome or subgroup title | No. of studies | No. of participants | Statistical method | Effect size |
| 1 Incidence of complete closure Show forest plot | 1 | Risk Ratio (M‐H, Fixed, 95% CI) | Totals not selected | |
| 2 Change in size of ulcers healed Show forest plot | 1 | Mean Difference (IV, Fixed, 95% CI) | Totals not selected | |
| 3 Adverse events Show forest plot | 1 | Risk Ratio (M‐H, Fixed, 95% CI) | Totals not selected | |
| 3.1 Total | 1 | Risk Ratio (M‐H, Fixed, 95% CI) | 0.0 [0.0, 0.0] | |
| 3.2 Related study treatment | 1 | Risk Ratio (M‐H, Fixed, 95% CI) | 0.0 [0.0, 0.0] | |