Realidad virtual para la rehabilitación del accidente cerebrovascular
Resumen
Antecedentes
La realidad virtual y los juegos de video interactivos han surgido como abordajes terapéuticos recientes en la rehabilitación del accidente cerebrovascular, en particular con las consolas de juego comerciales, y han sido adoptadas rápidamente en el ámbito clínico. Ésta es una actualización de una revisión Cochrane publicada por primera vez en 2011 y de nuevo en 2015.
Objetivos
Objetivo primario: determinar la eficacia de la realidad virtual en comparación con una intervención alternativa o ninguna intervención sobre la función y la actividad de los miembros superiores.
Objetivos secundarios: determinar la eficacia de la realidad virtual en comparación con una intervención alternativa o ninguna intervención sobre: marcha y equilibrio, función motora global, función cognitiva, limitación de la actividad, restricción de la participación, calidad de vida y eventos adversos.
Métodos de búsqueda
Se hicieron búsquedas en el registro de ensayos del Grupo Cochrane de Accidentes Cerebrales Vasculares (Cochrane Stroke Group Trials Register) (abril 2017), CENTRAL, MEDLINE, Embase y en siete bases de datos adicionales. También se buscó en registros de ensayos y listas de referencias.
Criterios de selección
Ensayos aleatorizados y cuasialeatorizados de la realidad virtual (“una forma avanzada de interconexión entre el ordenador y el ser humano que le permite al usuario "interactuar" y estar “inmerso” en un ambiente generado informáticamente de manera realista) en pacientes adultos después del accidente cerebrovascular. El resultado primario de interés fue la función del miembro superior y la actividad. Los resultados secundarios incluyeron la marcha y el equilibrio y la función motora global.
Obtención y análisis de los datos
Dos autores de la revisión de forma independiente seleccionaron los ensayos según los criterios de inclusión predefinidos, extrajeron los datos y evaluaron el riesgo de sesgo. Un tercer autor de la revisión moderó los desacuerdos cuando fue necesario. Los autores de la revisión contactaron con los investigadores para obtener la información que faltaba.
Resultados principales
Se incluyeron 72 ensayos con 2470 participantes. Esta revisión incluye 35 estudios nuevos además de los estudios incluidos en la versión anterior de esta revisión. Los tamaños de la muestra del estudio por lo general fueron pequeños y las intervenciones variaron en cuanto a los objetivos del tratamiento y los dispositivos de realidad virtual utilizados. El riesgo de sesgo presente en muchos estudios fue incierto debido al informe deficiente. Por lo tanto, si bien hay un gran número de ensayos controlados aleatorizados, la evidencia sigue siendo en su mayoría de calidad baja cuando se califica con el sistema GRADE. Los grupos de control generalmente no recibieron ninguna intervención o recibieron un tratamiento basado en un enfoque de atención estándar. Resultado primario: los resultados no fueron estadísticamente significativos para la función de los miembros superiores (diferencia de medias estandarizada [DME] 0,07; intervalos de confianza [IC] del 95%: ‐0,05 a 0,20; 22 estudios; 1 038 participantes; evidencia de calidad baja) al comparar la realidad virtual con el tratamiento convencional. Sin embargo, cuando la realidad virtual se utilizó como complemento a la atención habitual (proporcionando una dosis mayor de tratamiento para los del grupo de intervención) hubo una diferencia estadísticamente significativa entre los grupos (DME 0,49; 0,21 a 0,77; 10 estudios, 210 participantes, evidencia de calidad baja). Resultados secundarios: en comparación con los enfoques terapéuticos convencionales, no hubo efectos estadísticamente significativos sobre la velocidad de la marcha o el equilibrio. Los resultados fueron estadísticamente significativos para el resultado de las actividades cotidianas (DME 0,25; IC del 95%: 0,06 a 0,43; 10 estudios, 466 participantes; evidencia de calidad moderada); sin embargo, no fue posible agrupar los resultados para la función cognitiva, la restricción de la participación o la calidad de vida. Veintitrés estudios informaron que controlaron los eventos adversos; en estos estudios hubo pocos eventos adversos y los informados fueron relativamente leves.
Conclusiones de los autores
Se encontró evidencia de que el uso de realidad virtual y de juegos de video interactivos no fue más beneficioso que los enfoques de tratamiento convencionales para mejorar la función del miembro superior. La realidad virtual puede ser beneficiosa para mejorar la función del miembro superior y las actividades cotidianas cuando se la utiliza como un complemento de la atención habitual (para aumentar el tiempo de tratamiento general). Hubo evidencia insuficiente para establecer conclusiones acerca del efecto de la realidad virtual y el juego de video interactivo sobre la velocidad de la marcha, el equilibrio, la participación o la calidad de vida. Esta revisión halló que el tiempo desde la aparición del accidente cerebrovascular, la gravedad de la deficiencia y el tipo de dispositivo (comercial o personalizado) no fueron factores fuertes que influyeran en el resultado. Hubo una tendencia que sugiere que una dosis mayor (más de 15 horas de intervención total) fue preferible, al igual que los programas personalizados de realidad virtual; sin embargo, estos resultados no fueron estadísticamente significativos.
PICO
Resumen en términos sencillos
Realidad virtual para la rehabilitación del accidente cerebrovascular
Pregunta de la revisión
Se deseaba comparar los efectos de la realidad virtual versus un tratamiento alternativo o ningún tratamiento sobre la recuperación después del accidente cerebrovascular mediante el uso de la función del brazo y otros resultados como la velocidad de caminata y la independencia para controlar las actividades diarias después del accidente cerebrovascular.
Antecedentes
Muchas personas después de tener un accidente cerebrovascular presentan dificultades en el movimiento, el pensamiento y la sensibilidad. Este hecho a menudo da lugar a problemas con las actividades diarias como escribir, caminar y conducir. La realidad virtual y los juegos de video interactivos son nuevos tipos de tratamiento que se administran a los pacientes después de un accidente cerebrovascular. El tratamiento incluye el uso de programas de computadora diseñados para simular objetos y eventos de la vida real. La realidad virtual y los juegos de video interactivos pueden tener algunas ventajas sobre los enfoques terapéuticos tradicionales debido a que pueden implicar para las personas una oportunidad de practicar las actividades cotidianas que no se practican o no pueden practicarse dentro del ambiente del hospital. Además, hay varias características de los programas de realidad virtual que podrían significar que los pacientes pasan más tiempo en la terapia: por ejemplo, la actividad podría ser más motivadora.
Características de los estudios
Se identificaron 72 estudios que incluyeron a 2470 pacientes después de un accidente cerebrovascular. Se utilizó una gama amplia de programas de realidad virtual, y la mayoría se orientó a mejorar la función del brazo o la capacidad de caminata. La evidencia está actualizada hasta abril de 2017.
Resultados clave
Veintidós ensayos estudiaron si el uso de la realidad virtual en comparación con el tratamiento convencional daba lugar a una mejoría en la capacidad de usar el brazo, y hallaron que este tratamiento no resultó en una mejor función (evidencia de baja calidad). Cuando la realidad virtual se utilizó como complemento a la atención habitual o a la rehabilitación para aumentar la cantidad de tiempo que la persona se pasa en el tratamiento, hubo mejorías en el funcionamiento del brazo (evidencia de calidad baja). Seis ensayos estudiaron si el uso de la realidad virtual en comparación con el tratamiento convencional resultaba en una mejoría en la velocidad de caminata. No hubo evidencia de que la realidad virtual fuera más efectiva en este caso (evidencia de calidad baja). Diez ensayos encontraron que hubo cierta evidencia de que la realidad virtual dio lugar a una capacidad levemente mejor de manejar las actividades cotidianas, como ducharse y vestirse (evidencia de calidad moderada). Sin embargo, estos efectos positivos se encontraron poco después del final del tratamiento y no está claro si los efectos son duraderos. Los resultados deben interpretarse con cuidado debido a que, aunque hay un gran número de estudios, los estudios generalmente son pequeños y no son de alta calidad. Un número pequeño de pacientes que utilizaron la realidad virtual informaron dolor, cefalea, o mareos. No se informaron eventos adversos graves.
Calidad de la evidencia
La calidad de la evidencia generalmente fue baja a moderada. La calidad de la evidencia para cada resultado se ve limitada por el pequeño número de participantes en los estudios, los resultados inconsistentes en los estudios y el informe deficiente de los detalles de los estudios.
Authors' conclusions
Summary of findings
| Virtual reality compared to conventional therapy for stroke rehabilitation | ||||||
| Patient or population: people receiving stroke rehabilitation Comparison: conventional therapy | ||||||
| Outcomes | Illustrative comparative risks* (95% CI) | Relative effect | No of participants | Quality of the evidence | Comments | |
| Assumed risk | Corresponding risk | |||||
| Control | Virtual reality | |||||
| Upper limb function | Same dose of conventional therapy | The mean upper limb function in the intervention groups was | 1038 | ⊕⊕⊝⊝ | No statistically significant difference between groups | |
| Quality of life | Same dose of conventional therapy | No significant benefit found on total score of the SF‐36 | 300 (3 studies) | ⊕⊕⊝⊝ low1,2,4 | Studies could not be pooled. None of the 3 studies found significant differences between groups in total score. 2 studies reported significant differences in domains of the SF36 | |
| Gait speed | Same dose of conventional therapy | The mean gait speed in the intervention groups was | 139 | ⊕⊕⊝⊝ | No statistically significant difference between groups | |
| ADL outcome | Same dose of conventional therapy | The mean ADL outcome in the intervention groups was | 466 | ⊕⊕⊕⊝ | Small effect in favour of those receiving virtual reality intervention | |
| ADL: activities of daily living; CI: confidence interval | ||||||
| GRADE Working Group grades of evidence High quality: we are very confident that the true effect lies close to that of the estimate of the effect Moderate quality: we are moderately confident in the effect estimate; the true effect is likely to be close to the estimate of effect, but there is a possibility that it is substantially different Low quality: our confidence in the effect estimate is limited; the true effect may be substantially different from the estimate of the effect Very low quality: we have very little confidence in the effect estimate; the true effect is likely to be substantially different from the estimate of effect | ||||||
| 1Risk of bias was unclear in a number of studies. | ||||||
| Virtual reality intervention compared with usual care (thus provided as additional therapy) for stroke rehabilitation | ||||||
| Patient or population: people receiving stroke rehabilitation Settings: hospital, clinic or home Intervention: virtual reality provided in addition to usual care Comparison: usual care | ||||||
| Outcomes | Illustrative comparative risks* (95% CI) | Relative effect | No of participants | Quality of the evidence | Comments | |
| Assumed risk | Corresponding risk | |||||
| Control | Virtual reality (provided in addition to usual care) | |||||
| Upper limb function | Usual care | The SMD in the intervention groups was 0.49 standard deviations higher (0.21 to 0.77) | ‐ | 210 (10 studies) | ⊕⊕⊝⊝ | Moderate effect in favour of providing virtual reality intervention in addition to usual care |
| Quality of life ‐ not measured in any of the studies | ‐ | ‐ | ‐ | ‐ | ‐ | Not measured in the studies |
| Gait speed | Usual care | The mean difference in the intervention groups was | ‐ | 57 (3 studies) | ⊕⊕⊝⊝ | No statistically significant difference between groups |
| Global motor function | Usual care | The SMD in the intervention groups was | ‐ | 43 (3 studies) | ⊕⊕⊝⊝ | No statistically significant difference between groups |
| ADL outcome | Usual care | The SMD in the intervention groups was 0.44 standard deviations higher (0.11 to 0.76) | ‐ | 153 (8 studies) | ⊕⊕⊝⊝ | Small to moderate effect in favour of virtual reality intervention |
| *The basis for the assumed risk (e.g. the median control group risk across studies) is provided in footnotes. The corresponding risk (and its 95% confidence interval) is based on the assumed risk in the comparison group and the relative effect of the intervention (and its 95% CI). ADL: activities of daily living; CI: confidence interval; MD: mean difference; RR: risk ratio; SMD: standardised mean difference | ||||||
| GRADE Working Group grades of evidence High quality: we are very confident that the true effect lies close to that of the estimate of the effect Moderate quality: we are moderately confident in the effect estimate; the true effect is likely to be close to the estimate of effect, but there is a possibility that it is substantially different Low quality: our confidence in the effect estimate is limited; the true effect may be substantially different from the estimate of the effect Very low quality: we have very little confidence in the effect estimate; the true effect is likely to be substantially different from the estimate of effect | ||||||
| 1Risk of bias was unclear in a number of studies. | ||||||
Background
Description of the condition
Stroke is one of the leading causes of death and disability and has been described as a worldwide epidemic (Feigin 2014; Go 2014). The effects of a stroke may include sensory, motor, and cognitive impairment as well as a reduced ability to perform self care and participate in social and community activities (Miller 2010). While most recovery is thought to be made in the first few weeks after stroke, patients may make improvements on functional tasks many months after having a stroke (Teasell 2014). Many stroke survivors report long‐term disability and reduced quality of life (Patel 2006; Sturm 2004).
Description of the intervention
Repetitive task training has been shown to be effective in some aspects of rehabilitation, such as improving walking distance and speed and improving upper limb function (French 2016; Veerbeek 2014). Virtual reality is a relatively recent approach that may enable simulated practice of functional tasks at a higher dosage than traditional therapies (Demain 2013; Fung 2012; Kwakkel 2004; Merians 2002). Virtual reality has been defined as the "use of interactive simulations created with computer hardware and software to present users with opportunities to engage in environments that appear and feel similar to real‐world objects and events" (Weiss 2006).
Virtual reality has previously been used in a variety of vocational training settings, such as flight simulation training for pilots (Lintern 1990) and procedural training for surgeons (Larsen 2009). Within health care, the intervention has been used to treat phobias, post‐traumatic stress disorder, and body image disorders (Jiandani 2014; Raghav 2016). Although its research in rehabilitation is becoming more prevalent as technology becomes more accessible and affordable, the use of virtual reality is not yet routinely used in clinical rehabilitation settings. However, gaming consoles are ubiquitous and so researchers and clinicians have turned to low‐cost commercial gaming systems as an alternative way of delivering virtual reality (Levac 2015). These systems, which were originally designed for recreation, are being adapted by clinicians for therapeutic purposes. In addition, interactive video games are specifically being designed for rehabilitation (Lange 2010; Lange 2012).
In virtual rehabilitation, virtual environments and objects provide the user with visual feedback, which may be presented though a head‐mounted device, projection system, or flat screen. Feedback may also be provided through the senses, for example, hearing, touch, movement, balance, and smell (Weiss 2006). The user interacts with the environment by a variety of mechanisms. These may be simple devices, such as a mouse or joystick, or more complex systems using cameras, sensors, or haptic (touch) feedback devices (Weiss 2006). Thus, depending on the intervention, the user's level of physical activity may range from relatively inactive (for example, sitting at a computer using a joystick), to highly active (for example, challenging, full‐body movements). Virtual reality relies on computer hardware and software that mediates the interaction between the user and the virtual environment (Gaggioli 2009).
Key concepts related to virtual reality are immersion and presence. Immersion refers to the extent to which the user perceives that they are in the virtual environment rather than the real world and is related to the design of the software and hardware (Gaggioli 2009; Weiss 2006). Virtual environments can range in their degree of immersion of the user. Systems that include projection onto a concave surface, head‐mounted display, or video capture in which the user is represented within the virtual environment are generally described as immersive, whereas a single screen projection or desktop display are considered low immersion.
Presence is the subjective experience of the user and is dependent on the characteristics of the virtual reality system, the virtual task, and the characteristics of the user. People are considered present when they report the feeling of being in the virtual world (Schuemie 2001).
How the intervention might work
Virtual reality may be advantageous as it offers several features, such as goal‐oriented tasks and repetition, shown to be important in neurological rehabilitation (Langhorne 2011; Veerbeek 2014). Animal research has shown that training in enriched environments results in better problem solving and performance of functional tasks than training in basic environments (Risedal 2002). Virtual reality may have the potential to provide an enriched environment in which people with stroke can problem solve and master new skills. Virtual tasks have been described as more interesting and enjoyable by children and adults, thereby encouraging higher numbers of repetitions (Lewis 2012).
Evidence of neuroplasticity as a result of training in virtual reality is modest; however, neuroimaging findings are guiding the development of virtual reality. Two studies have shown that functional improvements after virtual reality training were paralleled with a lateralisation of neural activation from the contralesional sensorimotor activation prior to training, to an ipsilesional representation after training (Jang 2005; You 2005). Tunik and colleagues have shown that when individuals post stroke were presented with discordant feedback, they activated the primary motor region (M1) to a greater extent than when feedback was not discordant (Tunik 2013). Notably, when discordant feedback corresponded to the affected and moving hand, the contralateral M1 region was recruited (Bagce 2012; Tunik 2013). Conversely, by having participants move the unaffected hand with virtual mirror feedback, the ipsilateral (affected) M1 region was recruited (despite the affected hand remaining static) (Saleh 2014). Their findings suggest that tailoring manipulation of the visual feedback in virtual reality to the needs of the patient may serve as a tool for rehabilitation.
One major advantage of virtual reality programs, which has been underutilised to date, is that they allow clinicians to be able to trial tasks that are unsafe to practise in the real world, such as crossing the street. In addition, some programs are designed to be used without supervision, also meaning that increased dosage of therapy can be provided without increased staffing levels.
Why it is important to do this review
As using technology becomes an integral part of daily living, virtual reality is likely to become even more widely used in clinical rehabilitation settings (Bohil 2011; Burridge 2010). It is important to evaluate the efficacy of virtual reality in order to guide future design and use. Furthermore, therapeutic interventions that increase the dose of task‐specific training without increasing staffing will be sought after.
There are now a number of systematic reviews examining the efficacy of virtual reality for stroke rehabilitation (Crosbie 2007; Darekar 2015; Lohse 2014; Moreira 2013; Saposnik 2011) and, more specifically, commercial gaming devices for upper limb stroke rehabilitation (Thomson 2014). Our initial review published in 2011 identified 19 studies and a number of ongoing studies. Our update published in 2015 resulted in the inclusion of more studies bringing the total to 37 studies. The area is rapidly expanding and therefore an update of our review was warranted.
Objectives
Primary objective
To determine the efficacy of virtual reality compared with an alternative intervention or no intervention on upper limb function and activity.
Secondary objectives
To determine the efficacy of virtual reality compared with an alternative intervention or no intervention on gait and balance, global motor function, cognitive function, activity limitation, participation restriction, quality of life, and adverse events.
Methods
Criteria for considering studies for this review
Types of studies
We planned to include randomised controlled trials (RCTs) and quasi‐randomised (e.g. allocation by birth date) controlled trials (QRCTs). We included one QRCT and the remaining studies were RCTs. Where the QRCT was included in a meta‐analysis we carried out a sensitivity analysis restricting analysis to truly randomised studies. We looked for studies that compared virtual reality with either an alternative intervention or no intervention. We did not include studies that compared two different types of virtual reality without an alternative group. We included trials that evaluated any intensity and duration of virtual reality that exceeded a single treatment session.
Types of participants
The study participants had a diagnosis of stroke, defined by the World Health Organization as "a syndrome of rapidly developing symptoms and signs of focal, and at times global, loss of cerebral function lasting more than 24 hours or leading to death with no apparent cause other than that of vascular origin" (WHO 1989), diagnosed by imaging or neurological examination. We included people who were 18 years and older with all types of stroke, all levels of severity, and at all stages post stroke, including those people with subarachnoid haemorrhage. We excluded studies of participants with mixed aetiology (for example, participants with acquired brain injury) unless data were available relating to the people with stroke only.
Types of interventions
We included studies using virtual reality interventions that met the following definition: "an advanced form of human‐computer interface that allows the user to 'interact' with and become 'immersed' in a computer‐generated environment in a naturalistic fashion" (Schultheis 2001).
We included studies using any form of non‐immersive or immersive virtual reality, and studies that used commercially available gaming consoles.
The comparison group received either an alternative intervention or no intervention. Given the broad range of alternative interventions, we considered these to include any activity designed to be therapeutic at the impairment, activity, or participation level that did not include the use of virtual reality.
Types of outcome measures
Primary outcomes
As one of the most common applications of virtual reality in stroke rehabilitation is upper limb rehabilitation, we selected the following primary outcome.
-
Upper limb function and activity:
-
arm function and activity: including assessments such as the Fugl Meyer, Motor Assessment Scale (upper limb), Action Research Arm Test, Wolf Motor Function Test, Box and Block Test, Jebsen Taylor Hand Function Test
-
hand function: grip strength
-
Secondary outcomes
-
Gait and balance:
-
lower limb activity: including assessments such as walking distance, walking speed, Community Walk Test, functional ambulation, Timed Up and Go Test;
-
balance and postural control: including assessments such as the Berg Balance Scale and forward reach test.
-
-
Global motor function: including assessments such as the Motor Assessment Scale.
-
Cognitive function: including assessments such as Trail Making Test, Useful Field of View Test.
-
Activity limitation: addressing activities of daily living and including assessments such as the Functional Independence Measure (FIM), Barthel Index, on‐road driving test.
-
Participation restriction and quality of life: including assessments such as the SF36, EQ5D, Stroke Impact Scale or other patient‐reported outcome measure.
-
Adverse events: including motion sickness, pain, injury, falls and death.
We included the primary outcome (upper limb function) and gait, global motor function, and quality of life in summary of findings Table for the main comparison.
Search methods for identification of studies
See the 'Specialised register' section in the Cochrane Stroke Group module. We searched for relevant trials in all languages and arranged translation of trial reports published in languages other than English.
Electronic searches
The searches for studies in our previous reviews were conducted in March 2010 and November 2013. The search for this update was completed in May 2016 and then updated again in April 2017. Cochrane Stroke's Managing Editor searched the Group's Trials Register in April 2017 using the intervention codes 'computer‐aided therapy' and 'virtual reality therapy'.
In addition, we searched the following electronic bibliographic databases: the Cochrane Central Register of Controlled Trials (CENTRAL; 2017, Issue 3, searched 1 April 2017) (Appendix 1); MEDLINE Ovid (1950 to April Week 1, 2017) (Appendix 2); Embase (1980 to Week 13, 2017) (Appendix 3); Ovid AMED (1985 to April 2017) (Appendix 4); CINAHL Ebsco (1982 to April Week 1, 2017) (Appendix 5); Ovid PsycINFO (1840 to April Week 1, 2017) (Appendix 6); PsycBITE (Psychological Database for Brain Impairment Treatment Efficacy, www.psycbite.com/) (to 1 April 2017) and OTseeker (www.otseeker.com/) (to 1 April 2017). We also searched the engineering databases COMPENDEX (1970 to 1 April 2017) for studies from a non‐medical background.
The Cochrane Stroke Group Information Specialist developed our search strategies for MEDLINE (Ovid) and we adapted them for other databases with the assistance of an experienced medical librarian.
Searching other resources
In order to identify further published, unpublished and ongoing trials, we:
-
searched the following ongoing trials registers: Current Controlled Trials (www.isrctn.com), National Institute of Health Clinical Trials Database (www.clinicaltrials.gov) and Stroke Trials Registry (www.strokecenter.org/trials/) to 1 June 2016;
-
used the Cited Reference Search within Science Citation Index (SCI) and Social Science Citation Index (SSCI) to track relevant references for all included studies;
-
scanned the reference lists of all included studies;
-
searched Dissertation Abstracts via Proquest (1 June 2016);
-
scanned the abstracts of non‐English language studies if they were available in English;
-
searched the IEEE (Institute of Electrical and Electronic Engineers) electronic library (to 1 April 2017).
For the previous version of this review we carried out the following searches; however, we did not repeat these searches for this update.
-
We handsearched the proceedings of the International Workshop on Virtual Rehabilitation (2003 to 2005), Virtual Rehabilitation Conference (2007 to 2009), International Conference Series on Disability, Virtual Reality and Associated Technologies (2000 to 2008) and Cybertherapy (2003 to 2007).
-
We contacted 12 manufacturers of virtual reality equipment to ask for details of trials. We contacted the following manufacturers by telephone, email or postal mail: Nintendo, Sony, GestureTek, NeuroVR, Hocoma, Motek, Virtual Realities, Haptic Master, Microsoft Xbox, Essential Reality, SensAble, Novint and Cyberglove. Three of the manufacturers responded (Nintendo, Motek, and Novint); however, they were unable to provide details of studies eligible for inclusion in the review.
Data collection and analysis
Selection of studies
One review author (KL) performed the searches. Two of the authors (KL and BL) independently reviewed the titles and abstracts identified from the database searches to assess whether they met the pre‐defined inclusion criteria. The review authors obtained potentially relevant articles in full text and KL contacted study authors when more information was required. KL and BL then independently reviewed full‐text articles and correspondence with investigators to determine studies to be included in the review. JD made the final decision on studies that KL and BL disagreed on. We documented the reasons for the exclusion of studies. Where studies published in non‐English languages appeared relevant, we sought the full text of the study. In these cases, we arranged for someone fluent in the non‐English language to review the paper to ascertain whether the study met the inclusion criteria.
Data extraction and management
Two review authors (KL and SG, JD, GS or MC) independently extracted data using a pre‐designed data extraction form for each selected study. Data extracted included citation details, trial setting, inclusion and exclusion criteria, study population, participant flow, intervention details, outcome measures and results, and methodological quality. We resolved disagreements by discussion or by referral to a third review author (BL) as necessary. The review authors contacted study authors by email to request any missing information necessary for the review.
Assessment of risk of bias in included studies
Two review authors (KL and SG, JD, GS or MC) used Cochrane's 'Risk of bias' tool to independently assess the methodological quality of the included studies (Appendix 7; Higgins 2011a). The tool covers the domains of sequence generation, allocation concealment, blinding of outcome assessors, incomplete outcome data and selective reporting. We classified items as 'low risk', 'high risk' or 'unclear risk' of bias. We omitted the domain that assesses the blinding of participants as we were of the opinion that this domain related to the nature of the intervention and not study quality. We contacted the authors of the included studies for more information where insufficient information was published to assess the risk of bias. We resolved disagreements with help from a third review author (BL).
We employed GRADE to interpret findings (Guyatt 2008) and used GRADEpro GDT to create 'Summary of findings' tables (GRADEpro GDT 2015). The tables provide outcome‐specific information concerning the overall quality of evidence from studies included in the comparisons, the magnitude of effect of the intervention, and the sum of available data on the outcomes considered. When using GRADE, we downgraded the evidence from 'high quality' by one level for serious (or by two for very serious) study limitations (risk of bias), indirectness of evidence, serious inconsistency, imprecision of effect estimates, or potential publication bias.
Measures of treatment effect
Two review authors (KL and SG, JD, GS or MC) independently classified outcome measures in terms of the domain assessed (upper limb function, hand function, lower limb and gait activity, balance and postural control, global motor function, cognitive function, activity limitation, participation restriction, and quality of life). When a study presented more than one outcome measure for the same domain, we included the measure most frequently used across studies in the analysis. We planned to calculate risk ratios (RR) with 95% confidence intervals (CIs) for any dichotomous outcomes, if recorded. We calculated mean differences (MD) or standardised mean differences (SMD) for continuous outcomes as appropriate.
Unit of analysis issues
The unit of randomisation in these trials was the individual participant. We did not include any cluster‐randomised controlled trials. Seven of the studies were three‐armed trials. We used the approach of splitting the 'shared' group into two or more groups with smaller sample size and including two (reasonably independent) comparisons (as described in part 16.5.4 of the Cochrane Handbook for Systematic Reviews of Interventions: Higgins 2011b). Lam 2006 compared virtual reality with an alternative intervention and no intervention. We used data in the analyses according to the comparison (i.e. we used the data comparing the virtual reality arm with the alternative intervention arm in one meta‐analysis and the data comparing virtual reality with no intervention in another meta‐analysis). Coupar 2012 compared a usual‐care group with a group that received additional 'low intensity' virtual reality intervention and a group that received additional 'high intensity' virtual reality intervention. We split the control group data enabling comparison of high intensity with usual care and low intensity with usual care. da Silva Cameirao 2011 compared a virtual reality intervention using a specialised program with a control group who either received gaming or conventional occupational therapy. Data were only provided for intervention (virtual reality) versus control (Wii or conventional therapy) and so were included in the meta‐analysis in this manner. Byl 2013 compared conventional therapy with unilateral and bilateral virtual reality intervention. We used the data from both intervention groups and split the control group. Zucconi 2012 compared a virtual reality intervention with feedback on performance with a virtual reality intervention without feedback and conventional therapy. We were only able to obtain data from the virtual reality with feedback on performance group versus the control group and so this is what was used in the analysis. A study published by Fan 2014 randomised people to an interactive video gaming group, a conventional occupational therapy group, and a recreational board game group; we were unable to obtain data from this study in a form suitable for meta‐analysis so provided a descriptive summary. Finally, Kong 2014 randomised participants to interactive video gaming, conventional therapy or usual care. We used data comparing the gaming, conventional therapy, and usual care in separate analyses.
Dealing with missing data
We contacted study authors to obtain any missing data and converted available data when possible (e.g. we converted gait speed reported as metres per minute to metres per second (Jaffe 2004)). We used the actual denominator of the participants contributing the data.
Assessment of heterogeneity
We pooled results to present an overall estimate of the treatment effect using a fixed‐effect model in the primary analysis. We assessed heterogeneity by visual inspection of the forest plot. We quantified inconsistency amongst studies using the I2 statistic (Higgins 2003), where we considered levels greater than 50% as substantial heterogeneity. We used a random‐effects model as part of a sensitivity analysis in the presence of heterogeneity (Deeks 2011).
Assessment of reporting biases
Our search of clinical trials registers assisted in reducing publication bias. We also investigated selective outcome reporting through the comparison of the methods section of papers with the results reported and contacting study authors to check whether additional outcomes had been collected. We inspected funnel plots for each of the analyses; however, interpretation was limited due to the small sample sizes.
Data synthesis
Where there were acceptable levels of heterogeneity, we pooled results. We used the fixed‐effect model with 95% CI using Review Manager 5 (RevMan 5) (RevMan 2014). We used a random‐effects model as part of a sensitivity analysis. Where meta‐analysis was not appropriate due to unacceptable heterogeneity, we have presented a narrative summary of study results. We pooled outcomes measured with different instruments using the SMD.
Subgroup analysis and investigation of heterogeneity
We attempted to perform subgroup analyses to determine whether outcomes varied according to age, severity of stroke, time since onset of stroke, dose of intervention (total hours of intervention) and type of intervention (highly specialised program designed for rehabilitation versus commercial gaming console). However, not all of these analyses were possible due to the homogeneity of trial participants. We were able to undertake subgroup analysis in some cases for:
-
dosage of intervention (for upper limb function we compared less than 15 hours' intervention with more than 15 hours' intervention and for lower limb function we compared less than 10 hours' intervention with more than 10 hours' intervention). We selected the doses of 10 and 15 hours based on examining the included studies and their characteristics and choosing a threshold that appeared to separate the studies approximately in half (to enable comparisons of higher‐ and lower‐dose treatments);
-
time since onset of stroke (less than or more than six months);
-
type of intervention (specialised program or commercial gaming console);
-
severity of impairment (upper limb).
Sensitivity analysis
We performed sensitivity analyses to determine whether there was a difference in using a fixed‐effect model versus a random‐effects model. We conducted sensitivity analyses where possible to explore the effects of the methodological quality of the included studies on overall effect.
Results
Description of studies
See Characteristics of included studies; Characteristics of excluded studies.
Results of the search
We identified 168 studies from searching the Cochrane Stroke Group Trials Register and 11,664 references from the database searches totaling 11,832 references to studies. A search of the trials registries elicited a further 108 potentially relevant studies. From the 11,940 titles and abstracts retrieved, we sought 422 of the articles in full text for further review. We grouped articles reporting the same study. We removed articles that did not meet the inclusion criteria, such as studies that used interventions that were not considered virtual reality and non‐randomised controlled trials. We included a total of 72 studies. We have provided details on 34 excluded studies in the Characteristics of excluded studies table, which were closest to, but did not meet the inclusion criteria (Figure 1). We identified 14 studies awaiting classification, and 22 ongoing studies (Characteristics of ongoing studies).

Study flow diagram
Included studies
We identified 72 RCTs with a total of 2470 participants, which met the inclusion criteria. Of the 72 included studies, we included 19 (with 565 participants) in the original version of this review, 18 new studies (with 454 participants) in the 2015 update, and 35 new studies (with 1451 participants) in this updated review.
Sample characteristics
All trials took place between 2004 and 2016. All but two were published in English (Galvao 2015; Xiang 2014). Over half (41; 57%) of the studies involved sample sizes of fewer than 25 participants and only 10 studies involved more than 50 participants (Adie 2017; Akinwuntan 2005; Kiper 2011; Klamroth‐Marganska 2014; Ko 2015; Kong 2014; Lam 2006; Linder 2015; Prange 2015; Saposnik 2016). A total of 2470 participants post stroke were included in the trials.
All studies, except for Ucar 2014, reported that they included both men and women. Although not always clearly reported, it appears that participants in the included studies were relatively young, with all studies reporting mean ages of 46 to 75 years.
Thirteen trials recruited participants within three months of stroke (Akinwuntan 2005; Coupar 2012; da Silva Cameirao 2011; Kwon 2012; Kong 2014; Low 2012; Mao 2015; Morone 2014; Piron 2007; Prange 2015; Saposnik 2010; Saposnik 2016; Xiang 2014); two trials recruited within six months of stroke (Adie 2017; Ko 2015); two trials recruited within 12 months (Kiper 2011; Yavuzer 2008); three trials recruited people more than two to three months post stroke (Levin 2012; McNulty 2015; Reinkensmeyer 2012); 31 trials recruited participants more than six months post stroke (Byl 2013; Crosbie 2008; da Silva Ribeiro 2015; Fan 2014; Givon 2016; Housman 2009; Hung 2014; Jaffe 2004; Jang 2005; Jung 2012; Kim 2009; Kim 2012a; Klamroth‐Marganska 2014; Lee 2013; Lee 2014a; Lee 2015a; Lee 2015b; Llorens 2015; Manlapaz 2010; Mirelman 2008; Nara 2015; Piron 2010; Sin 2013; Sucar 2009; Subramanian 2013; Thielbar 2014; Yang 2008; Ucar 2014; Yang 2011; You 2005; Zucconi 2012). Time since onset of stroke was not reported in the inclusion criteria for the remaining studies. The average recruitment time since stroke for each study is reported in the Characteristics of included studies table.
Several trials excluded people who were deemed medically unstable, though how this was determined was often unclear. Ten trials specified that people with a history of epilepsy or seizures would be excluded (Akinwuntan 2005; Fan 2014; Givon 2016; Kim 2012a; Mazer 2005; Saposnik 2010; Saposnik 2016; Sin 2013; Ucar 2014; Yin 2014). Most studies reported that people with significant cognitive impairment would be excluded; however, this criterion was often poorly defined. Several studies listed the presence of aphasia, apraxia, and visual impairment as exclusion criteria. One study excluded people with computer‐related phobias (Lam 2006). Studies involving upper limb training included participants with a range of function including those with severe functional impairment (Byl 2013; Coupar 2012; da Silva Cameirao 2011; Kiper 2011; Klamroth‐Marganska 2014; Levin 2012; Linder 2015; McNulty 2015; Reinkensmeyer 2012; Shin 2014; Sin 2013). All studies except Bower 2015 involving lower limb and gait training only involved participants that were able to walk independently.
Interventions
Intervention approaches
Five intervention approaches were used: activity retraining; upper limb training; lower limb, balance and gait training; global motor function training; and cognitive/perceptual training. Four trials involved activity retraining; Akinwuntan 2005 and Mazer 2005 examined automobile driving retraining; Jannink 2008 examined scooter driving retraining; and Lam 2006 tested retraining skills in using public transport. Thirty‐five trials involved upper limb training (Adie 2017; Byl 2013; Coupar 2012; Crosbie 2008; da Silva Cameirao 2011; Fan 2014; Galvao 2015; Housman 2009; Kim 2012a; Kiper 2011; Klamroth‐Marganska 2014; Kong 2014; Lee 2015b; Levin 2012; Linder 2015; Manlapaz 2010; Matsuo 2013; McNulty 2015; Prange 2015; Piron 2007; Piron 2009; Piron 2010; Reinkensmeyer 2012; Saposnik 2010; Saposnik 2016; Shin 2014; Shin 2015; Sin 2013; Standen 2011; Subramanian 2013; Sucar 2009; Thielbar 2014; Yavuzer 2008; Yin 2014; Zucconi 2012). Twenty‐three trials involved lower limb, balance and gait training (Barcala 2013; Bower 2015; Chow 2013; Han 2013; Hung 2014; Jaffe 2004; Jung 2012; Kim 2009; Ko 2015; Lee 2013; Lee 2014a; Lee 2015a; Llorens 2015; Mao 2015; Mirelman 2008; Morone 2014; Nara 2015; Rajaratnam 2013; Song 2015; Ucar 2014; Xiang 2014; Yang 2008; Yang 2011). Ten trials used virtual reality to improve global motor function (Cho 2012; da Silva Ribeiro 2015; Givon 2016; Jang 2005; Kim 2009; Kim 2011a; Kim 2011b; Kwon 2012; Low 2012; You 2005) and one trial used a visual‐perceptual retraining approach (Kang 2009).
Twenty‐two (31%) of the studies used commercially available gaming consoles: one study used the Playstation EyeToy (Yavuzer 2008), 15 studies used the Nintendo Wii (Barcala 2013; da Silva Ribeiro 2015; Fan 2014; Galvao 2015; Hung 2014; Kim 2012a; Kong 2014; Lee 2015a; Manlapaz 2010; Matsuo 2013; McNulty 2015; Morone 2014; Rajaratnam 2013; Saposnik 2010; Saposnik 2016) and four studies used the Microsoft Kinect (Chow 2013; Rajaratnam 2013; Sin 2013; Song 2015). Two studies used a mix of gaming consoles (Bower 2015; Givon 2016). Eight studies used GestureTek IREX, which is commercially available but more difficult to obtain and more expensive than off‐the‐shelf consoles (Cho 2012; Han 2013; Jang 2005; Kim 2009; Kim 2011a; Kim 2011b; Kwon 2012; You 2005). One study used the Armeo (Coupar 2012), one used the CAREN system (Subramanian 2013) and one used the Lokomat (Ucar 2014), which are also available for rehabilitation facilities to purchase. The remaining studies used customised virtual reality programs. The number of studies using commercially available gaming consoles increased from six in the previous version of this review to 22 in this update.
Setting
The majority of interventions were delivered in either an outpatient or inpatient setting, although five of the studies delivered the intervention in the participant's own home (Adie 2017; Linder 2015; McNulty 2015; Piron 2009; Standen 2011). Two of these studies used a telerehabilitation approach to deliver the intervention (Linder 2015; Piron 2009).
Amount of therapy provided
The total dose of therapy provided varied between studies. Fourteen studies provided less than five hours of total therapy (Barcala 2013; Bower 2015; Han 2013; Jannink 2008; Kim 2012a; Low 2012; Matsuo 2013; Morone 2014; Nara 2015; Shin 2014; Ucar 2014; Yang 2008; Yang 2011). Twenty‐five studies provided between six and 10 hours of therapy (Crosbie 2008; Fan 2014; Jaffe 2004; Jung 2012; Kang 2009; Kim 2009; Kim 2011a; Kim 2011b; Ko 2015; Kwon 2012; Lam 2006; Lee 2013; Lee 2014a; Lee 2015a; Lee 2015b; Levin 2012; Manlapaz 2010; Mao 2015; Prange 2015; Saposnik 2010; Saposnik 2016; Sin 2013; Subramanian 2013; Xiang 2014; Yavuzer 2008). A further 26 studies provided between 11 and 20 hours of therapy (Akinwuntan 2005; Byl 2013; Cho 2012; Chow 2013; da Silva Cameirao 2011; da Silva Ribeiro 2015; Galvao 2015; Hung 2014; Jang 2005; Kiper 2011; Kong 2014; Klamroth‐Marganska 2014; Llorens 2015; Mazer 2005; McNulty 2015; Mirelman 2008; Piron 2009; Piron 2010; Rajaratnam 2013; Shin 2015; Song 2015; Sucar 2009; Thielbar 2014; Yin 2014; You 2005; Zucconi 2012) and seven studies provided more than 21 hours of therapy (Adie 2017; Givon 2016; Housman 2009; Linder 2015; Piron 2007; Reinkensmeyer 2012; Standen 2011; ). The remaining study, Coupar 2012, had three arms; one of the arms received lower intensity therapy (four hours total) and another received higher intensity therapy (10 hours total).
Comparison interventions
Most of the trials compared virtual reality intervention with a comparable alternative intervention. The alternative intervention was often described as therapy using a conventional approach. One study allocated participants to either actively participating in the virtual reality intervention or watching others participate in the virtual reality intervention (Yavuzer 2008). Other studies of note compared virtual reality with recreational therapy (Saposnik 2016) and constraint‐induced movement therapy (McNulty 2015). Eighteen of the studies examined the effect of virtual reality when used alone (the control group received no intervention) or as an adjunct (the control group received usual care or rehabilitation) and thus there was a discrepancy in the dose of therapy received between the intervention and control groups (Barcala 2013; Bower 2015; Cho 2012; Jang 2005; Kim 2011a; Kim 2012a; Kong 2014; Kwon 2012; Lee 2013; Lee 2014a; Low 2012; Matsuo 2013; Mazer 2005; Shin 2014; Sin 2013; Standen 2011; Ucar 2014; You 2005). There were seven three‐armed trials with two comparison interventions (Byl 2013; Coupar 2012; da Silva Cameirao 2011; Fan 2014; Kong 2014; Lam 2006; Zucconi 2012).
Outcomes
As a result of the diverse intervention approaches, a wide range of outcome measures were used. Outcome measures for each of the predefined outcome categories are shown in Table 1. Due to the heterogeneity of outcome measures, we were unable to include all of them in the analyses. With regard to timing of outcome measurements, one study waited until five weeks after the end of the intervention to collect outcome measures (Jannink 2008). All remaining studies measured outcomes soon after the intervention was completed. For studies including further follow‐up, the time interval until follow‐up was generally at or less than three months (Coupar 2012; Crosbie 2008; da Silva Cameirao 2011; Fan 2014; Givon 2016; Hung 2014; Jaffe 2004; Kong 2014; Levin 2012; Matsuo 2013; Mirelman 2008; Morone 2014; Piron 2009; Reinkensmeyer 2012; Saposnik 2010; Saposnik 2016; Subramanian 2013; Thielbar 2014; Yang 2008; Yin 2014). Only five studies involved longer‐term follow‐up: four at six months (Adie 2017; Housman 2009; Klamroth‐Marganska 2014; McNulty 2015) and one at both six months and five years (Akinwuntan 2005).
| Author and year | Upper limb function | Hand function | Lower limb activity | Balance and postural control | Global motor function | Cognitive function | Activity limitation | Participation restriction and QOL |
| Action Research Arm Test, Motor Activity Log Arm Function Test | Modified Rankin Scale | Stroke Impact Scale, EQ5D, Canadian Occupational Performance Measure | ||||||
| — | — | — | — | — | Useful Field of View test | On‐road driving test score, decision of fitness to drive | — | |
| — | — | Timed Up and Go | Berg Balance Scale, centre of pressure data, body symmetry data | — | — | Functional Independence Measure | — | |
| 6‐minute walk test, step test | Functional reach | Motor Assessment Scale | Functional Independence Measure (transfers, mobility, stairs) | |||||
| Fugl Meyer UE Scale, Motor Proficiency Speed (abbreviated Wolf Motor Function test + Digital reaction time test) | Motor skill performance (Box and Block and tapper test) | — | — | — | — | Functional Independence (CAFE40) | ||
| Wolf Motor Function Test | — | — | — | — | Motor Free Visual Perception Test | — | — | |
| 10‐m walk test | Berg Balance Scale | Modified Barthel Index | ||||||
| Action Research Arm Test, Upper Limb Motricity Index | — | — | — | — | — | — | — | |
| Fugl Meyer | Dynamic Gait Index | SF36 | ||||||
| Fugl Meyer UE, Chedoke Arm and Hand Inventory | — | — | — | — | — | Barthel Index | — | |
| Jebsen Taylor Hand Function Test | Stroke Impact Scale | |||||||
| Fugl Meyer, Motor Activity Log | ||||||||
| Action Research Arm Test | Grip strength | 10‐m walk test | ||||||
| Berg Balance Scale | Modified Barthel Index | |||||||
| Fugl Meyer UE Scale, Rancho Functional Test, Motor Activity Log (amount of use and quality of movement) | Grip strength (kg) | — | — | — | — | — | ‐ | |
| Timed Up and Go Test | Forward Reach Test | Falls Efficacy Scale International | ||||||
| — | — | 6‐m walk test, Obstacle Test, 6‐minute walk test | Customised balance test designed by the researchers | — | — | — | — | |
| Fugl Meyer UE Scale, Manual Function Test, Motor Activity Log (amount of use and quality of movement) | Box and Block Test | — | — | — | — | — | ||
| — | — | — | — | — | — | — | — | |
| — | — | Timed Up and Go | — | — | — | — | — | |
| — | — | — | — | — | Mini Mental State Examination | Modified Barthel Index | — | |
| — | — | 10‐m walk test, GAIT‐RITE gait analysis system | Berg Balance Scale, balance performance monitor | Modified Motor Assessment Scale | — | — | — | |
| Motricity Index | — | Motricity Index | — | — | Computerised neuropsychological test and Tower of London test | Korean Modified Barthel Index | — | |
| — | — | — | — | — | Measures of spatial neglect (star cancellation, line bisection test, Catherine Bergego Scale) | Korean Modified Barthel Index | — | |
| — | — | — | Postural assessment scale | Modified Motor Assessment Scale | — | Functional Independence Measure | — | |
| Fugl Meyer UE | — | — | — | — | — | Functional Independence Measure | — | |
| Fugl Meyer UE, Wolf Motor Function Test, Motor Activity Log (quality of movement) | ‐ | ‐ | ‐ | ‐ | ‐ | ‐ | Stroke Impact Scale, Goal attainment scale | |
| Timed Up and Go Test | Berg Balance Scale | |||||||
| Fugl Meyer, Action Research Arm Test | Functional Independence Measure | Stroke Impact Scale | ||||||
| Fugl Meyer UE, Manual Function Test | — | — | — | — | — | Korean Modified Barthel Index | — | |
| — | — | — | — | — | — | — | — | |
| Functional Reach Test | ||||||||
| Timed Up and Go Test | Berg Balance Scale | |||||||
| Functional Reach Test | ||||||||
| Fugl Meyer UE Scale, Reach Performance Scale for Stroke, Box and Blocks Test, Wolf Motor Function Test, Motor Activity Log | ||||||||
| Stroke Impact Scale | ||||||||
| Tinetti Performance Oriented Mobility Assessment, 10‐m walk test | Berg Balance Scale, Brunel Balance Assessment | |||||||
| Fugl Meyer UE Scale, Action Research Arm Test | Gait speed | Berg Balance Scale | Functional Independence Measure | |||||
| Fugl Meyer UE Scale | Motor Assessment Scale | |||||||
| Gait analysis (gaitlab assessment) | ||||||||
| Fugl Meyer UE, Wolf Motor Function Test, Box and Block Test, Motor Activity Log | ||||||||
| — | — | — | — | — | — | DriveAble Testing Ltd Driver Evaluation | — | |
| Wolf Motor Function Test timed tasks and strength subtests, Motor Activity Log QOM scale, Fugl Meyer, Box and Block Test | ||||||||
| — | — | Gait speed over 7‐metre walkway, 6‐minute walk test, Patient Activity Monitor | — | — | — | — | — | |
| 10‐m walk test | Berg Balance Scale | Barthel Index | Functional Ambulation Category | |||||
| Static balance ability | ||||||||
| Fugl Meyer UE Scale | — | — | — | — | — | Functional Independence Measure | — | |
| Fugl Meyer UE Scale, Abilhand Scale | — | — | — | — | — | — | ‐ | |
| Fugl Meyer UE Scale | — | — | — | — | — | Functional Independence Measure | — | |
| Fugl Meyer UE, Stroke Upper Limb Capacity Sclae | ||||||||
| — | — | Timed Up and Go | Berg Balance Scale, functional reach, centre of pressure | — | — | — | — | |
| Fugl Meyer UE, Ranchos Functional Test for UE, Motor Activity Log, Box and Blocks Test | Grip strength | |||||||
| Abbreviated Wolf Motor Function Test | Box and Block Test, grip strength (kg) | — | — | — | — | — | Stroke Impact Scale (hand function, composite function, perception of recovery) | |
| Abbreviated Wolf Motor Function Test, Box and Block Test | Grip strength | Functional Independence Measure, Barthel Index, Modified Rankin Scale | Stroke Impact Scale | |||||
| Fugl Meyer UE | — | — | — | — | — | Modified Barthel Index | — | |
| Fugl Meyer UE | SF36 | |||||||
| Fugl Meyer UE, Box and Block Test | — | — | — | — | — | — | ||
| Timed Up and Go Test, 10‐minute walk test | Balance (Biofeedback system) | |||||||
| Wolf Motor Function Test, Motor Activity Log, Nine Hole Peg Test | — | — | — | — | Nottingham Extended Activities of Daily Living Scale | |||
| Fugl Meyer UE, Wolf Motor Function test, Reaching performance scale for stroke, Motor Activity Log | — | — | — | — | — | — | ||
| Fugl Meyer UE Scale, Upper Limb Motricity Index | — | — | — | — | — | — | — | |
| Action Research Arm Test, Jebsen Taylor Hand Function Test, Fugl Meyer UE | Grip strength | |||||||
| Timed walking speed test, Timed Up and Go | Mini Mental State Examination | Functional Ambulation Category | ||||||
| 10‐m walking speed, Fugl Meyer (LE) | Brunel Balance Assessment | |||||||
| — | — | Walking speed, Community Walk Test | — | — | — | — | Walking Ability Questionnaire, Activities Specific Balance Confidence Scale | |
| — | — | Gait analysis data | Balance analysis data | — | — | — | — | |
| Brunnstrom Upper Extremity Stages | Brunnstrom Hand Stages | — | — | — | — | Functional Independence Measure self‐care section | — | |
| Fugl Meyer, Action Research Arm Test, Motor Activity Log | Functional Independence Measure | |||||||
| — | — | Functional ambulation category | — | Modified Motor Assessment Scale | — | — | — | |
| Fugl Meyer UE, Reaching performance scale | — | — | — | — | — | Functional Independence Measure | — |
fMRI: functional magnetic resonance imaging
QOL: quality of life
UE: upper extremity
Twenty‐four studies reported on the presence or absence of adverse events (Adie 2017; Bower 2015; Byl 2013; Coupar 2012; Crosbie 2008; Givon 2016; Housman 2009; Hung 2014; Jaffe 2004; Kiper 2011; Klamroth‐Marganska 2014; Levin 2012; Llorens 2015; McNulty 2015; Piron 2007; Piron 2010; Reinkensmeyer 2012; Saposnik 2010; Saposnik 2016; Shin 2015; Subramanian 2013; Sucar 2009; Yavuzer 2008; Yin 2014).
Excluded studies
We have provided details of 34 studies that we excluded. We listed studies as excluded if they were obtained in full text and required lengthy discussion between authors to confirm exclusion (Characteristics of excluded studies). Common reasons for exclusion were: studies compared different forms of virtual reality or the interaction between the virtual environment and the user was not genuine (for example, the person walked on a treadmill while viewing a virtual environment but there was no interaction between the user and environment and changes in speed of walking in the user did not impact on movement in the virtual world).
Risk of bias in included studies
Refer to Figure 2 and Figure 3.

Methodological quality summary: review authors' judgements about each methodological quality item for each included study
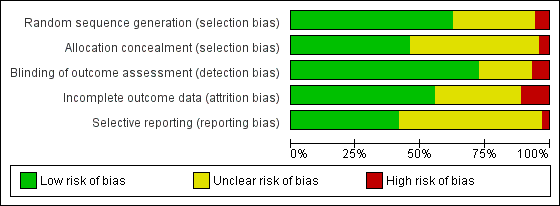
Methodological quality graph: review authors' judgements about each methodological quality item presented as percentages across all included studies
Not all included studies followed the CONSORT guidelines (Schulz 2010), in which case we contacted the corresponding authors for clarification of study methodology. If we did not obtain a response from a corresponding author we recorded the 'Risk of bias' criterion as 'unclear'.
Allocation
We assessed random sequence generation as being adequate in 63% of trials. Allocation concealment was reported as adequate in 46% of trials.
Blinding
Seventy‐two per cent of studies reported blinding of the outcome assessor. No trials were able to blind participants or personnel.
Incomplete outcome data
We deemed 56% of studies to be at low risk of bias in relation to incomplete outcome data. Dropouts from studies appeared generally balanced across groups.
Selective reporting
We judged that 43% of studies were free of selective reporting by comparing published results with trials register entries or protocol papers or through correspondence with study authors. It was unclear whether selective reporting was present in most other studies.
Effects of interventions
See: Summary of findings for the main comparison Virtual reality compared to conventional therapy for stroke rehabilitation; Summary of findings 2 Virtual reality plus usual care compared with usual care alone
Primary outcome: upper limb function and activity
We present results for upper limb function and activity.
Virtual reality versus conventional therapy: effect on upper limb function post intervention
Results are presented for upper limb function and activity and hand function. All outcomes were taken within days of the end of the intervention program.
Comparison 1.1: Upper limb function and activity
Twenty‐two studies presented outcomes for upper limb function and activity in a form suitable for inclusion in the meta‐analysis (1038 participants) (Adie 2017; Byl 2013; Crosbie 2008; da Silva Cameirao 2011; da Silva Ribeiro 2015; Galvao 2015; Givon 2016; Housman 2009; Kiper 2011; Kong 2014; Levin 2012; Piron 2007; Piron 2009; Piron 2010; Prange 2015; Reinkensmeyer 2012; Saposnik 2010; Saposnik 2016; Subramanian 2013; Sucar 2009; Thielbar 2014; Zucconi 2012). The impact of virtual reality on upper limb function was not significant: standardised mean difference (SMD) 0.07, 95% confidence interval (CI) ‐0.05 to 0.20, low‐quality evidence (Analysis 1.1). Statistical heterogeneity was moderate (I2 = 43%).
We were unable to obtain data in a suitable format for pooling for three studies (Fan 2014; McNulty 2015; Shin 2015). Fan 2014 reported that there were no significant differences between groups on outcomes on the Jebsen Taylor Hand Function Test; McNulty 2015 reported no significant differences between virtual reality and constraint‐induced movement therapy on the Wolf Motor Function Test; and Shin 2015 reported no significant differences between groups on the Fugl Meyer Assessment.
Sensitivity analysis for comparison 1.1
Excluding those studies judged to be unclear or at high risk of bias in one or more categories left 10 studies (Adie 2017; Byl 2013; Crosbie 2008; Kiper 2011; Kong 2014; Piron 2009; Piron 2010; Saposnik 2016; Subramanian 2013; Zucconi 2012). The result was similar (SMD ‐0.02, 95% CI ‐0.17 to 0.13); however, statistical heterogeneity was lower (I2 = 7%). We conducted a sensitivity analysis involving use of a random‐effects model. The difference was minor: SMD 0.17 (95% CI ‐0.01 to 0.35).
Comparison 1.2: Upper limb function (Fugl Meyer Upper Extremity Scale)
Sixteen of the trials (with 599 participants) used the Fugl Meyer Upper Extremity (UE) Scale as an outcome measure (Byl 2013; da Silva Cameirao 2011; da Silva Ribeiro 2015; Galvao 2015; Housman 2009; Kiper 2011; Kong 2014; Levin 2012; Piron 2007; Piron 2009; Piron 2010; Prange 2015; Reinkensmeyer 2012; Subramanian 2013; Sucar 2009; Zucconi 2012). The impact of virtual reality as measured by the Fugl Meyer UE Scale showed a small significant effect: mean difference (MD) 2.85, 95% CI 1.06 to 4.65 (Analysis 1.2).
Sensitivity analysis for comparison 1.2
When including only the seven trials deemed to be at low risk of bias in all categories in the analysis, the effect of virtual reality compared to conventional therapy on the Fugl Meyer was not significant (MD 2.01, 95% CI ‐0.46 to 4.47) (Byl 2013; Kiper 2011; Kong 2014; Piron 2009; Piron 2010; Subramanian 2013; Zucconi 2012).
Comparison 1.3: Hand function
Six trials measured the effect of virtual reality versus alternative therapy on grip strength (266 participants) (Givon 2016; Housman 2009; Reinkensmeyer 2012; Saposnik 2010; Saposnik 2016; Thielbar 2014). The impact of virtual reality compared to conventional therapy was not significant: SMD ‐0.02, 95% CI ‐0.27 to 0.22 (Analysis 1.3). Statistical heterogeneity was moderate (I2 = 44%).
Comparison 1.4: Amount of use of upper limb (self‐reported)
We pooled five studies (with 161 participants) to examine the effect on amount of use (self‐reported component of the Motor Activity Log) (Galvao 2015; Housman 2009; Levin 2012; Reinkensmeyer 2012; Subramanian 2013). There was no statistically significant difference between the groups receiving virtual reality and conventional therapy (SMD ‐0.11, 95% CI ‐0.42 to 0.21). Data from a further two studies could not be pooled; these studies both reported that there were greater improvements in the intervention group than the control group on the 'amount of use' scale (Jang 2005; Standen 2011). One study, which could not be included in the analysis due to unavailability of data in a suitable format for pooling, found no significant differences in outcome between virtual reality and constraint‐induced movement therapy (McNulty 2015).
Comparison 1.5: Upper limb function follow‐up
We pooled nine studies that reported follow‐up assessments of arm function taken between two weeks and three months after the end of intervention (Crosbie 2008; da Silva Cameirao 2011; Givon 2016; Kong 2014; Levin 2012; Piron 2009; Reinkensmeyer 2012; Saposnik 2016; Thielbar 2014). The difference between performance of the virtual reality and conventional therapy groups at this later follow‐up point was not significant (SMD 0.11, 95% CI ‐0.10 to 0.32). A further three studies measured outcomes six months after the end of intervention. Housman 2009 reported that participants in the virtual reality group had improved significantly more on the Fugl Meyer UE Scale at the six‐month follow‐up assessment than participants in the alternative treatment group (P = 0.045). Participants in the virtual reality group improved by 3.6 points (standard deviation (SD) 3.9) whereas participants in the alternative treatment group improved by 1.5 points (SD 2.7). However, the trial found no other significant differences between groups at six months on the other outcome measures used (Rancho Functional Test, grip strength and Motor Activity Log). In contrast, Adie 2017 reported no significant differences between groups on the Action Research Arm Test or Motor Activity Log at six‐month follow‐up and McNulty 2015 reported that at six months upper limb function was not significantly different between groups that had participated in Wii‐based movement therapy and those participating in modified constraint‐induced movement therapy.
Upper limb function: subgroup analyses
Comparison 2.1: Dose of treatment
We compared trials providing under 15 hours of intervention with trials providing 15 hours or more of intervention. Neither group had a statistically significant difference between virtual reality and alternative intervention. While trials providing less than 15 hours of intervention had a non‐significant effect (SMD ‐0.01, 95% CI ‐0.20 to 0.18), trials providing more than 15 hours of intervention showed a trend (although not statistically significant) in favour of the virtual reality intervention (SMD 0.13, 95% CI ‐0.03 to 0.29). The difference between groups was not statistically significant (Chi2 = 1.26, df = 1, P value = 0.26) (Analysis 2.1).
Comparison 2.2: Time since onset of stroke
We classified trials based on whether their participants were recruited within six months of stroke or more than six months post stroke. The group recruited within six months of stroke did not demonstrate a significant effect (SMD ‐0.06, 95% CI ‐0.23 to 0.11) nor did the group recruited after six months (SMD 0.19, 95% CI ‐0.02 to 0.39) although there was a trend towards the virtual reality intervention. The difference between groups bordered on significant (Chi2 = 3.36, df = 1, P value = 0.07) (Analysis 2.2).
Comparison 2.3: Specialised virtual reality system or commercial gaming console
Studies utilising virtual reality programs specifically designed for rehabilitation settings demonstrated statistically significant benefits over alternative intervention (SMD 0.17, 95% CI 0.00 to 0.35). In contrast those involving off‐the‐shelf gaming programs were not found to be significant (SMD ‐0.02, 95% CI ‐0.20 to 0.15) (Analysis 2.3). However, the test for subgroup differences did not indicate significance (P value = 0.12).
Comparison 2.4: Severity of upper limb impairment
We compared outcomes for people with mild to moderate upper limb impairment and people with moderate to severe impairment. The group with mild to moderate impairment showed a non‐significant effect (SMD 0.10, 95% CI ‐0.06 to 0.25) as did the group with moderate to severe impairment (SMD 0.01, 95% CI ‐0.22 to 0.23) (Analysis 2.4).
We did not undertake other planned subgroup analyses due to similarities in these studies in regard to the age of participants and frequency of intervention sessions.
Additional virtual reality intervention: effect on upper limb function post intervention
We examined the effects of virtual reality intervention when it was compared with no intervention and used to augment standard care (i.e. people in the virtual reality intervention group received additional therapy time relative to the control group).
Comparison 3.1: Upper limb function
Ten studies with a total of 210 participants presented outcomes for upper limb function (Cho 2012; Coupar 2012; Jang 2005; Kim 2011a; Kwon 2012; Manlapaz 2010; Shin 2014; Sin 2013; Standen 2011; Yavuzer 2008). There was a moderate significant effect that demonstrated that virtual reality intervention was more effective than no intervention: SMD 0.49, 95% CI 0.21 to 0.77, low‐quality evidence (Analysis 3.1). There was no statistical heterogeneity.
Two studies could not be included in the analysis due to our inability to obtain data in a suitable format for pooling (Low 2012; Yin 2014). Both studies reported that there were no significant differences between groups on Fugl Meyer score.
Sensitivity analysis
We excluded trials that we deemed to be at high risk of bias in one or more categories (Cho 2012; Kim 2011a; Standen 2011). The result was a slightly higher SMD than found in the original analysis (SMD 0.55, 95% CI 0.20 to 0.91).
Additional virtual reality intervention: effect on upper limb function post intervention: subgroup analyses
Comparison 4.1: Dose of treatment
We compared trials providing less than 15 hours of intervention with trials providing 15 hours or more of intervention. Pooling of seven trials with less than 15 hours of intervention had a significant effect on upper limb function (SMD 0.47, 95% CI 0.14 to 0.80) as did pooling of three trials providing more than 15 hours of intervention (SMD 0.54, 95% CI 0.00 to 1.07). The difference between groups was not significant (Chi2= 0.04, df = 1, P value = 0.83) (Analysis 4.1).
Comparison 4.2: Time since onset of stroke
We compared analysis of five trials recruiting participants within six months of stroke with four trials recruiting participants more than six months post stroke. Analysis of trials recruiting within six months did not reveal a significant effect (SMD 0.28, 95% CI ‐0.12 to 0.67) whereas those recruiting people in the chronic phase of stroke experienced statistically significant benefits (SMD 0.65, 95% CI 0.19 to 1.11). The difference between groups was not significant (P value = 0.23) (Analysis 4.2).
Comparison 4.3: Specialised virtual reality system or gaming console
We compared three trials evaluating the efficacy of gaming console use with seven trials evaluating the efficacy of virtual reality systems specifically designed for rehabilitation. Both types of virtual reality programs were found to be effective (when the virtual reality was used as an adjunct to treatment) and the difference between groups was not significant (Chi2 = 0.75, df = 1, P value = 0.39) (Analysis 4.3).
Secondary outcomes
Virtual reality versus conventional therapy: effect on gait and balance: post intervention
Results are presented for gait speed. All outcomes are taken within days of the end of the intervention program and measured in metres per second. We were unable to include seven relevant studies; one of these studies, Barcala 2013, compared different doses of therapy, and six studies did not report data in a format that allowed pooling nor did the corresponding authors provide the data upon request (Hung 2014; Kim 2009; Morone 2014; Rajaratnam 2013; Ucar 2014; Yang 2011).
Comparison 5.1: Gait speed
Six studies provided data on gait speed (139 participants) (Givon 2016; Jaffe 2004; Llorens 2015; Mirelman 2008; Song 2015; Yang 2008). The effect of virtual reality on gait speed was not significant: MD 0.09, 95% CI ‐0.04 to 0.22, low‐quality evidence (Analysis 5.1). Low statistical heterogeneity was indicated (I2 = 10%). Jaffe 2004 examined the effect of virtual reality on comfortable walking speed and fast walking speed. We included the data relating to comfortable walking speed in the meta‐analysis. The effect on fast walking speed was found to be significantly greater in the virtual reality intervention group than the comparative group. One study, which could not be included in the analysis due to inability to obtain data in a suitable format for pooling, found no significant differences between groups on walking speed (Morone 2014). A second study, which could also not be pooled, reported that use of the Lokomat was significantly better than conventional therapy on walking speed (P = 0.007).
Comparison 5.2: Timed Up and Go test
We pooled three studies (89 participants, Hung 2014; Jung 2012; Song 2015) reporting data for the Timed Up and Go (TUG) test. There was no significant difference between those in the virtual reality and conventional therapy groups (MD ‐1.76, 95% CI ‐4.67 to 1.16) and statistical heterogeneity was high (I2 = 59%) (Analysis 5.2). One study could not be included in the analysis as standard deviations were not available (Ucar 2014). The study authors reported that those receiving therapy on the Lokomat had significantly better performance on the TUG test than those receiving conventional therapy (P = 0.035).
Comparison 5.3: Balance
Three studies with 72 participants examined the effect of virtual reality intervention compared to conventional therapy on balance (Hung 2014; Lee 2014a; Llorens 2015). The effect was not statistically significant (SMD 0.39, 95% CI ‐0.09 to 0.86) (Analysis 5.3); heterogeneity was low. We could not include two studies in the analyses because we were unable to obtain the data required: Han 2013 found no significant differences between groups, whereas Morone 2014 reported that Wii Fit training was more effective than conventional balance therapy in improving performance on the Berg Balance Scale.
Gait and balance activity: subgroup analyses
Subgroup analyses comparing those receiving less than 10 hours' intervention with those receiving more than 10 hours' intervention did not suggest that this was an influential factor on gait speed outcome (Analysis 6.1).
We did not undertake other planned subgroup analyses due to homogeneity with regard to the age of participants, severity of stroke, time since onset of stroke, frequency of intervention sessions, and type of virtual reality program.
Gait and balance activity: follow‐up
Only three trials measured the longer‐term effects (at three months) of virtual reality on gait speed. Hung 2014 and Mirelman 2008 both reported that initial benefits in the intervention group (relative to the control group) were still present at follow‐up, while Givon 2016 reported that initial differences between groups were not maintained.
Additional virtual reality intervention: effect on gait and balance post intervention
Comparison 7.1: Gait speed
Pooling of three studies with 57 participants utilising virtual reality intervention as an adjunct to usual care did not identify statistically significant benefits (SMD 0.08, 95% CI ‐0.05 to 0.21, low‐quality evidence) (Bower 2015; Lee 2014a; Xiang 2014). There was no statistical heterogeneity (Analysis 7.1). Two studies could not be included in the analysis due to our inability to obtain data in a suitable format for pooling (Chow 2013; Low 2012). Both papers (presented as conference abstracts only) reported no significant differences between groups in gait speed following intervention.
Comparison 7.2: Timed Up and Go Test
Pooling of three studies with 93 participants identified a statistically significant difference between people after receiving additional intervention using virtual reality programs on the Timed Up and Go Test in contrast to those receiving usual care (MD ‐4.76, 95% CI ‐8.91 to ‐0.61) although statistical heterogeneity was present (I2 = 50%) (Analysis 7.2) (Barcala 2013; Ko 2015; Lee 2014a).
Comparison 7.3: Balance
We pooled seven studies (with 173 participants) to examine the effect of providing virtual reality as an adjunct to usual care on balance (Barcala 2013; Bower 2015; Kim 2009; Ko 2015; Lee 2013; Lee 2014a; Xiang 2014). The effect was significant and the effect size was moderate (SMD 0.59, 95% CI 0.28 to 0.90, I2 = 32%, Analysis 7.3). Two studies could not be included in the analysis due to our inability to obtain data in a suitable format for pooling (Chow 2013; Low 2012). Both papers (presented as conference abstracts only) reported no differences between groups in outcome.
Global motor function
Four studies reported outcomes for global motor function (using the Modified Motor Assessment scale). However, Kim 2009 compared virtual reality with an alternative intervention. We pooled three studies (with 43 participants) that examined the effect of virtual reality on global motor function when used in addition to usual care, thus increasing the therapy dose received by the intervention group (Bower 2015; Kim 2012a; You 2005). The effect on global motor function was not significant (SMD 0.01, 95% CI ‐0.60 to 0.61, low‐quality evidence) (Analysis 8.1).
Cognitive function
Insufficient trials included assessments of cognition to allow us to perform analysis for this outcome.
Activity limitation
Two studies reported outcomes of a driving evaluation. However, we were unable to pool results as Akinwuntan 2005 compared virtual reality intervention with an alternative intervention, and Mazer 2005 compared virtual reality intervention with no alternative intervention. Akinwuntan 2005 reported the results from the follow‐up assessments, which were completed at six months and five years post intervention. Six months post intervention they found that participants in the virtual reality intervention group had improved significantly more in their on‐road performance (measured by the Test Ride for Investigating Practical fitness to drive checklist) than participants in the alternative intervention group (P value = 0.005). Furthermore, 73% of the virtual reality group compared with 42% of the group that participated in driving‐related cognitive tasks were classified by driving assessors as 'fit to drive' at six months. At five years, there was no significant difference between the groups in regards to 'fitness to drive' or resumption of driving.
Virtual reality versus conventional therapy: effect on activity limitation
Comparison 9.1: Activities of daily living (ADL) outcome
We pooled 10 studies with 466 participants that examined the difference between virtual reality intervention and alternative intervention on ADL (Byl 2013; da Silva Cameirao 2011; Kang 2009; Kim 2011b; Kiper 2011; Kong 2014; Piron 2007; Piron 2010; Saposnik 2016; Zucconi 2012). There was a small, significant effect (SMD 0.25, 95% CI 0.06 to 0.43, moderate‐quality evidence) and presence of statistical heterogeneity (I2 = 22%) (Analysis 9.1). Two studies could not be included in the analysis due to our inability to obtain data in a suitable format for pooling (Han 2013; Morone 2014). Morone 2014 presented a graph indicating that those in the Nintendo Wii group had significantly better scores on the Barthel Index post intervention than those in the conventional therapy group, whereas Han 2013 reported no significant differences between groups.
Sensitivity analysis
We explored the effects of methodological quality on the overall effect by excluding studies deemed to be at unclear or high risk of bias in one or more categories from the analysis (da Silva Cameirao 2011; Kang 2009; Kim 2011b; Piron 2007). The results were similar but the effect size was smaller and no longer statistically significant (SMD 0.20, 95% CI ‐0.01 to 0.40).
Additional virtual reality intervention: effect on activity limitation
Comparison 10.1: ADL outcome
Pooling of eight studies with 153 participants examined the effect of providing additional intervention using virtual reality on ADL outcome (Barcala 2013; Coupar 2012; Kim 2011a; Kim 2012a; Kwon 2012; Shin 2014; Standen 2011; Yavuzer 2008). The effect was statistically significant with a small to moderate effect size (SMD 0.44, 95% CI 0.11 to 0.76). There was no heterogeneity (Analysis 10.1). We conducted a sensitivity analysis based on risk of bias and only including the two studies deemed at low risk of bias in all categories. The result was still positive; however the confidence intervals were wide (SMD 0.92, 95% CI 0.04 to 1.81).
We could not include three studies in the analysis due to our inability to obtain data in a suitable format for pooling (Chow 2013; Low 2012; Yin 2014); none of these studies reported a significant difference between groups on ADL outcome.
Participation restriction and quality of life
Heterogeneity between trials and outcome measures used meant that we did not perform any analysis for this outcome.
Six studies compared a virtual reality intervention with an alternative intervention and measured changes using either components or the full version of the Stroke Impact Scale (Adie 2017; Fan 2014; Kong 2014; Linder 2015; Saposnik 2010; Saposnik 2016). None of the six studies found a significant difference between the intervention and control group in score on the Stroke Impact Scale.
Three studies compared a virtual reality intervention with an alternative intervention and used a health‐related, quality‐of‐life measure. Adie 2017 reported that there was no difference between groups identified via the EQ5D tool. The other two studies reported differences between groups in some domains of the SF36; participants receiving conventional therapy in the study conducted by da Silva Ribeiro 2015 reported significantly higher scores on the physical‐functioning domain, whereas Shin 2015 reported that those in the virtual reality group reported significantly better scores in terms of role limitations due to physical problems.
Adverse events
Twenty‐three studies monitored and reported on adverse events. Nineteen studies reported no significant adverse events linked to study participation (Adie 2017; Byl 2013; Coupar 2012; Givon 2016; Housman 2009; Jaffe 2004; Kiper 2011; Levin 2012; Llorens 2015; McNulty 2015; Piron 2007; Piron 2010; Reinkensmeyer 2012; Saposnik 2010; Saposnik 2016; Shin 2015; Subramanian 2013; Yavuzer 2008; Yin 2014). Crosbie 2008 found that two people in the virtual reality group reported side effects of transient dizziness and headache, and Sucar 2009 found that three participants in the virtual reality group reported pain caused by the treatment in contrast to two participants in the conventional therapy group. Bower 2015 reported that several of the participants receiving the intervention had symptoms of pain and one participant reported dizziness; however, these were not thought to be related to the intervention, and Hung 2014 reported that three of the intervention group (out of 15) reported an increase in hypertonicity during treatment.
Discussion
Summary of main results
This review included 72 trials with 2470 participants. The main results are presented in summary of findings Table for the main comparison and summary of findings Table 2.
Upper limb function and activity
Twenty‐two studies with 1033 participants compared a virtual reality intervention with conventional therapy and measured effects on upper limb function. These trials used a variety of different commercially available games or specialised virtual reality programs, and all interventions were delivered in a hospital or clinic setting, with the exception of one of these trials that used a home‐based telerehabilitation approach. More of the trials (13 studies) recruited participants more than six months after stroke, with remaining trials recruiting participants within the first six months of stroke.
Six trials compared a virtual reality intervention with conventional therapy and measured grip strength. Pooling of results indicated that there was no significant difference in the efficacy of the therapy approaches on upper limb function or grip strength.
We also examined the effect of a virtual reality intervention on upper limb function when the intervention was provided to augment the usual dose of therapy. Thus, the intervention group received more therapy time than the control group. Ten studies with 210 participants found a moderately significant effect in favour of the virtual reality intervention (low‐quality evidence). Eight of these studies involved the use of commercially available virtual reality programs and one of the studies provided the intervention in the home setting.
The addition of a virtual reality intervention to usual care resulted in improvements in upper limb function. However, the virtual reality intervention was not a more effective approach than conventional interventions. This finding is in contrast with the previous versions of this review where meta‐analysis revealed a small significant benefit associated with virtual reality intervention when compared with conventional therapy approaches (Laver 2011; Laver 2015). This review included more studies in which virtual reality was used as a way to increase the amount of therapy provided and thus provides more information about the effectiveness of virtual reality as a therapy to augment usual care.
Results of this review did not indicate the most effective time to utilise the intervention in recovery (i.e. whether it was more effective to use virtual reality in the earlier recovery phase or the chronic (more than six months) phase post stroke. It appeared that trials providing more than 15 hours of intervention resulted in greater benefits than those providing a smaller dose of virtual reality therapy. Comparison of the type of program (specialised system versus commercial gaming system) revealed no significant differences in effect although there was a trend suggesting that specialised systems may be more effective.
Secondary outcomes
Six trials with 139 participants measured gait speed and could be included in the analysis comparing virtual reality with alternative intervention. All six studies included people who were more than one year post stroke. There was insufficient evidence to draw conclusions on whether a virtual reality approach was more effective in improving gait speed than conventional therapy (low‐quality evidence). We were also unable to reach conclusions about the effects of virtual reality (compared to conventional therapy) on a more functional measure of mobility; performance on the Timed Up and Go Test. Four trials examined effect of virtual reality on global motor function (with three of these studies using the same virtual reality program). The effect on global motor function was not significant. There was a small effect on ADL when virtual reality was used instead of conventional therapy and a moderate effect on ADL when virtual reality was used to increase the dose of therapy and provided in addition to usual care (moderate‐quality evidence). We were unable to pool results for cognitive function, participation restriction, and quality of life studies. There were few adverse events reported across studies and those reported (transient dizziness, headache, pain) were relatively mild.
Heterogeneity of included studies
There was considerable clinical heterogeneity between the studies included in the review, particularly in regard to the variety of intervention approaches used to address a variety of different patient needs. Some of these interventions were very specific (for example, retraining participants to use the local public transport system) and therefore studies were not comparable in many circumstances. In addition, a wide variety of outcome measures were used; this also limited our ability to pool results. The use of meta‐analysis in cases where such heterogeneity is present can be considered controversial (Deeks 2011); however, we felt that meta‐analysis in this review was justified and we were careful only to pool studies that were relatively comparable in terms of participants, interventions, comparison, and outcome measures. Meta‐analysis of the individual studies enabled us to explore the overall treatment effect of the intervention when compared with an alternative, more traditional intervention or no intervention. Our sensitivity analyses suggested that there were no notable differences between using random‐effects and fixed‐effect models.
Overall completeness and applicability of evidence
Although we included 72 studies, the sample sizes of the included studies were generally small. There are now studies recruiting participants in both the earlier phases post stroke as well as the chronic phase. People with cognitive impairment, or communication or visual deficits were often excluded, thereby raising questions about how applicable this intervention is to a wide range of stroke survivors. Furthermore, the average age of participants in the included studies was relatively low, therefore, information about use with older stroke survivors is limited.
Researchers involved in future studies should provide more detail in their reporting, ensuring that they clearly describe their eligibility criteria, consent rate and the adherence and satisfaction of participants with the intervention. These details will be of interest to clinicians who will need to weigh up the cost of the virtual reality program with the potential benefits and the number of clients who may benefit from use.
Furthermore, the applicability of the intervention to stroke survivors needs further research in terms of which type of approach is best suited to the individual person and how acceptable the technology may be to stroke survivors. There are a number of studies suggesting that virtual reality training is motivating and enjoyable with some studies finding the intervention to be more engaging than usual therapy exercises (McNulty 2015; Webster 2014; Wingham 2015). Although there is a perception that people undergoing rehabilitation programs will find the technology difficult to use, the research suggests that a number of studies report the technology as acceptable and easy to use (Nawaz 2015) .
In contrast to our previous reviews, in which most of the virtual reality programs were specifically designed for rehabilitation purposes, this review has found a rise in the number of studies evaluating commercial gaming programs designed for the general population; yet it remains difficult to examine the effects of game‐based interventions as the goals of therapy and methods vary.
We did not conduct subgroup analyses to compare the effects of immersive and non‐immersive technologies as these types of analyses were not specified in our protocol or carried out in previous versions of this review. As the number of studies in the field expand it may be possible to determine more information about the types of virtual reality that are likely to be effective through this type of subgroup analysis.
Several trials reported on the presence or absence of adverse events. There were few events reported: the small number of events were mild and limited to dizziness, headache and pain.
Quality of the evidence
While we were able to include a relatively large number of studies in the review, sample sizes in the included studies were mostly small and larger, adequately powered studies are required to confirm initial findings. The risk of bias present in many studies was unclear due to poor reporting and lack of clarification from study authors. Approximately half of the studies reported adequate allocation concealment, and in five of the included studies assessors were not blind to allocation. Thus, while there are a large number of randomised controlled trials, the evidence remains 'moderate', 'low' or 'very low' quality when rated using the GRADE system.
Potential biases in the review process
Despite a comprehensive search strategy it is possible that we did not identify some studiesin the search process, for example, studies where there is no published abstract in English. Whilst in the previous version of this review we contacted manufacturers of virtual reality equipment and searched conference proceedings, we opted not to do so in this update, as this method was not previously effective in eliciting original studies. However, this does mean that unpublished data may not have been identified. Furthermore, although we contacted all corresponding authors of included studies and sent a follow‐up email to those that did not respond, few authors responded. This resulted in the study methodology of many trials being unclear and resulted in us being unable to include some data in the analyses. The process of two review authors independently reviewing abstracts and extracting data (with a third review author to moderate disagreements) enabled us to minimise bias. The search date of this review was April 2017. As this field is rapidly expanding there are likely to be more studies now eligible for inclusion.
Agreements and disagreements with other studies or reviews
Previous systematic reviews have argued that virtual reality appears promising (Cheok 2015; Corbetta 2015; Crosbie 2007; Li 2016; Lohse 2014; Moreira 2013; Saposnik 2011). This review is generally consistent with these reviews; however, due to the more recent and comprehensive search strategy we were able to identify a greater number of studies and conduct subgroup analyses. The various reviews have drawn different conclusions about the efficacy of virtual reality: most of the differences are due to different inclusion and exclusion criteria. For example, in this review we excluded studies where the interaction between the study participant and the virtual environment were mediated by the therapist rather than directly by the participant, such as when speed of movement through a virtual environment was controlled by the therapist during treadmill training. Other reviews did not make this distinction and included these types of studies. We were also careful to conduct separate analyses based on the treatment of the control group and the type and dose of therapy received.
In the previous version of this review, the main analysis examining effect on upper limb function included 12 studies and 397 participants and found that virtual reality intervention was more effective than conventional therapy (Laver 2015). There have been many studies published in the last couple of years and this updated version of the review included 22 studies with 1033 participants. The analysis for effect on upper limb function was not significant; this finding is a major change in the direction of results with practical implications for clinicians.
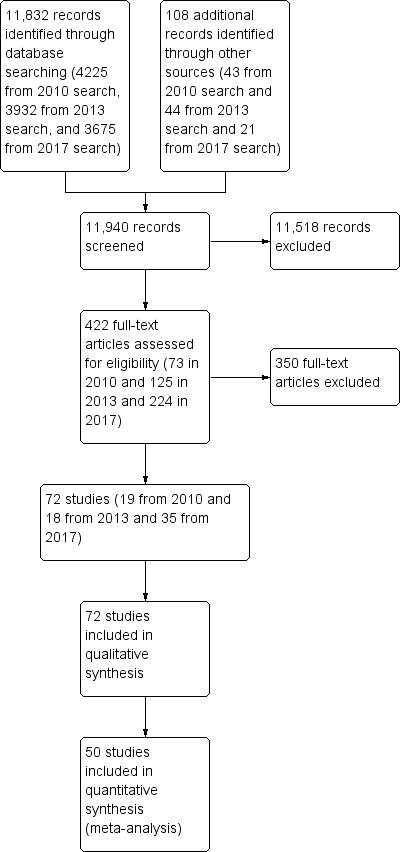
Study flow diagram
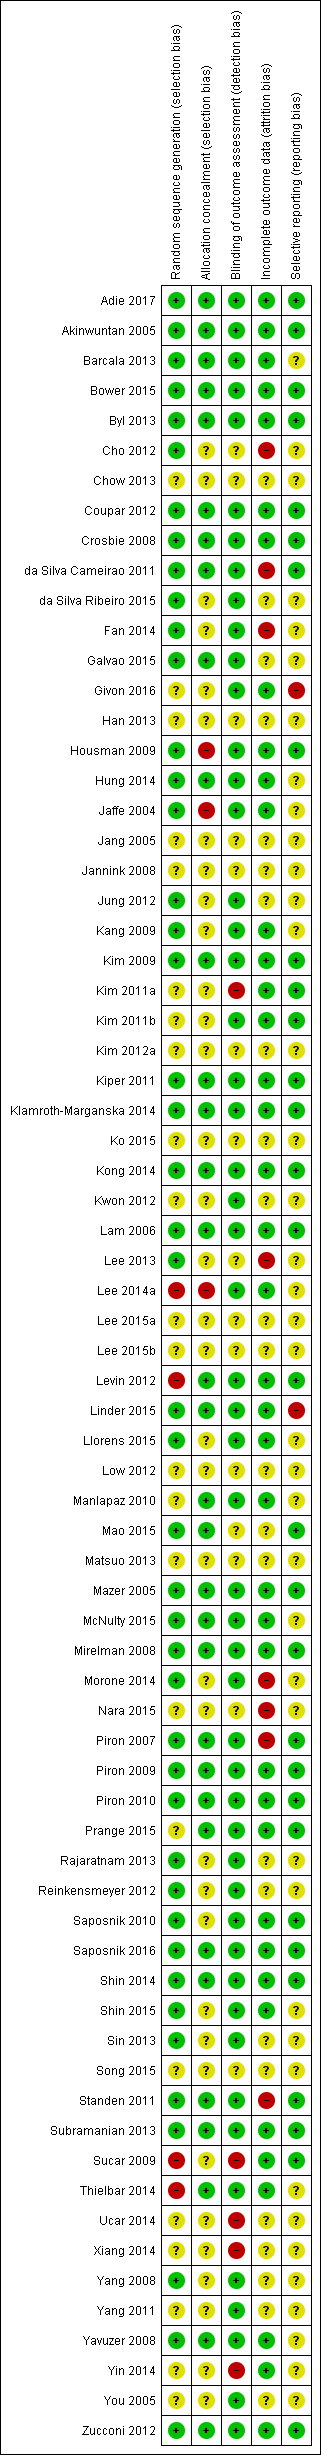
Methodological quality summary: review authors' judgements about each methodological quality item for each included study

Methodological quality graph: review authors' judgements about each methodological quality item presented as percentages across all included studies

Comparison 1 Virtual reality versus conventional therapy: effect on upper limb function post intervention, Outcome 1 Upper limb function post intervention (composite measure).
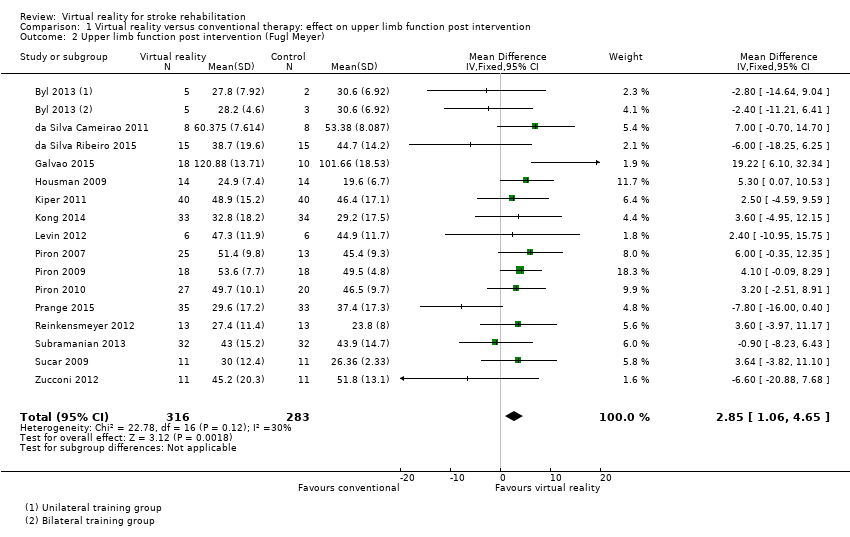
Comparison 1 Virtual reality versus conventional therapy: effect on upper limb function post intervention, Outcome 2 Upper limb function post intervention (Fugl Meyer).
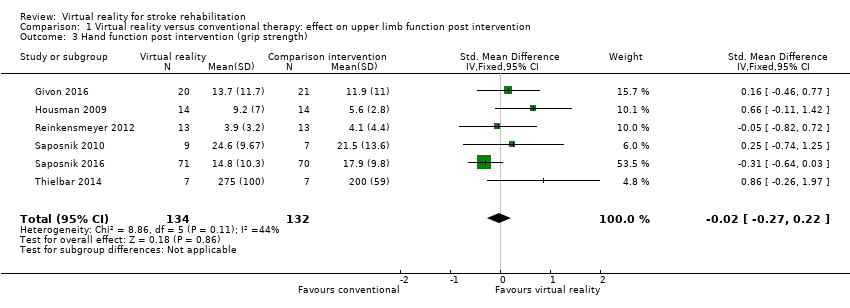
Comparison 1 Virtual reality versus conventional therapy: effect on upper limb function post intervention, Outcome 3 Hand function post intervention (grip strength).

Comparison 1 Virtual reality versus conventional therapy: effect on upper limb function post intervention, Outcome 4 Upper limb function post intervention: amount of use (subjective).
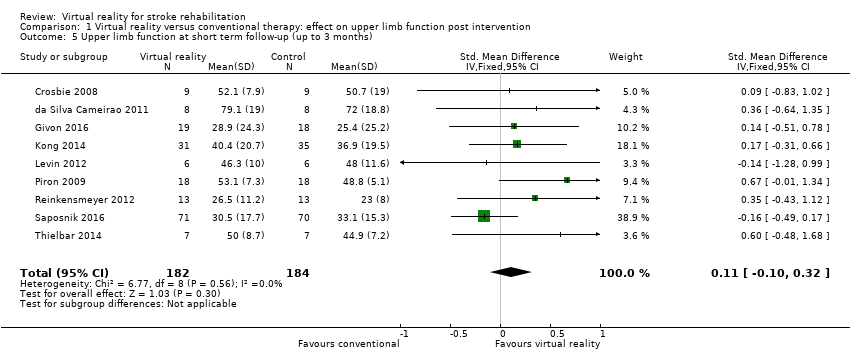
Comparison 1 Virtual reality versus conventional therapy: effect on upper limb function post intervention, Outcome 5 Upper limb function at short term follow‐up (up to 3 months).

Comparison 2 Virtual reality versus conventional therapy: upper limb function: subgroup analyses, Outcome 1 Dose of intervention.
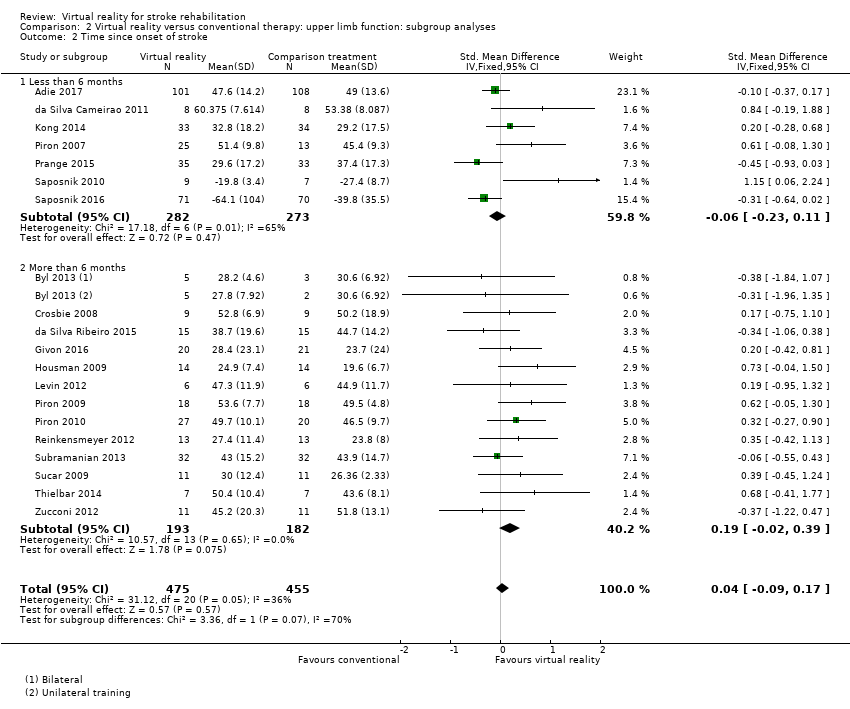
Comparison 2 Virtual reality versus conventional therapy: upper limb function: subgroup analyses, Outcome 2 Time since onset of stroke.
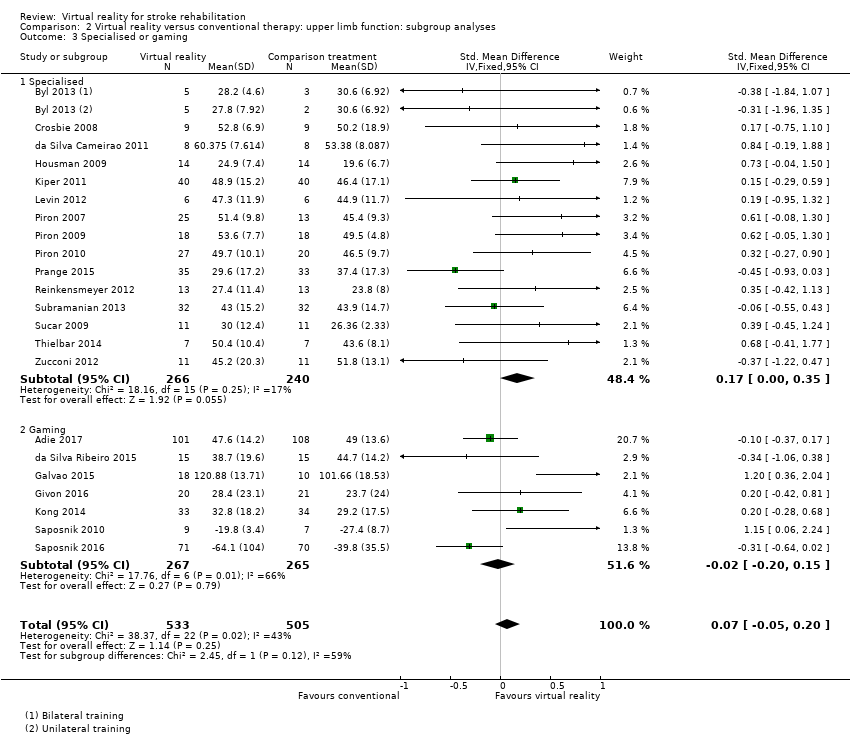
Comparison 2 Virtual reality versus conventional therapy: upper limb function: subgroup analyses, Outcome 3 Specialised or gaming.

Comparison 2 Virtual reality versus conventional therapy: upper limb function: subgroup analyses, Outcome 4 Severity of impairment.
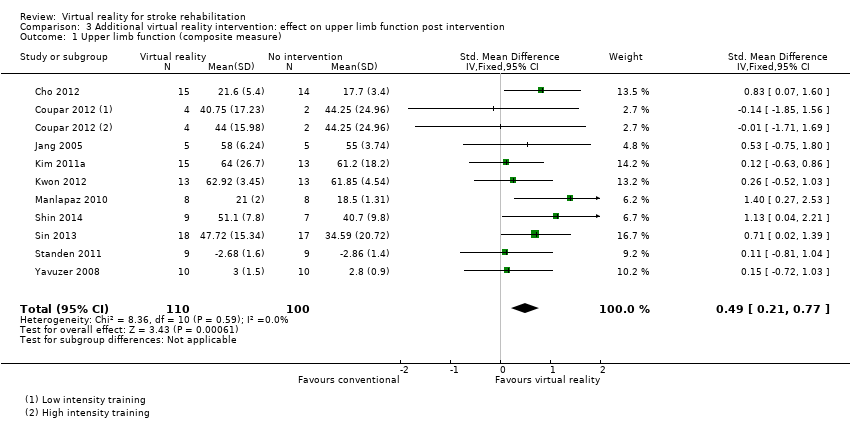
Comparison 3 Additional virtual reality intervention: effect on upper limb function post intervention, Outcome 1 Upper limb function (composite measure).
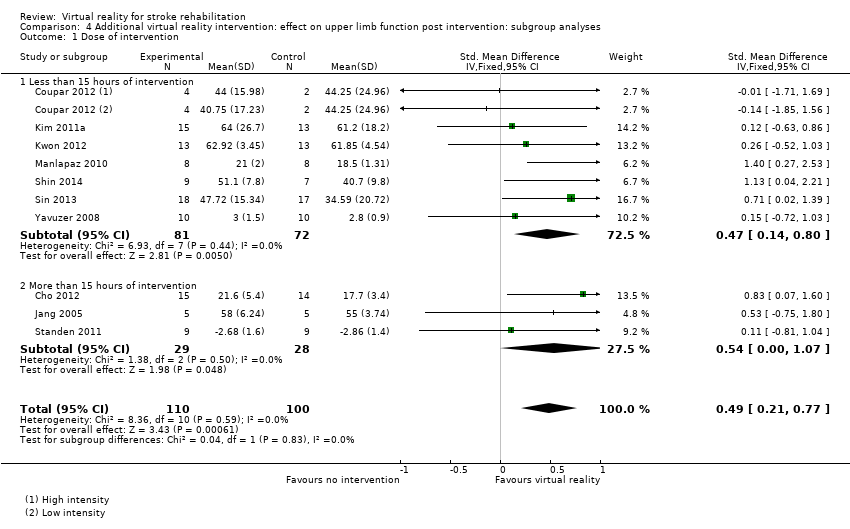
Comparison 4 Additional virtual reality intervention: effect on upper limb function post intervention: subgroup analyses, Outcome 1 Dose of intervention.
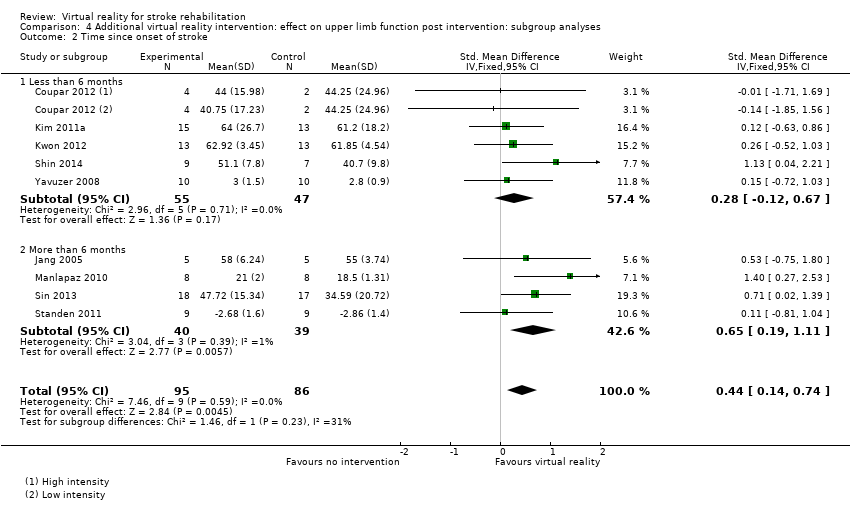
Comparison 4 Additional virtual reality intervention: effect on upper limb function post intervention: subgroup analyses, Outcome 2 Time since onset of stroke.

Comparison 4 Additional virtual reality intervention: effect on upper limb function post intervention: subgroup analyses, Outcome 3 Specialised or gaming.

Comparison 5 Virtual reality versus conventional therapy: effect on lower limb activity post intervention, Outcome 1 Gait speed.
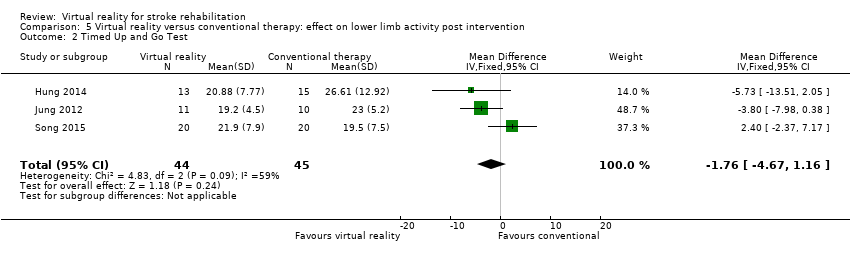
Comparison 5 Virtual reality versus conventional therapy: effect on lower limb activity post intervention, Outcome 2 Timed Up and Go Test.
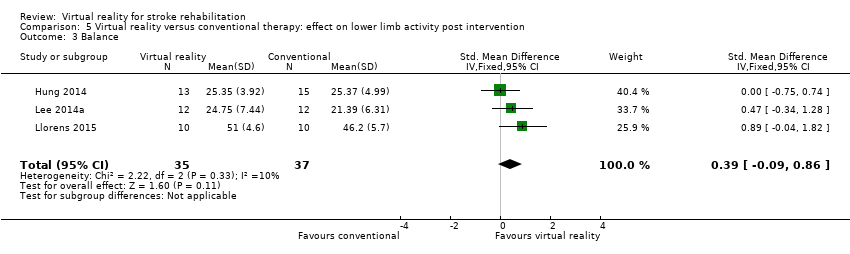
Comparison 5 Virtual reality versus conventional therapy: effect on lower limb activity post intervention, Outcome 3 Balance.
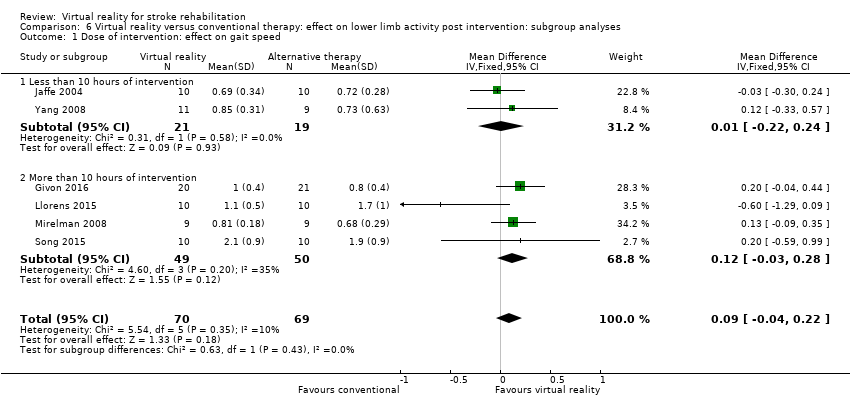
Comparison 6 Virtual reality versus conventional therapy: effect on lower limb activity post intervention: subgroup analyses, Outcome 1 Dose of intervention: effect on gait speed.

Comparison 7 Additional virtual reality intervention: effect on lower limb activity post intervention, Outcome 1 Gait speed.

Comparison 7 Additional virtual reality intervention: effect on lower limb activity post intervention, Outcome 2 Functional mobility (Timed Up and Go).

Comparison 7 Additional virtual reality intervention: effect on lower limb activity post intervention, Outcome 3 Balance.
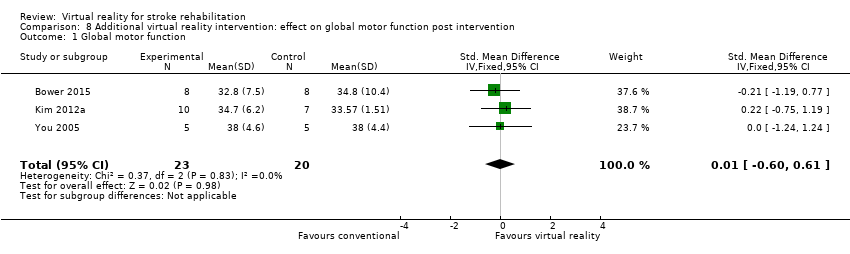
Comparison 8 Additional virtual reality intervention: effect on global motor function post intervention, Outcome 1 Global motor function.

Comparison 9 Virtual reality versus conventional therapy: effect on activity limitation, Outcome 1 ADL outcome.

Comparison 10 Additional virtual reality intervention: effect on activity limitation, Outcome 1 ADL outcome.
| Virtual reality compared to conventional therapy for stroke rehabilitation | ||||||
| Patient or population: people receiving stroke rehabilitation Comparison: conventional therapy | ||||||
| Outcomes | Illustrative comparative risks* (95% CI) | Relative effect | No of participants | Quality of the evidence | Comments | |
| Assumed risk | Corresponding risk | |||||
| Control | Virtual reality | |||||
| Upper limb function | Same dose of conventional therapy | The mean upper limb function in the intervention groups was | 1038 | ⊕⊕⊝⊝ | No statistically significant difference between groups | |
| Quality of life | Same dose of conventional therapy | No significant benefit found on total score of the SF‐36 | 300 (3 studies) | ⊕⊕⊝⊝ low1,2,4 | Studies could not be pooled. None of the 3 studies found significant differences between groups in total score. 2 studies reported significant differences in domains of the SF36 | |
| Gait speed | Same dose of conventional therapy | The mean gait speed in the intervention groups was | 139 | ⊕⊕⊝⊝ | No statistically significant difference between groups | |
| ADL outcome | Same dose of conventional therapy | The mean ADL outcome in the intervention groups was | 466 | ⊕⊕⊕⊝ | Small effect in favour of those receiving virtual reality intervention | |
| ADL: activities of daily living; CI: confidence interval | ||||||
| GRADE Working Group grades of evidence High quality: we are very confident that the true effect lies close to that of the estimate of the effect Moderate quality: we are moderately confident in the effect estimate; the true effect is likely to be close to the estimate of effect, but there is a possibility that it is substantially different Low quality: our confidence in the effect estimate is limited; the true effect may be substantially different from the estimate of the effect Very low quality: we have very little confidence in the effect estimate; the true effect is likely to be substantially different from the estimate of effect | ||||||
| 1Risk of bias was unclear in a number of studies. | ||||||
| Virtual reality intervention compared with usual care (thus provided as additional therapy) for stroke rehabilitation | ||||||
| Patient or population: people receiving stroke rehabilitation Settings: hospital, clinic or home Intervention: virtual reality provided in addition to usual care Comparison: usual care | ||||||
| Outcomes | Illustrative comparative risks* (95% CI) | Relative effect | No of participants | Quality of the evidence | Comments | |
| Assumed risk | Corresponding risk | |||||
| Control | Virtual reality (provided in addition to usual care) | |||||
| Upper limb function | Usual care | The SMD in the intervention groups was 0.49 standard deviations higher (0.21 to 0.77) | ‐ | 210 (10 studies) | ⊕⊕⊝⊝ | Moderate effect in favour of providing virtual reality intervention in addition to usual care |
| Quality of life ‐ not measured in any of the studies | ‐ | ‐ | ‐ | ‐ | ‐ | Not measured in the studies |
| Gait speed | Usual care | The mean difference in the intervention groups was | ‐ | 57 (3 studies) | ⊕⊕⊝⊝ | No statistically significant difference between groups |
| Global motor function | Usual care | The SMD in the intervention groups was | ‐ | 43 (3 studies) | ⊕⊕⊝⊝ | No statistically significant difference between groups |
| ADL outcome | Usual care | The SMD in the intervention groups was 0.44 standard deviations higher (0.11 to 0.76) | ‐ | 153 (8 studies) | ⊕⊕⊝⊝ | Small to moderate effect in favour of virtual reality intervention |
| *The basis for the assumed risk (e.g. the median control group risk across studies) is provided in footnotes. The corresponding risk (and its 95% confidence interval) is based on the assumed risk in the comparison group and the relative effect of the intervention (and its 95% CI). ADL: activities of daily living; CI: confidence interval; MD: mean difference; RR: risk ratio; SMD: standardised mean difference | ||||||
| GRADE Working Group grades of evidence High quality: we are very confident that the true effect lies close to that of the estimate of the effect Moderate quality: we are moderately confident in the effect estimate; the true effect is likely to be close to the estimate of effect, but there is a possibility that it is substantially different Low quality: our confidence in the effect estimate is limited; the true effect may be substantially different from the estimate of the effect Very low quality: we have very little confidence in the effect estimate; the true effect is likely to be substantially different from the estimate of effect | ||||||
| 1Risk of bias was unclear in a number of studies. | ||||||
| Author and year | Upper limb function | Hand function | Lower limb activity | Balance and postural control | Global motor function | Cognitive function | Activity limitation | Participation restriction and QOL |
| Action Research Arm Test, Motor Activity Log Arm Function Test | Modified Rankin Scale | Stroke Impact Scale, EQ5D, Canadian Occupational Performance Measure | ||||||
| — | — | — | — | — | Useful Field of View test | On‐road driving test score, decision of fitness to drive | — | |
| — | — | Timed Up and Go | Berg Balance Scale, centre of pressure data, body symmetry data | — | — | Functional Independence Measure | — | |
| 6‐minute walk test, step test | Functional reach | Motor Assessment Scale | Functional Independence Measure (transfers, mobility, stairs) | |||||
| Fugl Meyer UE Scale, Motor Proficiency Speed (abbreviated Wolf Motor Function test + Digital reaction time test) | Motor skill performance (Box and Block and tapper test) | — | — | — | — | Functional Independence (CAFE40) | ||
| Wolf Motor Function Test | — | — | — | — | Motor Free Visual Perception Test | — | — | |
| 10‐m walk test | Berg Balance Scale | Modified Barthel Index | ||||||
| Action Research Arm Test, Upper Limb Motricity Index | — | — | — | — | — | — | — | |
| Fugl Meyer | Dynamic Gait Index | SF36 | ||||||
| Fugl Meyer UE, Chedoke Arm and Hand Inventory | — | — | — | — | — | Barthel Index | — | |
| Jebsen Taylor Hand Function Test | Stroke Impact Scale | |||||||
| Fugl Meyer, Motor Activity Log | ||||||||
| Action Research Arm Test | Grip strength | 10‐m walk test | ||||||
| Berg Balance Scale | Modified Barthel Index | |||||||
| Fugl Meyer UE Scale, Rancho Functional Test, Motor Activity Log (amount of use and quality of movement) | Grip strength (kg) | — | — | — | — | — | ‐ | |
| Timed Up and Go Test | Forward Reach Test | Falls Efficacy Scale International | ||||||
| — | — | 6‐m walk test, Obstacle Test, 6‐minute walk test | Customised balance test designed by the researchers | — | — | — | — | |
| Fugl Meyer UE Scale, Manual Function Test, Motor Activity Log (amount of use and quality of movement) | Box and Block Test | — | — | — | — | — | ||
| — | — | — | — | — | — | — | — | |
| — | — | Timed Up and Go | — | — | — | — | — | |
| — | — | — | — | — | Mini Mental State Examination | Modified Barthel Index | — | |
| — | — | 10‐m walk test, GAIT‐RITE gait analysis system | Berg Balance Scale, balance performance monitor | Modified Motor Assessment Scale | — | — | — | |
| Motricity Index | — | Motricity Index | — | — | Computerised neuropsychological test and Tower of London test | Korean Modified Barthel Index | — | |
| — | — | — | — | — | Measures of spatial neglect (star cancellation, line bisection test, Catherine Bergego Scale) | Korean Modified Barthel Index | — | |
| — | — | — | Postural assessment scale | Modified Motor Assessment Scale | — | Functional Independence Measure | — | |
| Fugl Meyer UE | — | — | — | — | — | Functional Independence Measure | — | |
| Fugl Meyer UE, Wolf Motor Function Test, Motor Activity Log (quality of movement) | ‐ | ‐ | ‐ | ‐ | ‐ | ‐ | Stroke Impact Scale, Goal attainment scale | |
| Timed Up and Go Test | Berg Balance Scale | |||||||
| Fugl Meyer, Action Research Arm Test | Functional Independence Measure | Stroke Impact Scale | ||||||
| Fugl Meyer UE, Manual Function Test | — | — | — | — | — | Korean Modified Barthel Index | — | |
| — | — | — | — | — | — | — | — | |
| Functional Reach Test | ||||||||
| Timed Up and Go Test | Berg Balance Scale | |||||||
| Functional Reach Test | ||||||||
| Fugl Meyer UE Scale, Reach Performance Scale for Stroke, Box and Blocks Test, Wolf Motor Function Test, Motor Activity Log | ||||||||
| Stroke Impact Scale | ||||||||
| Tinetti Performance Oriented Mobility Assessment, 10‐m walk test | Berg Balance Scale, Brunel Balance Assessment | |||||||
| Fugl Meyer UE Scale, Action Research Arm Test | Gait speed | Berg Balance Scale | Functional Independence Measure | |||||
| Fugl Meyer UE Scale | Motor Assessment Scale | |||||||
| Gait analysis (gaitlab assessment) | ||||||||
| Fugl Meyer UE, Wolf Motor Function Test, Box and Block Test, Motor Activity Log | ||||||||
| — | — | — | — | — | — | DriveAble Testing Ltd Driver Evaluation | — | |
| Wolf Motor Function Test timed tasks and strength subtests, Motor Activity Log QOM scale, Fugl Meyer, Box and Block Test | ||||||||
| — | — | Gait speed over 7‐metre walkway, 6‐minute walk test, Patient Activity Monitor | — | — | — | — | — | |
| 10‐m walk test | Berg Balance Scale | Barthel Index | Functional Ambulation Category | |||||
| Static balance ability | ||||||||
| Fugl Meyer UE Scale | — | — | — | — | — | Functional Independence Measure | — | |
| Fugl Meyer UE Scale, Abilhand Scale | — | — | — | — | — | — | ‐ | |
| Fugl Meyer UE Scale | — | — | — | — | — | Functional Independence Measure | — | |
| Fugl Meyer UE, Stroke Upper Limb Capacity Sclae | ||||||||
| — | — | Timed Up and Go | Berg Balance Scale, functional reach, centre of pressure | — | — | — | — | |
| Fugl Meyer UE, Ranchos Functional Test for UE, Motor Activity Log, Box and Blocks Test | Grip strength | |||||||
| Abbreviated Wolf Motor Function Test | Box and Block Test, grip strength (kg) | — | — | — | — | — | Stroke Impact Scale (hand function, composite function, perception of recovery) | |
| Abbreviated Wolf Motor Function Test, Box and Block Test | Grip strength | Functional Independence Measure, Barthel Index, Modified Rankin Scale | Stroke Impact Scale | |||||
| Fugl Meyer UE | — | — | — | — | — | Modified Barthel Index | — | |
| Fugl Meyer UE | SF36 | |||||||
| Fugl Meyer UE, Box and Block Test | — | — | — | — | — | — | ||
| Timed Up and Go Test, 10‐minute walk test | Balance (Biofeedback system) | |||||||
| Wolf Motor Function Test, Motor Activity Log, Nine Hole Peg Test | — | — | — | — | Nottingham Extended Activities of Daily Living Scale | |||
| Fugl Meyer UE, Wolf Motor Function test, Reaching performance scale for stroke, Motor Activity Log | — | — | — | — | — | — | ||
| Fugl Meyer UE Scale, Upper Limb Motricity Index | — | — | — | — | — | — | — | |
| Action Research Arm Test, Jebsen Taylor Hand Function Test, Fugl Meyer UE | Grip strength | |||||||
| Timed walking speed test, Timed Up and Go | Mini Mental State Examination | Functional Ambulation Category | ||||||
| 10‐m walking speed, Fugl Meyer (LE) | Brunel Balance Assessment | |||||||
| — | — | Walking speed, Community Walk Test | — | — | — | — | Walking Ability Questionnaire, Activities Specific Balance Confidence Scale | |
| — | — | Gait analysis data | Balance analysis data | — | — | — | — | |
| Brunnstrom Upper Extremity Stages | Brunnstrom Hand Stages | — | — | — | — | Functional Independence Measure self‐care section | — | |
| Fugl Meyer, Action Research Arm Test, Motor Activity Log | Functional Independence Measure | |||||||
| — | — | Functional ambulation category | — | Modified Motor Assessment Scale | — | — | — | |
| Fugl Meyer UE, Reaching performance scale | — | — | — | — | — | Functional Independence Measure | — | |
| fMRI: functional magnetic resonance imaging | ||||||||
| Outcome or subgroup title | No. of studies | No. of participants | Statistical method | Effect size |
| 1 Upper limb function post intervention (composite measure) Show forest plot | 22 | 1038 | Std. Mean Difference (IV, Fixed, 95% CI) | 0.07 [‐0.05, 0.20] |
| 2 Upper limb function post intervention (Fugl Meyer) Show forest plot | 16 | 599 | Mean Difference (IV, Fixed, 95% CI) | 2.85 [1.06, 4.65] |
| 3 Hand function post intervention (grip strength) Show forest plot | 6 | 266 | Std. Mean Difference (IV, Fixed, 95% CI) | ‐0.02 [‐0.27, 0.22] |
| 4 Upper limb function post intervention: amount of use (subjective) Show forest plot | 5 | 161 | Std. Mean Difference (IV, Fixed, 95% CI) | ‐0.11 [‐0.42, 0.21] |
| 5 Upper limb function at short term follow‐up (up to 3 months) Show forest plot | 9 | 366 | Std. Mean Difference (IV, Fixed, 95% CI) | 0.11 [‐0.10, 0.32] |
| Outcome or subgroup title | No. of studies | No. of participants | Statistical method | Effect size |
| 1 Dose of intervention Show forest plot | 22 | 1038 | Std. Mean Difference (IV, Fixed, 95% CI) | 0.07 [‐0.05, 0.20] |
| 1.1 Less than 15 hours of intervention | 9 | 430 | Std. Mean Difference (IV, Fixed, 95% CI) | ‐0.01 [‐0.20, 0.18] |
| 1.2 More than 15 hours of intervention | 13 | 608 | Std. Mean Difference (IV, Fixed, 95% CI) | 0.13 [‐0.03, 0.29] |
| 2 Time since onset of stroke Show forest plot | 20 | 930 | Std. Mean Difference (IV, Fixed, 95% CI) | 0.04 [‐0.09, 0.17] |
| 2.1 Less than 6 months | 7 | 555 | Std. Mean Difference (IV, Fixed, 95% CI) | ‐0.06 [‐0.23, 0.11] |
| 2.2 More than 6 months | 13 | 375 | Std. Mean Difference (IV, Fixed, 95% CI) | 0.19 [‐0.02, 0.39] |
| 3 Specialised or gaming Show forest plot | 22 | 1038 | Std. Mean Difference (IV, Fixed, 95% CI) | 0.07 [‐0.05, 0.20] |
| 3.1 Specialised | 15 | 506 | Std. Mean Difference (IV, Fixed, 95% CI) | 0.17 [‐0.00, 0.35] |
| 3.2 Gaming | 7 | 532 | Std. Mean Difference (IV, Fixed, 95% CI) | ‐0.02 [‐0.20, 0.15] |
| 4 Severity of impairment Show forest plot | 21 | 998 | Std. Mean Difference (IV, Fixed, 95% CI) | 0.07 [‐0.06, 0.19] |
| 4.1 Mild to moderate impairment | 13 | 678 | Std. Mean Difference (IV, Fixed, 95% CI) | 0.10 [‐0.06, 0.25] |
| 4.2 Moderate to severe impairment | 8 | 320 | Std. Mean Difference (IV, Fixed, 95% CI) | 0.01 [‐0.22, 0.23] |
| Outcome or subgroup title | No. of studies | No. of participants | Statistical method | Effect size |
| 1 Upper limb function (composite measure) Show forest plot | 10 | 210 | Std. Mean Difference (IV, Fixed, 95% CI) | 0.49 [0.21, 0.77] |
| Outcome or subgroup title | No. of studies | No. of participants | Statistical method | Effect size |
| 1 Dose of intervention Show forest plot | 10 | 210 | Std. Mean Difference (IV, Fixed, 95% CI) | 0.49 [0.21, 0.77] |
| 1.1 Less than 15 hours of intervention | 7 | 153 | Std. Mean Difference (IV, Fixed, 95% CI) | 0.47 [0.14, 0.80] |
| 1.2 More than 15 hours of intervention | 3 | 57 | Std. Mean Difference (IV, Fixed, 95% CI) | 0.54 [0.00, 1.07] |
| 2 Time since onset of stroke Show forest plot | 9 | 181 | Std. Mean Difference (IV, Fixed, 95% CI) | 0.44 [0.14, 0.74] |
| 2.1 Less than 6 months | 5 | 102 | Std. Mean Difference (IV, Fixed, 95% CI) | 0.28 [‐0.12, 0.67] |
| 2.2 More than 6 months | 4 | 79 | Std. Mean Difference (IV, Fixed, 95% CI) | 0.65 [0.19, 1.11] |
| 3 Specialised or gaming Show forest plot | 10 | 210 | Std. Mean Difference (IV, Fixed, 95% CI) | 0.49 [0.21, 0.77] |
| 3.1 Specialised | 7 | 139 | Std. Mean Difference (IV, Fixed, 95% CI) | 0.40 [0.06, 0.75] |
| 3.2 Gaming | 3 | 71 | Std. Mean Difference (IV, Fixed, 95% CI) | 0.67 [0.18, 1.15] |
| Outcome or subgroup title | No. of studies | No. of participants | Statistical method | Effect size |
| 1 Gait speed Show forest plot | 6 | 139 | Mean Difference (IV, Fixed, 95% CI) | 0.09 [‐0.04, 0.22] |
| 2 Timed Up and Go Test Show forest plot | 3 | 89 | Mean Difference (IV, Fixed, 95% CI) | ‐1.76 [‐4.67, 1.16] |
| 3 Balance Show forest plot | 3 | 72 | Std. Mean Difference (IV, Fixed, 95% CI) | 0.39 [‐0.09, 0.86] |
| Outcome or subgroup title | No. of studies | No. of participants | Statistical method | Effect size |
| 1 Dose of intervention: effect on gait speed Show forest plot | 6 | 139 | Mean Difference (IV, Fixed, 95% CI) | 0.09 [‐0.04, 0.22] |
| 1.1 Less than 10 hours of intervention | 2 | 40 | Mean Difference (IV, Fixed, 95% CI) | 0.01 [‐0.22, 0.24] |
| 1.2 More than 10 hours of intervention | 4 | 99 | Mean Difference (IV, Fixed, 95% CI) | 0.12 [‐0.03, 0.28] |
| Outcome or subgroup title | No. of studies | No. of participants | Statistical method | Effect size |
| 1 Gait speed Show forest plot | 3 | 57 | Mean Difference (IV, Fixed, 95% CI) | 0.08 [‐0.05, 0.21] |
| 2 Functional mobility (Timed Up and Go) Show forest plot | 3 | 93 | Mean Difference (IV, Fixed, 95% CI) | ‐4.76 [‐8.91, ‐0.61] |
| 3 Balance Show forest plot | 7 | 173 | Std. Mean Difference (IV, Fixed, 95% CI) | 0.59 [0.28, 0.90] |
| Outcome or subgroup title | No. of studies | No. of participants | Statistical method | Effect size |
| 1 Global motor function Show forest plot | 3 | 43 | Std. Mean Difference (IV, Fixed, 95% CI) | 0.01 [‐0.60, 0.61] |
| Outcome or subgroup title | No. of studies | No. of participants | Statistical method | Effect size |
| 1 ADL outcome Show forest plot | 10 | 466 | Std. Mean Difference (IV, Fixed, 95% CI) | 0.25 [0.06, 0.43] |
| Outcome or subgroup title | No. of studies | No. of participants | Statistical method | Effect size |
| 1 ADL outcome Show forest plot | 8 | 153 | Std. Mean Difference (IV, Fixed, 95% CI) | 0.44 [0.11, 0.76] |