| Author and year | Upper limb function | Hand function | Lower limb activity | Balance and postural control | Global motor function | Cognitive function | Activity limitation | Participation restriction and QOL |
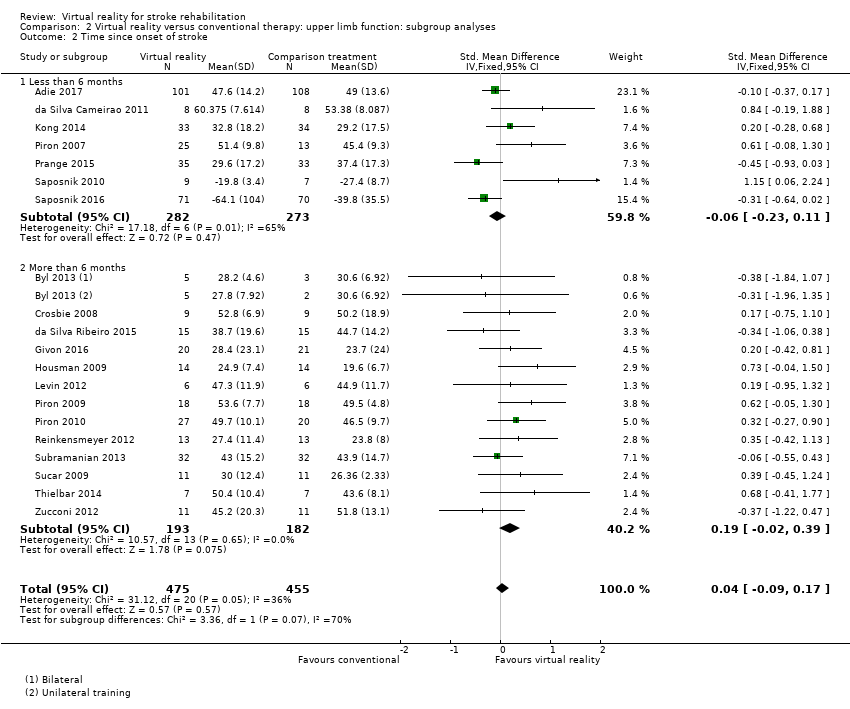
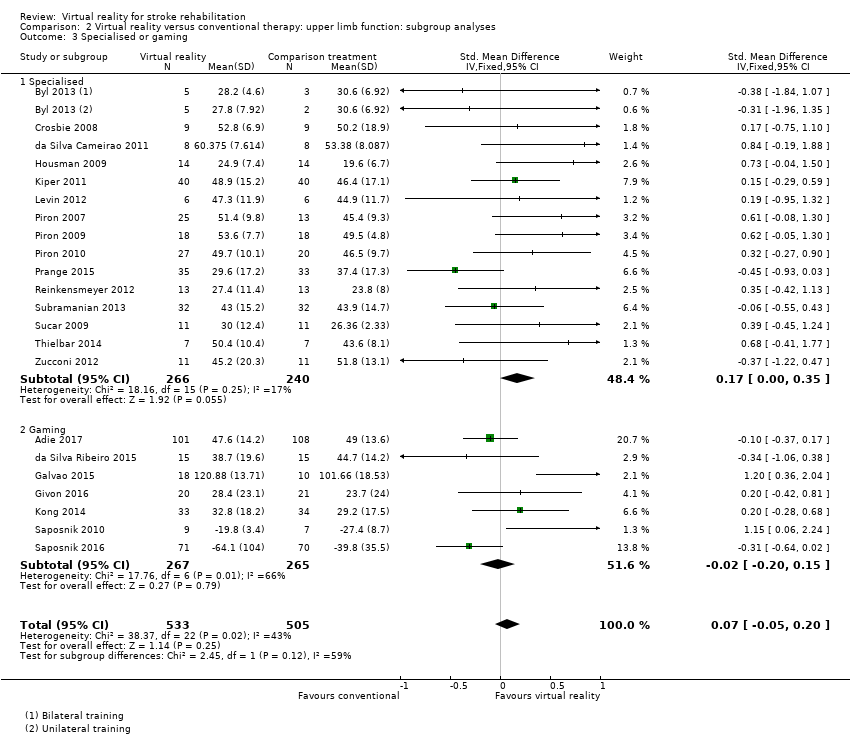
| Adie 2017 | Action Research Arm Test, Motor Activity Log Arm Function Test | | | | | | Modified Rankin Scale | Stroke Impact Scale, EQ5D, Canadian Occupational Performance Measure |
| Akinwuntan 2005 | — | — | — | — | — | Useful Field of View test | On‐road driving test score, decision of fitness to drive | — |
| Barcala 2013 | — | — | Timed Up and Go | Berg Balance Scale, centre of pressure data, body symmetry data | — | — | Functional Independence Measure | — |
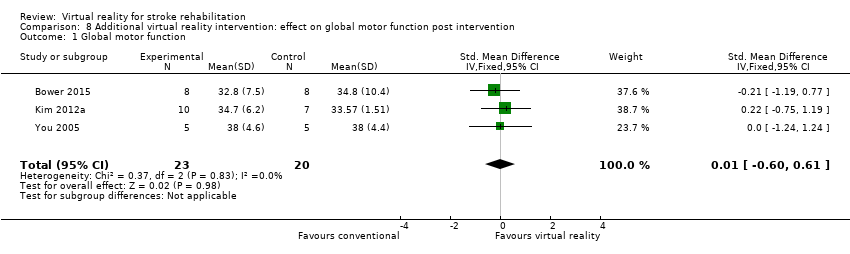
| Bower 2015 | | | 6‐minute walk test, step test | Functional reach | Motor Assessment Scale | | Functional Independence Measure (transfers, mobility, stairs) | |
| Byl 2013 | Fugl Meyer UE Scale, Motor Proficiency Speed (abbreviated Wolf Motor Function test + Digital reaction time test) | Motor skill performance (Box and Block and tapper test) | — | — | — | — | Functional Independence (CAFE40) | |
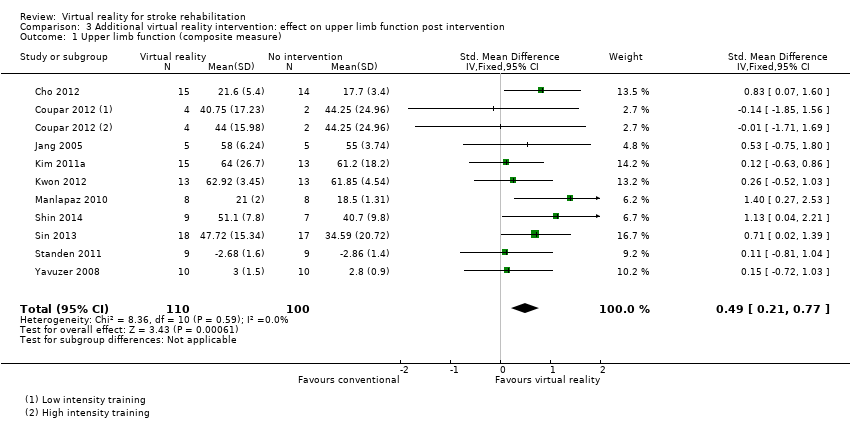
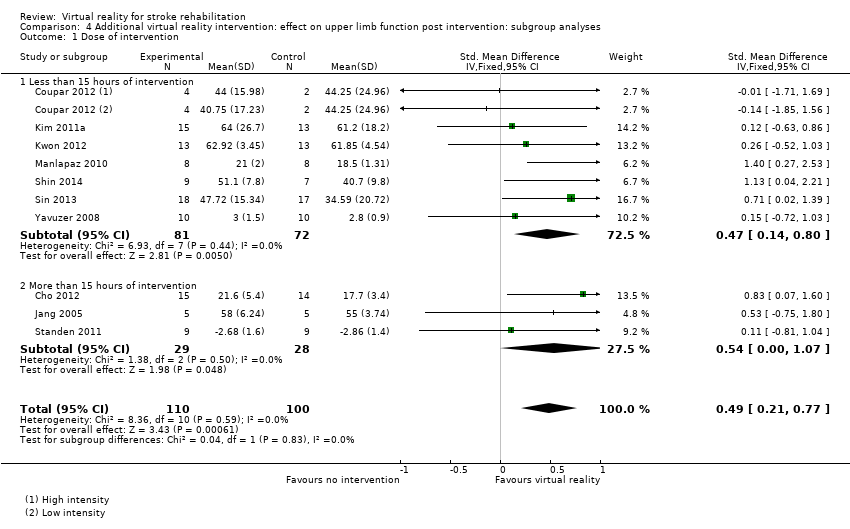
| Cho 2012 | Wolf Motor Function Test | — | — | — | — | Motor Free Visual Perception Test | — | — |
| Chow 2013 | | | 10‐m walk test | Berg Balance Scale | | | Modified Barthel Index | |
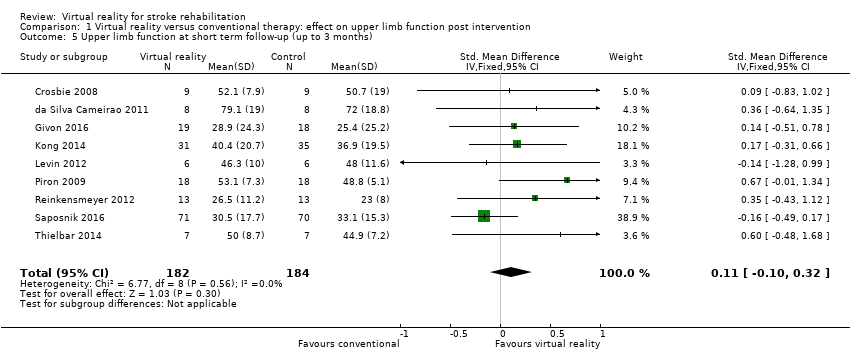
| Crosbie 2008 | Action Research Arm Test, Upper Limb Motricity Index | — | — | — | — | — | — | — |
| da Silva Ribeiro 2015 | Fugl Meyer | | | Dynamic Gait Index | | | | SF36 |
| da Silva Cameirao 2011 | Fugl Meyer UE, Chedoke Arm and Hand Inventory | — | — | — | — | — | Barthel Index | — |
| Fan 2014 | Jebsen Taylor Hand Function Test | | | | | | | Stroke Impact Scale |
| Galvao 2015 | Fugl Meyer, Motor Activity Log | | | | | | | |
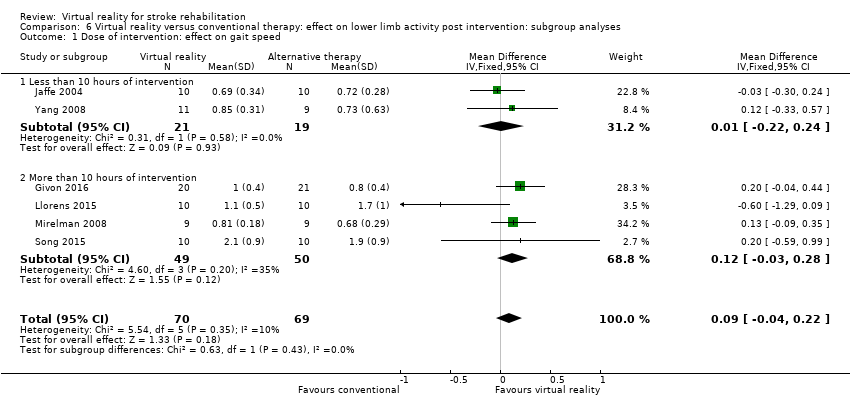
| Givon 2016 | Action Research Arm Test | Grip strength | 10‐m walk test | | | | | |
| Han 2013 | | | | Berg Balance Scale | | | Modified Barthel Index | |
| Housman 2009 | Fugl Meyer UE Scale, Rancho Functional Test, Motor Activity Log (amount of use and quality of movement) | Grip strength (kg) | — | — | — | — | — | ‐ |
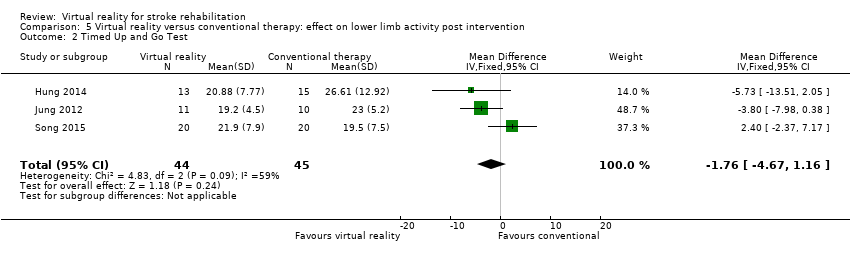
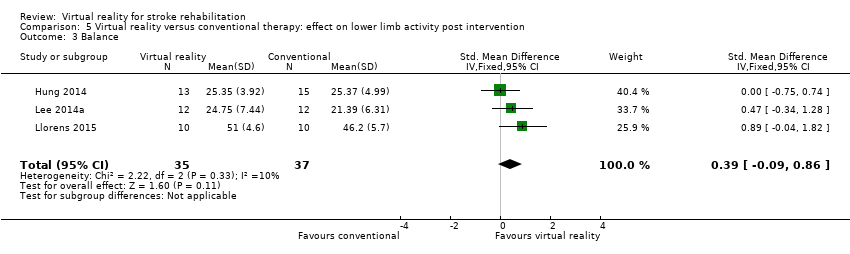
| Hung 2014 | | | Timed Up and Go Test | Forward Reach Test | | | | Falls Efficacy Scale International |
| Jaffe 2004 | — | — | 6‐m walk test, Obstacle Test, 6‐minute walk test | Customised balance test designed by the researchers | — | — | — | — |
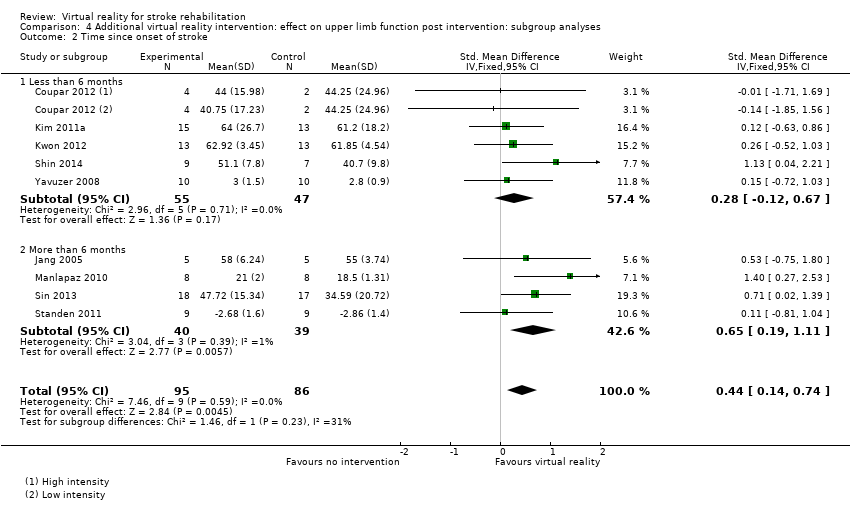
| Jang 2005 | Fugl Meyer UE Scale, Manual Function Test, Motor Activity Log (amount of use and quality of movement) | Box and Block Test | — | — | — | — | — | |
| Jannink 2008 | — | — | — | — | — | — | — | — |
| Jung 2012 | — | — | Timed Up and Go | — | — | — | — | — |
| Kang 2009 | — | — | — | — | — | Mini Mental State Examination | Modified Barthel Index | — |
| Kim 2009 | — | — | 10‐m walk test, GAIT‐RITE gait analysis system | Berg Balance Scale, balance performance monitor | Modified Motor Assessment Scale | — | — | — |
| Kim 2011a | Motricity Index | — | Motricity Index | — | — | Computerised neuropsychological test and Tower of London test | Korean Modified Barthel Index | — |
| Kim 2011b | — | — | — | — | — | Measures of spatial neglect (star cancellation, line bisection test, Catherine Bergego Scale) | Korean Modified Barthel Index | — |
| Kim 2012a | — | — | — | Postural assessment scale | Modified Motor Assessment Scale | — | Functional Independence Measure | — |
| Kiper 2011 | Fugl Meyer UE | — | — | — | — | — | Functional Independence Measure | — |
| Klamroth‐Marganska 2014 | Fugl Meyer UE, Wolf Motor Function Test, Motor Activity Log (quality of movement) | ‐ | ‐ | ‐ | ‐ | ‐ | ‐ | Stroke Impact Scale, Goal attainment scale |
| Ko 2015 | | | Timed Up and Go Test | Berg Balance Scale | | | | |
| Kong 2014 | Fugl Meyer, Action Research Arm Test | | | | | | Functional Independence Measure | Stroke Impact Scale |
| Kwon 2012 | Fugl Meyer UE, Manual Function Test | — | — | — | — | — | Korean Modified Barthel Index | — |
| Lam 2006 | — | — | — | — | — | — | — | — |
| Lee 2013 | | | | Functional Reach Test | | | | |
| Lee 2014a | | | Timed Up and Go Test | Berg Balance Scale | | | | |
| Lee 2015a | | | | Functional Reach Test | | | | |
| Lee 2015b | | | | | | | | |
| Levin 2012 | Fugl Meyer UE Scale, Reach Performance Scale for Stroke, Box and Blocks Test, Wolf Motor Function Test, Motor Activity Log | | | | | | | |
| Linder 2015 | | | | | | | | Stroke Impact Scale |
| Llorens 2015 | | | Tinetti Performance Oriented Mobility Assessment, 10‐m walk test | Berg Balance Scale, Brunel Balance Assessment | | | | |
| Low 2012 | Fugl Meyer UE Scale, Action Research Arm Test | | Gait speed | Berg Balance Scale | | | Functional Independence Measure | |
| Manlapaz 2010 | Fugl Meyer UE Scale | | | | Motor Assessment Scale | | | |
| Mao 2015 | | | Gait analysis (gaitlab assessment) | | | | | |
| Matsuo 2013 | Fugl Meyer UE, Wolf Motor Function Test, Box and Block Test, Motor Activity Log | | | | | | | |
| Mazer 2005 | — | — | — | — | — | — | DriveAble Testing Ltd Driver Evaluation | — |
| McNulty 2015 | Wolf Motor Function Test timed tasks and strength subtests, Motor Activity Log QOM scale, Fugl Meyer, Box and Block Test | | | | | | | |
| Mirelman 2008 | — | — | Gait speed over 7‐metre walkway, 6‐minute walk test, Patient Activity Monitor | — | — | — | — | — |
| Morone 2014 | | | 10‐m walk test | Berg Balance Scale | | | Barthel Index | Functional Ambulation Category |
| Nara 2015 | | | | Static balance ability | | | | |
| Piron 2007 | Fugl Meyer UE Scale | — | — | — | — | — | Functional Independence Measure | — |
| Piron 2009 | Fugl Meyer UE Scale, Abilhand Scale | — | — | — | — | — | — | ‐ |
| Piron 2010 | Fugl Meyer UE Scale | — | — | — | — | — | Functional Independence Measure | — |
| Prange 2015 | Fugl Meyer UE, Stroke Upper Limb Capacity Sclae | | | | | | | |
| Rajaratnam 2013 | — | — | Timed Up and Go | Berg Balance Scale, functional reach, centre of pressure | — | — | — | — |
| Reinkensmeyer 2012 | Fugl Meyer UE, Ranchos Functional Test for UE, Motor Activity Log, Box and Blocks Test | Grip strength | | | | | | |
| Saposnik 2010 | Abbreviated Wolf Motor Function Test | Box and Block Test, grip strength (kg) | — | — | — | — | — | Stroke Impact Scale (hand function, composite function, perception of recovery) |
| Saposnik 2016 | Abbreviated Wolf Motor Function Test, Box and Block Test | Grip strength | | | | | Functional Independence Measure, Barthel Index, Modified Rankin Scale | Stroke Impact Scale |
| Shin 2014 | Fugl Meyer UE | — | — | — | — | — | Modified Barthel Index | — |
| Shin 2015 | Fugl Meyer UE | | | | | | | SF36 |
| Sin 2013 | Fugl Meyer UE, Box and Block Test | | — | — | — | — | — | — |
| Song 2015 | | | Timed Up and Go Test, 10‐minute walk test | Balance (Biofeedback system) | | | | |
| Standen 2011 | Wolf Motor Function Test, Motor Activity Log, Nine Hole Peg Test | | — | — | — | — | Nottingham Extended Activities of Daily Living Scale | |
| Subramanian 2013 | Fugl Meyer UE, Wolf Motor Function test, Reaching performance scale for stroke, Motor Activity Log | — | — | — | — | — | — | |
| Sucar 2009 | Fugl Meyer UE Scale, Upper Limb Motricity Index | — | — | — | — | — | — | — |
| Thielbar 2014 | Action Research Arm Test, Jebsen Taylor Hand Function Test, Fugl Meyer UE | Grip strength | | | | | | |
| Ucar 2014 | | | Timed walking speed test, Timed Up and Go | | | Mini Mental State Examination | | Functional Ambulation Category |
| Xiang 2014 | | | 10‐m walking speed, Fugl Meyer (LE) | Brunel Balance Assessment | | | | |
| Yang 2008 | — | — | Walking speed, Community Walk Test | — | — | — | — | Walking Ability Questionnaire, Activities Specific Balance Confidence Scale |
| Yang 2011 | — | — | Gait analysis data | Balance analysis data | — | — | — | — |
| Yavuzer 2008 | Brunnstrom Upper Extremity Stages | Brunnstrom Hand Stages | — | — | — | — | Functional Independence Measure self‐care section | — |
| Yin 2014 | Fugl Meyer, Action Research Arm Test, Motor Activity Log | | | | | | Functional Independence Measure | |
| You 2005 | — | — | Functional ambulation category | — | Modified Motor Assessment Scale | — | — | — |
| Zucconi 2012 | Fugl Meyer UE, Reaching performance scale | — | — | — | — | — | Functional Independence Measure | — |