مصرف پروفیلاکتیک ویتامین K برای پیشگیری از خونریزی ناشی از کمبود ویتامین K در نوزادان نارس
چکیده
پیشینه
ویتامین K برای سنتز عوامل انعقادی ضروری است. نوزادان ترم، به خصوص نوزادانی که بهطور انحصاری با شیر مادر تغذیه میشوند، کمبود ویتامین K دارند و در نتیجه ممکن است خونریزی ناشی از کمبود ویتامین K؛ (vitamin K deficiency bleeding; VKDB) داشته باشند. نوزادان پرهترم به دلیل تاخیر در کلونیزاسیون (colonization) سیستم گوارشی و میکروفلورهای تولید کننده ویتامین K و همچنین عملکرد هپاتیک و هموستاتیک نارس، بهطور بالقوه در معرض خطر بالایی برای VKDB قرار دارند.
اهداف
تعیین تاثیر مصرف پروفیلاکسی ویتامین K در پیشگیری از خونریزی ناشی از کمبود ویتامین K؛ (VKDB) در نوزادان پرهترم.
روشهای جستوجو
ما از استراتژی جستوجوی استاندارد گروه نوزادان در کاکرین برای جستوجو در پایگاه ثبت مرکزی کارآزماییهای کنترل شده کاکرین (CENTRAL؛ شماره 11، 2016)؛ MEDLINE via PubMed (از 1966 تا 5 دسامبر 2016)؛ Embase (از 1980 تا 5 دسامبر 2016) و CINAHL (از 1982 تا 5 دسامبر 2016) استفاده کردیم. همچنین بانکهای اطلاعاتی کارآزماییهای بالینی، خلاصه مقالات کنفرانسها و فهرست منابع مقالات بازیابی شده را جستوجو کردیم.
معیارهای انتخاب
کارآزماییهای تصادفیسازی و کنترل شده (randomised controlled trials; RCTs) یا شبه‐RCTهایی درباره هر نوع شکل دارویی ویتامین K برای نوزادان پرهترم.
گردآوری و تجزیهوتحلیل دادهها
مطالعات بالقوه را ارزیابی کرده و دادهها را بر اساس توصیههای گروه نوزادان در کاکرین استخراج کردیم.
نتایج اصلی
هیچ مطالعه واجد شرایطی را نیافتیم که ویتامین K را با عدم درمان مقایسه کرده باشد.
یک مطالعه تجویز داخل وریدی (intravenous; IV) ویتامین K را با تزریق عضلانی (intramuscular; IM) آن و دوزهای مختلف ویتامین K را مقایسه کرد. سه نوع رژیم پروفیلاکتیک مختلف ویتامین K؛ (0.5 میلیگرم به صورت IM؛ 0.2 میلیگرم ویتامین K1، یا 0.2 میلیگرم به صورت IV) به نوزادان با سن بارداری کمتر از 32 هفته ارائه شد. با توجه به این که فقط یک مطالعه کوچک معیارهای ورود را داشت، کیفیت شواهد را برای پیامدهای بررسی شده پائین ارزیابی کردیم.
داخل عضلانی در برابر داخل وریدی
هیچ تفاوتی با اهمیت آماری در سطوح ویتامین K در گروه دریافت کننده 0.2 میلیگرم IV در مقایسه با نوزادان دریافت کننده 0.2 یا 0.5 میلیگرم ویتامین K به صورت IM (گروه کنترل) در روز 5 زندگی وجود نداشت. تا روز 25، سطوح ویتامین K1 در تمام گروهها کاهش یافت، اما نوزادان دریافت کننده 0.5 میلیگرم ویتامین K عضلانی سطوح بالاتری از ویتامین K1 نسبت به گروه دریافت کننده 0.2 میلیگرم IV یا گروه دریافت کننده 0.2 میلیگرم IM داشتند.
سطح ویتامین K1 اپوکساید 2,3 (ویتامین K1O) در نوزادان دریافت کننده 0.2 میلیگرم IV تفاوت آماری با نوزادان گروه کنترل در روز 5 یا 25 مطالعه نداشت. تمام نوزادان دارای سطوح طبیعی یا سوپرافیزیولوژیک (supraphysiologic) غلظت ویتامین K1 بودند یا مقدار قابل تشخیص یا ناچیز پروترومبین (prothrombin) ناشی از نبود ویتامین K – II؛ (PIVKA II) نداشتند.
مقایسه دوزها
سطوح ویتامین K1 و سطوح ویتامین K1O در روز 5 در گروه 0.2 میلیگرم IM بهطور معنیداری کمتر از گروه 0.5 میلیگرم IM بود. در روز 25، سطوح ویتامین K1O و سطوح ویتامین K1 در گروه 0.2 میلیگرم IM و گروه 0.5 میلیگرم IM تفاوت معنیداری نداشت. وجود پروتئینهای PIVKA II در گروه 0.2 میلیگرم IM در برابر گروه 0.5 میلیگرم IM در روز 5 یا 25 مطالعه تفاوت معنیداری نداشت.
نتیجهگیریهای نویسندگان
نوزادان پرهترم دارای سطوح ویتامین K پائینی هستند و پروتئین PIVKA قابل تشخیص طی هفته اول زندگی به وجود میآید. علیرغم اینکه این نوزادان در معرض خطر VKDB قرار دارند، مطالعهای وجود ندارد که ویتامین K را در برابر عدم درمان مقایسه کند و مطالعات اندکی استراتژیهای بالقوه مصرف آن را برای درمان موثر بررسی کردند. مطالعات دوزاژ نشان میدهند که ما در حال حاضر دوزهایی را از ویتامین K به نوزادان پرهترم ارائه کردیم که منجر به سطوح سوپرافیزیولوژیک شد. به علت عدم قطعیت فعلی، پزشکان باید دادههای به دست آمده از نوزادان ترم را به نوزادان پرهترم تعمیم دهند. از آنجا که هیچ شواهدی وجود ندارد که نشان دهد ویتامین K مضر یا بیاثر است و از آنجایی که ویتامین K یک داروی ارزان است، به نظر میرسد باید از توصیههای متخصص نوزادان پیروی کرده و ویتامین K را به نوزادان پرهترم ارائه کرد. با این حال، انجام پژوهش بیشتری در مورد دوز و روش مناسب تجویز ضروری است.
PICO
خلاصه به زبان ساده
مصرف پروفیلاکتیک ویتامین K برای پیشگیری از خونریزی ناشی از کمبود ویتامین K در نوزادان نارس
سوال مطالعه مروری
آیا مصرف پروفیلاکسی ویتامین K در پیشگیری از خونریزی ناشی از کمبود ویتامین K؛ (vitamin K deficiency bleeding; VKBD) در نوزادان پرهترم موثر است؟
پیشینه
نوزادان پرهترم به علت تاخیر در تغذیه و بنابراین، تاخیر در کلونیزاسیون (colonization) روده با باکتری تولید کننده ویتامین K و همچنین نارسایی عملکرد کبد و عملکرد لخته شدن خون، بهطور بالقوه در معرض خطر بالای VKBD قرار دارند. نوزادان پرهترم بهطور معمول ویتامین K پروفیلاکتیک را از طریق راههای داخل وریدی یا عضلانی دریافت میکنند.
ویژگیهای مطالعه
در جستوجویی که تا 5 دسامبر 2016 کامل شد، هیچ مطالعهای را در مورد نوزادان پرهترم نیافتیم که مصرف پروفیلاکتیک ویتامین K را با عدم درمان مقایسه کند و فقط یک مطالعه دوز و روش تجویز ویتامین K را مقایسه کرد.
نتایج کلیدی
یک مطالعه معیارهای ورود به مطالعه را داشت و دوز و روش تجویز را مقایسه کرد. این مطالعه نشان میدهد که هر دو روش داخل وریدی و عضلانی در دستیابی به سطوح قابل اندازهگیری ویتامین K کافی هستند و دوز پائین 0.2 میلیگرم منجر به سطوح قابل اندازهگیری ویتامین K، بدون شواهدی از وجود پروتئین ناشی از کمبود ویتامین K میشود. برای تعیین بهترین دوز و روش تجویز ویتامین K به نوزادان پرهترم، انجام مطالعات بیشتر با کیفیت بالا مورد نیاز است.
کیفیت شواهد
شواهد با کیفیت پائین.
Authors' conclusions
Summary of findings
| Intramuscular vitamin K versus intravenous vitamin K | |||||
| Patient or population: preterm infants | |||||
| Outcomes | Anticipated absolute effects* (95% CI) | Relative effect | Number of participants | Quality of the evidence | |
| Risk with prophylactic IV vitamin K treatment | Risk with prophylactic IM vitamin K | ||||
| Bleeding complications: | Study population | RR 7.00 | 52 | ⊕⊕⊝⊝ | |
| 0 per 1000 | 0 per 1000 | ||||
| Bleeding complications: | Study population | RR 0.81 | 54 | ⊕⊕⊝⊝ | |
| 143 per 1000 | 116 per 1000 | ||||
| Intraventricular hemorrhage > Grade II: | Study population | RR 2.00 | 52 | ⊕⊕⊝⊝ | |
| 38 per 1000 | 77 per 1000 | ||||
| Intraventricular hemorrhage > Grade II: | Study population | RR 0.72 | 54 | ⊕⊕⊝⊝ | |
| 107 per 1000 | 77 per 1000 | ||||
| Presence of PIVKA II at day 5: | Study population | RR 1.52 | 60 | ⊕⊕⊝⊝ | |
| 94 per 1000 | 143 per 1000 | ||||
| Presence of PIVKA II at day 5: | Study population | RR 2.07 | 57 | ⊕⊕⊝⊝ | |
| 69 per 1000 | 143 per 1000 | ||||
| Presence of PIVKA II at day 25: | Study population | RR 1.08 | 52 | ⊕⊕⊝⊝ | |
| 37 per 1000 | 40 per 1000 | ||||
| Presence of PIVKA II at day 25 ‐ 0.2 mg IV versus 0.5 mg IM | Study population | RR 1.04 | 51 | ⊕⊕⊝⊝ | |
| 38 per 1000 | 40 per 1000 | ||||
| Necrotizing enterocolitis ‐ 0.2 mg IV versus 0.2 mg IM | Study population | RR 1.00 | 52 | ⊕⊕⊝⊝ | |
| 77 per 1000 | 77 per 1000 | ||||
| Necrotizing enterocolitis: 0.2 mg IV versus 0.5 mg IM | Study population | RR 1.08 | 54 | ⊕⊕⊝⊝ | |
| 71 per 1000 | 77 per 1000 | ||||
| Sepsis: 0.2 mg IV versus 0.2 mg IM | Study population | RR 1.00 | 52 | ⊕⊕⊝⊝ | |
| 154 per 1000 | 154 per 1000 | ||||
| Sepsis: 0.2 mg IV versus 0.5 mg IM | Study population | RR 0.86 | 54 | ⊕⊕⊝⊝ | |
| 179 per 1000 | 154 per 1000 | ||||
| Mortality (all infants): | Study population | RR 1.32 | 67 | ⊕⊕⊝⊝ | |
| 206 per 1000 | 272 per 1000 | ||||
| Mortality (all infants): 0.2 mg IV versus 0.5 mg IM | Study population | RR 2.82 | 64 | ⊕⊕⊝⊝ | |
| 97 per 1000 | 273 per 1000 | ||||
| *The risk in the intervention group (and its 95% CI) is based on the assumed risk in the comparison group and the relative effect of the intervention (and its 95% CI). | |||||
| GRADE Working Group grades of evidence | |||||
| 1We downgraded by two levels due to the small sample size from one included trial. | |||||
| Higher dose vitamin K compared to lower dose vitamin K for preterm infants | ||||||
| Patient or population: preterm infants | ||||||
| Outcomes | Anticipated absolute effects* (95% CI) | Relative effect | Number of participants | Quality of the evidence | Comments | |
| Risk with lower dose vitamin K | Risk with higher dose vitamin K | |||||
| Bleeding complications: | Study population | RR 0.12 | 54 | ⊕⊕⊝⊝ | ||
| 143 per 1000 | 17 per 1000 | |||||
| Intraventricular hemorrhage > Grade II: | Study population | RR 0.36 | 54 | ⊕⊕⊝⊝ | ||
| 107 per 1000 | 39 per 1000 | |||||
| Presence of PIVKA II at day 5: | Study population | RR 1.36 | 61 | ⊕⊕⊝⊝ | ||
| 69 per 1000 | 94 per 1000 | |||||
| Presence of PIVKA II at day 25: | Study population | RR 0.96 | 53 | ⊕⊕⊝⊝ | ||
| 38 per 1000 | 37 per 1000 | |||||
| Necrotizing enterocolitis: | Study population | RR 1.08 | 54 | ⊕⊕⊝⊝ | ||
| 71 per 1000 | 77 per 1000 | |||||
| Sepsis: | Study population | RR 0.86 | 54 | ⊕⊕⊝⊝ | ||
| 179 per 1000 | 154 per 1000 | |||||
| Mortality (all infants): | Study population | RR 2.13 | 65 | ⊕⊕⊝⊝ | ||
| 97 per 1000 | 206 per 1000 | |||||
| *The risk in the intervention group (and its 95% CI) is based on the assumed risk in the comparison group and the relative effect of the intervention (and its 95% CI). | ||||||
| GRADE Working Group grades of evidence | ||||||
| 1We downgraded by two levels due to the small sample size from one included trial. | ||||||
Background
Description of the condition
Vitamin K is necessary for the synthesis of coagulation factors in the liver. The vitamin K‐dependent pro‐coagulation factors include factors II (prothrombin), VII, IX, and X, and the anticoagulation proteins C and S (Bovill 1993). Vitamin K dependent gamma glutamyl carboxylase activates the procoagulation factors and proteins C and S via carboxylation of the glutamic acid residues (Bovill 1993). During the carboxylation of these coagulation factors and proteins C and S, vitamin K is reduced to the 2,3 epoxide form. The epoxide form of vitamin K is then reconverted back to a usable cofactor for gamma glutamyl carboxylase by vitamin K epoxide reductase (VKOR) (Bovill 1993).
Newborn infants are deficient in vitamin K and consequently may have vitamin K deficiency bleeding (VKDB). In the normal adult human diet, vitamin K is derived from a variety of sources. Vitamin K2 (menaquinones), primarily provided by gut flora, makes up 90% of the vitamin K stores in the liver (Van Winckel 2009). Serum vitamin K in the form of vitamin K1 (phylloquinone) is primarily provided by dietary sources (Van Winckel 2009). However, the situation for newborn infants is different. Maternal transfer of vitamin K across the placenta is very low with cord blood levels of vitamin K often below the detection limit of 0.02 ng/mL in healthy newborns (Pilcher 2008). For numerous reasons, breast milk is the preferred dietary mainstay for all neonates; however, it has very low levels of vitamin K (Clarke 2006). Indeed, late onset VKDB is primarily seen in exclusively breast fed infants or in those with cholestatic disease.
Several studies have evaluated the levels of vitamin K dependent clotting factor in both term and preterm infants. Term infants at birth have approximately 50% of the serum levels of adults of factors II, VII, IX, and X (Pilcher 2008). Preterm infants are thought to have even lower levels than their term counterparts (Pilcher 2008).
If vitamin K is deficient, VKDB can occur as one of three distinct presentations: early, classical, or late (Clarke 2003). Early disease occurs in the first 24 hours of life and is associated with in utero exposure to anticonvulsant or anticoagulant medications (Clarke 2003). The bleeding associated with early disease usually is serious with intracranial bleeding being common (Clarke 2003). Classical disease is usually seen from days one to seven, primarily in breast fed infants who did not receive vitamin K prophylaxis at birth. Mucocutaneous bleeding is the most common manifestation of classical disease (Clarke 2003). Late onset VKDB is seen in infants older than one week of age. Common characteristics of affected infants include those with hepatic and gastrointestinal (GI) diseases that impair absorption of fat soluble vitamins. It may also occur in exclusively breast fed infants. Late onset VKDB typically presents with GI, cutaneous, or intracranial hemorrhage (Clarke 2003). Late onset VKDB has a 20% mortality rate and 50% of affected infants present with intracranial hemorrhage (Van Winckel 2009).
Preterm infants are of particular concern because of their relatively immature hepatic and hemostatic functions (Andrew 1988). The impact of these risk factors may be further compounded by co‐existing hepatic morbidity, delay of feeding, and subsequently delayed microflora colonization of the gastrointestinal tract and repeated exposure to antibiotics that further inhibit gut colonization and, therefore, endogenous synthesis of vitamin K2 (Clarke 2006). Recent studies have evaluated vitamin K levels after 0.5 mg IM or 1 mg IM administration and have found supraphysiological levels of vitamin K and elevated levels of vitamin K epoxide that may indicate the relative immaturity of the preterm liver (Bovill 1993; Kumar 2001; Van Winckel 2009).
Description of the intervention
Prophylactic administration of vitamin K to prevent VKDB has been in practice for decades in both term and preterm infants. A single dose (1.0 mg) of intramuscular (IM) vitamin K after birth is effective in the prevention of classic VKDB in term infants (Offringa 2000). Either IM or oral (1.0 mg) vitamin K prophylaxis improves biochemical indices of coagulation status at one to seven days. Neither IM nor oral vitamin K has been tested in randomized trials with respect to effect on late VKDB. Oral vitamin K, either as a single or multiple dose, has not been tested in randomized trials for its effect on either classic or late VKDB (Offringa 2000).
Concern has been voiced regarding the safety of vitamin K administration (Clarke 2003). This concern was associated with the original preparation that consisted of vitamin K emulsified in polyethoxylated castor oil and preserved with propylene glycol and phenol. The phenol in the preparation caused concern because of its potential tumorigenic capacity in animals (Clarke 2003). Newer micellar preparations are solubilized in natural components and can be administered either orally or IM (Clarke 2003). A systematic review of the literature did not reveal any increased risk of IM vitamin K administration and childhood cancer (Committee on Fetus and Newborn 2003), and the AAP continues to recommend 0.5 mg to 1 mg IM of prophylactic vitamin K at birth to prevent early, classical, and late VKDB in term infants (Committee on Fetus and Newborn 2003).
The recommendations for the use of vitamin K in preterm infants are less clear. VKDB in preterm infants has not been extensively discussed in the literature. In part, this may be because most preterm infants admitted to neonatal intensive care units are given prophylactic vitamin K (often without parental input) and because parenteral nutrition is started early in the hospital course and provides preterm infants with more than enough vitamin K. However, there are a variety of reasons to believe that preterm infants may be at greater risk of VKDB and that this bleeding may be of greater consequence, particularly regarding the risk of intraventricular hemorrhage.
The antenatal administration of vitamin K to mothers in preterm labor to prevent periventricular and intraventricular hemorrhage has been studied (Pomerance 1987; Morales 1988; Yang 1989; Dickson 1994; Liu 2006). In a systematic review of the literature, Crowther 2010 found no benefit to antenatal vitamin K administration to preterm infants.
How the intervention might work
In the absence of vitamin K, the liver will synthesize inactive precursor proteins known as proteins induced by vitamin K absence (PIVKA). Because vitamin K is fat‐soluble, it can only be absorbed from the intestine in the presence of bile salts. The body's capacity to store vitamin K is very low and the half‐life of the vitamin K‐dependent coagulation factors is short (Zipursky 1999). Therefore, vitamin K deficiency can occur quickly if vitamin K intake is not sufficient.
PIVKA proteins are often measured to determine the presence of subclinical vitamin K deficiency. The presence of under‐carboxylated prothrombin (prothrombin induced by vitamin K absence‐II (PIVKA II)) is a useful marker of vitamin K deficiency. The level of PIVKA II increases as the severity of deficiency increases and can be detected subclinically before coagulopathy from vitamin K deficiency becomes a clinical problem (Kumar 2001; Van Winckel 2009). Plasma PIVKA II is elevated at birth in 47% of term infants (Greer 1998). In preterm infants < 36 weeks' gestation, PIVKA II was detected in 27.5% of cord blood samples (Kumar 2001). In the cord blood samples from both term and preterm infants, vitamin K is virtually undetectable; yet, PIVKA II is only elevated in 10% to 50% of cord blood samples (Greer 1998; Kumar 2001). In a re‐evaluation of infants at two and six weeks of age and 40 weeks' postmenstrual age, no detectable PIVKA II levels were found and adequate levels of plasma vitamin K were noted (Kumar 2001). In a study which evaluated 23 preterm infants who did not receive vitamin K at birth, only 1% had evidence of PIVKA in cord blood; however, at seven days of life 65% had developed detectable levels of PIVKA II (Ogata 1988).
PIVKA protein C has also been studied and has been shown to increase with increasing gestational age (Bovill 1993). One third of term infants had detectable levels of PIVKA protein C (Bovill 1993). In term infants with detectable levels of PIVKA protein C, PIVKA protein C contributed substantially to total protein C levels indicating that most detectable protein C was non‐functional (Bovill 1993). Despite having total protein C levels at one‐third the level of adults and that this protein largely consisted of decarboxylated, non‐functional protein C, there did not appear to be any clinically significant thrombotic events in any of the infants (Bovill 1993). Preterm infants have less total prothrombin and total protein C levels than term infants (Bovill 1993). However, no data are available on PIVKA C in preterm infants.
Other tests have also been used as potential markers of vitamin K deficiency. Echis carinatus venom contains proteases that activate both functional and non‐functional (decarboxylated) prothrombin (PIVKA II) (Solano 1990). Echis coagulation time is total factor II activity including PIVKA II (Kurata 2005). Echis time is usually normal in the presence of PIVKA II associated with vitamin K deficiency (Solano 1990). Calculation of a PT/Echis ratio may help to determine if vitamin K deficiency exists. In adults, Solano 1990 found that 90% of patients with a PT/Echis ratio of less than 1.3 and a prolonged Echis time did not correct their PTs with vitamin K administration. A PT/Echis ratio of greater than 1.3 with a PT of greater than 1.5 has been used to assess vitamin K deficiency, with the caveat that this measurement is indirect and only validated by correction of these parameters by vitamin K administration (O'Shaughnessy 2005).
An elevated prothrombin (PT) time (which is a measure of the activity of the vitamin K dependent coagulation factors) of ≥ four times control values and an INR > 4 with normal platelets and normal fibrinogen suggests VKDB, with confirmation of the diagnosis by administration of vitamin K and a rapid normalization of coagulation studies or the presence of PIVKA, or both. In a study of 13 preterm infants with prolonged PT, none of them were vitamin K‐deficient nor did they have elevated PIVKA II levels (Clarke 2005).
Why it is important to do this review
There are no clear guidelines regarding dosing and route of vitamin K administration to achieve both safe and effective levels of vitamin K in the preterm infant with a wide variation in practice between neonatal intensive care units (NICU). Published recommendations for daily vitamin K intake in preterm infants are arbitrary and range from 5 to 100 µg/kg/day (Kumar 2001). A study comparing vitamin K levels in preterm infants at two weeks of life versus 40 weeks' postmenstrual age showed higher plasma levels of vitamin K at two weeks of life and recommended a prophylactic vitamin K dose of 0.3 mg/kg IM for extremely low birth weight (ELBW) infants (Kumar 2001). In 2003, Clarke et al surveyed 30 NICUs in northwest England regarding the dose and route of prophylactic vitamin K administration (Clarke 2003). Doses varied from 0.2 mg to 1 mg given IM, IV or orally depending on gestational age or birthweight, or both (Clarke 2003). In a later study, Clark and coworkers evaluated the effects of vitamin K in preterm infants with a prolonged PT (Clarke 2005). Three different prophylactic regimes of vitamin K were given to infants less than 32 weeks' gestation (0.5 IM, 0.2 mg IM, or 0.2 mg IV) (Clarke 2005). All of the infants had normal or supraphysiologic levels of vitamin K1 concentrations and either no detectable or insignificant amounts of PIVKA II, suggesting that a prolonged PT in the first month of life is unlikely to be due to vitamin K deficiency (Clarke 2005).
Objectives
Primary objective
To determine the effect of vitamin K prophylaxis in the prevention of vitamin K deficiency bleeding (VKDB) in preterm infants.
Main comparisons
-
Vitamin K (via any route of administration) versus no vitamin K:
-
IM vitamin K versus no vitamin K;
-
oral vitamin K versus no vitamin K.
-
-
IM vitamin K versus oral vitamin K.
-
IM vitamin K versus intravenous (IV) vitamin K.
-
Dosage of vitamin K (post hoc analysis added after literature review).
Subgroup analyses will include studies that used single versus multiple doses of vitamin K and studies of different vitamin K preparations (vitamin K1 (phylloquinone), vitamin K2 (menaquinone), or vitamin K3 (menadione)) and gestational age (< 30 weeks, < 34 weeks).
Methods
Criteria for considering studies for this review
Types of studies
Randomized controlled trials (RCTs) or quasi‐RCTs.
Types of participants
Preterm infants (gestational age < 37 weeks).
Types of interventions
We considered Vitamin K prophylaxis given to preterm neonates. All preparations (i.e. vitamin K1, K2, K3, and mixed micellar vitamin K), routes (IM, oral, IV) and dose schedules (single or multiple, dose range) for inclusion if administered prior to evidence of VKDB.
-
Vitamin K (via any route of administration) versus no vitamin K:
-
IM vitamin K versus no vitamin K;
-
oral vitamin K versus no vitamin K.
-
-
IM vitamin K versus oral vitamin K.
-
IM vitamin K versus intravenous (IV) vitamin K.
-
Dosage of vitamin K (post hoc analysis added after literature review).
Types of outcome measures
Primary outcomes
-
Any bleeding (as reported by investigators):
-
during the first week of life;
-
after the first week of life;
-
-
any severe bleeding requiring immediate transfusion:
-
during the first week of life;
-
after the first week of life;
-
-
gastrointestinal bleeding (as reported by investigators):
-
during the first week of life;
-
after the first week of life;
-
-
intracranial bleeding (as reported by investigators):
-
during the first week of life;
-
after the first week of life.
-
Secondary outcomes
Secondary outcome measures included laboratory values (in first week of life, after first week of life) and potential adverse effects of vitamin K prophylaxis.
-
Plasma vitamin K1 levels;
-
evidence of PIVKA proteins;
-
evidence of PIVKA II, PIVKA II levels;
-
evidence of PIVKA C, PIVKA C levels;
-
activity of clotting factors II, VII, and X;
-
prothrombin time and index;
-
partial thromboplastin time;
-
prothrombin (antigen);
-
Echis factor II;
-
ratio factor II/ Echis II;
-
plasma bilirubin levels;
-
Vitamin K1 2,3‐epoxide¹;
-
necrotizing enterocolitis¹;
-
sepsis¹;
-
mortality¹;
-
neurodevelopmental status at 18 to 24 months¹.
¹added post hoc.
Search methods for identification of studies
We used the criteria and standard methods of Cochrane and Cochrane Neonatal (see the Cochrane Neonatal search strategy for specialized register).
Electronic searches
We conducted a comprehensive search including: the Cochrane Central Register of Controlled Trials (CENTRAL 2016, Issue 11) in the Cochrane Library; MEDLINE via PubMed (1966 to 5 December 2016); Embase (1980 to 5 December 2016); and CINAHL (1982 to 5 December 2016) using the following search terms: (vitamin K OR menadione OR phylloquinone OR phytomenadione), plus database‐specific limiters for RCTs and neonates (see Appendix 1 for the full search strategies for each database). We did not apply language restrictions.
We searched clinical trials registries for ongoing or recently completed trials (clinicaltrials.gov); the World Health Organization (WHO) International Clinical Trial Registry Platform (ICTRP) (www.whoint/ictrp/search/en/), and the ISRCTN Registry (https://www.isrctn.com/).
Searching other resources
We also searched the reference lists of any articles selected for inclusion in this review in order to identify additional relevant articles.
Data collection and analysis
Selection of studies
We used the standard methods of Cochrane Neonatal. We included all RCTs and quasi‐RCTs that fulfilled the selection criteria. Two review authors (RS and CO) independently reviewed the search results and selected studies for inclusion. We resolved any disagreement by discussion.
Data extraction and management
Two review authors (SA and RS) used standard data forms to separately extract, assess, and code all data for each included study including information regarding the method of randomization, blinding, drug intervention, stratification, and whether the trial was single center or multicenter. Information regarding trial participants including gestational age criteria, birth weight criteria, and other inclusion or exclusion criteria was collected.
If available, we analyzed information on clinical outcome including the incidence and timing of any bleeding, gastrointestinal bleeding, and intracranial bleeding (during the first week of life or after the first week of life). Proposed secondary outcome measures included laboratory values and potential adverse effects of vitamin K prophylaxis (plasma vitamin K1 levels, evidence of PIVKA proteins, evidence of PIVKA II, PIVKA II levels, evidence of PIVKA C, PIVKA C levels, activity of clotting factors II, VII and X, prothrombin time and index, partial thromboplastin time, prothrombin (antigen), Echis factor II, ratio factor II/ Echis II, plasma bilirubin levels, and evidence of muscular hematoma).
If appropriate, we replaced any standard error of the mean with the corresponding standard deviation.
For each study, one review author (RS) entered the data into Review Manager 5 (RevMan 5) (RevMan 2014), and a second review author (SA) checked for accuracy. We resolved discrepancies through discussion or, if required, we consulted a third review author.
If information regarding any of the above was unclear, we contacted the authors of the original reports to provide further details.
Assessment of risk of bias in included studies
Two review authors (RS and SA) independently assessed the risk of bias (low, high, or unclear) of all included trials using the Cochrane ‘Risk of bias’ tool (Higgins 2011) for the following domains:
-
sequence generation (selection bias);
-
allocation concealment (selection bias);
-
blinding of participants and personnel (performance bias);
-
blinding of outcome assessment (detection bias);
-
incomplete outcome data (attrition bias);
-
selective reporting (reporting bias);
-
any other bias.
We resolved any disagreements by discussion or by consulting a third review author. See Appendix 2 for a more detailed 'Risk of bias' description for each domain.
Measures of treatment effect
We performed statistical analyses using RevMan 5 software (RevMan 2014). We analyzed dichotomous data using risk ratio (RR), risk difference (RD), and the number needed to treat for an additional beneficial outcome (NNTB) or the number needed to treat for an additional harmful outcome (NNTH). We analyzed continuous data using mean difference (MD). We used the standardized mean difference to combine trials that measured the same outcome but used different methods. We reported the 95% confidence Interval (CI) on all estimates.
Unit of analysis issues
We planned to analyses the data as proportion of neonates having one or more episodes for clinical outcomes such as episodes of bleeding.
Dealing with missing data
We noted the levels of attrition for included studies. We explored the impact of including studies with high levels of missing data in the overall assessment of treatment effect by using sensitivity analysis.
We analysed all outcomes on an intention‐to‐treat basis, i.e. included all participants randomized to each group in the analyses. The denominator for each outcome in each trial was the number randomized minus any participants whose outcomes were known to be missing.
Assessment of heterogeneity
If multiple trials were identified, we planned to examine heterogeneity between trials by inspecting the forest plots and quantifying the impact of heterogeneity using the I2 statistic. We planned to explore the possible causes of statistical heterogeneity using prespecified subgroup analysis (e.g. differences in study quality, participants, intervention regimens). We planned to use a fixed‐effect model for meta‐analysis.
Assessment of reporting biases
If multiple eligible trials were found, we planned to assess possible publication bias and other biases using symmetry/asymmetry of funnel plots.
For included trials that were recently performed (and therefore prospectively registered), we planned to explore possible selective reporting of study outcomes by comparing the primary and secondary outcomes in the reports with the primary and secondary outcomes identified at the time of trial registration, using the websites www.clinicaltrials.gov and www.controlled‐trials.com. If discrepancies were found, we planned to contact the primary investigators to obtain missing data on outcomes prespecified at trial registration.
Data synthesis
Where we judged meta‐analysis to be appropriate, we conducted the analysis using RevMan 5 software (RevMan 2014). For estimates of typical relative risk and risk difference, we planned to use the Mantel‐Haenszel method. For measured quantities, we planned to use the inverse variance method. We planned to conduct all meta‐analyses using the fixed‐effect model.
Quality of the evidence
We used the Grading of Recommendations Assessment, Development and Evaluation (GRADE) approach, as outlined in the GRADE Handbook (Schünemann 2013), to assess the quality of evidence for the following (clinically relevant) outcomes:
-
any bleeding (as reported by investigators) during the first week of life or after the first week of life;
-
any severe bleeding requiring immediate transfusion during the first week of life or after the first week of life;
-
gastrointestinal bleeding (as reported by investigators) during the first week of life or after the first week of life;
-
intracranial bleeding (as reported by investigators) during the first week of life or after the first week of life;
-
mortality; and
-
biochemical evidence of vitamin K deficiency (presence of PIVKA proteins).
Two review authors (SA and RS) independently assessed the quality of the evidence for each of the outcomes above. We considered evidence from RCTs as high quality evidence but downgraded the quality of the evidence by one level for serious (or two levels for very serious) limitations based upon the following: design (risk of bias), consistency across studies, directness of the evidence, precision of estimates, and presence of publication bias. We used the GRADEpro Guideline Development Tool to create a ‘Summary of findings’ table to report the quality of the evidence (GRADEpro GDT 2015).
The GRADE approach results in an assessment of the quality of a body of evidence in one of four grades:
-
high: we are very confident that the true effect lies close to that of the estimate of the effect;
-
moderate: we are moderately confident in the effect estimate: the true effect is likely to be close to the estimate of the effect, but there is a possibility that it is substantially different;
-
low: our confidence in the effect estimate is limited: the true effect may be substantially different from the estimate of the effect;
-
very low: we have very little confidence in the effect estimate: the true effect is likely to be substantially different from the estimate of effect.
Subgroup analysis and investigation of heterogeneity
Main comparisons
-
Vitamin K (via any route of administration) versus no vitamin K;
-
IM vitamin K versus no vitamin K;
-
oral vitamin K versus no vitamin K;
-
IM vitamin K versus oral vitamin K;
-
IM vitamin K versus IV vitamin K;
-
dosage of vitamin K (post hoc analysis).
Planned subgroup analyses included studies that used single versus multiple doses of vitamin K, vitamin K preparations (vitamin K1 (phylloquinone) vitamin K2 (menaquinone) or vitamin K3 (menadione)) and gestational age (< 30 weeks, < 34 weeks).
We clearly noted any post‐facto subgroup analyses, e.g. to explore unanticipated sources of heterogeneity.
Sensitivity analysis
We planned to undertake sensitivity analyses to determine if the findings were affected by including only studies of adequate methodology (low risk of bias), defined as adequate randomization and allocation concealment, blinding of intervention and measurement, and less than 10% loss to follow‐up. Since only one study met the inclusion criteria, we did not perform any sensitivity analysis.
Results
Description of studies
Results of the search
We identified 899 records through searching after the duplicates were removed. Of these, we reviewed 7 full‐text articles. See our PRISMA study flow diagram (Figure 1) for a description of our searches and study selection.
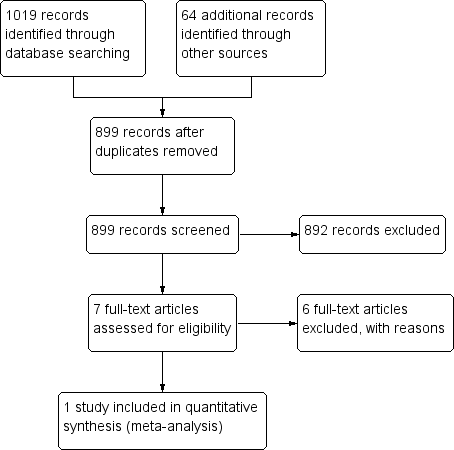
PRISMA flow diagram
Included studies
Vitamin K (via any route of administration) versus no vitamin K
We did not identify any eligible studies.
Intramuscular vitamin K versus no vitamin K
We did not identify any eligible studies.
Oral vitamin K versus no vitamin K
We did not identify any eligible studies.
Intramuscular vitamin K versus oral vitamin K
We did not identify any eligible studies.
Intramuscular vitamin K versus intravenous vitamin K
We included one study that compared IM to IV vitamin K in preterm infants (Clarke 2006).
Eligible infants were < 32 weeks' gestational age. Exclusion criteria included fetal intracranial hemorrhage, maternal antiplatelet antibody, maternal drug treatment with known vitamin K antagonists, major congenital anomalies, and marked bruising at birth. During the study period they identified 152 eligible infants of whom 98 were randomized.
Eligible infants were randomly assigned to receive one of three regimens of vitamin K prophylaxis (0.5 mg IM, 0.2 mg IM, 0.2 mg IV). For the purpose of this comparison, we compared both groups that received IM vitamin K to the single group that received IV vitamin K (the 0.2 mg IM (N = 34) dose to the 0.2 mg IV dose (N = 33) as well as the 0.5 mg IM dose (N = 31) to the 0.2 mg IV dose (N = 33).
A computer generated allocation sequence using variable block sizes of six and 12 was used to randomize the infants. The allocated regimen was sealed in an opaque envelope. All patients were randomized at a single lead center. Infants recruited at outside hospitals were randomized by telephoning the lead unit who then faxed confirmation of allocation to the outside center.
The vitamin K preparation used was Konakion Neonatal (Roche Ltd, Basel, Switzerland) which has phytomenadione (2 mg/mL) solubilized in Cremophor EL. The allocated vitamin K regimen was prescribed by the attending physician and given either by medical or nursing staff as soon as possible after admission. One rescue dose of vitamin K 0.2 mg IM was given to any infant who, at any time, had an abnormal coagulation test (prolonged PT beyond the 95 percentile preterm reference for age) or clinical signs of bleeding.
Outcomes measured included serum vitamin K1 levels, vitamin Vitamin K1 2,3‐epoxide (K10) and PIVKA II. Vitamin K1 and vitamin K1O were measured using high performance liquid chromatography on day 5 and day 25 of life. Vitamin K1 levels in the enrolled infants were compared to levels in adults (0.17 to 0.68 ng/mL, if fasting, 0.15 to 1.55 ng/mL in non‐fasting). There are no adult reference values for vitamin K1O because it is not a normal metabolite of healthy adults. PIVKA II levels were evaluated on cord blood samples and serum samples on day 5 and day 25 of life. PIVKA II was measured using enzyme‐linked immunosorbent assay using a conformation specific monoclonal antibody that selectively binds under‐carboxylated species of prothrombin. PIVKA II levels of less than 1 arbitrary units/mL were considered clinically insignificant.
Secondary outcome measures were PT and factor II (FII) concentrations measured on citrated plasma on day 5 and at full feeds. PT was measured using a semi‐automated coagulation analyzer.
At day 5 there were 90 valid samples and at day 25 there were 80 valid samples for all three treatment groups.
Dosage of vitamin K (post hoc analysis)
Clarke 2006 included a comparison of two doses of IM vitamin K (0.2 mg IM and 0.5 mg IM).
In addition, as part of this trial, Clarke published an observational substudy which quantified the proportional and total phylloquinone intakes of preterm infants within the neonatal period from all sources (Clarke 2006).
Excluded studies
We excluded six studies after full‐text assessment from this review (Ogata 1988; Vakrilova 1995; Rossi 1996; Kumar 2001; Costakos 2003) (see the 'Characteristics of excluded studies' table).
Rossi 1996 studied prothrombin time before and after changes in recommendations for vitamin K supplementation. Although they included preterm infants, assignment to the new dosage recommendations was not based on random allocation.
Costakos 2003 studied infants 22 to 32 weeks' gestational age born to mothers who wished to breast feed. Group 1 received 1 mg of vitamin K and Group 2 received 0.5 mg of vitamin K. Eighty‐one infants 22 to 32 weeks' gestation were admitted to their NICU during the time period of the study. Treatment assignment was based on physician choice. The more immature and lowest birth weight infants tended to get the lower dose of vitamin K.
Kumar 2001 assessed vitamin K status in preterm infants (≤ 36 weeks' gestation) by measuring plasma vitamin K and plasma protein‐induced in vitamin K absence (PIVKA II) from birth until 40 weeks' postconceptional age. Preterm infants were divided at birth into groups by gestational age (group 1, ≤ 28 weeks; group 2, 29 to 32 weeks; group 3, 33 to 36 weeks). Supplemental vitamin K (1 mg IM) was administered at birth followed by 60 micro g/day (weight < 1000 grams) or 130 micro g/day (weight ≥ 1000 grams) via total parenteral nutrition. After hyperalimentation, most received vitamin K‐fortified enteral feedings with the remainder receiving unfortified breast milk. Blood was obtained for PIVKA II in cord blood and for PIVKA II and vitamin K at 2 weeks and 6 weeks after birth and at 40 weeks' post conception.
Ogata 1988 measured Factor II coagulant antigen (FII‐AG), the protein induced by vitamin K absence or antagonist II (PIVKA‐II), and coagulant activity (Normotest) in low birth weight infants. Infants whose Normotest levels were less than 30% at one day (group A) received vitamin K2, and the others whose Normotest levels were greater than 30% at one day (group B) were not treated.
Seydewitz 1984 studied infants that were preterm and/or small‐for‐date. Data on only the preterm infants included in the study were not available. Infants were randomized into two groups: one group received 1 mg IM vitamin K after a first plasma sample was obtained; the second group received 1 mg IM vitamin K after a second plasma sample was obtained (time between the first sampling and second sampling was 4 hours in one series and 24 hours in another series).
Vakrilova 1995 conducted a prospective study of newborn infants with birth weight below 2500 g comparing the effect of IM vitamin K to oral vitamin K for preventing hemorrhagic disease of the newborn. Additional comparison group included healthy term infants who had not received vitamin K. treatment assignment unclear.
Risk of bias in included studies
Allocation
The randomization process for Clarke 2006 had low risk of bias. Participants were randomized at a single center using a computer generated allocation sequence with variable block sizes of six and 12. There was low risk of selection bias as treatment allocation was sealed in an envelope and opened by the central coordination unit.
Blinding
It is unclear if caretakers were blinded to the treatment throughout the study duration.
Incomplete outcome data
There was some risk of attrition bias as only 82% of the enrolled infants completed the study.
Selective reporting
Although study protocols are not available for the included study of Clarke 2006, all clinically relevant outcomes are reported and it is unlikely that any selective reporting bias occurred.
Other potential sources of bias
There are no concerns regarding other potential sources of bias.
Effects of interventions
See: Summary of findings for the main comparison Intramuscular vitamin K versus intravenous vitamin K; Summary of findings 2 Higher dose vitamin K compared to lower dose vitamin K for preterm infants
Vitamin K (via any route of administration) versus no vitamin K
No eligible studies were identified.
Intramuscular vitamin K versus no vitamin K
No eligible studies were identified.
Oral vitamin K versus no vitamin K
No eligible studies were identified.
Intramuscular vitamin K versus oral vitamin K
No eligible studies were identified.
Intramuscular vitamin K versus intravenous vitamin K (Comparison 1)
One included study compared IM to IV vitamin K in preterm infants (Clarke 2006).
Primary outcome measures
Any bleeding (as reported by investigators), any severe bleeding requiring immediate transfusion, gastrointestinal bleeding, and intracranial bleeding (as reported by investigators) were not reported in the published article of Clarke in 2006; however, bleeding complications, and intracranial bleeding were discussed in his unpublished thesis (Clarke 2006: Clarke thesis, 2008). Rescue treatment for bleeding was discussed but not reported. Overall, in all three groups, 15 infants received an additional "rescue" dose of vitamin K, but this was based on biochemical markers (prolonged PT) and not clinical bleeding.
Bleeding complications (Outcome 1.1)
A total of 80 infants were assessed for bleeding complications (26 in the 0.2 mg IV group, 26 in the 0.2 mg IM group, and 28 in the 0.5 mg IM group) (Clarke 2006: Clarke thesis, 2008).
0.2 mg IV or 0.2 mg IM
Three of 26 in the 0.2 mg IV group and zero of 26 in the 0.2 mg IM had bleeding complications (RR 7.00, 95% CI 0.38 to 129.11; 1 study, 52 infants). These results are inconclusive given the small sample size and broad CI.
0.2 mg IV or 0.5 mg IM
Three of 26 in the 0.2 mg IV group and four of 28 in the 0.5 mg IM had bleeding complications (RR 0.81, 95% CI 0.20 to 3.27; 1 study, 54 infants). These results are inconclusive given the small sample size and broad CI.
Any IV Vitamin K (0.2 mg IV) versus any IM Vitamin K (0.2 mg IM and 0.5 mg IM)
There is no difference in the risk of bleeding complications noted when 0.2 mg IV is compared to either IM treatment group (RR 1.56, 95% CI 0.38 to 6.46; 1 study, 80 infants).
Intracranial bleeding (Outcome 1.2)
A total of 80 infants were analyzed for significant intracranial bleeding defined as > grade II intraventricular hemorrhage (26 in the 0.2 mg IV group, 26 in the 0.2 mg IM group, and 28 in the 0.5 mg IM group) (Clarke 2006: Clarke thesis, 2008).
0.2 mg IV or 0.2 mg IM
Two of 26 in the 0.2 mg IV group and one of 26 in the 0.2 mg IM had significant intraventricular hemorrhage (RR 2.00, 95% CI 0.19 to 20.72; 1 study, 52 infants). These results are inconclusive given the small sample size and broad CI.
0.2 mg IV or 0.5 mg IM
Two of 26 in the 0.2 mg IV group and three of 28 in the 0.5 mg IM had bleeding complications (RR 0.72, 95% CI 0.13 to 3.96; 1 study, 54 infants). These results are inconclusive given the small sample size and broad CI.
Any IV Vitamin K (0.2 mg IV) versus any IM Vitamin K (0.2 mg IM and 0.5 mg IM)
There is no difference in the risk of significant intracranial bleeding defined as > grade II intraventricular hemorrhage noted when 0.2 mg IV is compared to either IM treatment group (RR 1.04, 95% CI 0.20 to 5.31; 1 study, 80 infants).
Secondary outcome measures
PIVKA II (Outcomes 1.3 and 1.4)
PIVKA II was considered present in the blood of study participants if the blood concentration was ≥ 0.2 AU/mL (Clarke 2006). There were 90 infants that completed the study at day 5 (only 89/90 samples were analyzed for PIVKA II; 29 in the 0.5 mg IM group (control), 32 in the 0.2 mg IM group and 28 in the 0.2 mg IV group). (Figure 2)

Forest plot of comparison: 1 Intravenous versus intramuscular vitamin K, outcome: 1.3 Presence of PIVKA II at day 5.
Presence of PIVKA II at day 5 (Outcome 1.3) Figure 2
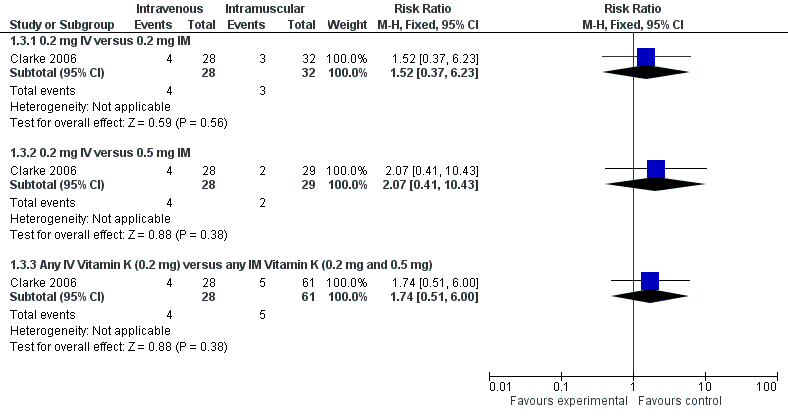
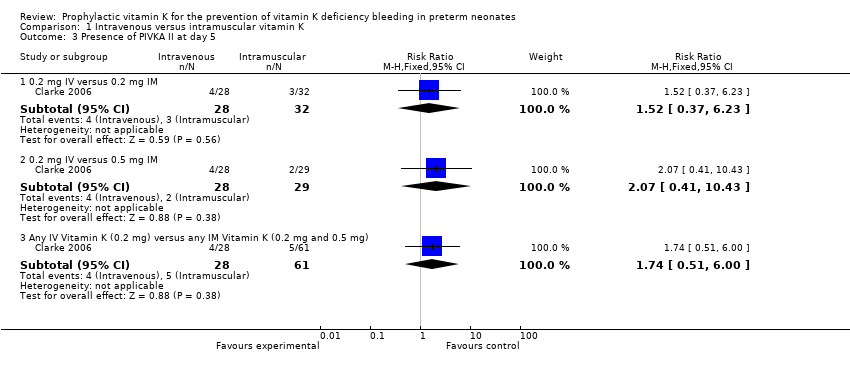
0.2 mg IV or 0.2 mg IM
Three of 32 in the 0.2 mg IM group and four of 28 infants in the 0.2 mg IV group had detectable levels of PIVKA II (RR 1.52, 95% CI 0.37 to 6.23; 1 study, 60 infants). These PIVKA II levels were not statistically different between the groups (medians 0.51 and 0.36 AU/mL, respectively) (Clarke 2006).
0.2 mg IV or 0.5 mg IM
Comparison of PIVKA II levels on day 5 between the 0.5 mg IM (N = 29) and the 0.2 mg IV (N = 28) groups were not significantly different; four of 28 in the 0.2 mg IV group and two of 29 in the 0.5 mg IM group had detectable PIVKA II levels (RR 2.07, 95% CI 0.41 to 10.43; 1 study, 57 infants) with medians of 0.36 and 0.62 AU/mL, respectively (Clarke 2006).
Any IV Vitamin K (0.2 mg IV) versus any IM Vitamin K (0.2 mg IM and 0.5 mg IM)
There is no difference in the risk of having detectable levels of PIVKA II at day 5 noted when 0.2 mg IV is compared to either IM treatment group (RR 1.74, 95% CI 0.51 to 6.00; 1 study, 89 infants).
Presence of PIVKA II at day 25 (Outcome 1.4)
On day 25 there were 80 infants still enrolled in the study; 28 in the 0.5 mg IM group, 26 in the 0.2 mg IM group and 26 in the 0.2 mg IV group. Of the 80, only 78 had documented PIVKA II assays performed.
0.2 mg IV or 0.2 mg IM
The 0.2 mg IM group (N = 27) and the 0.2 mg IV group (N = 25) did not show a statistically significant difference in PIVKA II level (medians 0.36 and 0.25 AU/mL, respectively). One of 27 in the 0.2 mg IM group and one of 25 in the 0.2 mg IV group had detectable PIVKA II levels (RR 1.08, 95% CI 0.07 to 16.36; 1 study, 52 infants) (Clarke 2006).
0.2 mg IV or 0.5 mg IM
There was no statistically significant difference in PIVKA II levels in the 0.5 mg IM (N = 26) and the 0.2 mg IV (N = 25) (medians 0.2 and 0.25 AU/mL, respectively) or in the presence of PIVKA II (RR 1.04, 95% CI 0.07 to 15.74; 1 study, 51 infants) (Clarke 2006).
Any IV Vitamin K (0.2 mg IV) versus any IM Vitamin K (0.2 mg IM and 0.5 mg IM)
There is no difference in the risk of having detectable levels of PIVKA II at day 25 noted when 0.2 mg IV is compared to either IM treatment group (RR 1.06, 95% CI 0.10 to 11.15; 1 study, 78 infants).
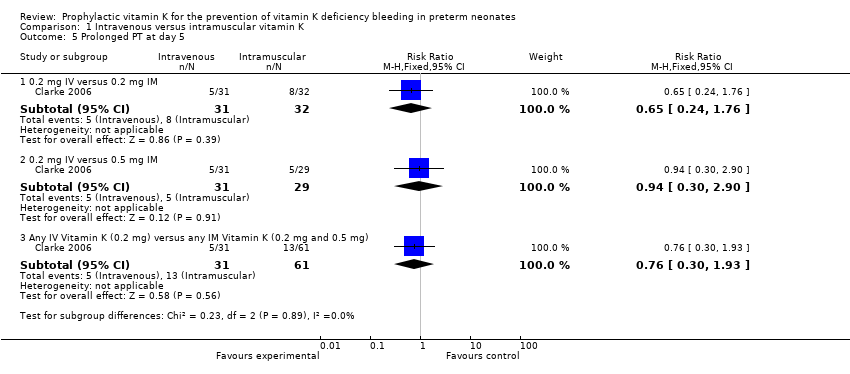
Prolonged prothrombin time (PT) (Outcome 1.5)
Prolonged PT at day 5 (Outcome 1.5)
On day 5 of the study, 92 samples were evaluated for PT (N = 20 in the 0.5 mg IM (control) group, N = 32 in the 0.2 mg IM group, and N = 31 in the 0.2 mg IV group).
0.2 mg IV or 0.2 mg IM
There was no statistically significant difference in PT values when comparing the 0.2 mg IM group (N = 32) to the 0.2 mg IV group (N = 31) (median PT values 13 versus 12.8 IU, respectively) or in the risk of infants having a prolonged PT at five days (RR 0.65, 95% CI 0.24 to 1.76; 1 study, 63 infants) (Clarke 2006).
0.2 mg IV or 0.5 mg IM
Comparison of the 0.5 mg IM group (control) with the 0.2 mg IV group did not reveal a statistically significant difference in PT values between the groups (median PT values 12.8 and 12.8 IU, respectively) or in the risk of infants having a prolonged PT at five days (RR 0.94, 95% CI 0.30 to 2.90; 1 study, 60 infants) (Clarke 2006).
Any IV Vitamin K (0.2 mg IV) versus any IM Vitamin K (0.2 mg IM and 0.5 mg IM)
There is no difference in the risk of having prolonged PT values at day 5 noted when 0.2 mg IV is compared to either IM treatment group (RR 0.76, 95% CI 0.30 to 1.93; 1 study, 92 infants).
Prolonged PT at day 25
On day 25 of the study a total of 83 infants (in all three groups) were evaluated for PT.
0.2 mg IV or 0.2 mg IM
There was no statistically significant difference in the median PT values for the 0.2 mg IM group (N = 28) and the 0.2 mg IV group (N = 26) (11.5 IU and 11.6 IU, respectively),
0.2 mg IV or 0.5 mg IM
There was no statistically significant difference in the median PT values for the 0.5 mg IM group (N = 29) and the 0.2 mg IV group (N = 26) (11.3 IU and 11.6 IU, respectively).
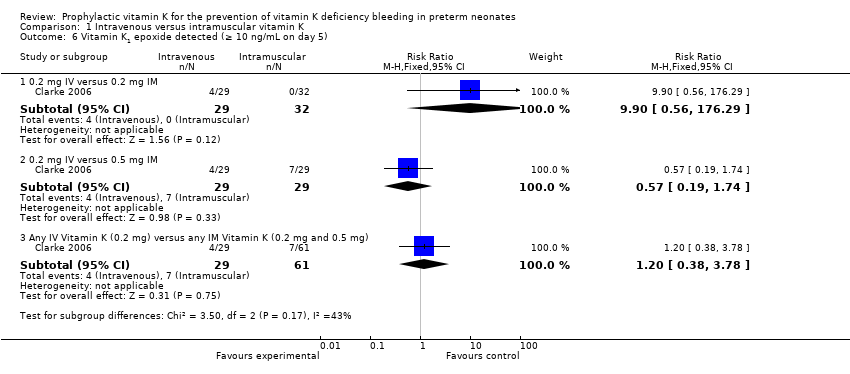
Vitamin K1 epoxide (Outcomes 1.6 and 1.7)
Vitamin K1 epoxide (K1O) detected (≥ 10 ng/mL) at day 5 (Outcome 1.6)
There were 90 infants that completed the study at day 5 (29 in the 0.5 mg IM group (control), 32 in the 0.2 mg IM group, and 29 in the 0.2 mg IV group). On day 5, study participants were considered to have vitamin K1O present if the level was ≥ 10 ng/mL.
0.2 mg IV or 0.2 mg IM
Comparison of vitamin K1O levels between the 0.2 mg IM (N = 32) and the 0.2 mg IV (N = 29) did not reach statistical significance (medians < 10 ng/mL and 33.6 ng/mL, respectively). There was no difference in the risk of having detectable vitamin K1O in the experimental group versus control group (RR 9.90, 95% CI 0.56 to 176.29; 1 study, 61 infants).
0.2 mg IV or 0.5 mg IM
In addition, the authors studied vitamin K1O levels in the 0.5 mg IM (N = 29) and the 0.2 mg IV (N = 29) groups. Seven of 29 infants in the 0.5 mg IM group and four of 29 infants in the 0.2 mg IV group had vitamin K1O levels ≥ 10 ng/mL at day 5 of the study (medians 30.8 ng/mL and 33.6 ng/mL, respectively). These levels were not statistically different (Clarke 2006). There was no difference in the risk of having detectable vitamin K1O in the experimental versus control group (RR 0.57, 95% CI 0.19 to 1.74; 1 study, 58 infants).
Any IV Vitamin K (0.2 mg IV) versus any IM Vitamin K (0.2 mg IM and 0.5 mg IM)
There was no difference in the risk of having Vitamin K1 epoxide (K1O) detected (≥ 10 ng/mL) at day 5 noted when 0.2 mg IV is compared to either IM treatment group (RR 1.20, 95% CI 0.38 to 3.78; 1 study, 90 infants).
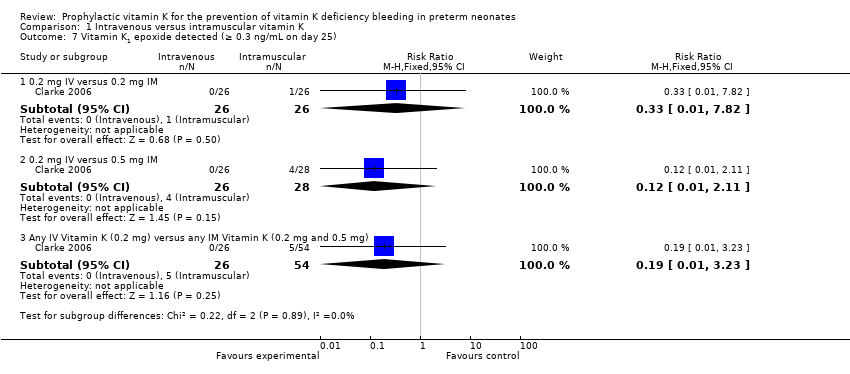
Vitamin K1 epoxide (K1O) detected (≥ 0.3 ng/mL) at day 25 (Outcome 1.7)
On day 25 there were 80 infants still enrolled in the study (28 in the 0.5 mg IM group, 26 in the 0.2 mg IM group, and 26 in the 0.2 mg IV group). Infants were considered to have elevated levels of vitamin K1O if a level of ≥ 0.3 ng/mL on day 25 of the study was detected.
0.2 mg IV or 0.2 mg IM
On day 25 there was one of 26 infants with a concentration of vitamin K1O greater than the 0.3 ng/mL cutoff in the 0.2 mg IM (median 1 ng/mL) and zero of 26 infants in the 0.2 mg IV group (median reported as < 0.3 ng/mL) (Clarke 2006). The median concentrations of vitamin K1O between the groups were not statistically different. These results suggest that different routes of administration do not significantly elevate the concentration of vitamin K1O to detectable levels. There was no difference in the risk of having detectable vitamin K1O at day 25 regardless of route of administration (RR 0.33, 95% CI 0.01 to 7.82; 1 study, 52 infants). Detection of vitamin K1O in the blood stream is suggestive of excessive amounts of exogenous vitamin K that is at a level in which the enzymatic capacity of the liver is overcome. Statistically significant elevation of vitamin K1O would suggest that the dose of vitamin K given was too high.
0.2 mg IV or 0.5 mg IM
In addition, the authors studied the vitamin K1O levels on day 25 in the 0.5 mg IM (control, N = 28) and the 0.2 mg IV (N = 26) groups. Four of 28 infants in the 0.5 mg IM group had vitamin K1O levels greater than the 0.3 ng/mL cutoff with a median concentration of 1.5 ng/mL. None of 26 study participants in the 0.2 mg IV group had detectable vitamin K1O levels. No statistically significant difference in vitamin K1O levels was found between the two groups (Clarke 2006). There was no difference in the risk of having detectable vitamin K1O at day 25 when comparing the control to the experimental group (RR 0.12, 95% CI 0.01 to 2.11; 1 study, 54 infants).
Any IV Vitamin K (0.2 mg IV) versus any IM Vitamin K (0.2 mg IM and 0.5 mg IM)
There is no difference in the risk of having Vitamin K1 epoxide (K1O) detected (≥ 10 ng/mL) at day 25 noted when 0.2 mg IV is compared to either IM treatment group (RR 0.19, 95% CI 0.01 to 3.23; 1 study, 80 infants).
Vitamin K1 levels
Vitamin K1 levels at day 5
There were 90 infants that completed the study at day 5 (29 in the 0.5 mg IM group (control), 32 in the 0.2 mg IM group, and 29 in the 0.2 mg IV group).
0.2 mg IV or 0.2 mg IM
The median ranges for vitamin K level on day 5 of the study for the 0.2 mg IM (N = 32) and the 0.2 mg IV (N = 29) groups were 59.3 ng/mL and 74.5 ng/mL, respectively. These differences were not statistically significant (Clarke 2006).
0.2 mg IV or 0.5 mg IM
The median vitamin K1 levels on day 5 for the 0.5 mg IM (control) versus the 0.2 mg IV doses were 111.8 ng/mL and 74.5 ng/mL, respectively. These differences were not statistically significant (Clarke 2006).
Vitamin K1 levels at day 25
On day 25 there were 80 infants still enrolled in the study (28 in the 0.5 mg IM group, 26 in the 0.2 mg IM group, and 26 in the 0.2 mg IV group). Vitamin K1 concentrations were compared between the groups on day 25.
0.2 mg IV or 0.2 mg IM
On day 25, the median vitamin K concentrations of the 0.2 mg IM (N = 26) and 0.2 mg IV (N = 26) groups were 1.6 ng/mL and 1.3 ng/mL, respectively. The difference between these concentrations was not statistically significant (Clarke 2006).
0.2 mg IV or 0.5 mg IM
On day 25, the median vitamin K concentration of the 0.5 mg IM group (N = 28) was 2.5 ng/mL and that of the 0.2 mg IV group (N = 26) was 1.3 ng/mL. This difference was statistically significant at P < 0.05 (Clarke 2006).
Necrotizing enterocolitis (added post hoc) (Outcome 1.8)
A total of 80 infants were analyzed for necrotizing enterocolitis (26 in the 0.2 mg IV group, 26 in the 0.2 mg IM group, and 28 in the 0.5 mg IM group) (Clarke 2006: Clarke thesis 2008).
0.2 mg IV or 0.2 mg IM
Two of 26 in the 0.2 mg IV group and two of 26 in the 0.2 mg IM were diagnosed with NEC (RR 1.00, 95% CI 0.15 to 6.57; 1 study, 52 infants). These results are inconclusive given the small sample size and broad CI.
0.2 mg IV or 0.5 mg IM
Two of 26 in the 0.2 mg IV group and two of 28 in the 0.5 mg IM were diagnosed with NEC (RR 1.08, 95% CI 0.16 to 7.10; 1 study, 54 infants). These results are inconclusive given the small sample size and broad CI.
Any IV Vitamin K (0.2 mg IV) versus any IM Vitamin K (0.2 mg IM and 0.5 mg IM)
There is no difference in the risk of necrotizing enterocolitis noted when 0.2 mg IV is compared to either IM treatment group (RR 1.04, 95% CI 0.20 to 5.31; 1 study, 80 infants).
Sepsis (added post hoc) (Outcome 1.9)
A total of 80 infants were analyzed for the diagnosis of sepsis (26 in the 0.2 mg IV group, 26 in the 0.2 mg IM group, and 28 in the 0.5 mg IM group) (Clarke thesis 2008).
0.2 mg IV or 0.2 mg IM
Four of 26 in the 0.2 mg IV group and four of 26 in the 0.2 mg IM were diagnosed with sepsis (RR 1.00, 95% CI 0.28 to 3.58; 1 study, 52 infants). These results are inconclusive given the small sample size and broad CI.
0.2 mg IV or 0.5 mg IM
Four of 26 in the 0.2 mg IV group and five of 28 in the 0.5 mg IM were diagnosed with sepsis (RR 0.86, 95% CI 0.26 to 2.86; 1 study, 54 infants). These results are inconclusive given the small sample size and broad CI.
Any IV Vitamin K (0.2 mg IV) versus any IM Vitamin K (0.2 mg IM and 0.5 mg IM)
There is no difference in the risk of sepsis noted when 0.2 mg IV is compared to either IM treatment group (RR 0.92, 95% CI 0.31 to 2.72; 1 study, 80 infants).
Mortality (all infants) (added post hoc) (Outcome 1.10)
Fifteen of 98 originally randomized infants died prior to the completion of the study at 25 days (Clarke 2006: Clarke thesis, 2008).
0.2 mg IV or 0.2 mg IM
Nine of 33 in the 0.2 mg IV group and 7 of 34 in the 0.2 mg IM died during the study time period (RR 1.32, 95% CI 0.56 to 3.14; 1 study, 67 infants). These results are inconclusive given the small sample size and broad CI.
0.2 mg IV or 0.5 mg IM
Nine of 33 in the 0.2 mg IV group and 3 of 31 in the 0.5 mg IM died during the study time period (RR 2.82, 95% CI 0.84 to 9.46; 1 study, 64 infants). These results are inconclusive given the small sample size and broad CI.
Any IV Vitamin K (0.2 mg IV) versus any IM Vitamin K (0.2 mg IM and 0.5 mg IM)
There is no difference in the risk of mortality noted when 0.2 mg IV is compared to either IM treatment group (RR 1.77, 95% CI 0.80 to 3.93; 1 study, 98 infants).
Dosage of vitamin K (post hoc analysis) (Comparison 2)
Primary outcome measures
Any bleeding (as reported by investigators), any severe bleeding requiring immediate transfusion, gastrointestinal bleeding, and intracranial bleeding (as reported by investigators) was not reported in the published data. Rescue treatment for bleeding was discussed but not reported. Overall, in all three groups, 15 infants received an additional "rescue" dose of vitamin K, but this was based on biochemical markers (prolonged PT) and not clinical bleeding. In Dr. Clarke's unpublished thesis, clinical bleeding and incidence of intracranial hemorrhage is reported (Clarke 2006: Clarke thesis 2008).
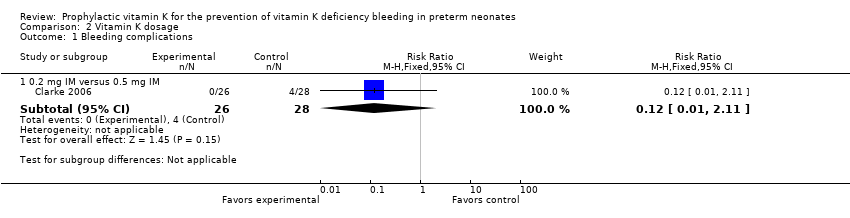
Bleeding complications (Outcome 2.1)
Zero of 26 in the 0.2 mg IM group and four of 28 in the 0.5 mg IM group had clinical bleeding (excluding IVH) (RR 0.12, 95% CI 0.01 to 2.11; 1 study, 54 infants). The small sample size and wide CIs do not allow for a conclusive interpretation of the data.
Intracranial bleeding (Outcome 2.2)
One of 26 in the 0.2 mg IM group and three of 28 in the 0.5 mg IM group had significant intracranial bleeding defined as > grade II intraventricular hemorrhage (RR 0.36, 95% CI 0.04 to 3.24; 1 study, 54 infants). The small sample size and wide CIs do not allow for a conclusive interpretation of the data.
Secondary outcome measures
PIVKA II (Outcomes 2.3 and 2.4)
In Clarke 2006, PIVKA II was considered present in the blood of study participants if the blood concentration was > 0.2 AU/mL at any time during the study.
Presence of PIVKA II at day 5 (Outcome 2.3)
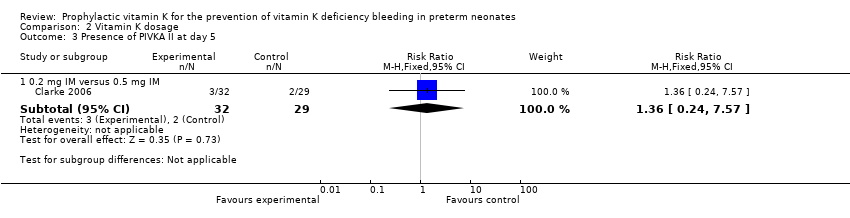
0.2 mg IM versus 0.5 mg IM
There were 90 infants that completed the study at day 5 but only 89 samples were analyzed for PIVKA II (29 in the 0.5 mg IM group (control), 32 in the 0.2 mg IM group, and 28 in the 0.2 mg IV group). No statistically significant difference in PIVKA II levels was reported between the 0.5 mg IM and 0.2 mg IM dosage groups (medians 0.62 AU/mL and 0.51 AU/mL, respectively) (Clarke 2006). Only 2 of 29 participants in the 0.5 mg IM group and 3 of 32 participants in the 0.2 mg IM group had detectable PIVKA II levels at day 5 of the study. There was no difference in the risk of having detectable levels of PIVKA II proteins on day 5 in the experimental group versus the control group (RR 1.36, 95% CI 0.24 to 7.57; 1 study, 61 infants). (Figure 3)
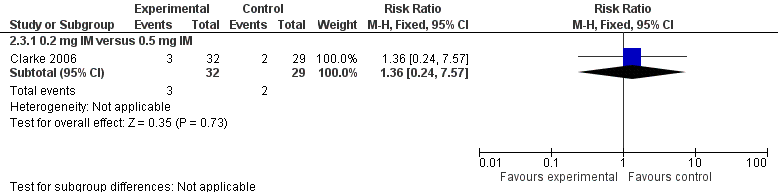
Forest plot of comparison: 2 Vitamin K dosage, outcome: 2.3 Presence of PIVKA II at day 5.
Presence of PIVKA II at day 25 (Outcome 2.4)
0.2 mg IM versus 0.5 mg IM
On day 25, there were 80 infants still enrolled in the study (28 in the 0.5 mg IM group, 26 in the 0.2 mg IM group, and 26 in the 0.2 mg IV group). Of the 80 infants, only 78 had documented PIVKA II assays performed. On day 25, one of 26 participants in the 0.5 mg IM group and one of 27 participants in the 0.2 mg IM group had documented PIVKA II levels ≥ 0.2 AU/mL in their blood. There was no statistically significant difference between the groups in regards to detectable PIVKA II levels (medians: 0.5 mg IM PIVKA II level = 0.2 AU/mL and 0.2 mg IM PIVKA II level = 0.36 Au/mL) (Clarke 2006). There was no difference in the risk of having detectable PIVKA II levels in the 0.2 mg IM group versus 0.5 mg IM group (RR 0.96, 95% CI 0.06 to 14.60; 1 study, 53 infants).
Prolonged prothrombin time (PT) (Outcome 2.5)
Prolonged PT at day 5 (Outcome 2.5)
0.2 mg IM versus 0.5 mg IM
On day 5 of the study, 92 samples were evaluated for PT (N = 29 in the 0.5 mg IM (control) group, N = 32 in the 0.2 mg IM group, and N = 31 in the 0.2 mg IV group). Day 5 comparison of the two doses (0.5 mg IM versus 0.2 mg IM) did not show a statistically significant difference in PT values (medians 12.8 IU and 13.0 IU, respectively) (Clarke 2006). There was no difference in the risk of having an elevated PT on day 5 in the experimental group when compared with the control group (RR 1.45, 95% CI 0.53 to 3.93; 1 study, 61 infants).
Prolonged PT at day 25
0.2 mg IM versus 0.5 mg IM
On day 25 of the study, a total of 83 infants (in all three groups) were evaluated for PT. Median PT values for the 0.5 mg IM group (N = 29) and the 0.2 mg IM group (N = 28) were 11.3 IU and 11.5 IU, respectively, and did not reach statistical significance (Clarke 2006).
Vitamin K1O (Outcomes 2.6 and 2.7)
Vitamin K1O detected at day 5 (≥ 10 ng/mL) (Outcome 2.6)
0.2 mg IM versus 0.5 mg IM
There were 90 infants that completed the study at day 5 (29 in the 0.5 mg IM group (control), 32 in the 0.2 mg IM group, and 29 in the 0.2 mg IV group). On day 5, study participants were considered to have vitamin K1O present if the level was ≥ 10 ng/mL. Seven of 29 infants had vitamin K1O detectable in the 0.5 mg IM group and no infants of 32 had detectable vitamin K1O levels in the 0.2 mg IM group. Statistical analysis comparing the different IM dosage groups (0.5 mg and 0.2 mg) did show a statistically significant increase in vitamin K1O levels in infants that received 0.5 mg IM when compared to the 0.2 mg IM group (median vitamin K1O levels 30.8 ng/mL versus < 10 ng/mL, respectively, P = < 0.01) (Clarke 2006). There was a similar trend demonstrated in our analysis of the risk of having detectable levels of vitamin K1O in 0.2 mg IM group versus 0.5 mg IM group (RR 0.06, 95% CI 0.00 to 1.02; 1 study, 61 infants).
Vitamin K1O detected at day 25 (≥ 0.3 ng/mL) (Outcome 2.7)
0.2 mg IM versus 0.5 mg IM
In addition the authors studied the vitamin K1O levels on day 25 in the 0.5 mg IM (control, N = 28) and the 0.2 mg IM (N = 26) groups. Four of 28 infants in the 0.5 mg IM group had vitamin K1O levels ≥ the 0.3 ng/mL cutoff with a median concentration of 1.5 ng/mL. One study participant of 26 had detectable vitamin K1O levels in the 0.2 mg IM group, with a median concentration of 1.0 ng/mL. Vitamin K1O levels were not statistically significantly different between the two groups (Clarke 2006). There was no difference in the risk of having elevated vitamin K1O levels when comparing the experimental group to the control (RR 0.27, 95% CI 0.03 to 2.25; 1 study, 54 infants).
Vitamin K1 levels
Vitamin K1 levels at day 5
0.2 mg IM versus 0.5 mg IM
There were 90 infants that completed the study at day 5 (29 in the 0.5 mg IM group (control), 32 in the 0.2 mg IM group, and 29 in the 0.2 mg IV group). Comparison of vitamin K1 levels in the 0.5 mg IM and the 0.2 mg IM group did show a statistically significant elevation in vitamin K1 levels in the 0.5 mg IM group versus the 0.2 mg IM group (medians 111.8 ng/mL versus 59.3 ng/mL, respectively, P < 0.05) (Clarke 2006).
Vitamin K1 levels at day 25
0.2 mg IM versus 0.5 mg IM
On day 25 there were 80 infants still enrolled in the study (28 in the 0.5 mg IM group, 26 in the 0.2 mg IM group, and 26 in the 0.2 mg IV group). There was no statistically significant difference in the vitamin K1 levels of the 0.5 mg IM versus the 0.2 mg IM group (medians 2.5 ng/mL and 1.6 ng/mL, respectively) (Clarke 2006).
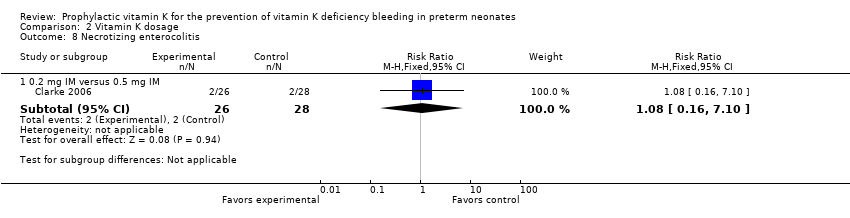
Necrotizing enterocolitis (added post hoc)(Outcome 2.8)
Two of 26 in the 0.2 mg IM group and two of 28 in the 0.5 mg IM group had necrotizing enterocolitis (RR 1.08, 95% CI 0.16 to 7.10; 1 study, 54 infants). The small sample size and wide CIs do not allow for a conclusive interpretation of the data.
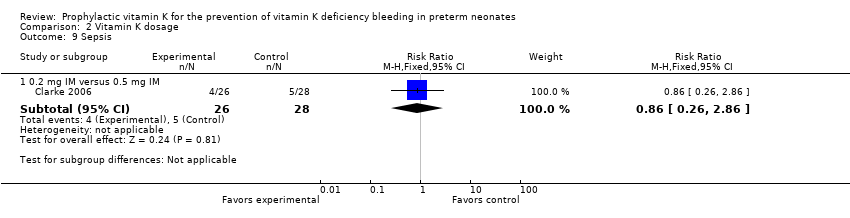
Sepsis (added post hoc)(Outcome 2.9)
Four of 26 in the 0.2 mg IM group and five of 28 in the 0.5 mg IM group had the diagnosis of sepsis (RR 0.86, 95% CI 0.26 to 2.86; 1 study, 54 infants). The small sample size and wide CIs do not allow for a conclusive interpretation of the data.
Mortality (all infants) (added post hoc)(Outcome 2.10)
Seven of 34 in the 0.2 mg IM group and three of 31 in the 0.5 mg IM group died prior to study completion (RR 2.13, 95% CI 0.60 to 7.51; 1 study, 65 infants). The small sample size and wide CIs do not allow for a conclusive interpretation of the data.
Discussion
Vitamin K prophylaxis is routinely administered to term and preterm infants shortly after delivery to prevent VKDB. VKDB in the preterm infant is not well described in the literature, most likely because most preterm infants receive prophylactic vitamin K on admission and also receive vitamin K through parenteral nutrition.
Practices in the administration of vitamin K vary widely, with differing doses and routes of administration in different NICUs and nurseries across the globe (Clarke 2003). Studies that have looked at blood markers such as PT as a surrogate for vitamin K status have not found a correlation between prolonged PT and vitamin K, with most preterm infants having normal or supraphysiologic levels of vitamin K (Clarke 2005).
In the USA, the American Academy of Pediatrics recommends administering 0.5 mg to 1 mg vitamin K IM after delivery to prevent VKDB in term infants (Committee on Fetus and Newborn 2003). Preterm infants are of concern because of the potential for vitamin K deficiency secondary to immature hepatic and hemostatic function, delayed feeding and, therefore, delayed colonization of the gut with vitamin K2‐producing microflora. In addition, frequent exposure to antibiotics also delays microflora colonization and vitamin K2 production.
The recommendations for daily vitamin K intake in preterm infants vary, ranging from 5 to 10 µg/kg/day up to 100 µg/kg/day (Clarke 2010). Preterm infants continue to receive vitamin K via enteral and parenteral nutrition throughout their hospital stay. Parental nutrition provides approximately 60 µg to 70 µg of vitamin K daily. Human Milk Fortifier (HMF) provides approximately 1.42 µg vitamin K per ounce. Commercial preterm infant formulas available in the USA vary in the amount of vitamin K per ounce, ranging from 1.77 µg to 2.85 µg per ounce. Breast milk is a poor source of vitamin K. Term infants who are exclusively breast fed receive about 2 µg/day from breast milk without evidence of VKDB. This is the basis of the current Recommended Daily Allowance (RDA) of vitamin K: 2 µg/day for healthy term infants (Greer 2010).
To date, no RCTs have studied vitamin K administration versus non‐treatment. Only one study evaluated the dose or route of administration of vitamin K in the preterm infant. Clarke 2006 randomized infants less than 32 weeks' gestational age to receive one of three vitamin K regimens: 0.5 mg IM (control), 0.2 mg IM, or 0.2 mg IV (Clarke 2006). They analyzed PIVKA II protein levels and vitamin K1 levels to assess uptake, tissue stores and metabolic clearance of vitamin K. To assess the metabolic capacity of the immature liver to recycle vitamin K1, they measured the concentration of the vitamin Vitamin K1 2,3‐epoxide (K1O). In addition, they assessed the total intake of vitamin K1 from all sources during the study period. Their data suggested that infants given vitamin K at a dose of 0.2 mg IV or IM had supraphysiologic levels of vitamin K1 on day 5 and only three infants (two in the IV and one in the IM group) had undetectable levels of vitamin K1. In addition, they assessed the total intake of vitamin K1 from all sources during the study period and found that vitamin K intake did not differ between the study groups.
Clarke 2006 analyzed the role of dietary vitamin K sources in the preterm infants studies from birth to study completion. There were 56 infants that completed the study and received total parenteral nutrition (TPN). The contribution of TPN to the total microgram intake of vitamin K was comparable in the 0.5 mg IM dose group (control) and the 0.2 mg IV group although statistically higher in the 0.2 mg IM group versus the 0.5 mg IM dose group (control) (1153 µg versus 950 µg, respectively, P < 0.05). Vitamin K intake from enteral feeds did not differ significantly between the groups. Absolute intakes of vitamin K were similar at study completion, although infants in the 0.5 mg control group received a higher average daily intake per kg of body weight when compared to the 0.2 mg prophylaxis groups which reached statistical significance (P < 0.05) (Clarke 2006). There were three infants in the 0.2 mg prophylaxis groups who had undetectable vitamin K1 levels at study completion. One infant of three only received four days of TPN, one of three was fed preterm formula, and two of three were fed fortified human breast milk. All three infants had statistically significant lower total and average intakes of vitamin K (P = 0.33) compared to the remaining study participants who had detectable vitamin K levels at study completion (Clarke 2006).
Although Clarke et al. focused on biochemical outcomes in the study published in 2006, the authors did address the clinical outcomes from the same study group in his unpublished thesis. They concluded that were no significant differences between the 0.2 mg IV, 0.2 mg IM, and 0.5 mg IM groups with regards to common morbidities associated with prematurity, including IVH > grade II, other clinical bleeding, sepsis, NEC, ventriculomegaly, and cystic PVL or porencephalic cyst (Clarke, unpublished data from thesis). They did not find any significant differences in mortality between the three groups either. Meta‐analysis of the thesis data is inconclusive as the sample size is small and the CIs for all of the analyzed morbidities and mortality are broad and lack precision.
Clarke has recently published an observational study drawn from the infants enrolled in this RCT (Clarke 2006). In this nutritional substudy, he quantified the proportional and total phylloquinone intakes of preterm infants within the neonatal period from all sources. Almost all infants had average daily phylloquinone intakes that were in excess of the currently recommended amounts. In infants who did not receive parenteral nutrition, the bolus dose of phylloquinone given at birth was the major source of phylloquinone intake, whereas in infants who received parenteral nutrition, the intake from the parenteral preparation exceeded that from the bolus dose by a ratio of approximately 3:1. This observational study supports concerns of Clarke and others that "preterm infants who receive current parenteral nutrition formulations may be receiving excessive vitamin K".
Costakos 2003 looked at vitamin K concentrations in infants of 22 to 32 weeks' gestation that received either 1 mg (group 1) or 0.5 mg (group 2) of vitamin K prophylaxis, with dosing determined by the attending physician on admission to the NICU. The infants were exclusively breast fed, with the exception of some formula feeds during initiation of feeding secondary to unavailability of breast milk. Vitamin K concentrations on days two and 10 of life were not statistically significant between the groups. The levels of plasma vitamin K were 1900 to 2600 times higher on day two and 550 to 600 times higher than vitamin K levels in fasting adults (Costakos 2003). One infant out of the 27 studied had a grade three intracranial hemorrhage. It was later discovered that the infant had non‐syndromic Alagille syndrome.

PRISMA flow diagram
Forest plot of comparison: 1 Intravenous versus intramuscular vitamin K, outcome: 1.3 Presence of PIVKA II at day 5.

Forest plot of comparison: 2 Vitamin K dosage, outcome: 2.3 Presence of PIVKA II at day 5.

Comparison 1 Intravenous versus intramuscular vitamin K, Outcome 1 Bleeding complications.

Comparison 1 Intravenous versus intramuscular vitamin K, Outcome 2 Intraventricular hemorrhage > Grade II.
Comparison 1 Intravenous versus intramuscular vitamin K, Outcome 3 Presence of PIVKA II at day 5.

Comparison 1 Intravenous versus intramuscular vitamin K, Outcome 4 Presence of PIVKA II at day 25.
Comparison 1 Intravenous versus intramuscular vitamin K, Outcome 5 Prolonged PT at day 5.
Comparison 1 Intravenous versus intramuscular vitamin K, Outcome 6 Vitamin K1 epoxide detected (≥ 10 ng/mL on day 5).
Comparison 1 Intravenous versus intramuscular vitamin K, Outcome 7 Vitamin K1 epoxide detected (≥ 0.3 ng/mL on day 25).

Comparison 1 Intravenous versus intramuscular vitamin K, Outcome 8 Necrotizing enterocolitis.

Comparison 1 Intravenous versus intramuscular vitamin K, Outcome 9 Sepsis.

Comparison 1 Intravenous versus intramuscular vitamin K, Outcome 10 Mortality (all infants).
Comparison 2 Vitamin K dosage, Outcome 1 Bleeding complications.

Comparison 2 Vitamin K dosage, Outcome 2 Intraventricular hemorrhage > Grade II.
Comparison 2 Vitamin K dosage, Outcome 3 Presence of PIVKA II at day 5.

Comparison 2 Vitamin K dosage, Outcome 4 Presence of PIVKA II at day 25.

Comparison 2 Vitamin K dosage, Outcome 5 Prolonged PT at day 5.

Comparison 2 Vitamin K dosage, Outcome 6 Vitamin K1 epoxide detected (≥ 10 ng/mL on day 5).

Comparison 2 Vitamin K dosage, Outcome 7 Vitamin K1 epoxide detected (≥ 0.3 ng/mL on day 25).
Comparison 2 Vitamin K dosage, Outcome 8 Necrotizing enterocolitis.
Comparison 2 Vitamin K dosage, Outcome 9 Sepsis.

Comparison 2 Vitamin K dosage, Outcome 10 Mortality (all infants).
| Intramuscular vitamin K versus intravenous vitamin K | |||||
| Patient or population: preterm infants | |||||
| Outcomes | Anticipated absolute effects* (95% CI) | Relative effect | Number of participants | Quality of the evidence | |
| Risk with prophylactic IV vitamin K treatment | Risk with prophylactic IM vitamin K | ||||
| Bleeding complications: | Study population | RR 7.00 | 52 | ⊕⊕⊝⊝ | |
| 0 per 1000 | 0 per 1000 | ||||
| Bleeding complications: | Study population | RR 0.81 | 54 | ⊕⊕⊝⊝ | |
| 143 per 1000 | 116 per 1000 | ||||
| Intraventricular hemorrhage > Grade II: | Study population | RR 2.00 | 52 | ⊕⊕⊝⊝ | |
| 38 per 1000 | 77 per 1000 | ||||
| Intraventricular hemorrhage > Grade II: | Study population | RR 0.72 | 54 | ⊕⊕⊝⊝ | |
| 107 per 1000 | 77 per 1000 | ||||
| Presence of PIVKA II at day 5: | Study population | RR 1.52 | 60 | ⊕⊕⊝⊝ | |
| 94 per 1000 | 143 per 1000 | ||||
| Presence of PIVKA II at day 5: | Study population | RR 2.07 | 57 | ⊕⊕⊝⊝ | |
| 69 per 1000 | 143 per 1000 | ||||
| Presence of PIVKA II at day 25: | Study population | RR 1.08 | 52 | ⊕⊕⊝⊝ | |
| 37 per 1000 | 40 per 1000 | ||||
| Presence of PIVKA II at day 25 ‐ 0.2 mg IV versus 0.5 mg IM | Study population | RR 1.04 | 51 | ⊕⊕⊝⊝ | |
| 38 per 1000 | 40 per 1000 | ||||
| Necrotizing enterocolitis ‐ 0.2 mg IV versus 0.2 mg IM | Study population | RR 1.00 | 52 | ⊕⊕⊝⊝ | |
| 77 per 1000 | 77 per 1000 | ||||
| Necrotizing enterocolitis: 0.2 mg IV versus 0.5 mg IM | Study population | RR 1.08 | 54 | ⊕⊕⊝⊝ | |
| 71 per 1000 | 77 per 1000 | ||||
| Sepsis: 0.2 mg IV versus 0.2 mg IM | Study population | RR 1.00 | 52 | ⊕⊕⊝⊝ | |
| 154 per 1000 | 154 per 1000 | ||||
| Sepsis: 0.2 mg IV versus 0.5 mg IM | Study population | RR 0.86 | 54 | ⊕⊕⊝⊝ | |
| 179 per 1000 | 154 per 1000 | ||||
| Mortality (all infants): | Study population | RR 1.32 | 67 | ⊕⊕⊝⊝ | |
| 206 per 1000 | 272 per 1000 | ||||
| Mortality (all infants): 0.2 mg IV versus 0.5 mg IM | Study population | RR 2.82 | 64 | ⊕⊕⊝⊝ | |
| 97 per 1000 | 273 per 1000 | ||||
| *The risk in the intervention group (and its 95% CI) is based on the assumed risk in the comparison group and the relative effect of the intervention (and its 95% CI). | |||||
| GRADE Working Group grades of evidence | |||||
| 1We downgraded by two levels due to the small sample size from one included trial. | |||||
| Higher dose vitamin K compared to lower dose vitamin K for preterm infants | ||||||
| Patient or population: preterm infants | ||||||
| Outcomes | Anticipated absolute effects* (95% CI) | Relative effect | Number of participants | Quality of the evidence | Comments | |
| Risk with lower dose vitamin K | Risk with higher dose vitamin K | |||||
| Bleeding complications: | Study population | RR 0.12 | 54 | ⊕⊕⊝⊝ | ||
| 143 per 1000 | 17 per 1000 | |||||
| Intraventricular hemorrhage > Grade II: | Study population | RR 0.36 | 54 | ⊕⊕⊝⊝ | ||
| 107 per 1000 | 39 per 1000 | |||||
| Presence of PIVKA II at day 5: | Study population | RR 1.36 | 61 | ⊕⊕⊝⊝ | ||
| 69 per 1000 | 94 per 1000 | |||||
| Presence of PIVKA II at day 25: | Study population | RR 0.96 | 53 | ⊕⊕⊝⊝ | ||
| 38 per 1000 | 37 per 1000 | |||||
| Necrotizing enterocolitis: | Study population | RR 1.08 | 54 | ⊕⊕⊝⊝ | ||
| 71 per 1000 | 77 per 1000 | |||||
| Sepsis: | Study population | RR 0.86 | 54 | ⊕⊕⊝⊝ | ||
| 179 per 1000 | 154 per 1000 | |||||
| Mortality (all infants): | Study population | RR 2.13 | 65 | ⊕⊕⊝⊝ | ||
| 97 per 1000 | 206 per 1000 | |||||
| *The risk in the intervention group (and its 95% CI) is based on the assumed risk in the comparison group and the relative effect of the intervention (and its 95% CI). | ||||||
| GRADE Working Group grades of evidence | ||||||
| 1We downgraded by two levels due to the small sample size from one included trial. | ||||||
| Outcome or subgroup title | No. of studies | No. of participants | Statistical method | Effect size |
| 1 Bleeding complications Show forest plot | 1 | Risk Ratio (M‐H, Fixed, 95% CI) | Subtotals only | |
| 1.1 0.2 mg IV versus 0.2 mg IM | 1 | 52 | Risk Ratio (M‐H, Fixed, 95% CI) | 7.0 [0.38, 129.11] |
| 1.2 0.2 mg IV versus 0.5 mg IM | 1 | 54 | Risk Ratio (M‐H, Fixed, 95% CI) | 0.81 [0.20, 3.27] |
| 1.3 Any IV Vitamin K (0.2 mg) versus any IM Vitamin K (0.2 mg and 0.5 mg) | 1 | 80 | Risk Ratio (M‐H, Fixed, 95% CI) | 1.56 [0.38, 6.46] |
| 2 Intraventricular hemorrhage > Grade II Show forest plot | 1 | Risk Ratio (M‐H, Fixed, 95% CI) | Subtotals only | |
| 2.1 0.2 mg IV versus 0.2 mg IM | 1 | 52 | Risk Ratio (M‐H, Fixed, 95% CI) | 2.0 [0.19, 20.72] |
| 2.2 0.2 mg IV versus 0.5 mg IM | 1 | 54 | Risk Ratio (M‐H, Fixed, 95% CI) | 0.72 [0.13, 3.96] |
| 2.3 Any IV Vitamin K (0.2 mg) versus any IM Vitamin K (0.2 mg and 0.5 mg) | 1 | 80 | Risk Ratio (M‐H, Fixed, 95% CI) | 1.04 [0.20, 5.31] |
| 3 Presence of PIVKA II at day 5 Show forest plot | 1 | Risk Ratio (M‐H, Fixed, 95% CI) | Subtotals only | |
| 3.1 0.2 mg IV versus 0.2 mg IM | 1 | 60 | Risk Ratio (M‐H, Fixed, 95% CI) | 1.52 [0.37, 6.23] |
| 3.2 0.2 mg IV versus 0.5 mg IM | 1 | 57 | Risk Ratio (M‐H, Fixed, 95% CI) | 2.07 [0.41, 10.43] |
| 3.3 Any IV Vitamin K (0.2 mg) versus any IM Vitamin K (0.2 mg and 0.5 mg) | 1 | 89 | Risk Ratio (M‐H, Fixed, 95% CI) | 1.74 [0.51, 6.00] |
| 4 Presence of PIVKA II at day 25 Show forest plot | 1 | Risk Ratio (M‐H, Fixed, 95% CI) | Subtotals only | |
| 4.1 0.2 mg IV versus 0.2 mg IM | 1 | 52 | Risk Ratio (M‐H, Fixed, 95% CI) | 1.08 [0.07, 16.36] |
| 4.2 0.2 mg IV versus 0.5 mg IM | 1 | 51 | Risk Ratio (M‐H, Fixed, 95% CI) | 1.04 [0.07, 15.74] |
| 4.3 Any IV Vitamin K (0.2 mg) versus any IM Vitamin K (0.2 mg and 0.5 mg) | 1 | 78 | Risk Ratio (M‐H, Fixed, 95% CI) | 1.06 [0.10, 11.15] |
| 5 Prolonged PT at day 5 Show forest plot | 1 | Risk Ratio (M‐H, Fixed, 95% CI) | Subtotals only | |
| 5.1 0.2 mg IV versus 0.2 mg IM | 1 | 63 | Risk Ratio (M‐H, Fixed, 95% CI) | 0.65 [0.24, 1.76] |
| 5.2 0.2 mg IV versus 0.5 mg IM | 1 | 60 | Risk Ratio (M‐H, Fixed, 95% CI) | 0.94 [0.30, 2.90] |
| 5.3 Any IV Vitamin K (0.2 mg) versus any IM Vitamin K (0.2 mg and 0.5 mg) | 1 | 92 | Risk Ratio (M‐H, Fixed, 95% CI) | 0.76 [0.30, 1.93] |
| 6 Vitamin K1 epoxide detected (≥ 10 ng/mL on day 5) Show forest plot | 1 | Risk Ratio (M‐H, Fixed, 95% CI) | Subtotals only | |
| 6.1 0.2 mg IV versus 0.2 mg IM | 1 | 61 | Risk Ratio (M‐H, Fixed, 95% CI) | 9.9 [0.56, 176.29] |
| 6.2 0.2 mg IV versus 0.5 mg IM | 1 | 58 | Risk Ratio (M‐H, Fixed, 95% CI) | 0.57 [0.19, 1.74] |
| 6.3 Any IV Vitamin K (0.2 mg) versus any IM Vitamin K (0.2 mg and 0.5 mg) | 1 | 90 | Risk Ratio (M‐H, Fixed, 95% CI) | 1.20 [0.38, 3.78] |
| 7 Vitamin K1 epoxide detected (≥ 0.3 ng/mL on day 25) Show forest plot | 1 | Risk Ratio (M‐H, Fixed, 95% CI) | Subtotals only | |
| 7.1 0.2 mg IV versus 0.2 mg IM | 1 | 52 | Risk Ratio (M‐H, Fixed, 95% CI) | 0.33 [0.01, 7.82] |
| 7.2 0.2 mg IV versus 0.5 mg IM | 1 | 54 | Risk Ratio (M‐H, Fixed, 95% CI) | 0.12 [0.01, 2.11] |
| 7.3 Any IV Vitamin K (0.2 mg) versus any IM Vitamin K (0.2 mg and 0.5 mg) | 1 | 80 | Risk Ratio (M‐H, Fixed, 95% CI) | 0.19 [0.01, 3.23] |
| 8 Necrotizing enterocolitis Show forest plot | 1 | Risk Ratio (M‐H, Fixed, 95% CI) | Subtotals only | |
| 8.1 0.2 mg IV versus 0.2 mg IM | 1 | 52 | Risk Ratio (M‐H, Fixed, 95% CI) | 1.0 [0.15, 6.57] |
| 8.2 0.2 mg IV versus 0.5 mg IM | 1 | 54 | Risk Ratio (M‐H, Fixed, 95% CI) | 1.08 [0.16, 7.10] |
| 8.3 Any IV Vitamin K (0.2 mg) versus any IM Vitamin K (0.2 mg and 0.5 mg) | 1 | 80 | Risk Ratio (M‐H, Fixed, 95% CI) | 1.04 [0.20, 5.31] |
| 9 Sepsis Show forest plot | 1 | Risk Ratio (M‐H, Fixed, 95% CI) | Subtotals only | |
| 9.1 0.2 mg IV versus 0.2 mg IM | 1 | 52 | Risk Ratio (M‐H, Fixed, 95% CI) | 1.0 [0.28, 3.58] |
| 9.2 0.2 mg IV versus 0.5 mg IM | 1 | 54 | Risk Ratio (M‐H, Fixed, 95% CI) | 0.86 [0.26, 2.86] |
| 9.3 Any IV Vitamin K (0.2 mg) versus any IM Vitamin K (0.2 mg and 0.5 mg) | 1 | 80 | Risk Ratio (M‐H, Fixed, 95% CI) | 0.92 [0.31, 2.72] |
| 10 Mortality (all infants) Show forest plot | 1 | Risk Ratio (M‐H, Fixed, 95% CI) | Subtotals only | |
| 10.1 0.2 mg IV versus 0.2 mg IM | 1 | 67 | Risk Ratio (M‐H, Fixed, 95% CI) | 1.32 [0.56, 3.14] |
| 10.2 0.2 mg IV versus 0.5 mg IM | 1 | 64 | Risk Ratio (M‐H, Fixed, 95% CI) | 2.82 [0.84, 9.46] |
| 10.3 Any IV Vitamin K (0.2 mg) versus any IM Vitamin K (0.2 mg and 0.5 mg) | 1 | 98 | Risk Ratio (M‐H, Fixed, 95% CI) | 1.77 [0.80, 3.93] |
| Outcome or subgroup title | No. of studies | No. of participants | Statistical method | Effect size |
| 1 Bleeding complications Show forest plot | 1 | Risk Ratio (M‐H, Fixed, 95% CI) | Subtotals only | |
| 1.1 0.2 mg IM versus 0.5 mg IM | 1 | 54 | Risk Ratio (M‐H, Fixed, 95% CI) | 0.12 [0.01, 2.11] |
| 2 Intraventricular hemorrhage > Grade II Show forest plot | 1 | Risk Ratio (M‐H, Fixed, 95% CI) | Subtotals only | |
| 2.1 0.2 mg IM versus 0.5 mg IM | 1 | 54 | Risk Ratio (M‐H, Fixed, 95% CI) | 0.36 [0.04, 3.24] |
| 3 Presence of PIVKA II at day 5 Show forest plot | 1 | Risk Ratio (M‐H, Fixed, 95% CI) | Subtotals only | |
| 3.1 0.2 mg IM versus 0.5 mg IM | 1 | 61 | Risk Ratio (M‐H, Fixed, 95% CI) | 1.36 [0.24, 7.57] |
| 4 Presence of PIVKA II at day 25 Show forest plot | 1 | Risk Ratio (M‐H, Fixed, 95% CI) | Subtotals only | |
| 4.1 0.2 mg IM versus 0.5 mg IM | 1 | 53 | Risk Ratio (M‐H, Fixed, 95% CI) | 0.96 [0.06, 14.60] |
| 5 Prolonged PT at day 5 Show forest plot | 1 | Risk Ratio (M‐H, Fixed, 95% CI) | Subtotals only | |
| 5.1 0.2 mg IM versus 0.5 mg IM | 1 | 61 | Risk Ratio (M‐H, Fixed, 95% CI) | 1.45 [0.53, 3.93] |
| 6 Vitamin K1 epoxide detected (≥ 10 ng/mL on day 5) Show forest plot | 1 | Risk Ratio (M‐H, Fixed, 95% CI) | Subtotals only | |
| 6.1 0.2 mg IM versus 0.5 mg IM | 1 | 61 | Risk Ratio (M‐H, Fixed, 95% CI) | 0.06 [0.00, 1.02] |
| 7 Vitamin K1 epoxide detected (≥ 0.3 ng/mL on day 25) Show forest plot | 1 | Risk Ratio (M‐H, Fixed, 95% CI) | Subtotals only | |
| 7.1 0.2 mg IM versus 0.5 mg IM | 1 | 54 | Risk Ratio (M‐H, Fixed, 95% CI) | 0.27 [0.03, 2.25] |
| 8 Necrotizing enterocolitis Show forest plot | 1 | Risk Ratio (M‐H, Fixed, 95% CI) | Subtotals only | |
| 8.1 0.2 mg IM versus 0.5 mg IM | 1 | 54 | Risk Ratio (M‐H, Fixed, 95% CI) | 1.08 [0.16, 7.10] |
| 9 Sepsis Show forest plot | 1 | Risk Ratio (M‐H, Fixed, 95% CI) | Subtotals only | |
| 9.1 0.2 mg IM versus 0.5 mg IM | 1 | 54 | Risk Ratio (M‐H, Fixed, 95% CI) | 0.86 [0.26, 2.86] |
| 10 Mortality (all infants) Show forest plot | 1 | Risk Ratio (M‐H, Fixed, 95% CI) | Subtotals only | |
| 10.1 0.2 mg IM versus 0.5 mg IM | 1 | 65 | Risk Ratio (M‐H, Fixed, 95% CI) | 2.13 [0.60, 7.51] |