مصرف پروفیلاکتیک ویتامین K برای پیشگیری از خونریزی ناشی از کمبود ویتامین K در نوزادان نارس
Appendices
Appendix 1. Search methodology
PubMed: ((infant, newborn[MeSH] OR newborn OR neonate OR neonatal OR premature OR low birth weight OR VLBW OR LBW or infan* or neonat*) AND (randomised controlled trial [pt] OR controlled clinical trial [pt] OR randomised [tiab] OR placebo [tiab] OR drug therapy [sh] OR randomly [tiab] OR trial [tiab] OR groups [tiab]) NOT (animals [mh] NOT humans [mh]))
Embase: (infant, newborn or newborn or neonate or neonatal or premature or very low birth weight or low birth weight or VLBW or LBW or Newborn or infan* or neonat*) AND (human not animal) AND (randomised controlled trial or controlled clinical trial or randomised or placebo or clinical trials as topic or randomly or trial or clinical trial)
CINAHL: (infant, newborn OR newborn OR neonate OR neonatal OR premature OR low birth weight OR VLBW OR LBW or Newborn or infan* or neonat*) AND (randomised controlled trial OR controlled clinical trial OR randomised OR placebo OR clinical trials as topic OR randomly OR trial OR PT clinical trial)
Cochrane Library: (infant or newborn or neonate or neonatal or premature or preterm or very low birth weight or low birth weight or VLBW or LBW)
Appendix 2. 'Risk of bias' tool
We used the standard methods of Cochrane and Cochrane Neonatal to assess the methodological quality (to meet the validity criteria) of the trials. For each included trial, we sought information regarding the method of randomization, and the blinding and reporting of all outcomes of all the infants enrolled in the trial. We assessed each criterion as either at low, high, or unclear risk of bias. Two review authors separately assessed each included study. We resolved any disagreement by discussion. We added this information to the 'Characteristics of included studies' tables. We evaluated the following issues and entered the findings into the 'Risk of bias' tables.
1. Sequence generation (checking for possible selection bias)
Was the allocation sequence adequately generated?
For each included study, we categorized the method used to generate the allocation sequence as:
-
low risk (any truly random process e.g. random number table; computer random number generator);
-
high risk (any non‐random process e.g. odd or even date of birth; hospital or clinic record number);
-
unclear risk.
2. Allocation concealment (checking for possible selection bias)
Was allocation adequately concealed?
For each included study, we categorized the method used to conceal the allocation sequence as:
-
low risk (e.g. telephone or central randomization; consecutively numbered sealed opaque envelopes);
-
high risk (open random allocation; unsealed or non‐opaque envelopes, alternation; date of birth);
-
unclear risk.
3. Blinding of participants and personnel (checking for possible performance bias)
Was knowledge of the allocated intervention adequately prevented during the study?
For each included study, we categorized the methods used to blind study participants and personnel from knowledge of which intervention a participant received. Blinding was assessed separately for different outcomes or class of outcomes. We categorized the methods as:
-
low risk, high risk, or unclear risk for participants;
-
low risk, high risk, or unclear risk for personnel.
4. Blinding of outcome assessment (checking for possible detection bias)
Was knowledge of the allocated intervention adequately prevented at the time of outcome assessment?
For each included study, we categorized the methods used to blind outcome assessment. Blinding was assessed separately for different outcomes or class of outcomes. We categorized the methods as:
-
low risk for outcome assessors;
-
high risk for outcome assessors;
-
unclear risk for outcome assessors.
5. Incomplete outcome data (checking for possible attrition bias through withdrawals, dropouts, protocol deviations)
Were incomplete outcome data adequately addressed?
For each included study and for each outcome, we described the completeness of data including attrition and exclusions from the analysis. We noted whether attrition and exclusions were reported, the numbers included in the analysis at each stage (compared with the total randomized participants), reasons for attrition or exclusion where reported, and whether missing data were balanced across groups or were related to outcomes. Where sufficient information was reported or supplied by the trial authors, we re‐included missing data in the analyses. We categorized the methods as:
-
low risk (< 20% missing data);
-
high risk (≥ 20% missing data);
-
unclear risk.
6. Selective reporting bias
Were reports of the study free of suggestion of selective outcome reporting?
For each included study, we described how we investigated the possibility of selective outcome reporting bias and what we found. We assessed the methods as:
-
low risk (where it is clear that all of the study's prespecified outcomes and all expected outcomes of interest to the review have been reported);
-
high risk (where not all the study's prespecified outcomes have been reported; one or more reported primary outcomes were not prespecified outcomes of interest and are reported incompletely and so cannot be used; study fails to include results of a key outcome that would have been expected to have been reported);
-
unclear risk.
7. Other sources of bias
Was the study apparently free of other problems that could put it at a high risk of bias?
For each included study, we described any important concerns we had about other possible sources of bias (for example, whether there was a potential source of bias related to the specific study design or whether the trial was stopped early due to some data‐dependent process). We assessed whether each study was free of other problems that could put it at risk of bias as:
-
low risk;
-
high risk;
-
unclear risk.
If needed, we explored the impact of the level of bias through undertaking sensitivity analyses.
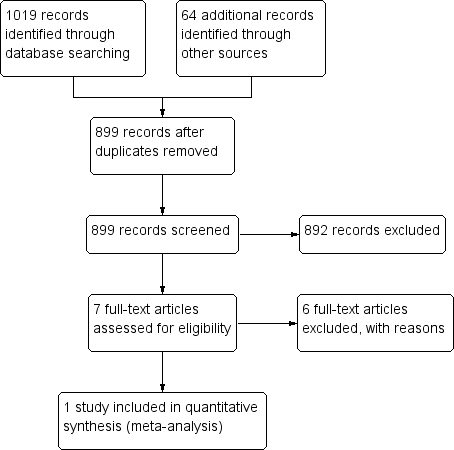
PRISMA flow diagram
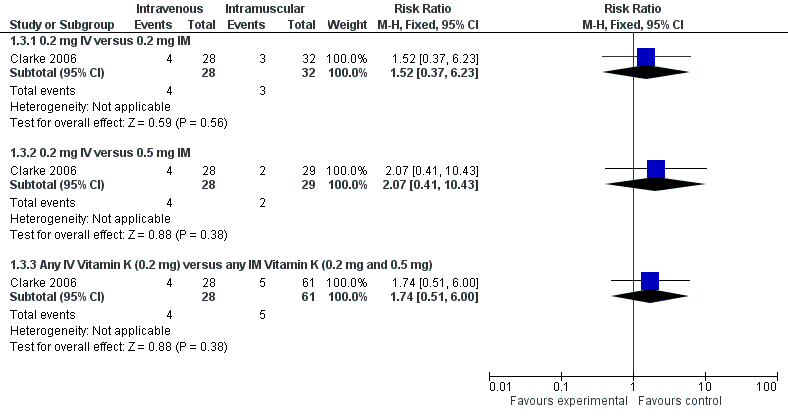
Forest plot of comparison: 1 Intravenous versus intramuscular vitamin K, outcome: 1.3 Presence of PIVKA II at day 5.
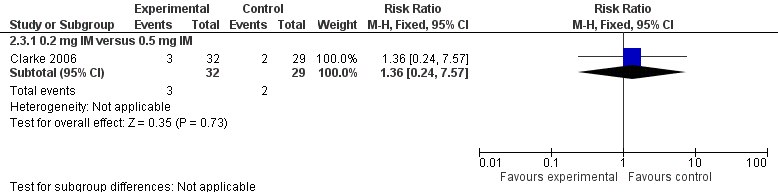
Forest plot of comparison: 2 Vitamin K dosage, outcome: 2.3 Presence of PIVKA II at day 5.

Comparison 1 Intravenous versus intramuscular vitamin K, Outcome 1 Bleeding complications.

Comparison 1 Intravenous versus intramuscular vitamin K, Outcome 2 Intraventricular hemorrhage > Grade II.
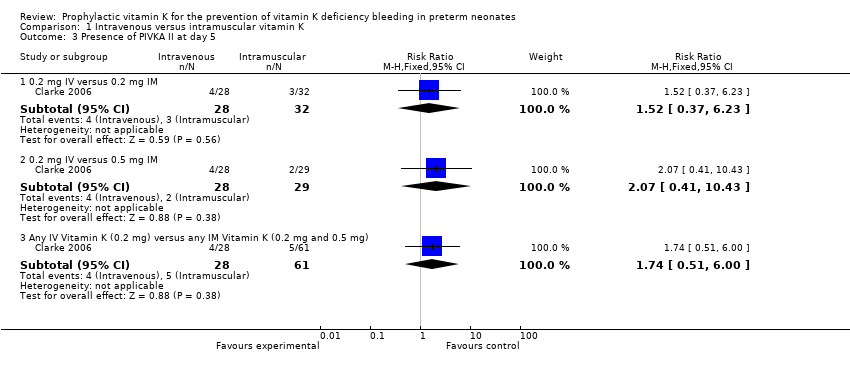
Comparison 1 Intravenous versus intramuscular vitamin K, Outcome 3 Presence of PIVKA II at day 5.

Comparison 1 Intravenous versus intramuscular vitamin K, Outcome 4 Presence of PIVKA II at day 25.
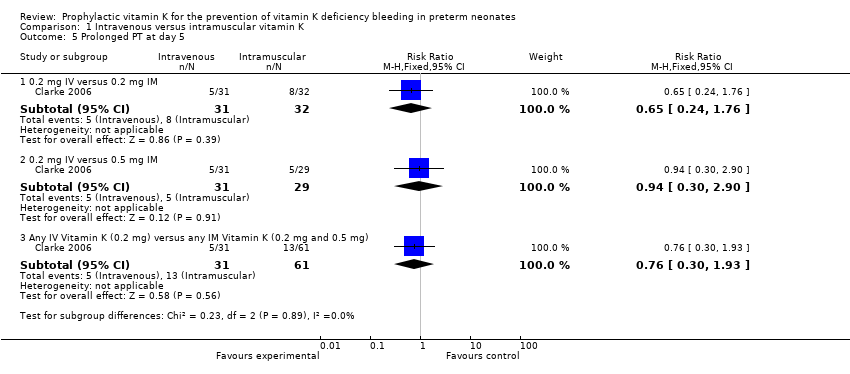
Comparison 1 Intravenous versus intramuscular vitamin K, Outcome 5 Prolonged PT at day 5.
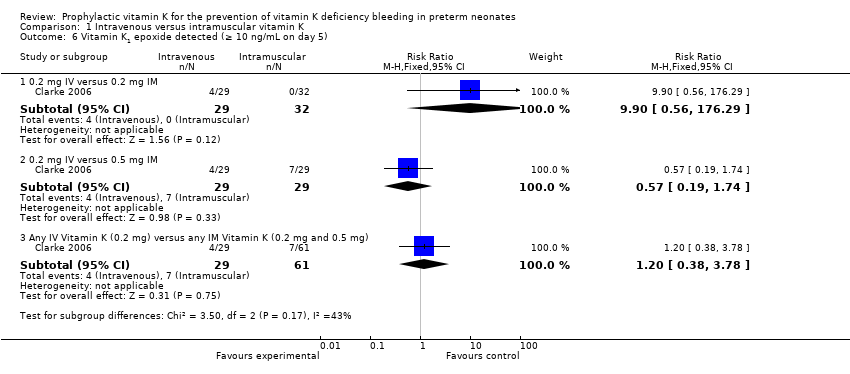
Comparison 1 Intravenous versus intramuscular vitamin K, Outcome 6 Vitamin K1 epoxide detected (≥ 10 ng/mL on day 5).
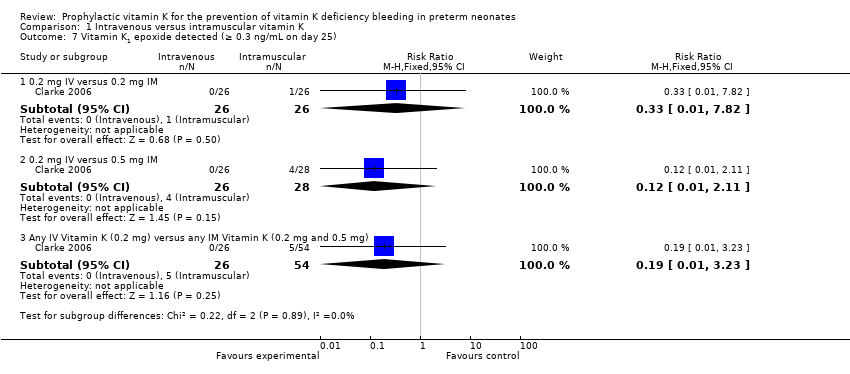
Comparison 1 Intravenous versus intramuscular vitamin K, Outcome 7 Vitamin K1 epoxide detected (≥ 0.3 ng/mL on day 25).

Comparison 1 Intravenous versus intramuscular vitamin K, Outcome 8 Necrotizing enterocolitis.

Comparison 1 Intravenous versus intramuscular vitamin K, Outcome 9 Sepsis.

Comparison 1 Intravenous versus intramuscular vitamin K, Outcome 10 Mortality (all infants).
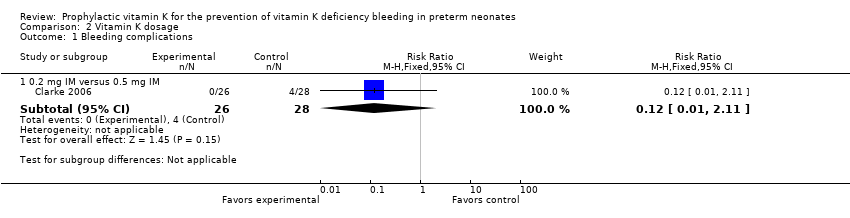
Comparison 2 Vitamin K dosage, Outcome 1 Bleeding complications.

Comparison 2 Vitamin K dosage, Outcome 2 Intraventricular hemorrhage > Grade II.
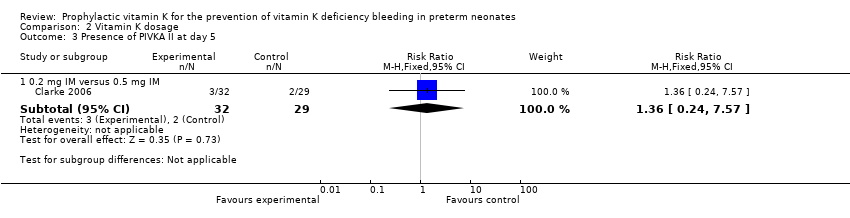
Comparison 2 Vitamin K dosage, Outcome 3 Presence of PIVKA II at day 5.

Comparison 2 Vitamin K dosage, Outcome 4 Presence of PIVKA II at day 25.

Comparison 2 Vitamin K dosage, Outcome 5 Prolonged PT at day 5.

Comparison 2 Vitamin K dosage, Outcome 6 Vitamin K1 epoxide detected (≥ 10 ng/mL on day 5).

Comparison 2 Vitamin K dosage, Outcome 7 Vitamin K1 epoxide detected (≥ 0.3 ng/mL on day 25).
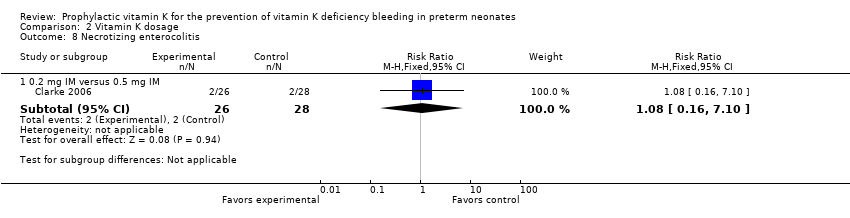
Comparison 2 Vitamin K dosage, Outcome 8 Necrotizing enterocolitis.
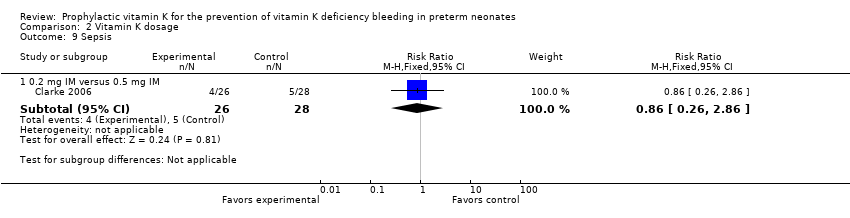
Comparison 2 Vitamin K dosage, Outcome 9 Sepsis.

Comparison 2 Vitamin K dosage, Outcome 10 Mortality (all infants).
| Intramuscular vitamin K versus intravenous vitamin K | |||||
| Patient or population: preterm infants | |||||
| Outcomes | Anticipated absolute effects* (95% CI) | Relative effect | Number of participants | Quality of the evidence | |
| Risk with prophylactic IV vitamin K treatment | Risk with prophylactic IM vitamin K | ||||
| Bleeding complications: | Study population | RR 7.00 | 52 | ⊕⊕⊝⊝ | |
| 0 per 1000 | 0 per 1000 | ||||
| Bleeding complications: | Study population | RR 0.81 | 54 | ⊕⊕⊝⊝ | |
| 143 per 1000 | 116 per 1000 | ||||
| Intraventricular hemorrhage > Grade II: | Study population | RR 2.00 | 52 | ⊕⊕⊝⊝ | |
| 38 per 1000 | 77 per 1000 | ||||
| Intraventricular hemorrhage > Grade II: | Study population | RR 0.72 | 54 | ⊕⊕⊝⊝ | |
| 107 per 1000 | 77 per 1000 | ||||
| Presence of PIVKA II at day 5: | Study population | RR 1.52 | 60 | ⊕⊕⊝⊝ | |
| 94 per 1000 | 143 per 1000 | ||||
| Presence of PIVKA II at day 5: | Study population | RR 2.07 | 57 | ⊕⊕⊝⊝ | |
| 69 per 1000 | 143 per 1000 | ||||
| Presence of PIVKA II at day 25: | Study population | RR 1.08 | 52 | ⊕⊕⊝⊝ | |
| 37 per 1000 | 40 per 1000 | ||||
| Presence of PIVKA II at day 25 ‐ 0.2 mg IV versus 0.5 mg IM | Study population | RR 1.04 | 51 | ⊕⊕⊝⊝ | |
| 38 per 1000 | 40 per 1000 | ||||
| Necrotizing enterocolitis ‐ 0.2 mg IV versus 0.2 mg IM | Study population | RR 1.00 | 52 | ⊕⊕⊝⊝ | |
| 77 per 1000 | 77 per 1000 | ||||
| Necrotizing enterocolitis: 0.2 mg IV versus 0.5 mg IM | Study population | RR 1.08 | 54 | ⊕⊕⊝⊝ | |
| 71 per 1000 | 77 per 1000 | ||||
| Sepsis: 0.2 mg IV versus 0.2 mg IM | Study population | RR 1.00 | 52 | ⊕⊕⊝⊝ | |
| 154 per 1000 | 154 per 1000 | ||||
| Sepsis: 0.2 mg IV versus 0.5 mg IM | Study population | RR 0.86 | 54 | ⊕⊕⊝⊝ | |
| 179 per 1000 | 154 per 1000 | ||||
| Mortality (all infants): | Study population | RR 1.32 | 67 | ⊕⊕⊝⊝ | |
| 206 per 1000 | 272 per 1000 | ||||
| Mortality (all infants): 0.2 mg IV versus 0.5 mg IM | Study population | RR 2.82 | 64 | ⊕⊕⊝⊝ | |
| 97 per 1000 | 273 per 1000 | ||||
| *The risk in the intervention group (and its 95% CI) is based on the assumed risk in the comparison group and the relative effect of the intervention (and its 95% CI). | |||||
| GRADE Working Group grades of evidence | |||||
| 1We downgraded by two levels due to the small sample size from one included trial. | |||||
| Higher dose vitamin K compared to lower dose vitamin K for preterm infants | ||||||
| Patient or population: preterm infants | ||||||
| Outcomes | Anticipated absolute effects* (95% CI) | Relative effect | Number of participants | Quality of the evidence | Comments | |
| Risk with lower dose vitamin K | Risk with higher dose vitamin K | |||||
| Bleeding complications: | Study population | RR 0.12 | 54 | ⊕⊕⊝⊝ | ||
| 143 per 1000 | 17 per 1000 | |||||
| Intraventricular hemorrhage > Grade II: | Study population | RR 0.36 | 54 | ⊕⊕⊝⊝ | ||
| 107 per 1000 | 39 per 1000 | |||||
| Presence of PIVKA II at day 5: | Study population | RR 1.36 | 61 | ⊕⊕⊝⊝ | ||
| 69 per 1000 | 94 per 1000 | |||||
| Presence of PIVKA II at day 25: | Study population | RR 0.96 | 53 | ⊕⊕⊝⊝ | ||
| 38 per 1000 | 37 per 1000 | |||||
| Necrotizing enterocolitis: | Study population | RR 1.08 | 54 | ⊕⊕⊝⊝ | ||
| 71 per 1000 | 77 per 1000 | |||||
| Sepsis: | Study population | RR 0.86 | 54 | ⊕⊕⊝⊝ | ||
| 179 per 1000 | 154 per 1000 | |||||
| Mortality (all infants): | Study population | RR 2.13 | 65 | ⊕⊕⊝⊝ | ||
| 97 per 1000 | 206 per 1000 | |||||
| *The risk in the intervention group (and its 95% CI) is based on the assumed risk in the comparison group and the relative effect of the intervention (and its 95% CI). | ||||||
| GRADE Working Group grades of evidence | ||||||
| 1We downgraded by two levels due to the small sample size from one included trial. | ||||||
| Outcome or subgroup title | No. of studies | No. of participants | Statistical method | Effect size |
| 1 Bleeding complications Show forest plot | 1 | Risk Ratio (M‐H, Fixed, 95% CI) | Subtotals only | |
| 1.1 0.2 mg IV versus 0.2 mg IM | 1 | 52 | Risk Ratio (M‐H, Fixed, 95% CI) | 7.0 [0.38, 129.11] |
| 1.2 0.2 mg IV versus 0.5 mg IM | 1 | 54 | Risk Ratio (M‐H, Fixed, 95% CI) | 0.81 [0.20, 3.27] |
| 1.3 Any IV Vitamin K (0.2 mg) versus any IM Vitamin K (0.2 mg and 0.5 mg) | 1 | 80 | Risk Ratio (M‐H, Fixed, 95% CI) | 1.56 [0.38, 6.46] |
| 2 Intraventricular hemorrhage > Grade II Show forest plot | 1 | Risk Ratio (M‐H, Fixed, 95% CI) | Subtotals only | |
| 2.1 0.2 mg IV versus 0.2 mg IM | 1 | 52 | Risk Ratio (M‐H, Fixed, 95% CI) | 2.0 [0.19, 20.72] |
| 2.2 0.2 mg IV versus 0.5 mg IM | 1 | 54 | Risk Ratio (M‐H, Fixed, 95% CI) | 0.72 [0.13, 3.96] |
| 2.3 Any IV Vitamin K (0.2 mg) versus any IM Vitamin K (0.2 mg and 0.5 mg) | 1 | 80 | Risk Ratio (M‐H, Fixed, 95% CI) | 1.04 [0.20, 5.31] |
| 3 Presence of PIVKA II at day 5 Show forest plot | 1 | Risk Ratio (M‐H, Fixed, 95% CI) | Subtotals only | |
| 3.1 0.2 mg IV versus 0.2 mg IM | 1 | 60 | Risk Ratio (M‐H, Fixed, 95% CI) | 1.52 [0.37, 6.23] |
| 3.2 0.2 mg IV versus 0.5 mg IM | 1 | 57 | Risk Ratio (M‐H, Fixed, 95% CI) | 2.07 [0.41, 10.43] |
| 3.3 Any IV Vitamin K (0.2 mg) versus any IM Vitamin K (0.2 mg and 0.5 mg) | 1 | 89 | Risk Ratio (M‐H, Fixed, 95% CI) | 1.74 [0.51, 6.00] |
| 4 Presence of PIVKA II at day 25 Show forest plot | 1 | Risk Ratio (M‐H, Fixed, 95% CI) | Subtotals only | |
| 4.1 0.2 mg IV versus 0.2 mg IM | 1 | 52 | Risk Ratio (M‐H, Fixed, 95% CI) | 1.08 [0.07, 16.36] |
| 4.2 0.2 mg IV versus 0.5 mg IM | 1 | 51 | Risk Ratio (M‐H, Fixed, 95% CI) | 1.04 [0.07, 15.74] |
| 4.3 Any IV Vitamin K (0.2 mg) versus any IM Vitamin K (0.2 mg and 0.5 mg) | 1 | 78 | Risk Ratio (M‐H, Fixed, 95% CI) | 1.06 [0.10, 11.15] |
| 5 Prolonged PT at day 5 Show forest plot | 1 | Risk Ratio (M‐H, Fixed, 95% CI) | Subtotals only | |
| 5.1 0.2 mg IV versus 0.2 mg IM | 1 | 63 | Risk Ratio (M‐H, Fixed, 95% CI) | 0.65 [0.24, 1.76] |
| 5.2 0.2 mg IV versus 0.5 mg IM | 1 | 60 | Risk Ratio (M‐H, Fixed, 95% CI) | 0.94 [0.30, 2.90] |
| 5.3 Any IV Vitamin K (0.2 mg) versus any IM Vitamin K (0.2 mg and 0.5 mg) | 1 | 92 | Risk Ratio (M‐H, Fixed, 95% CI) | 0.76 [0.30, 1.93] |
| 6 Vitamin K1 epoxide detected (≥ 10 ng/mL on day 5) Show forest plot | 1 | Risk Ratio (M‐H, Fixed, 95% CI) | Subtotals only | |
| 6.1 0.2 mg IV versus 0.2 mg IM | 1 | 61 | Risk Ratio (M‐H, Fixed, 95% CI) | 9.9 [0.56, 176.29] |
| 6.2 0.2 mg IV versus 0.5 mg IM | 1 | 58 | Risk Ratio (M‐H, Fixed, 95% CI) | 0.57 [0.19, 1.74] |
| 6.3 Any IV Vitamin K (0.2 mg) versus any IM Vitamin K (0.2 mg and 0.5 mg) | 1 | 90 | Risk Ratio (M‐H, Fixed, 95% CI) | 1.20 [0.38, 3.78] |
| 7 Vitamin K1 epoxide detected (≥ 0.3 ng/mL on day 25) Show forest plot | 1 | Risk Ratio (M‐H, Fixed, 95% CI) | Subtotals only | |
| 7.1 0.2 mg IV versus 0.2 mg IM | 1 | 52 | Risk Ratio (M‐H, Fixed, 95% CI) | 0.33 [0.01, 7.82] |
| 7.2 0.2 mg IV versus 0.5 mg IM | 1 | 54 | Risk Ratio (M‐H, Fixed, 95% CI) | 0.12 [0.01, 2.11] |
| 7.3 Any IV Vitamin K (0.2 mg) versus any IM Vitamin K (0.2 mg and 0.5 mg) | 1 | 80 | Risk Ratio (M‐H, Fixed, 95% CI) | 0.19 [0.01, 3.23] |
| 8 Necrotizing enterocolitis Show forest plot | 1 | Risk Ratio (M‐H, Fixed, 95% CI) | Subtotals only | |
| 8.1 0.2 mg IV versus 0.2 mg IM | 1 | 52 | Risk Ratio (M‐H, Fixed, 95% CI) | 1.0 [0.15, 6.57] |
| 8.2 0.2 mg IV versus 0.5 mg IM | 1 | 54 | Risk Ratio (M‐H, Fixed, 95% CI) | 1.08 [0.16, 7.10] |
| 8.3 Any IV Vitamin K (0.2 mg) versus any IM Vitamin K (0.2 mg and 0.5 mg) | 1 | 80 | Risk Ratio (M‐H, Fixed, 95% CI) | 1.04 [0.20, 5.31] |
| 9 Sepsis Show forest plot | 1 | Risk Ratio (M‐H, Fixed, 95% CI) | Subtotals only | |
| 9.1 0.2 mg IV versus 0.2 mg IM | 1 | 52 | Risk Ratio (M‐H, Fixed, 95% CI) | 1.0 [0.28, 3.58] |
| 9.2 0.2 mg IV versus 0.5 mg IM | 1 | 54 | Risk Ratio (M‐H, Fixed, 95% CI) | 0.86 [0.26, 2.86] |
| 9.3 Any IV Vitamin K (0.2 mg) versus any IM Vitamin K (0.2 mg and 0.5 mg) | 1 | 80 | Risk Ratio (M‐H, Fixed, 95% CI) | 0.92 [0.31, 2.72] |
| 10 Mortality (all infants) Show forest plot | 1 | Risk Ratio (M‐H, Fixed, 95% CI) | Subtotals only | |
| 10.1 0.2 mg IV versus 0.2 mg IM | 1 | 67 | Risk Ratio (M‐H, Fixed, 95% CI) | 1.32 [0.56, 3.14] |
| 10.2 0.2 mg IV versus 0.5 mg IM | 1 | 64 | Risk Ratio (M‐H, Fixed, 95% CI) | 2.82 [0.84, 9.46] |
| 10.3 Any IV Vitamin K (0.2 mg) versus any IM Vitamin K (0.2 mg and 0.5 mg) | 1 | 98 | Risk Ratio (M‐H, Fixed, 95% CI) | 1.77 [0.80, 3.93] |
| Outcome or subgroup title | No. of studies | No. of participants | Statistical method | Effect size |
| 1 Bleeding complications Show forest plot | 1 | Risk Ratio (M‐H, Fixed, 95% CI) | Subtotals only | |
| 1.1 0.2 mg IM versus 0.5 mg IM | 1 | 54 | Risk Ratio (M‐H, Fixed, 95% CI) | 0.12 [0.01, 2.11] |
| 2 Intraventricular hemorrhage > Grade II Show forest plot | 1 | Risk Ratio (M‐H, Fixed, 95% CI) | Subtotals only | |
| 2.1 0.2 mg IM versus 0.5 mg IM | 1 | 54 | Risk Ratio (M‐H, Fixed, 95% CI) | 0.36 [0.04, 3.24] |
| 3 Presence of PIVKA II at day 5 Show forest plot | 1 | Risk Ratio (M‐H, Fixed, 95% CI) | Subtotals only | |
| 3.1 0.2 mg IM versus 0.5 mg IM | 1 | 61 | Risk Ratio (M‐H, Fixed, 95% CI) | 1.36 [0.24, 7.57] |
| 4 Presence of PIVKA II at day 25 Show forest plot | 1 | Risk Ratio (M‐H, Fixed, 95% CI) | Subtotals only | |
| 4.1 0.2 mg IM versus 0.5 mg IM | 1 | 53 | Risk Ratio (M‐H, Fixed, 95% CI) | 0.96 [0.06, 14.60] |
| 5 Prolonged PT at day 5 Show forest plot | 1 | Risk Ratio (M‐H, Fixed, 95% CI) | Subtotals only | |
| 5.1 0.2 mg IM versus 0.5 mg IM | 1 | 61 | Risk Ratio (M‐H, Fixed, 95% CI) | 1.45 [0.53, 3.93] |
| 6 Vitamin K1 epoxide detected (≥ 10 ng/mL on day 5) Show forest plot | 1 | Risk Ratio (M‐H, Fixed, 95% CI) | Subtotals only | |
| 6.1 0.2 mg IM versus 0.5 mg IM | 1 | 61 | Risk Ratio (M‐H, Fixed, 95% CI) | 0.06 [0.00, 1.02] |
| 7 Vitamin K1 epoxide detected (≥ 0.3 ng/mL on day 25) Show forest plot | 1 | Risk Ratio (M‐H, Fixed, 95% CI) | Subtotals only | |
| 7.1 0.2 mg IM versus 0.5 mg IM | 1 | 54 | Risk Ratio (M‐H, Fixed, 95% CI) | 0.27 [0.03, 2.25] |
| 8 Necrotizing enterocolitis Show forest plot | 1 | Risk Ratio (M‐H, Fixed, 95% CI) | Subtotals only | |
| 8.1 0.2 mg IM versus 0.5 mg IM | 1 | 54 | Risk Ratio (M‐H, Fixed, 95% CI) | 1.08 [0.16, 7.10] |
| 9 Sepsis Show forest plot | 1 | Risk Ratio (M‐H, Fixed, 95% CI) | Subtotals only | |
| 9.1 0.2 mg IM versus 0.5 mg IM | 1 | 54 | Risk Ratio (M‐H, Fixed, 95% CI) | 0.86 [0.26, 2.86] |
| 10 Mortality (all infants) Show forest plot | 1 | Risk Ratio (M‐H, Fixed, 95% CI) | Subtotals only | |
| 10.1 0.2 mg IM versus 0.5 mg IM | 1 | 65 | Risk Ratio (M‐H, Fixed, 95% CI) | 2.13 [0.60, 7.51] |