Riesgo de cáncer ovárico en pacientes tratadas con fármacos estimulantes ováricos para la infertilidad
Resumen
Antecedentes
El uso de las técnicas de reproducción asistida ha aumentado, pero el posible vínculo entre los fármacos para la fertilidad y el cáncer de ovario aún es polémico.
Objetivos
Evaluar el riesgo de cáncer de ovario en las pacientes tratadas con fármacos estimulantes de la ovulación para la subfertilidad.
Métodos de búsqueda
Se buscaron estudios observacionales publicados y no publicados de 1990 a febrero de 2013. Se utilizaron las siguientes bases de datos: registro de ensayos del Grupo Cochrane de Cáncer Ginecológico (Cochrane Gynaecological Cancer Collaborative Review Group), Registro Cochrane Central de Ensayos Controlados (Cochrane Central Register of Controlled Trials, CENTRAL, Número 1, 2013), MEDLINE (hasta febrero de 2013, semana 4), EMBASE (hasta 2013, semana 9) y bases de datos de resúmenes de conferencias. También se hicieron búsquedas en las listas de referencias de los artículos obtenidos. La búsqueda no estuvo restringida por el idioma de publicación.
Criterios de selección
Se buscaron ensayos controlados aleatorios (ECA) y estudios no aleatorios, así como las series de casos clínicos que incluyeran más de 30 participantes e informaran sobre pacientes con exposición a fármacos estimulantes ováricos para el tratamiento de la subfertilidad y cáncer ovárico dudoso o invasivo histológicamente confirmados.
Obtención y análisis de los datos
Al menos dos revisores de forma independiente evaluaron la elegibilidad y el riesgo de sesgo y extrajeron los datos. Los estudios se agruparon según el fármaco para la fertilidad utilizado, con respecto a dos resultados: tumores ováricos dudosos y cáncer ovárico invasivo. Los resultados se expresaron como odds ratio (OR) ajustado, cociente de riesgos (CR), cociente de riesgos instantáneo (CRI) u OR crudo si los valores ajustados no se informaron, así como cociente de incidencia estandarizado (CIE) cuando se informó. No se realizaron metanálisis debido a la heterogeneidad metodológica y clínica esperada.
Resultados principales
Se incluyeron 11 estudios de casos y controles y 14 estudios de cohortes, con 182 972 mujeres.
Siete estudios de cohortes no mostraron pruebas de un aumento del riesgo de cáncer ovárico invasivo en pacientes con subfertilidad tratadas con cualquier fármaco comparadas con mujeres con subfertilidad sin tratar. Siete estudios de casos y controles no mostraron pruebas de un aumento del riesgo, comparadas con mujeres control con edad similar. Dos estudios de cohortes informaron una mayor incidencia de cáncer ovárico invasivo en pacientes con subfertilidad tratadas con cualquier fármaco para la fertilidad comparadas con la población general. Uno de estos estudios informó un CIE de 5,0 (intervalo de confianza [IC] del 95%: 1,0 a 15), según tres casos de cáncer, y una reducción del riesgo cuando los casos de cáncer diagnosticados en el transcurso del año de tratamiento se excluyeron del análisis (CIE 1,67; IC del 95%: 0,02 a 9,27). El otro estudio de cohortes informó un OR de 2,09 (IC del 95%: 1,39 a 3,12), según 26 casos.
Para los tumores ováricos dudosos, la exposición a cualquier fármaco para la fertilidad se asoció con un riesgo dos a tres veces mayor en dos estudios de casos y controles. Un estudio de casos y controles informó un OR de 28 (IC del 95%: 1,5 a 516), según solo cuatro casos. En un estudio de cohortes, se incrementó en más del doble la incidencia de tumores dudosos en comparación con la población general (CIE 2,6; IC del 95%: 1,4 a 4,6) y en otros el CRI par el riesgo de un tumor ovárico dudoso fue 4,23 (IC del 95%: 1,25 a 14,33) en pacientes con subfertilidad tratadas con fecundación in vitro (FIV) en comparación con un grupo no tratado con FIV con más de un año de seguimiento.
No hubo pruebas de un aumento del riesgo en las pacientes expuestas a clomifeno solo o clomifeno más gonadotropina, comparadas con las mujeres no expuestas. Un estudio de casos y controles informó un mayor riesgo en las pacientes que utilizaron gonadotropina menopáusica humana (HMG) (OR 9,4; IC del 95%: 1,7 a 52). Sin embargo, este cálculo se basa solamente en seis casos con antecedentes de administración de HMG.
Conclusiones de los autores
No se encontraron pruebas convincentes de un aumento del riesgo de tumores ováricos invasivos con la farmacoterapia para la fertilidad. Puede haber un aumento del riesgo de tumores ováricos dudosos en las pacientes con subfertilidad tratadas con FIV. Los estudios que mostraron un aumento del riesgo de cáncer ovárico tuvieron un riesgo general alto de sesgo debido al diseño retrospectivo de los estudios, a que no consideraron factores de confusión potenciales y a que los cálculos se basaron en un escaso número de casos. Se necesitan más estudios con bajo riesgo de sesgo.
PICO
Resumen en términos sencillos
¿Hay un mayor riesgo de cáncer ovárico en las pacientes tratadas con fármacos para la subfertilidad?
Los fármacos para estimular la ovulación se han utilizado ampliamente para diversos tipos de subfertilidad desde principios de los años sesenta y su uso ha aumentado en los últimos años. Las pacientes con subfertilidad se exponen frecuentemente a estos agentes, que se pueden administrar a dosis altas durante períodos largos de tratamiento para la subfertilidad. Hay incertidumbre acerca de la seguridad de estos fármacos y el riesgo potencial de que causen cánceres asociados con su uso.
En general, según 25 estudios que incluyeron 182 972 mujeres, no se encontraron pruebas de que el riesgo de cáncer ovárico aumente en las pacientes tratadas con fármacos para la fertilidad, comparadas con las pacientes con subfertilidad que no recibieron tratamiento con fármacos para la fertilidad, o en las mujeres de la población general.
Cinco de los 25 estudios mostraron un aumento del riesgo de cáncer ovárico, pero estos estudios fueron de calidad metodológica deficiente, por lo que los resultados son muy poco confiables para concluir que hay un riesgo definitivo de cáncer cuando se recibe tratamiento para la subfertilidad.
Se necesitan más estudios de investigación de alta calidad para determinar si hay un mayor riesgo de cáncer ovárico en las pacientes tratadas con fármacos para la fertilidad.
Authors' conclusions
Background
Description of the condition
The prevalence of subfertility in Western societies ranges from 3% to 33% (Boivin 2007; Chandra 1998; Greenhall 1990; Healy 1994; Karmaus 1999; Schmidt 1995). It is reported that in the UK one in seven heterosexual couples suffer from subfertility (NICE 2013). In less developed countries the prevalence has been reported as 6.9% to 9.3% (Boivin 2007). It is presumed that the differences in the prevalence of subfertility in different populations in the industrialised countries are mainly due to differences in the definitions and methods of measurement used. Subfertility has been defined as failure to conceive after frequent unprotected sexual intercourse for one year in the absence of known causes of subfertility (NICE 2013).
Description of the intervention
Fertility drugs are used during the follicular phase of the menstrual cycle to increase the serum concentration of gonadotrophins, with the aim of promoting maturation of multiple follicles and consequently multiple ovulations. Commonly used ovulation induction agents include: 1) anti‐oestrogens, such as clomiphene citrate; 2) tamoxifen, a selective oestrogen receptor modulator (SERM); 3) human menopausal gonadotrophin (HMG), which contains follicle‐stimulating hormone (FSH) and luteinising hormone; 4) human chorionic gonadotrophin (HCG); 5) gonadotrophin‐releasing hormone agonists (GnRH‐AG); 6) gonadotrophin‐releasing hormone antagonist (GnRH‐A); 7) purified FSH; 8) growth hormone and 9) insulin‐like growth factor (IGF) (Duffy 2010). These hormones are used either alone or in combination depending on the cause of infertility and the protocol used. In addition, other fertility drugs used in most regimes of assisted reproductive technologies, such as in vitro fertilisation (IVF), include progestogens to support the luteal phase of the menstrual cycle (Genc 2011).
How the intervention might work
Clomiphene citrate and tamoxifen (a selective oestrogen receptor modulator) are used for women whose failure to ovulate is due to a hypothalamic pituitary dysfunction type II (World Health Organization Classification, WHO) (Rowe 1993). Both drugs are prescribed during the early phase of the menstrual cycle (day two to six) in order to reduce the negative feedback caused by oestrogen and to result in an increase in GnRH secretion from the hypothalamus, which in turn leads to a rise in FSH and luteinising hormone production. These natural gonadotrophin hormones then stimulate the ovary to mature a follicle and ovulate. Gonadotrophins (HMG or HCG or FSH) are used in the treatment of subfertility in women with proven hypopituitarism or who have not responded to clomiphene or in superovulation treatment for assisted contraception, such as IVF. They are given with the aim of amplifying and prolonging the endogenous secretion of FSH and to ensure that at least two or three follicles are developed, in order to maximise pregnancy potential.
Growth hormone, insulin‐like growth factor (IGF) and GnRH all increase the sensitivities of the ovaries to gonadotrophin stimulation and enhance follicular development (Poretsky 1999) and have been shown to have a role in fertility treatment, since they can improve the outcome of ovarian stimulation therapy. Co‐treatment with growth hormone combined with HMG and HCG for ovulation induction has been suggested as a way to improve follicle growth, and probably pregnancy rate, in patients with hypogonadotropic hypogonadism (Homburg 1995). This reduces the gonadotropin dose requirement, reduces the duration of HMG treatment and improves success rates (Duffy 2010). The IGF system is composed of two ligands (IGF 1 and 2), two receptors and insulin‐like growth factor binding proteins (IGFBP). Women treated for subfertility with IGF require a lower gonadotropin stimulation dose and induction time (Genc 2011).
Studies have suggested that one long‐term effect of fertility drugs could be the development of ovarian cancer or borderline ovarian tumours. Borderline ovarian tumours possess many of the same morphological features as their malignant counterparts, but they do not destructively invade the ovarian stroma, and the women in whom they develop have a significantly more favourable prognosis than those with invasive ovarian cancers. Since the aetiology is largely unknown, it is difficult to explain the possible association between invasive ovarian cancers and borderline tumours, reproductive risk factors and the use of fertility drugs. However, it has largely been established that risk factors for the disease relate mostly to reproductive events and there is also a general agreement on the protective effects of pregnancy (Rish 1994) and oral contraceptive use (Whittemore 1992a). Several hypotheses have postulated ovulation as a potential biologic promoter of ovarian cancer. Research has shown that epithelial ovarian cancer might be caused by repeated ovulations, which disrupt the ovarian epithelium and lead to malignant transformation of the epithelial cells, the so called 'incessant ovulation' hypothesis. Genetic alterations may develop, due to the many micro‐traumata and the high mitotic activity associated with ovulation, eventually causing autonomic growth of the malignant cells (Fathalla 1971). According to the 'incessant ovulation' theory, promoting ovulation by ovulation induction medications might increase the frequency of invasive ovarian tumours, whilst any factor which suppresses ovulation, such as pregnancy, oral contraception, lactation and an early menopause, might reduce the risk of cancer.
Fertility medication stimulates multiple oocytes so there is simultaneous maturation and ovulation during one cycle. This serves to increase the mechanical trauma and the number of epithelial inclusions in the surface epithelium of the ovary (Meirow 1996). It has been estimated that a single cycle of ovulation induction, preparing for IVF, can be equivalent to two years of normal menstrual cycles, in term of the number of follicles produced and oestrogen concentrations achieved (Attia 2006). However, some epidemiological studies contradict this link (Booth 1989; Brinton 1989; Ron 1987; Rossing 1994; Whittemore 1992a). The risk of ovarian cancer in these studies was increased in women with ovulatory disturbances (either lack of ovulation or reduction in the number of ovulations over one year), while according to the 'incessant ovulation' theory, these women would have been expected to have a reduced risk of ovarian cancer. Moreover, Balasch 1993 critically reviewed the literature concerning follicular stimulation and ovarian cancer and concluded that even if an association between ovulation induction and ovarian cancer was found, it would not necessarily indicate an effect of ovarian stimulation. A more likely explanation is that an underlying ovulatory disorder or the absence of pregnancy predisposes the woman to cancer of the ovary (Balasch 1993).
The second hypothesis proposes a model in which persistent stimulation of gonadotrophins increases the risk of malignant changes directly, or by acting in combination with a raised concentration of oestrogen (Rish 1998). The gonadotrophin theory is based on the animal studies of Biskind carried out in 1944 (Biskind 1944). In this study, it was found that rats developed ovarian tumours of stromal origin (no epithelial tumours occurred) when they were manipulated to produce high concentrations of gonadotrophins.
Nevertheless, these data do not prove the existence of a casual relationship between iatrogenic raised serum gonadotrophin concentrations (i.e. prescribed by a health care provider and not naturally produced by the body) and the development of granulosa cell tumours. Other explanations are possible, such as tumour presence before fertility treatment initiation, or that the onset of the tumour during fertility treatment was coincidental (Meirow 1996). A study has suggested that persistent stimulation of the ovary by gonadotrophins may have a direct effect or may act through, or in combination with, raised concentrations of oestrogen (Henderson 1998). The gonadotrophin model is consistent with the known protective effects of each additional pregnancy and duration of oral contraceptive use, since both pregnancy and oral contraceptive use have been shown to lower basal as well as peak gonadotrophin stimulation (Henderson 1998). Another hypothesis frequently suggested is that an undiagnosed early ovarian cancer causes, in some manner, subfertility. This hypothesis was based upon epidemiological data which showed an increased rate of subfertility in patients with ovarian cancer (Harris 1992; Whittemore 1992a).
Why it is important to do this review
In spite of the increase in women requesting fertility treatments, and the incidence of ovarian cancer in most Western countries, the question of whether ovarian stimulation increases the incidence of ovarian cancer as an independent factor is still unanswered. Additionally, it is still difficult to separate the possible role of fertility drugs from underlying subfertility as risk factors for ovarian cancer. Although these are seemingly straightforward questions, ovarian cancer is a relatively rare outcome, and mostly occurs late in life, many years after normal childbearing age or fertility therapy. Moreover, there is still uncertainty over the role of various drugs, since limited information is available on the different potential effects they may have. An evaluation of risk factors for ovarian cancer was published in a combined analysis of 12 US case‐control studies of ovarian cancer diagnosed between 1956 and 1986 and conducted by the Collaborative Ovarian Cancer Group (US) (Whittemore 1992b). Only three of the 12 studies examined the association between the use of fertility drugs and invasive ovarian cancer; the others evaluated different reproductive and menstrual risk factors. The study showed a 2.7‐fold increased risk of ovarian cancer in subfertile women who had used fertility drugs as compared to no use and a 27‐fold higher risk in subfertile women who had never been pregnant compared to subfertile women who had been treated and conceived. In this study, subfertile women who had not used fertility drugs experienced no increased risk of ovarian cancer compared with women without a history of subfertility (Whittemore 1992b). This study had limitations, for example few of the women had used fertility medications, making the confidence interval around the risk estimates wide, and some of the fertility drugs when used were outdated (such as conjugated oestrogen and diethylstilbestrol) (Mahdavi 2006). Moreover, there was poor information given about the reasons for subfertility in the women included which made it impossible to separate the treatment effects from ovulatory abnormalities that themselves may increase the risk of ovarian cancer. Moreover, little or no information on the types of medications used or the duration of treatment was provided and also patients with ovarian cancer may have been more likely than the controls to recall their exposure to fertility drugs (recall bias), which could have overestimated the risk of association. Subsequently, a large cohort study also suggested an increased risk of invasive and borderline ovarian tumours among women using clomiphene citrate for 12 months or more (Rossing 1994), and between the use of fertility medications and non‐epithelial cancers (Horn‐Ross 1992). This finding was also confirmed by other authors (Harris 1992; Ness 2002; Nugent 1998; Parazzini 1998; Shushan 1996)
In contrast, several other epidemiological studies failed to confirm the above findings and do not show any association between women exposed to treatment with ovulation‐inducing drugs and untreated infertile woman (Brinton 2004; Dor 2002; Doyle 2002; Franceschini 1994; Jensen 2009; Modan 1998; Mosgaard 1997; Mosgaard 1998; Rossing 2004; Venn 1999).
Several reviews have evaluated the long‐term effects of ovulation‐promoting drugs on cancer risk (Brinton 2005; Brinton 2012; Gadducci 2013; He 2012; Mahdavi 2006) and, to our knowledge, there are only three systematic reviews and meta‐analyses (Kashyap 2003; Li 2013; Siristatidis 2013) evaluating the literature regarding the relationship between fertility drugs and ovarian cancer. One included seven case‐control and three cohort studies (Kashyap 2004), one included only six cohort studies (Li 2013) and the last published included only nine cohort studies calculating the risk of ovarian cancer in infertile women treated with fertility drugs. The authors in two of these meta‐analyses (Kashyap 2003; Li 2013) reported a significant elevated risk of ovarian cancer in treated subfertile patients when compared to the general population. However, data from cohort studies that compared treated with untreated subfertile patients suggests that treated patients may tend to have a lower incidence of ovarian cancer (Kashyap 2004). The last published meta‐analysis reported that fertility treatment is not associated with an elevated risk of ovarian cancer (Siristatidis 2013). This meta‐analyses included only some of the observational studies published on this topic up to 2013. It is therefore important to conduct an updated systematic review including all the available evidence published up to 2013.
Objectives
To evaluate the risk of ovarian cancer in women treated with ovulation stimulating drugs for subfertility.
Methods
Criteria for considering studies for this review
Types of studies
Randomised controlled trials (RCTs), non‐randomised studies (cohort studies and case‐control studies) and case series including more than 30 participants were eligible for inclusion.
Types of participants
Women aged 18 years and older with at least one ovary.
Types of interventions
The intervention or exposure of interest includes the following fertility medications: clomiphene citrate; selective oestrogen receptor modulator (SERM); luteinising hormone; follicle‐stimulating hormone (FSH); purified FSH; human chorionic gonadotrophin (HCG); gonadotrophin‐releasing hormone agonist (GnRH‐AG); gonadotrophin‐releasing hormone antagonist (GnRH‐A) and growth hormone. The comparison groups included either subfertile women not treated with any of the above mentioned fertility drugs, or women from the general population who did not receive fertility treatment.
Types of outcome measures
Primary outcomes
The primary outcome or case of interest is a new diagnosis of primary borderline ovarian tumour or malignant ovarian tumour of epithelial, germ cell or stroma origin and confirmed by histology investigations.
Secondary outcomes
None.
Search methods for identification of studies
Electronic searches
We carried out a comprehensive search for published and unpublished observational studies from 1990 to February 2013. We restricted our search to start from 1990 as subfertility and especially fertility treatment increased in the UK and US after 1988. In addition, in initial scoping searches we did not find any articles referring to any significant research in this topic area published before 1990. We used the following databases: the Cochrane Gynaecological Cancer Collaborative Review Group's Trial Register, the Cochrane Central Register of Controlled Trials (CENTRAL 2013, Issue 1) (Appendix 1), MEDLINE (to February week 4 2013) (Appendix 2) and EMBASE (to 2013 week 09) (Appendix 3).
Searching other resources
Unpublished and grey literature
We searched for studies published or ongoing using the MetaRegister (http://www.controlled‐trials.com), Physicians Data Query (http://www.nci.nih.gov), http://www.clinicaltrials.gov and http://www.cancer.gov/clinicaltrials.
We searched conference proceedings and abstracts though ZETOC (http://zetoc.mimas.ac.uk) and WorldCat Dissertations. Moreover, we checked the citation lists of included studies, key text books and previous systematic reviews through handsearching, and contacted experts in the field to identify further reports of trials. If other relevant articles were identified, we searched them for candidate articles. We handsearched reports of conferences in the following sources: Gynecologic Oncology (Annual Meeting of the American Society of Gynecologic Oncologist), International Journal of Gynecological Cancer (Annual Meeting of the International Gynecologic Cancer Society), British Journal of Cancer, British Cancer Research Meeting, Annual Meeting of the European Society of Medical Oncology (ESMO) and the Annual Meeting of the American Society of Clinical Oncology (ASCO).
Data collection and analysis
Selection of studies
We downloaded all titles and abstracts retrieved by electronic searching to a reference management database (Reference Manager), removed duplicates and two review authors (IR, RB) independently examined the remaining references. Those studies which clearly did not meet the inclusion criteria were excluded and we obtained copies of the full text of potentially relevant references. At least two review authors (IR and RB or LS) assessed independently the eligibility of the retrieved papers. Disagreements were resolved by discussion between the two review authors and if necessary by the third review author. We documented reasons for exclusion.
Data extraction and management
For included studies we extracted data on study design, characteristics of patients (such as eligibility criteria, age, parity, use of oral contraceptive pill, medical diagnosis of subfertility, age of menarche and family history of ovarian cancer), interventions (type of treatment, dosage and number of treatment cycles), risk of bias, duration and person‐years of follow‐up, histological type of ovarian cancer, summary effect estimates, factors adjusted for, unadjusted and adjusted summary statistics and where the study was conducted.
We extracted the number of participants with ovarian cancer in each treatment or exposure group and the number of participants assessed at endpoint and unadjusted and adjusted summary statistics. We noted the time points at which outcomes were collected and reported. Two review authors (IR, RB) abstracted data independently onto a data abstraction form specially designed for the review and a third review author (LS) checked the extraction, in addition to resolving any differences between review authors.
Assessment of risk of bias in included studies
As we did not find any RCTs the assessment of risk of bias focused exclusively on non‐randomised studies.
We assessed the risk of bias in non‐randomised studies in accordance with the Cochrane Handbook for Systematic Reviews of Interventions sections 13.5 and 8.5 (Higgins 2011).
We assessed the likelihood of bias due to selection bias, control of confounding, performance bias, detection bias and attrition bias. We rated studies eliciting a positive response to the following questions as low risk of bias.
Selection bias and control of confounding
-
Demonstration that women did not have ovarian cancer at the start of the study and had at least one ovary (cohort studies).
-
All eligible cases over a defined period of time or a random sample or consecutive series of those cases (case‐control studies).
-
Community controls derived from the same population as the cases (case‐control studies).
Control of confounding
We pre‐specified the following factors as potential confounders and noted whether they were balanced at baseline (or at outcome assessment for studies where participants were allocated to groups on the basis of outcome) between the two groups, or balanced through matching at the time when participants were allocated to groups or adjusted through an adjusted analysis. These factors were chosen as they are known risk factors for ovarian cancer (cohort studies/case‐control studies).
Risk factors: age, parity, use of oral contraceptive pill, family history of ovarian cancer, age of menarche, age of menopause, smoking, body mass index (BMI), breast‐feeding, use of hormone replacement therapy (HRT), social class, hysterectomy status and causes of subfertility.
Performance bias
-
Exposure to fertility drugs was ascertained by medical record review (cohort studies/case‐control studies).
-
The same method to ascertain exposure to fertility drugs was used for cases and controls (case‐control studies).
-
Assessors of exposure to fertility drugs were blinded to the presence or absence of ovarian cancer (cohort studies/case‐control studies).
Detection bias
-
Ovarian cancer was confirmed by histology (cohort studies).
-
Ovarian cancer confirmed by histology in the cases and no clinical evidence of cancer in the controls (case‐control studies).
-
Assessors of cancer status were blinded to exposure status (cohort studies/case‐control studies).
Attrition bias
-
Women exposed to ovarian stimulating drugs and unexposed women in the control group were followed up for the same length of time (cohort studies/case‐control studies).
-
At least 80% of women in all groups were included in the final analysis, or the description of those not included was not suggestive of bias (cohort studies/case‐control studies).
Measures of treatment effect
We extracted all the summary statistics as reported from each study. These included the crude and adjusted odds ratio (OR), risk ratio (RR), hazard ratio (HR) with their respective 95% confidence interval (CI). For studies not reporting relative treatment effects we report the standardised incidence ratio (SIR) with 95% CI. For studies that reported both relative treatment effects and incidence ratios, we preferentially focus on the relative effect estimates in the text but report incidence ratios for completeness.
Unit of analysis issues
None were expected.
Dealing with missing data
We did not impute missing outcome data for the primary outcome. We did not contact study authors to obtain missing outcome data.
Assessment of heterogeneity
As non‐randomised studies are expected to be more heterogeneous than randomised trials, due to methodological diversity and greater susceptibility to bias, we showed the variation in study findings by presenting a forest plot with the pooled estimate suppressed.
Assessment of reporting biases
We did not formally assess publication bias as we did not anticipate conducting a meta‐analysis. We conducted a qualitative assessment of the likely impact of publication bias only.
Data synthesis
Our protocol specified that meta‐analysis would be conducted where appropriate. However, meta‐analysis was not performed due to methodological and clinical heterogeneity between studies, suggesting that any overall statistical summary may be misleading. Instead we grouped studies by type of drug given and present results as a narrative summary in the text and in tables and a forest plot without an overall summary statistic. Synthesis of the data focused on describing the consistency of effect of ovulation stimulating drugs in causing ovarian cancer, assessing the risk of bias and investigating factors that may explain differences between the results of studies.
Subgroup analysis and investigation of heterogeneity
As we did not perform a meta‐analysis due to expected heterogeneity, we were unable to conduct quantitative subgroup analyses. Instead, we provide a qualitative description of the differences in the results between different types of fertility drugs, by whether control groups included infertile women untreated with ovarian stimulating drugs or women from the general population, by parity and for different histological types of ovarian cancer.
Sensitivity analysis
Sensitivity analysis was not specified as we did not plan meta‐analysis.
Results
Description of studies
Results of the search
The search of all the databases resulted in a large number of studies (5176), of which we deemed 216 potentially eligible after having read the titles and abstracts and for which we obtained hard copies of the full article for further scrutiny. From these 116 were excluded (Figure 1). There were no articles meeting the eligibility criteria that required translation. All the articles had an abstract in the English language. We did not identify any RCTs to include.
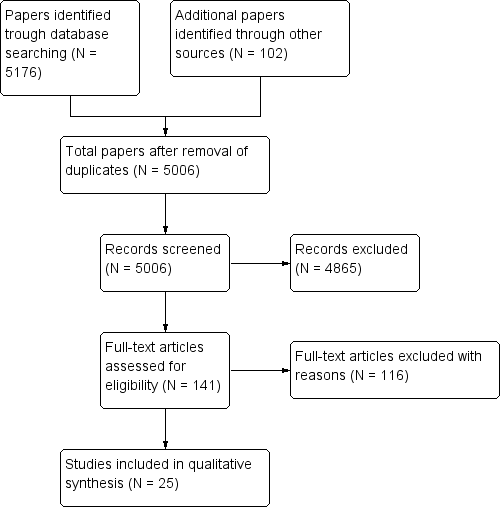
Identification and selection of studies.
Included studies
Cohort studies
Fourteen cohort studies (Brinton 2004; Calderon‐Margalit 2009; Dor 2002; Dos Santos Silva 2009; Doyle 2002; Kallen 2011; Lerner‐Geva 2003; Lerner‐Geva 2012; Modan 1998; Potashnik 1999; Sanner 2009; Van Leeuwen 2011; Venn 1999; Yli‐Kuha 2012) were included. Seven studies (Brinton 2004; Calderon‐Margalit 2009; Dos Santos Silva 2009; Doyle 2002; Modan 1998; Sanner 2009; Van Leeuwen 2011) compared the risk of ovarian cancer in subfertile women treated with ovarian stimulating drugs with the risk in untreated subfertile women attending the same fertility clinics. Four of these cohort studies also reported the standardised incidence ratio (SIR) for comparison with the general population (Brinton 2004; Sanner 2009; Van Leeuwen 2011; Venn 1999). Five (Dor 2002; Lerner‐Geva 2003; Lerner‐Geva 2012; Modan 1998; Venn 1999; Yli‐Kuha 2012) only compared the risk of ovarian cancer in women treated with ovarian stimulating drugs with the risk in the general population. One compared the risk in women who gave birth after IVF treatment with women who gave birth during the same observation period (Kallen 2011).
One cohort study was conducted in the US (Brinton 2004), six in Israel (Calderon‐Margalit 2009; Dor 2002; Lerner‐Geva 2003; Lerner‐Geva 2012; Modan 1998; Potashnik 1999), two in the UK (Doyle 2002; Dos Santos Silva 2009), one in Australia (Venn 1999); two in Sweden (Kallen 2011; Sanner 2009), one in the Netherlands (Van Leeuwen 2011) and one in Finland (Yli‐Kuha 2012). Twelve were multicentre studies while the other two were conducted in single centres. All cohort studies were conducted retrospectively and almost all (12 out of 13) sampled women from fertility clinics, while one selected their sample from women enrolled in the Jerusalem Perinatal Study (Calderon‐Margalit 2009). All cohort studies were conducted between 1960 and 2009.
All women in the cohort studies were either premenopausal or with a premature menopause, with at least one ovary and free from ovarian cancer at the start of the study. Almost all the studies used HCG, clomiphene citrate, HMG and GnRH alone or as co‐therapy with each other as ovarian stimulating drugs, but the number of cycles and doses used were not reported in 10 studies (Calderon‐Margalit 2009; Dor 2002; Dos Santos Silva 2009; Doyle 2002; Kallen 2011; Lerner‐Geva 2003; Lerner‐Geva 2012; Modan 1998; Potashnik 1999; Venn 1999; Yli‐Kuha 2012). Duration of follow‐up was more than 10 years in eight studies (Brinton 2004; Calderon‐Margalit 2009; Dos Santos Silva 2009; Lerner‐Geva 2012; Modan 1998; Potashnik 1999; Venn 1999; Van Leeuwen 2011). In two cohort studies (Dor 2002; Lerner‐Geva 2003) the length of follow‐up was not reported clearly, and in three cohort studies (Doyle 2002; Kallen 2011; Yli‐Kuha 2012) the subfertile women treated were followed up for less than 10 years. One study reported 30 years of follow‐up (Lerner‐Geva 2012).
Case‐control studies
Eleven case‐control studies (Franceschini 1994; Jensen 2009; Kurta 2012; Mosgaard 1997; Mosgaard 1998; Parazzini 1997; Parazzini 1998; Parazzini 2001; Rossing 1994; Rossing 2004; Shushan 1996), two of which were nested case‐control studies (Jensen 2009; Rossing 1994) were included. All studies were conducted between 1994 and 2008. One was conducted in Israel (Shushan 1996), three in the US (Kurta 2012; Rossing 2004; Rossing 1994), three in Denmark (Jensen 2009; Mosgaard 1997; Mosgaard 1998) and four in Italy (Franceschini 1994; Parazzini 1997; Parazzini 1998; Parazzini 2001). Characteristics of the study samples can be seen in Characteristics of included studies.
Two of eight case‐control studies (Parazzini 1998; Rossing 1994) involved women from a single hospital, while the others were multicentre studies. In one study the cases and controls were selected from the Hormones and Ovarian Cancer Prediction (HOPE) study, a national population case‐control study (Kurta 2012). In six case‐control studies (Jensen 2009; Mosgaard 1997; Mosgaard 1998; Rossing 1994; Rossing 2004; Shushan 1996), the cases were selected from the National Cancer Registry and controls from the same hospital or from the same geographical area as the cases. In the other four case‐control studies (Franceschini 1994; Parazzini 1997; Parazzini 1998; Parazzini 2001) the cases were selected from hospitals. The cases had ages ranging from 22 to 79 years old and included invasive ovarian cancer and borderline ovarian tumours. The controls were of a similar age, ranging from 16 to 79 years old.
Only in five case‐control studies was the type of ovarian‐stimulating drug clearly reported (Jensen 2009; Kurta 2012; Mosgaard 1997; Mosgaard 1998; Rossing 1994) and was clomiphene citrate, HCG, HMG and gonadotrophins alone or as co‐therapy, while in six the specific drugs used were unreported (Franceschini 1994; Parazzini 1997; Parazzini 1998; Parazzini 2001; Rossing 2004; Shushan 1996). Moreover, the number of cycles and dose used were clearly reported for some of the drugs used in two studies only (Jensen 2009; Rossing 2004). The duration between exposure and follow‐up was the same for cases and controls in four case‐control studies (Mosgaard 1998; Parazzini 1998; Parazzini 1997; Parazzini 2001). It was unclear in two studies (Kurta 2012; Shushan 1996) and it was not the same in three studies (Franceschini 1994; Mosgaard 1997; Rossing 2004).
Excluded studies
We excluded 116 studies after having read the entire text, mostly because they reported on multiple risk factors for invasive ovarian cancer in subfertile women and/or subfertility and other known risk factors for epithelial ovarian cancer. Four studies (Artini 1997; Balasch 1993; Franco 2000; Lopes 1993) were excluded because they were reviews of case reports. Three studies were excluded (Dos Santos 2002; Goldberg 1992; Willemsen 1993) as they were case series reporting 30 cases or fewer, and one study was excluded as the diagnosis of ovarian cancer in the cases was not confirmed by histological reports, but was diagnosed according to ultrasonographic findings (Pozlep 2001). Eight articles (Franceschini 1994; Harris 1992; Horn‐Ross 1992; Negri 1991; Ness 2000; Ness 2002; Whittemore 1992a; Whittemore 1994) were excluded as they were not primary studies, but were pooled (secondary) analyses of case‐control and cohort studies reporting the risk of ovarian cancer in subfertile women using ovarian‐stimulating drugs. One study was excluded because the data were published only as an abstract and were not fully informative of the risk of ovarian cancer calculated by the author (Croughan‐Minihane 2001).
Risk of bias in included studies
Overall study quality was highly variable between studies and as all the studies were non‐randomised we judged none of them to be of low risk of bias (Figure 2).

'Risk of bias' graph: review authors' judgements about each risk of bias item presented as percentages across all included studies.
Allocation
In all 13 cohort studies selection bias was minimised. The sample consisted of all women attending fertility or gynaecological clinics (or both) during the defined study period and they were recruited consecutively. At the study inception women had no history of ovarian cancer and all had at least one ovary.
In six case‐control studies (Jensen 2009; Mosgaard 1997; Mosgaard 1998; Rossing 1994; Rossing 2004; Shushan 1996), the cases were selected from the National Cancer Registry and controls from the same hospital or from the same geographical area as the cases. On the contrary, in the other four case‐control studies (Franceschini 1994; Parazzini 1997; Parazzini 1998; Parazzini 2001) the cases were selected from hospitals. Age‐matched controls were selected from the general population in the same geographic area from which cases arose in three studies (Mosgaard 1997; Mosgaard 1998; Rossing 2004). In four studies hospital‐based controls were selected from hospital clinics for non‐gynaecological conditions serving the same areas as those from which cases were selected (Franceschini 1994; Parazzini 1997; Parazzini 1998; Parazzini 2001). In four studies controls were women attending hospital clinics for non‐neoplastic gynaecologic conditions (Franceschini 1994; Parazzini 1997; Parazzini 1998; Parazzini 2001) and in one women were part of the control group used in the Women's Contraceptive and Reproductive Experiences (CARE) study of breast cancer which was another study conducted contemporaneously (Rossing 2004). Two nested case‐control studies randomly selected controls from the entire cohort of women in the study (Jensen 2009; Rossing 1994). One case‐control study obtained cases and controls from a national case‐control study involving several hospitals (Kurta 2012).
Only two studies matched or adjusted for all or most of the pre‐specified risk factors that we identified as potential confounders, such as age, parity, use of oral contraceptive pill, family history of ovarian cancer, age of menarche, age of menopause, smoking, high BMI, breast‐feeding and use of HRT (Jensen 2009; Mosgaard 1997).
Of the 13 cohort studies, five (Dor 2002; Lerner‐Geva 2003; Modan 1998; Potashnik 1999; Venn 1999) only reported the SIR which was adjusted for age. Two studies adjusted for calendar time (Brinton 2004); one for area of residence (Brinton 2004); two studies for type of infertility (Brinton 2004; Sanner 2009); three studies for parity (Brinton 2004; Rossing 1994; Sanner 2009); six studies for age (Brinton 2004; Calderon‐Margalit 2009; Kallen 2011; Rossing 2004; Sanner 2009; Van Leeuwen 2011); two for use of the oral contraceptive pill (Brinton 2004; Sanner 2009); one only for smoking and year of delivery after IVF (Kallen 2011); one for the presence of endometriosis or tubal factor as reason for subfertility (Van Leeuwen 2011) and one for marital status and socioeconomic position (Yli‐Kuha 2012).
Of the 11 case‐control studies only one did not control for confounding in the analyses and only reported a crude estimate (Parazzini 2001). All the other studies adjusted for age (Franceschini 1994; Jensen 2009; Kurta 2012; Mosgaard 1997; Mosgaard 1998; Parazzini 1997; Parazzini 1998; Rossing 1994; Rossing 2004; Shushan 1996). Two adjusted for ethnicity (Kurta 2012; Rossing 2004) and one for region of birth (Shushan 1996). Four studies adjusted for family history of ovarian cancer (Jensen 2009; Kurta 2012; Mosgaard 1997; Shushan 1996); one for smoking (Mosgaard 1998); seven for parity (Franceschini 1994; Jensen 2009; Parazzini 1997; Parazzini 1998; Rossing 1994; Rossing 2004; Shushan 1996); one for history of previous cancer (Mosgaard 1997); four for area of residence (Franceschini 1994; Mosgaard 1997; Mosgaard 1998; Rossing 2004); six for education (Franceschini 1994; Jensen 2009; Kurta 2012; Parazzini 1997; Parazzini 1998; Shushan 1996); two for hormonal replacement therapy (Mosgaard 1997; Mosgaard 1998); one for intrauterine device (Mosgaard 1997); two for oral contraceptive pill use (Jensen 2009; Kurta 2012); two for body mass index (Mosgaard 1997; Shushan 1996); one for menopausal status (Mosgaard 1997; Jensen 2009); one for age at menopause, history of subfertility, spontaneous miscarriage and termination of pregnancy (Jensen 2009); two for the number of births (Kurta 2012; Rossing 2004) and one for race, tubal ligation, age at menarche, duration of breast‐feeding, perineal talc use and family history of ovarian or breast cancer (or both) (Kurta 2012). See Table 1 and Table 2.
| Cohort studies | |||||||
| Study | Ovarian cancer type | Total number of exposed cases versus unexposed | Drug, dose and number of cycles | Crude estimate (95% CI) | Adjusted estimate RR (95% CI) | Factors adjusted for | Standardised incidence ratio (SIR) |
| Modan 1998 | Invasive | 1309 versus 1187 | Fertility drugs | — | — | — | 1.6 (0.8 to 2.9) |
| Clomiphene citrate/HMG | — | — | — | Not calculated | |||
| Clomiphene citrate | — | — | — | 2.7 (0.97 to 5.8) | |||
| HMG | — | — | — | Not calculated | |||
| Potashnik 1999 | Invasive | 780/417 | Fertility drugs | — | — | — | 0.91 (0.10 to 3.27) |
| Venn 1999 | Invasive | 20,656 versus 9044 | Fertility drugs | — | — | — | Any drug: 0.88 (0.42 to 1.84) 1 to 2 cycles IVF: 1.26 (0.41 to 3.90) 3 to 5 cycles: 0.71 (0.10 to 5.03) > 6 cycles: 2.00 (0.3 to 14.2) |
| Clomiphene citrate | — | — | — | 2.46 (0.35 to 17.5) | |||
| Clomiphene citrate + HMG | — | — | — | 0.77 (0.19 to 3.07) | |||
| HMG | — | — | — | 1.14 (0.16 to 8.10) | |||
| HMG + GnRH | — | — | — | 0.48 (0.07 to 3.38) | |||
| Doyle 2002 | Invasive | 4188 versus 1231 | Fertility drugs | — | Hazard rate ratio 0.59 (0.12 to 3.00) | Age at first clinical visit, years of first clinical visit, parity, time since first treatment and age at the end of follow‐up | — |
| Dor 2002 | Invasive | 1254 versus 3772 | Fertility drugs | — | — | — | 1 to 2 IVF cycles: 0.98 (0.45 to 1.86) 3 to 5 IVF cycles: 1.21 (0.52 to 2.39) > 6 cycles: 0 (0 to 1.20) |
| Lerner‐Geva 2003 | Invasive | 1082 versus 5920 | Fertility drugs | — | — | — | 5.0 (1.02 to 14.6) |
| Brinton 2004 | Invasive | 4143 versus NR | Clomiphene citrate | Rate ratio 0.82 (0.4 to 1.5) | 1 to 900 mg rate ratio: 0.94 (0.4 to 2.3) 901 to 2250 mg: 0.71 (0.2 to 2.0) > or equal to 2251 mg: 0.80 (0.3 to 2.1) < 6 cycles: 0.85 (0.4 to 1.7) 6 to 11 cycles: 0.44 (0.1 to 1.9) > or equal to 12 cycles: 1.54 (0.5 to 5.1) | Age, calendar time, area of residence, parity at first visit | — |
| Gonadotrophins | Rate ratio 1.09 (0.4 to 2.8) | Dosage (amps) 1 to 24: rate ratio 1.36 (0.3 to 5.7) > or equal to 25: 0.96 (0.3 to 3.1) 1 to 2 cycles: 0.95 (0.2 to 3.9) > or equal 3 cycles: 1.21 (0.4 to 3.9) | Age, calendar time, area of residence, parity at first visit | — | |||
| Gonadotrophins + clomiphene citrate | — | Rate ratio 1.02 (0.3 to 2.8) | Age, calendar time, area of residence, parity at first visit | — | |||
| Calderon‐Margalit 2009 | Invasive | 929 versus 14,463 | Fertility drugs | HR 0.61 (0.08 to 4.42) | Age | — | |
| Clomiphene citrate | HR 0.98 (0.14 to 7.11) | Age | — | ||||
| Sanner 2009 | Invasive | 1153 versus 1615 | Fertility drugs | — | — | — | 1.19 (0.54 to 2.25) |
| Borderline | Fertility drugs | — | — | — | 2.62 (1.35 to 4.58) | ||
| Invasive | Gonadotrophins | RR 3.55 (1.23 to 10.24) | 5.21 (1.67 to 16.20) (a) 5.28 (1.70 to 16.47) (b) | a) Age and indication b) Pregnancy during follow‐up | 2.29 (0.84 to 4.97) | ||
| Borderline | Gonadotrophins | RR 0.95 (0.11 to 8.11) | 1.11 (0.12 to 10.17) (a) 1.12 (0.12 to 10.32) (b) | a) Age and indication b) Pregnancy during follow‐up | 1.88 (0.05 to 10.45) | ||
| Invasive | Clomiphene citrate | RR 1.12 (0.24 to 5.29) | 1.52 (0.3 1,7.79) (a) 1.57 (0.32,7.62) (b) | a) Age and indication b) Pregnancy during follow‐up | 0.92 (0.11 to 3.32) | ||
| Borderline | Clomiphene citrate | RR 2.70 (0.64 to 11.28) | 3.06 (0.69 to 13.68) (a) 3.25 (0.72 to 14.51) (b) | a) Age and indication b) Pregnancy during follow‐up | 4.59 (0.95 to 13.42) | ||
| Invasive | Clomiphene citrate + gonadotrophins | RR 0.48 (0.06 to 3.80) | 0.72 (0.09 to 6.00) (a) 0.74 (0.09 to 6.22) (b) | a) Age and indication b) Pregnancy during follow‐up | 0.36 (0.01 to 2.00) | ||
| Borderline | Clomiphene citrate + gonadotrophins | RR 2.28 (0.55 to 9.54) | 2.70 (0.58 to 12.65) (a) 2.90 (0.62 to 13.55) (b) | a) Age and indication b) Pregnancy during follow‐up | 3.99 (0.82 to 11.67) | ||
| Dos Santos Silva 2009 | Invasive | 3194 versus 3976 | Fertility drugs | — | 1.42 (0.53 to 3.99) | Age, calendar time, area of residence, parity at first visit | 1.10 (0.57 to 1.93) |
| Kallen 2011 | Invasive | 24,058/1,394,061 | Fertility drugs | — | 2.09 (1.39 to 3.12) | Year of delivery after IVF, age and smoking | |
| Van Leeuwen 2011 | Invasive | 19,146/6006 | Fertility drugs | — | — | — | 1.35 (0.91 to 1.92) Excluding the first year: 1.30 (0.86 to 1.88) |
| HMG/FSH | — | — | — | 1 to 40 ampoules: 1.25 (0.41 to 2.93) 41 to 80: 1.21 (0.39 to 2.83) > 81: 1.58 (0.68 to 3.11) | |||
| IVF | — | 1.14 (0.54 to 2.41) (a) 1.51 (0.65 to 3.54) (b) 2.26 (0.78 to 6.55) (c) | a) Age, endometriosis b) > 1 year follow‐up c) > 10 years follow‐up | 1 to 2 cycles: 1.35 (0.68 to 2.42) 3 to 4 cycles: 1.19 (0.57 to 2.18) > 5 cycles: 1.41 (0.57 to 2.90) | |||
| Borderline | Fertility drugs | — | — | — | 1.93 (1.31 to 2.73) Excluding the first year: 1.76 (1.16 to 2.56) | ||
| HMG/FSH | — | — | — | 1 to 40 ampoules: 1.75 (0.57 to 4.08) 41 to 80: 2.03 (0.74 to 4.42) > 81: 1.69 (0.62 to 3.69) | |||
| IVF | — | 6.38 (2.05 to 19.84) (a) 4.23 (1.25 to 14.33) (b) 2.26 (0.46 to 11.05) (c) | a) For age, tubal problems and parity b) > 1 year follow‐up c) > 10 years | 1 to 2 cycles: 1.70 (0.97 to 3.74) 3 to 4 cycles: 1.99 (1.22 to 4.14) > 5 cycles: 1.45 (0.47 to 3.38) | |||
| Yli‐Kuha 2012 | Invasive | 9175/9175 | IVF | — | 2.75 (0.69 to 9.63) 2.25 (0.59 to 8.68) excluding first year after treatment | Adjusted for marital status and socioeconomic position | — |
| Borderline | 1.68 (0.31 to 9.27) 2.25 (0.59 to 8.68) excluding first year after treatment | Adjusted for marital status and socioeconomic position | — | ||||
| Lerner‐Geva 2012 | Invasive | 2431/NR | Clomiphene citrate | — | — | — | 1.33 (0.57 to 2.63) |
| Clomiphene citrate + HMG | — | — | — | NR | |||
| HMG | — | — | — | 0.74 (0.01 to 4.12) | |||
FSH: follicle‐stimulating hormone
GnRH: gonadotrophin realising hormone
HCG: human chorionic gonadotrophin
HMG: human menopause gonadotrophin
HR: hazard ratio
IVF: in vitro fertilisation
NR: not reported
RR: risk/rate ratio
| Case‐control studies | ||||||
| Study | Ovarian cancer type | Total number of cancer cases/controls | Drug | Crude OR (95% CI) | Adjusted odds ratio (95% CI) | Factor adjusted for |
| Rossing 1994 | Invasive/borderline | 135 / NR | Clomiphene citrate | Rate ratio 11.00 (1.50 to 80.67) | Rate ratio > 1 year 11 (1.5 to 8.2) | Parity |
| — | Rate ratio > 1 year 7.2 (1.2 to 43.9) | Age | ||||
| — | Rate ratio < 1 year 0.7 (0.1 to 4.6) | Age | ||||
| — | Rate ratio < 1 year 0.8 (0.1 to 5.7) | Parity | ||||
| HCG | — | Rate ratio 1.0 (0.2 to 4.1) | Age | |||
| — | Rate ratio 1.0 (0.2 to 4.3) | Parity | ||||
| Franceschini 1994 | Invasive | 195 / 1339 | Fertility drugs | 0.8 (0.2 to 3.7) | 0.7 (0.2 to 3.7) | Age, area of residence, education, |
| Sushan 1996 | Invasive | 68 / 77 | Fertility drugs | 1.78 (0.97 to 3.27) | 1.31 (0.63 to 2.74) | Age, parity, BMI, region of birth, education, family history, interviewer |
| Borderline | 26 / 77 | Fertility drugs | 5.03 (2.04 to 12.22) | 3.52 (1.23 to 10.09) | Age, parity, BMI, region of birth, | |
| Invasive | Clomiphene citrate | 1.32 (0.57 to 3.01) | 0.88 (0.33 to 2.34) | Age, parity, BMI, region of birth, | ||
| Borderline | Clomiphene citrate | 1.62 (0.25 to 7.87) | 1.28 (0.25 to 6.87) | Age, parity, BMI, region of birth, | ||
| Invasive | HMG | 3.95 (1.33 to 12.2) | 3.19 (0.86 to 11.82) | Age, parity, BMI, region of birth, | ||
| Borderline | HMG | 14.58 (3.82 to 55.91) | 9.38 (1.66 to 52.08) | Age, parity, BMI, region of birth, | ||
| Invasive | HMG/clomiphene citrate | 1.97 (1.03 to 3.77) | 1.42 (0.65 to 3.12) | Age, parity, BMI, region of birth, | ||
| Borderline | HMG/clomiphene citrate | 4.86 (1.81 to 12.79) | 3.08 (0.98 to 9.69) | Age, parity, BMI, region of birth, | ||
| Parazzini 1997 | Invasive | 971 / 2758 | Fertility drugs | 0.5 (0.1 to 3.6) 0.6 (0.1 to 3.5) | 1.1 (0.4 to 3.3) < 6 cycles 0.7 (0.1 to 7.9) 1.0 (0.2 to 3.8) | Age, education, OCP, parity |
| Mosgaard 1997 | Invasive | 684 / 1721 | Fertility drugs | Nulliparous 0.80 (0.92to 5.58) | Nulliparous 0.83 (0.35 to 2.01) 0.56 (0.24 to 1.29) | Age, residence, use of OCP, menopausal status, previous cancer, family history, HRT, BMI |
| Clomiphene citrate | Nulliparous 0.69 (0.23 to 1.96) | Nulliparous 0.67 (0.23 to 1.96) 1.11 (0.4 to 3.06) | Age, residence, use of OCP, menopausal status, previous cancer, family history, HRT, BMI | |||
| Clomiphene citrate + HCG | Nulliparous 1.99 Parous 0.24 | Nulliparous 1.12 (0.32 to 3.96) 0.56 (0.12 to 2.7) | Age, residence, use of OCP, menopausal status, previous cancer, family history, HRT, BMI | |||
| HMG + HCG | Nulliparous 1.06 Parous 0.54 | Nulliparous 0.82 (0.18 to 3.71), 0.5 (0.10 to 2.47) | Age, residence, use of OCP, menopausal status, previous cancer, family history, HRT, BMI | |||
| Parazzini 1998 | Borderline | 92 / 273 | Fertility drugs | 27.5 (1.5 to 51.60) | — | — |
| Mosgaard 1998 | Borderline | 231 / 1721 | Fertility drugs | 2.27 (1.30 to 3.96) | 2.19 (1.24 to 3.85) | Age and residence |
| Clomiphene citrate | Nulliparous 0.71 | Nulliparous 0.80 (0.19 to 3.38) 1.93 (0.56 to 6.59) | Age, residence, use of OCP, use of HRT, smoking | |||
| Clomiphene citrate + HCG | Nulliparous 5.20 | Nulliparous 3.01 (0.73 to 12.33) | Age, residence, use of OCP, use of HRT, smoking | |||
| HCG + HMG | Nulliparous 1.95 | Nulliparous 0.91 (0.14 to 6.13) 1.43 (0.28 to 7.19) | Age, residence, use of OCP, use of HRT, smoking | |||
| Parazzini 2001 | Invasive | 1031 / 2411 | Fertility drugs | 1.3 (0.7 to 2.5) 0.6 (0.7 to 2.5) Parous | — | — |
| Rossing 2004 | Invasive | 378 / 1634 | Fertility drugs | — | Nulliparous 1.0 (0.4 to 2.8) | Age, race, study site, duration of use of OCP (parous ‐ also number of births) |
| Clomiphene citrate | — | Nulliparous 1.2 (0.4 to 3.5) 0.8 (0.4 to 1.6) | Age, race, study site, duration of use of OCP (parous ‐ also number of births) | |||
| HMG/clomiphene citrate/gonadotrophins | — | Nulliparous 1.0 (0.4 to 3.0); | Age, race, study site, duration of use of OCP (parous ‐ also number of births) | |||
| Jensen 2009 | Invasive | 626 / 615 | Clomiphene citrate | Rate ratio 1.28 (0.79 to 2.07) | Rate ratio: 1.14 (0.79 to 1.64) 1 to 4 cycles: 1.27 (0.83 to 1.94) 5 to 9 cycles: 1.03 (0.57 to 1.86) Equal or > 10 cycles: 0.92 (0.42 to 2.02) | Age, parity |
| Gonadotrophins | Rate ratio 0.85 (0.44 to 1.64) | Rate ratio: 0.83 (0.50 to 1.37) 1 to 4 cycles: 0.74 (0.41 to 1.33) 5 to 9 cycles: 1.09 (0.49 to 2.44) Equal or > 10 cycles: 0.96 (0.09 to 10.30) | Age, parity | |||
| HCG | Rate ratio 0.95 (0.57 to 1.58) | Rate ratio: 0.89 (0.62 to 1.29) 1 to 4 cycles: 0.96 (0.62 to 1.48) 5 to 9 cycles: 0.86 (0.47 to 1.57) Equal or > 10 cycles: 0.70 (0.28 to 1.80) | Age, parity | |||
| GnRH | Rate ratio 0.71 (0.32 to 1.54) | Rate ratio: 0.80 (0.42 to 1.51) 1 to 4 cycles: 0.81 (0.42 to 1.56) 5 to 9 cycles: 0.68 (0.09 to 5.38) | Age, parity | |||
| Kurta 2012 | Invasive | 155 / 290 | Fertility drugs | 1.87 (0.53 to 6.65) < 6 months: 0.92 (0.48 to 1.74) > 6 months: 0.75 (0.42 to 1.34) | 0.57 (0.31 to 1.05) parous 0.47 (0.09 to 2.53) nulliparous | — |
| Clomiphene citrate | 0.87 (0.49 to 1.56) | — | — | |||
| Gonadotrophins | 0.51 (0.20 to 1.32) | — | — | |||
| Gonadotrophins + Clomiphene citrate | 0.94 (0.37 to 2.42) | — | — | |||
BMI: body mass index
CI: confidence interval
GnRH: gonadotrophin‐releasing hormone
HCG: human chorionic gonadotrophin
HMG: human menopausal gonadotrophin
HRT: hormone replacement therapy
IUD: intrauterine device
NR: not reported
OCP: oral contraceptive pill
OR: odds ratio
Blinding
Recall bias may be a factor in all the studies as fertility drug treatment received was obtained by self report or retrospective review of case notes and therefore may be incompletely or inaccurately recalled or recorded.
In 11 cohort studies ascertainment of the exposure to fertility drugs was conducted by reviewing medical records (Brinton 2004; Dor 2002; Dos Santos Silva 2009; Doyle 2002; Kallen 2011; Lerner‐Geva 2003; Modan 1998; Potashnik 1999; Sanner 2009; Venn 1999; Yli‐Kuha 2012) and in one cohort study by using a self completed questionnaire given to all women in the study (Calderon‐Margalit 2009). In one cohort study information was obtained using a self completed questionnaire and also by reviewing medical records (Van Leeuwen 2011). Blinding of assessors to the presence or absence of ovarian cancer status was not reported in the 13 cohort studies.
In two case‐control studies exposure to fertility drugs was conducted by reviewing medical records (Jensen 2009; Rossing 1994). In eight of the case‐control studies exposure to fertility drugs was ascertained by a standard questionnaire given to all women in case and control groups and some information was also derived from the medical notes (Franceschini 1994; Kurta 2012; Mosgaard 1997; Mosgaard 1998; Parazzini 1997; Parazzini 2001; Rossing 2004; Shushan 1996); in one the method used was unclear (Parazzini 1998). In five case‐control studies it was unclear if assessors were blinded to the case/control status (Kurta 2012; Mosgaard 1997; Parazzini 1998; Parazzini 2001; Rossing 2004), while in the other four studies assessors were not blind to the presence or absence of ovarian cancer (Franceschini 1994; Jensen 2009; Mosgaard 1998; Parazzini 1997; Rossing 1994; Shushan 1996). In all the studies the same method was used to ascertain the exposure to fertility drugs for the cases and for the controls.
Detection bias in relation to ascertainment of outcome was rare across all the studies as all used histology reports to confirm the diagnosis of ovarian cancer, and all of the control groups had no histological evidence of previous ovarian cancer. However, blinding of investigators to exposure status was not reported.
Incomplete outcome data
Six studies were at risk of attrition bias due to fewer than 80% of the sample being followed up (Dor 2002; Franceschini 1994; Parazzini 1998; Rossing 2004; Shushan 1996; Van Leeuwen 2011); in one study it was unclear (Rossing 1994).
Selective reporting
In three cohort studies the fertility drugs investigated were clearly reported and therefore we judged the risk of reporting bias to be low (Mosgaard 1997; Mosgaard 1998; Van Leeuwen 2011). In six of the cohort studies the risk of reporting bias was high: it was unclear if all fertility drugs given were investigated as it was difficult to judge if there was a mismatch between drugs investigated and those reported in the final analysis (Calderon‐Margalit 2009; Dos Santos Silva 2009; Kallen 2011; Lerner‐Geva 2003; Lerner‐Geva 2012; Modan 1998; Yli‐Kuha 2012).
Other potential sources of bias
No other potential sources of bias were identified.
Effects of interventions
Invasive ovarian cancer
Any fertility drug
Six cohort studies (Dos Santos Silva 2009; Doyle 2002; Kallen 2011; Lerner‐Geva 2012; Potashnik 1999; Yli‐Kuha 2012) and seven case‐control studies (Franceschini 1994; Kurta 2012; Mosgaard 1997; Parazzini 1997; Parazzini 2001; Rossing 2004; Shushan 1996) evaluated the incidence of invasive ovarian cancer with any fertility drug use (Figure 3). The study by Rossing 1994 included borderline tumours and did not present results by tumour type.
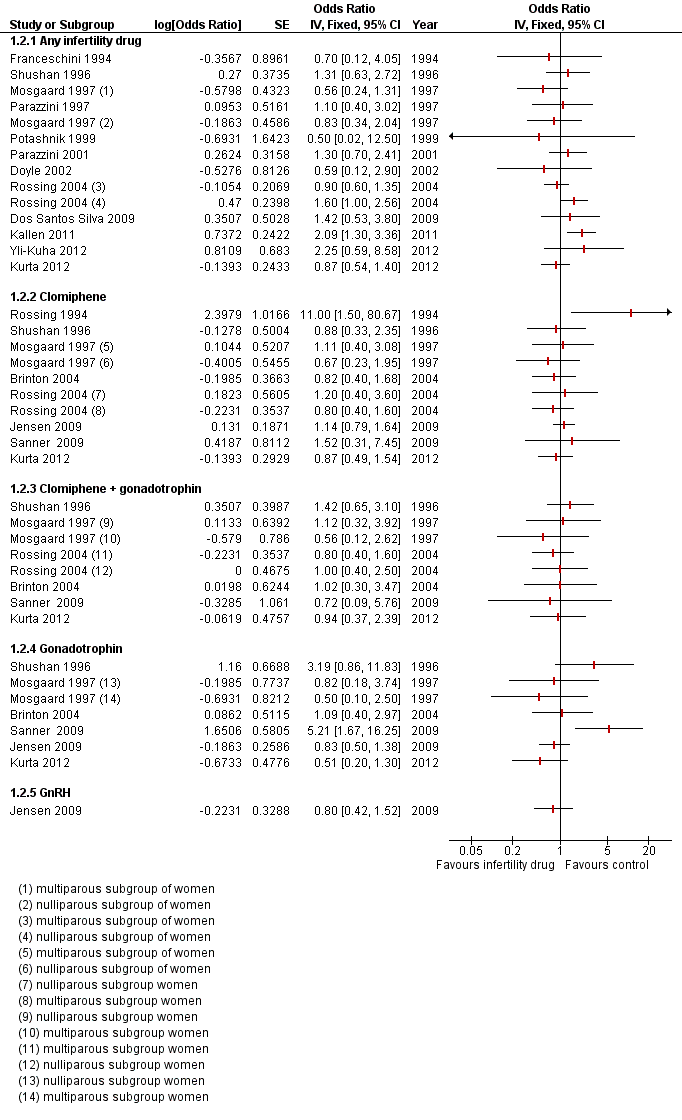
Forest plot of comparison: 1 Infertility drugs versus no infertility drug, outcome: 1.2 Invasive ovarian cancer.
There was no evidence of an increased risk with any fertility drug used compared with non‐use in the general population in one cohort study which reported a hazard ratio (HR) of 0.61 (95% confidence interval (CI) 0.08 to 4.42) and another which reported an odds ratio (OR) of 2.75 (95% CI 0.69 to 9.63) (Calderon‐Margalit 2009; Yli‐Kuha 2012) (Table 1).
Five studies only reported the standardised incidence ratio (SIR) for exposure to any fertility drug use and invasive ovarian cancer (Dor 2002; Lerner‐Geva 2003; Lerner‐Geva 2012; Sanner 2009; Venn 1999; Van Leeuwen 2011). Three analysed the risk of invasive ovarian cancer according to the number of IVF cycles used (Dor 2002; Van Leeuwen 2011; Venn 1999). None showed evidence of a difference in SIR with the number of cycles. One study (Lerner‐Geva 2003) reported an increased risk of ovarian cancer in subfertile women treated with ovarian stimulating drugs when compared to the general population (SIR 5.0, 95% CI 1.02 to 14.6), which decreased when cancer cases diagnosed within one year of treatment were excluded from the analysis(SIR 1.67, 95% CI 0.02 to 9.27) (Lerner‐Geva 2003). One study showed no evidence of an increase in SIR (Sanner 2009) (Table 1).
Seven case‐control studies showed no evidence of increased risk in women who used any fertility drug compared with controls who were women of a similar age and variably matched for reproductive risk factors (Table 2; Figure 3)
Only two cohort studies clearly reported the different histologic types of cancers among the cases included (Kallen 2011; Van Leeuwen 2011).
Clomiphene
Four cohort studies (Brinton 2004; Lerner‐Geva 2012; Rossing 1994; Sanner 2009) and five case‐control studies (Jensen 2009; Kurta 2012; Mosgaard 1997; Rossing 2004; Shushan 1996) evaluated the incidence of invasive ovarian cancer with clomiphene. Three cohort studies showed no convincing evidence for an increased risk of invasive cancer with clomiphene use compared with no use in women with subfertility (Table 1). Five case‐control studies showed no evidence of an increased risk in women who used clomiphene compared with women of a similar age and variably matched for reproductive risk factors (Table 2; Figure 3).
One cohort study reported a hazard ratio of 0.98 (95% CI 0.14 to 7.11), indicating no evidence of an increased risk with clomiphene compared with non‐use in the general population (Calderon‐Margalit 2009).
Two studies only reported SIR for exposure to clomiphene and invasive ovarian cancer (Modan 1998; Venn 1999) and showed no evidence of an increase in women who used clomiphene when compared to subfertile untreated women in one study (Modan 1998), and when compared to the general population in two studies (Lerner‐Geva 2012; Venn 1999), one with 30 years follow‐up (Lerner‐Geva 2012) (Table 1; Analysis 1.1).
Clomiphene plus gonadotrophin
Three cohort studies (Brinton 2004; Lerner‐Geva 2012; Modan 1998; Sanner 2009) and four case‐control studies (Kurta 2012; Mosgaard 1997; Rossing 2004; Shushan 1996) evaluated the incidence of invasive ovarian cancer with clomiphene plus gonadotrophin. Two cohort studies showed no convincing evidence for an increased risk of invasive cancer with clomiphene plus gonadotrophin use compared with no use in women with subfertility.
Two studies only reported SIR for exposure to clomiphene and human menopausal gonadotrophin (HMG) and invasive ovarian cancer (Modan 1998; Venn 1999) and showed no evidence of an increase in women who used clomiphene plus HMG when compared to infertile women not treated (Modan 1998) or when compared to the general population (Lerner‐Geva 2012; Venn 1999) (Table 1).
Four case‐control studies also showed no evidence of an increased risk in women who used clomiphene plus gonadotrophin compared with women of a similar age and variably matched for reproductive risk factors (Table 2; Analysis 1.2).
Gonadotrophin
Four cohort studies (Brinton 2004; Lerner‐Geva 2012; Sanner 2009; Van Leeuwen 2011) and five case‐control studies (Jensen 2009; Kurta 2012; Mosgaard 1997; Rossing 1994; Shushan 1996) evaluated the incidence of invasive ovarian cancer with gonadotrophin use. The cohort studies showed no convincing evidence for an increased risk of invasive cancer with gonadotrophin use compared with no use in women with subfertility. The study by Sanner 2009 showed an increased risk(OR 5.21, 95% CI 1.67 to 16), adjusted for age and indication. The confidence interval reflects a high degree of uncertainty about this estimate which is based on only six cases of ovarian cancer in women exposed to gonadotrophin.
One study reported SIR for invasive ovarian cancer with exposure to HMG and showed no evidence of an increase in women who used HMG when compared to the general population (Lerner‐Geva 2012) (Table 1).
Three case‐control studies showed no evidence of an increased risk in women who used gonadotrophin compared with women of a similar age and variably matched for reproductive risk factors (Table 1).
Two case‐control studies reported results separately by parity (Mosgaard 1997; Rossing 2004). Whilst risk estimates for invasive ovarian cancer were slightly lower for parous women compared with nulliparous women, there was no evidence of a real difference between these two groups for any of the drugs investigated (Table 2; Analysis 1.2)
Borderline cancer
Any fertility drug
One cohort study only reported a SIR for exposure to any fertility drug use and borderline ovarian tumours (Sanner 2009). There was some evidence of a difference in SIR 2.62 (95% CI 1.35 to 4.58) in treated subfertile women compared with the general population based on 12 cases (Sanner 2009). One study reported a significantly increased risk for borderline ovarian tumours in IVF‐treated versus subfertile untreated women with more than one year of follow‐up (HR 4.23, 95% CI 1.25 to 14.33) (Van Leeuwen 2011). One cohort study did not show any significant increase in the risk of borderline ovarian cancer and reported an OR of 2.25 (95% CI 0.59 to 8.68) in the exposed group compared to the general population, excluding the first year after IVF (Yli‐Kuha 2012) (Table 1).
Three case‐control studies (Mosgaard 1998; Parazzini 1998; Shushan 1996) reported the incidence of borderline ovarian cancer, and showed an increased risk in women who used any fertility drug compared with women of a similar age and variably matched for reproductive risk factors (Table 2). The magnitude of these estimates was similar for two studies (Mosgaard 1998; Shushan 1996). The estimate for Parazzini 1998 should be interpreted with caution as there were only four cases exposed to fertility drugs compared with none of the controls, generating a wide confidence interval (Figure 4).

Forest plot of comparison: 1 Infertility drugs versus no infertility drug, outcome: 1.2 Borderline ovarian cancer.
Clomiphene
One cohort study showed no convincing evidence for an increased risk of borderline tumours with clomiphene compared with women in the cohort unexposed to hormonal fertility treatment, adjusted for the factors shown in Table 1 (Sanner 2009).
Two case‐control studies (Mosgaard 1998; Shushan 1996) showed no convincing evidence for an increased risk of borderline tumours with clomiphene compared with no use in women of a similar age and variably matched for reproductive risk factors (Table 2; Figure 4).
Clomiphene plus gonadotrophin
One cohort study showed no convincing evidence for an increased risk of borderline tumours with clomiphene plus gonadotrophin use compared women in the cohort unexposed to hormonal fertility treatment (Sanner 2009) (Table 1; Figure 4).
The two case‐control studies (Mosgaard 1998; Shushan 1996) showed no convincing evidence for an increased risk of borderline tumours with clomiphene plus gonadotrophin compared with no use in women of a similar age and variably matched for reproductive risk factors (Table 2; Figure 4).
Gonadotrophin
One cohort study showed no convincing evidence for an increased risk of borderline tumours with gonadotrophin use compared with women in the cohort unexposed to hormonal fertility treatment (Sanner 2009) (Table 1; Figure 4).
One case‐control study (Shushan 1996) reported an increased risk in users of HMG(OR 9.38, 95% CI 1.66 to 52.08), however these data should be interpreted with caution due to only six of the cases ever having used HMG, generating wide confidence intervals which weaken any conclusions. One case‐control study (Mosgaard 1998) showed no convincing evidence for an increased risk of borderline tumours with gonadotrophin compared with no use in women of a similar age and variably matched for reproductive risk factors (Table 2; Analysis 1.1).
One case‐control study reported results separately by parity (Mosgaard 1998). Whilst risk estimates for borderline ovarian tumours were slightly lower for parous women compared with nulliparous women, there was no evidence of a real difference between these two groups for any of the drugs investigated (Table 2).
Discussion
Summary of main results
Overall we found no convincing evidence of an increase in the risk of invasive ovarian tumours with fertility drug treatment. There may be an increased risk of borderline ovarian tumours in subfertile women treated with in vitro fertilisation (IVF). Studies showing an increase in the risk of ovarian cancer had a high overall risk of bias due to retrospective study design, lack of accounting for potential confounding and lack of details about fertility drug treatments given; estimates were based on a small number of cases giving rise to wide confidence intervals. Studies with more robust estimates based on a larger number of cases did not detect differences between exposed and unexposed women.
One study (Rossing 1994) reported a higher risk in women with long‐term use of clomiphene citrate (12 or more cycles). This was observed in subfertile women who conceived following treatment as well in subfertile women who were refractory to therapy. The same was not shown with the use of HCG in the same cohort of patients. This study was limited by the small number of tumours, with almost half of them being borderline (5 out of 11 neoplasms), which gives strong evidence of a selection bias. Moreover, the author included two patients with granulosa cell tumour. This histological type of invasive ovarian cancer often presents with abnormalities of fertility and ovulation which may be the cause of the tumour rather than the use of ovulation‐stimulating drugs.
Overall three case‐control studies (Mosgaard 1998; Parazzini 1998; Shushan 1996) reported an increased risk of developing borderline ovarian cancer. In one of the studies (Shushan 1996) subfertile women treated with ovarian stimulation drugs were reported to have an increased risk of developing borderline ovarian tumours and also invasive ovarian cancer when compared to subfertile women not treated. The investigators did not provide any information on the causes of subfertility and also 36% of cases had died before contact was established, which could have caused selection bias. Another case‐control study (Parazzini 1998) was based on a very small number of cases (only four) who had used fertility medications. In all three studies the higher proportion of borderline tumours may also suggest that the increased risk is attributed to the increased medical surveillance and younger age of subfertile women. The cohort study (Van Leeuwen 2011) reporting an increase in borderline ovarian tumours in subfertile women highlighted that the risk was particularly high during the first year after the IVF, which may be supported by the reported evidence that ovarian stimulation may induce growth in existing highly differentiated tumours (Brinton 2005).
Overall completeness and applicability of evidence
The results from the cohort studies are broadly generalised to women who seek fertility treatment as on the whole the samples consisted of all women who attended fertility clinics at major hospitals within a particular time frame. Additionally, as complete case ascertainment was maximised in the majority of the non‐randomised studies included, by the use of cancer registries as the source of ovarian cancer cases, this also optimised the identification and selection of the cases within a given timeframe and area.
In addition, all the studies were investigating the effect of fertility drugs which are all still currently used during fertility treatment.
Quality of the evidence
A strength of our review is that almost all of the studies included the outcome taken from reliable sources (i.e. cancer registry).
We identified a few factors in the observational studies included in our review which may have biased our final conclusions. First of all, exposed and non‐exposed (to the fertility drugs) groups were not always balanced and not many studies adjusted their data for important confounding factors.
Subfertile populations have lower pregnancy rates than the general population, as already proved, and low parity is an important risk factor for ovarian cancer. Risk estimates for ovarian cancer reported in cohort studies that are solely based on comparison with the general population are likely to be biased towards overestimation. In addition, nulliparity, subfertility and lack of use of oral contraceptive pill make subfertile women already at a higher risk of ovarian cancer compared to non‐subfertile women. Secondly, in all the studies exposure was ascertained retrospectively and therefore they have limited information on the specific types, dosage and numbers of cycles of fertility drugs. Thirdly, the length of follow‐up in some studies may be insufficient as ovarian cancer tends to develop in post‐menopausal aged women, and the cancer may not have had time to develop within the time the women were followed up, reducing the number of women with ovarian cancer reported.
Moreover, we were unable to contact researchers to obtain missing data and we therefore rely on the data reported in the published article. In some cases factors relating to study quality, such as measurement of confounding variables and whether these were balanced at baseline and/or adjusted for in the analysis, the number of fertility drug cycles, dosage and type of drugs used, and the duration of subfertility, were not clearly reported.
Several cohort studies used standardised incidence ratios (SIR) to compare cancer risk in subfertile women with that in the general population. This is a statistical parameter which is difficult to interpret as it does not make a comparison between comparable women and does not take into account the influence of factors associated with subfertility that may influence the development of ovarian cancer.
Lack of blinding of investigators to case status and exposure status was also a potential source of bias, along with potential attrition bias in some studies. It is difficult gauge the impact of selective reporting bias as the studies were conducted retrospectively and participants may have been excluded from the sample, if ascertainment of exposure could not be determined. A pre‐specified list of all drugs investigated was not provided by any of the studies.
None of the studies included specified the histologic subtype of ovarian cancer in the cases found. Future studies should address fertility relationships for cancer histologic subtypes as there is increasing recognition of the aetiological heterogeneity of ovarian cancer (Gates 2010; Rish 1996).
Potential biases in the review process
We acknowledge that publication bias may limit our conclusions and it is difficult to predict the direction in which the bias would operate. On one hand it is likely that studies with non‐significant associations for particular fertility drugs remain unpublished due to perceived unimportance. On the other hand, however, there is also the chance that studies with positive associations are unpublished, although it is more likely that publication bias would be in favour of publishing positive studies.
However, we did not put any limits on our search (such as language restrictions) and we sought published and unpublished data.
We are aware that missing information limits our ability to explore the exact relationship between fertility drugs and ovarian cancer. The strength of the review could have been greatly improved if it have been possible to contact all researchers to obtain original data. Obtaining individual participant data for each study would have allowed us to perform a standard adjustment for confounding factors in all studies, if appropriate variables had been measured. Whilst this could potentially have reduced the likelihood of bias in the included studies, on the other hand it would not have resolved the major problems inherent to observational studies.
Agreements and disagreements with other studies or reviews
Our findings are in broad agreement with those in the most current systematic reviews and meta‐analyses on this topic (Kashyap 2004; Li 2013). These reviews included some of the studies in our review, but not those published since 2001 and not all of the cohort studies we included.

Identification and selection of studies.

'Risk of bias' graph: review authors' judgements about each risk of bias item presented as percentages across all included studies.

Forest plot of comparison: 1 Infertility drugs versus no infertility drug, outcome: 1.2 Invasive ovarian cancer.

Forest plot of comparison: 1 Infertility drugs versus no infertility drug, outcome: 1.2 Borderline ovarian cancer.

Comparison 1 Infertility drugs versus no infertility drug, Outcome 1 Borderline ovarian cancer.

Comparison 1 Infertility drugs versus no infertility drug, Outcome 2 Invasive ovarian cancer.
| Cohort studies | |||||||
| Study | Ovarian cancer type | Total number of exposed cases versus unexposed | Drug, dose and number of cycles | Crude estimate (95% CI) | Adjusted estimate RR (95% CI) | Factors adjusted for | Standardised incidence ratio (SIR) |
| Modan 1998 | Invasive | 1309 versus 1187 | Fertility drugs | — | — | — | 1.6 (0.8 to 2.9) |
| Clomiphene citrate/HMG | — | — | — | Not calculated | |||
| Clomiphene citrate | — | — | — | 2.7 (0.97 to 5.8) | |||
| HMG | — | — | — | Not calculated | |||
| Potashnik 1999 | Invasive | 780/417 | Fertility drugs | — | — | — | 0.91 (0.10 to 3.27) |
| Venn 1999 | Invasive | 20,656 versus 9044 | Fertility drugs | — | — | — | Any drug: 0.88 (0.42 to 1.84) 1 to 2 cycles IVF: 1.26 (0.41 to 3.90) 3 to 5 cycles: 0.71 (0.10 to 5.03) > 6 cycles: 2.00 (0.3 to 14.2) |
| Clomiphene citrate | — | — | — | 2.46 (0.35 to 17.5) | |||
| Clomiphene citrate + HMG | — | — | — | 0.77 (0.19 to 3.07) | |||
| HMG | — | — | — | 1.14 (0.16 to 8.10) | |||
| HMG + GnRH | — | — | — | 0.48 (0.07 to 3.38) | |||
| Doyle 2002 | Invasive | 4188 versus 1231 | Fertility drugs | — | Hazard rate ratio 0.59 (0.12 to 3.00) | Age at first clinical visit, years of first clinical visit, parity, time since first treatment and age at the end of follow‐up | — |
| Dor 2002 | Invasive | 1254 versus 3772 | Fertility drugs | — | — | — | 1 to 2 IVF cycles: 0.98 (0.45 to 1.86) 3 to 5 IVF cycles: 1.21 (0.52 to 2.39) > 6 cycles: 0 (0 to 1.20) |
| Lerner‐Geva 2003 | Invasive | 1082 versus 5920 | Fertility drugs | — | — | — | 5.0 (1.02 to 14.6) |
| Brinton 2004 | Invasive | 4143 versus NR | Clomiphene citrate | Rate ratio 0.82 (0.4 to 1.5) | 1 to 900 mg rate ratio: 0.94 (0.4 to 2.3) 901 to 2250 mg: 0.71 (0.2 to 2.0) > or equal to 2251 mg: 0.80 (0.3 to 2.1) < 6 cycles: 0.85 (0.4 to 1.7) 6 to 11 cycles: 0.44 (0.1 to 1.9) > or equal to 12 cycles: 1.54 (0.5 to 5.1) | Age, calendar time, area of residence, parity at first visit | — |
| Gonadotrophins | Rate ratio 1.09 (0.4 to 2.8) | Dosage (amps) 1 to 24: rate ratio 1.36 (0.3 to 5.7) > or equal to 25: 0.96 (0.3 to 3.1) 1 to 2 cycles: 0.95 (0.2 to 3.9) > or equal 3 cycles: 1.21 (0.4 to 3.9) | Age, calendar time, area of residence, parity at first visit | — | |||
| Gonadotrophins + clomiphene citrate | — | Rate ratio 1.02 (0.3 to 2.8) | Age, calendar time, area of residence, parity at first visit | — | |||
| Calderon‐Margalit 2009 | Invasive | 929 versus 14,463 | Fertility drugs | HR 0.61 (0.08 to 4.42) | Age | — | |
| Clomiphene citrate | HR 0.98 (0.14 to 7.11) | Age | — | ||||
| Sanner 2009 | Invasive | 1153 versus 1615 | Fertility drugs | — | — | — | 1.19 (0.54 to 2.25) |
| Borderline | Fertility drugs | — | — | — | 2.62 (1.35 to 4.58) | ||
| Invasive | Gonadotrophins | RR 3.55 (1.23 to 10.24) | 5.21 (1.67 to 16.20) (a) 5.28 (1.70 to 16.47) (b) | a) Age and indication b) Pregnancy during follow‐up | 2.29 (0.84 to 4.97) | ||
| Borderline | Gonadotrophins | RR 0.95 (0.11 to 8.11) | 1.11 (0.12 to 10.17) (a) 1.12 (0.12 to 10.32) (b) | a) Age and indication b) Pregnancy during follow‐up | 1.88 (0.05 to 10.45) | ||
| Invasive | Clomiphene citrate | RR 1.12 (0.24 to 5.29) | 1.52 (0.3 1,7.79) (a) 1.57 (0.32,7.62) (b) | a) Age and indication b) Pregnancy during follow‐up | 0.92 (0.11 to 3.32) | ||
| Borderline | Clomiphene citrate | RR 2.70 (0.64 to 11.28) | 3.06 (0.69 to 13.68) (a) 3.25 (0.72 to 14.51) (b) | a) Age and indication b) Pregnancy during follow‐up | 4.59 (0.95 to 13.42) | ||
| Invasive | Clomiphene citrate + gonadotrophins | RR 0.48 (0.06 to 3.80) | 0.72 (0.09 to 6.00) (a) 0.74 (0.09 to 6.22) (b) | a) Age and indication b) Pregnancy during follow‐up | 0.36 (0.01 to 2.00) | ||
| Borderline | Clomiphene citrate + gonadotrophins | RR 2.28 (0.55 to 9.54) | 2.70 (0.58 to 12.65) (a) 2.90 (0.62 to 13.55) (b) | a) Age and indication b) Pregnancy during follow‐up | 3.99 (0.82 to 11.67) | ||
| Dos Santos Silva 2009 | Invasive | 3194 versus 3976 | Fertility drugs | — | 1.42 (0.53 to 3.99) | Age, calendar time, area of residence, parity at first visit | 1.10 (0.57 to 1.93) |
| Kallen 2011 | Invasive | 24,058/1,394,061 | Fertility drugs | — | 2.09 (1.39 to 3.12) | Year of delivery after IVF, age and smoking | |
| Van Leeuwen 2011 | Invasive | 19,146/6006 | Fertility drugs | — | — | — | 1.35 (0.91 to 1.92) Excluding the first year: 1.30 (0.86 to 1.88) |
| HMG/FSH | — | — | — | 1 to 40 ampoules: 1.25 (0.41 to 2.93) 41 to 80: 1.21 (0.39 to 2.83) > 81: 1.58 (0.68 to 3.11) | |||
| IVF | — | 1.14 (0.54 to 2.41) (a) 1.51 (0.65 to 3.54) (b) 2.26 (0.78 to 6.55) (c) | a) Age, endometriosis b) > 1 year follow‐up c) > 10 years follow‐up | 1 to 2 cycles: 1.35 (0.68 to 2.42) 3 to 4 cycles: 1.19 (0.57 to 2.18) > 5 cycles: 1.41 (0.57 to 2.90) | |||
| Borderline | Fertility drugs | — | — | — | 1.93 (1.31 to 2.73) Excluding the first year: 1.76 (1.16 to 2.56) | ||
| HMG/FSH | — | — | — | 1 to 40 ampoules: 1.75 (0.57 to 4.08) 41 to 80: 2.03 (0.74 to 4.42) > 81: 1.69 (0.62 to 3.69) | |||
| IVF | — | 6.38 (2.05 to 19.84) (a) 4.23 (1.25 to 14.33) (b) 2.26 (0.46 to 11.05) (c) | a) For age, tubal problems and parity b) > 1 year follow‐up c) > 10 years | 1 to 2 cycles: 1.70 (0.97 to 3.74) 3 to 4 cycles: 1.99 (1.22 to 4.14) > 5 cycles: 1.45 (0.47 to 3.38) | |||
| Yli‐Kuha 2012 | Invasive | 9175/9175 | IVF | — | 2.75 (0.69 to 9.63) 2.25 (0.59 to 8.68) excluding first year after treatment | Adjusted for marital status and socioeconomic position | — |
| Borderline | 1.68 (0.31 to 9.27) 2.25 (0.59 to 8.68) excluding first year after treatment | Adjusted for marital status and socioeconomic position | — | ||||
| Lerner‐Geva 2012 | Invasive | 2431/NR | Clomiphene citrate | — | — | — | 1.33 (0.57 to 2.63) |
| Clomiphene citrate + HMG | — | — | — | NR | |||
| HMG | — | — | — | 0.74 (0.01 to 4.12) | |||
| FSH: follicle‐stimulating hormone | |||||||
| Case‐control studies | ||||||
| Study | Ovarian cancer type | Total number of cancer cases/controls | Drug | Crude OR (95% CI) | Adjusted odds ratio (95% CI) | Factor adjusted for |
| Rossing 1994 | Invasive/borderline | 135 / NR | Clomiphene citrate | Rate ratio 11.00 (1.50 to 80.67) | Rate ratio > 1 year 11 (1.5 to 8.2) | Parity |
| — | Rate ratio > 1 year 7.2 (1.2 to 43.9) | Age | ||||
| — | Rate ratio < 1 year 0.7 (0.1 to 4.6) | Age | ||||
| — | Rate ratio < 1 year 0.8 (0.1 to 5.7) | Parity | ||||
| HCG | — | Rate ratio 1.0 (0.2 to 4.1) | Age | |||
| — | Rate ratio 1.0 (0.2 to 4.3) | Parity | ||||
| Franceschini 1994 | Invasive | 195 / 1339 | Fertility drugs | 0.8 (0.2 to 3.7) | 0.7 (0.2 to 3.7) | Age, area of residence, education, |
| Sushan 1996 | Invasive | 68 / 77 | Fertility drugs | 1.78 (0.97 to 3.27) | 1.31 (0.63 to 2.74) | Age, parity, BMI, region of birth, education, family history, interviewer |
| Borderline | 26 / 77 | Fertility drugs | 5.03 (2.04 to 12.22) | 3.52 (1.23 to 10.09) | Age, parity, BMI, region of birth, | |
| Invasive | Clomiphene citrate | 1.32 (0.57 to 3.01) | 0.88 (0.33 to 2.34) | Age, parity, BMI, region of birth, | ||
| Borderline | Clomiphene citrate | 1.62 (0.25 to 7.87) | 1.28 (0.25 to 6.87) | Age, parity, BMI, region of birth, | ||
| Invasive | HMG | 3.95 (1.33 to 12.2) | 3.19 (0.86 to 11.82) | Age, parity, BMI, region of birth, | ||
| Borderline | HMG | 14.58 (3.82 to 55.91) | 9.38 (1.66 to 52.08) | Age, parity, BMI, region of birth, | ||
| Invasive | HMG/clomiphene citrate | 1.97 (1.03 to 3.77) | 1.42 (0.65 to 3.12) | Age, parity, BMI, region of birth, | ||
| Borderline | HMG/clomiphene citrate | 4.86 (1.81 to 12.79) | 3.08 (0.98 to 9.69) | Age, parity, BMI, region of birth, | ||
| Parazzini 1997 | Invasive | 971 / 2758 | Fertility drugs | 0.5 (0.1 to 3.6) 0.6 (0.1 to 3.5) | 1.1 (0.4 to 3.3) < 6 cycles 0.7 (0.1 to 7.9) 1.0 (0.2 to 3.8) | Age, education, OCP, parity |
| Mosgaard 1997 | Invasive | 684 / 1721 | Fertility drugs | Nulliparous 0.80 (0.92to 5.58) | Nulliparous 0.83 (0.35 to 2.01) 0.56 (0.24 to 1.29) | Age, residence, use of OCP, menopausal status, previous cancer, family history, HRT, BMI |
| Clomiphene citrate | Nulliparous 0.69 (0.23 to 1.96) | Nulliparous 0.67 (0.23 to 1.96) 1.11 (0.4 to 3.06) | Age, residence, use of OCP, menopausal status, previous cancer, family history, HRT, BMI | |||
| Clomiphene citrate + HCG | Nulliparous 1.99 Parous 0.24 | Nulliparous 1.12 (0.32 to 3.96) 0.56 (0.12 to 2.7) | Age, residence, use of OCP, menopausal status, previous cancer, family history, HRT, BMI | |||
| HMG + HCG | Nulliparous 1.06 Parous 0.54 | Nulliparous 0.82 (0.18 to 3.71), 0.5 (0.10 to 2.47) | Age, residence, use of OCP, menopausal status, previous cancer, family history, HRT, BMI | |||
| Parazzini 1998 | Borderline | 92 / 273 | Fertility drugs | 27.5 (1.5 to 51.60) | — | — |
| Mosgaard 1998 | Borderline | 231 / 1721 | Fertility drugs | 2.27 (1.30 to 3.96) | 2.19 (1.24 to 3.85) | Age and residence |
| Clomiphene citrate | Nulliparous 0.71 | Nulliparous 0.80 (0.19 to 3.38) 1.93 (0.56 to 6.59) | Age, residence, use of OCP, use of HRT, smoking | |||
| Clomiphene citrate + HCG | Nulliparous 5.20 | Nulliparous 3.01 (0.73 to 12.33) | Age, residence, use of OCP, use of HRT, smoking | |||
| HCG + HMG | Nulliparous 1.95 | Nulliparous 0.91 (0.14 to 6.13) 1.43 (0.28 to 7.19) | Age, residence, use of OCP, use of HRT, smoking | |||
| Parazzini 2001 | Invasive | 1031 / 2411 | Fertility drugs | 1.3 (0.7 to 2.5) 0.6 (0.7 to 2.5) Parous | — | — |
| Rossing 2004 | Invasive | 378 / 1634 | Fertility drugs | — | Nulliparous 1.0 (0.4 to 2.8) | Age, race, study site, duration of use of OCP (parous ‐ also number of births) |
| Clomiphene citrate | — | Nulliparous 1.2 (0.4 to 3.5) 0.8 (0.4 to 1.6) | Age, race, study site, duration of use of OCP (parous ‐ also number of births) | |||
| HMG/clomiphene citrate/gonadotrophins | — | Nulliparous 1.0 (0.4 to 3.0); | Age, race, study site, duration of use of OCP (parous ‐ also number of births) | |||
| Jensen 2009 | Invasive | 626 / 615 | Clomiphene citrate | Rate ratio 1.28 (0.79 to 2.07) | Rate ratio: 1.14 (0.79 to 1.64) 1 to 4 cycles: 1.27 (0.83 to 1.94) 5 to 9 cycles: 1.03 (0.57 to 1.86) Equal or > 10 cycles: 0.92 (0.42 to 2.02) | Age, parity |
| Gonadotrophins | Rate ratio 0.85 (0.44 to 1.64) | Rate ratio: 0.83 (0.50 to 1.37) 1 to 4 cycles: 0.74 (0.41 to 1.33) 5 to 9 cycles: 1.09 (0.49 to 2.44) Equal or > 10 cycles: 0.96 (0.09 to 10.30) | Age, parity | |||
| HCG | Rate ratio 0.95 (0.57 to 1.58) | Rate ratio: 0.89 (0.62 to 1.29) 1 to 4 cycles: 0.96 (0.62 to 1.48) 5 to 9 cycles: 0.86 (0.47 to 1.57) Equal or > 10 cycles: 0.70 (0.28 to 1.80) | Age, parity | |||
| GnRH | Rate ratio 0.71 (0.32 to 1.54) | Rate ratio: 0.80 (0.42 to 1.51) 1 to 4 cycles: 0.81 (0.42 to 1.56) 5 to 9 cycles: 0.68 (0.09 to 5.38) | Age, parity | |||
| Kurta 2012 | Invasive | 155 / 290 | Fertility drugs | 1.87 (0.53 to 6.65) < 6 months: 0.92 (0.48 to 1.74) > 6 months: 0.75 (0.42 to 1.34) | 0.57 (0.31 to 1.05) parous 0.47 (0.09 to 2.53) nulliparous | — |
| Clomiphene citrate | 0.87 (0.49 to 1.56) | — | — | |||
| Gonadotrophins | 0.51 (0.20 to 1.32) | — | — | |||
| Gonadotrophins + Clomiphene citrate | 0.94 (0.37 to 2.42) | — | — | |||
| BMI: body mass index | ||||||
| Outcome or subgroup title | No. of studies | No. of participants | Statistical method | Effect size |
| 1 Borderline ovarian cancer Show forest plot | 5 | Odds Ratio (Fixed, 95% CI) | Totals not selected | |
| 1.1 Any infertility drug | 4 | Odds Ratio (Fixed, 95% CI) | 0.0 [0.0, 0.0] | |
| 1.2 Clomiphene | 3 | Odds Ratio (Fixed, 95% CI) | 0.0 [0.0, 0.0] | |
| 1.3 Clomiphene + gonadotrophin | 3 | Odds Ratio (Fixed, 95% CI) | 0.0 [0.0, 0.0] | |
| 1.4 Gonadotrophin | 3 | Odds Ratio (Fixed, 95% CI) | 0.0 [0.0, 0.0] | |
| 2 Invasive ovarian cancer Show forest plot | 16 | Odds Ratio (Fixed, 95% CI) | Totals not selected | |
| 2.1 Any infertility drug | 12 | Odds Ratio (Fixed, 95% CI) | 0.0 [0.0, 0.0] | |
| 2.2 Clomiphene | 8 | Odds Ratio (Fixed, 95% CI) | 0.0 [0.0, 0.0] | |
| 2.3 Clomiphene + gonadotrophin | 6 | Odds Ratio (Fixed, 95% CI) | 0.0 [0.0, 0.0] | |
| 2.4 Gonadotrophin | 6 | Odds Ratio (Fixed, 95% CI) | 0.0 [0.0, 0.0] | |
| 2.5 GnRH | 1 | Odds Ratio (Fixed, 95% CI) | 0.0 [0.0, 0.0] | |