Primaquina u otras 8‐aminoquinolinas para la reducción de la transmisión del Plasmodium falciparum
Información
- DOI:
- https://doi.org/10.1002/14651858.CD008152.pub5Copiar DOI

- Base de datos:
-
- Cochrane Database of Systematic Reviews
- Versión publicada:
-
- 02 febrero 2018see what's new
- Tipo:
-
- Intervention
- Etapa:
-
- Review
- Grupo Editorial Cochrane:
-
Grupo Cochrane de Enfermedades infecciosas
- Clasificada:
-
- Actualizada
All studies incorporated from most recent search
All eligible published studies found in the last search (21 Jul, 2017) were included and eight ongoing studies have been identified (see 'Characteristics of ongoing studies' section)Evaluada: 12 April 2019
- Actualizada
- Copyright:
-
- Copyright © 2018 The Authors. Cochrane Database of Systematic Reviews published by John Wiley & Sons, Ltd. on behalf of The Cochrane Collaboration.
- This is an open access article under the terms of the Creative Commons Attribution‐Non‐Commercial Licence, which permits use, distribution and reproduction in any medium, provided the original work is properly cited and is not used for commercial purposes.
Cifras del artículo
Altmetric:
Citado por:
Autores
Contributions of authors
2018 update
PMG and HG screened the abstracts, added the new studies, and extracted the data. LC and PG revised the GRADE analysis and ‘Summary of findings' tables. All authors contributed to interpretation of results and rewriting the review.
Graves 2015: PMG, HG, and PG contributed to adjusting the data and updating the text.
Graves 2014: PMG and HG added the new studies. PG helped rewrite the review. All review authors contributed to the interpretation of the results and the conclusions drawn.
Graves 2012: two review authors (PMG and HG) independently screened all abstracts, applied inclusion criteria and extracted data. PG helped structure the review and contributed to the logic framework of the ‘Summary of findings' tables. All review authors contributed to the writing of the review, the interpretation of the results, and the conclusions drawn.
Sources of support
Internal sources
-
Liverpool School of Tropical Medicine, UK.
External sources
-
Department for International Development, UK.
Grant: 5242
Declarations of interest
We have no affiliations with or involvement in any organization or entity with a direct financial interest in the subject matter of the review (for example, employment, consultancy, stock ownership, honoraria, or expert testimony).
This review and the salary of PG is supported by a DFID grant aimed at ensuring the best possible systematic reviews, particularly Cochrane Reviews, are completed on topics relevant to the poor in low‐ and middle‐income countries. DFID does not participate in the selection of topics, in the conduct of the review or in the interpretation of findings. PG is a member of the WHO Guidelines for the Treatment of Malaria Group that made the recommendation for PQ to reduce P. falciparum malaria transmission.
PMG was a member from 2012 to 2016 of the WHO Malaria Policy Advisory Committee, which provides independent strategic advice in forming WHO policies in malaria.
HG and LC have no known conflicts of interest.
None of the review authors are investigators on any of the included trials.
Acknowledgements
We thank the trial authors of Shekalaghe 2007, Vásquez 2009, Smithuis 2010, Kolaczinski 2012, and Sutanto 2013 for providing unpublished data for this review. Dr Isabela Ribeiro assisted with assessing trials in Portuguese for inclusion. Dr Adam Ye, Dr Qian Xu, Qiang Long, and Annabelle Yuet Chun Lee helped with translation of Chinese trials, and Prof Nick White provided links to Chinese trials and useful feedback on an earlier version of the review.
The academic editor of this review is Lawrence Mbuagbaw.
We are grateful to our affiliated institutions and organizations, and thank the referees and editors for their comments and encouragement. The editorial base for the Cochrane Infectious Disease Group is funded by the Department for International Development (DFID), UK, for the benefit of low‐ and middle‐income countries (Grant: 5242).
Version history
| Published | Title | Stage | Authors | Version |
| 2018 Feb 02 | Primaquine or other 8‐aminoquinolines for reducing <i>Plasmodium falciparum</i> transmission | Review | Patricia M Graves, Leslie Choi, Hellen Gelband, Paul Garner | |
| 2015 Feb 19 | Primaquine or other 8‐aminoquinoline for reducing <i>Plasmodium falciparum</i> transmission | Review | Patricia M Graves, Hellen Gelband, Paul Garner | |
| 2014 Jun 30 | Primaquine or other 8‐aminoquinoline for reducing <i>P. falciparum</i> transmission | Review | Patricia M Graves, Hellen Gelband, Paul Garner | |
| 2012 Sep 12 | Primaquine for reducing <i>Plasmodium falciparum</i> transmission | Review | Patricia M Graves, Hellen Gelband, Paul Garner | |
| 2009 Oct 07 | Primaquine for reducing transmission of Plasmodium falciparum malaria | Protocol | Patricia M Graves, Hellen Gelband, Isabela Ribeiro | |
Differences between protocol and review
2012 version
1. After reading the trials, we added several new outcomes and modified some outcomes; we deleted two outcomes.
Changes to primary outcomes:
-
Proportion of participants with gametocytes: we added: by microscopy and PCR;
-
We added: Proportion of participants infectious;
-
We included: Gametocyte density (by microscopy and PCR);
-
We added: Gametocyte clearance time and duration of gametocyte carriage.
We arranged the primary outcomes to capture the three categories: transmission intensity, infectiousness and potential infectiousness.
Changes to secondary outcomes:
-
We deleted AUC of asexual parasite density over time. We did not identify any relevant data;
-
We added asexual clearance time.
Changes to adverse events:
-
We deleted: all adverse events (data reported was minimal and not in a form that was easily summarized. The main question is whether there are serious adverse events);
-
We modified haemolysis or drop in haemoglobin or PCV (as assessed/defined in each trial) by deleting reference to G6PD since these outcomes occur in non‐G6PD people too. We also added PCV since this was used in some trials as a measure of anaemia.
2. In the first version of the review, we deleted the objective: "To compare the effects of different doses and schedules of PQ given to reduce infectiousness" and we modified the definition of control in comparisons accordingly. We only included controls without PQ. We deleted the comparison of different doses of PQ with identical other treatment regimens since it does not answer the important question of whether adding PQ is effective. We included one trial with two arms using different doses of PQ with same other treatment regimens as two separate arms within the same comparison.
2014 version
In the June 2014 update, we reversed this decision. We planned to use the following comparisons described in the protocol:
-
CQ (with and without PQ, or with different doses of PQ);
-
SP (with and without PQ, or with different doses of PQ);
-
CQ plus sulphadoxine + pyrimethamine (with and without PQ, or with different doses of PQ);
-
Artemisinin derivatives (with and without PQ, or with different doses of PQ);
-
Other drugs (with and without PQ, or with different doses of PQ).
In the review, we changed the groups, added some, and combined some for the following reasons:
a. some trials combined two types of malaria treatment regimens, not distinguishing the patients who received each one (for example, CQ or CQ plus SP);
b. there were many different artemisinin derivatives and combinations tested, with few trials of each, so these were grouped within the same comparison. We also grouped combinations of an artemisinin derivative with SP here.
3. There were no eligible cluster‐RCTs so we deleted how we would manage them from the Methods section. If we include any cluster‐RCTs in future editions, we will check that trials have correctly adjusted for clustering and, if not, attempt to make this adjustment. When the analyses have not adjusted for clustering, we will attempt to adjust the results for clustering by multiplying the standard errors of the estimates by the square root of the design effect, where the design effect is calculated as DEff=1+(m‐1)*ICC. This assumes that the necessary information is reported, the average cluster size (m) and the intra‐cluster correlation coefficient (ICC).
4. We intended a sensitivity analysis to investigate the robustness of the results to the quality (risk of bias) components, but were unable to do so as there were insufficient trials. If appropriate and necessary, we will conduct sensitivity analysis on cluster‐RCTs using a range of estimates for the ICC to see if clustering could influence the individual trial's result.
2015 version
5. Comments on the review were addressed (see below). An updated search did not identify any new trials for inclusion.
2018 version
6. In 2018 we removed some secondary outcomes including our AUC calculations, asexual stage outcomes, and gametocyte prevalence outcomes at time periods after day 8, given new higher priority evidence and comparisons. AUC if reported by trials is still included. We removed the following secondary outcomes that were in the 2015 version:
-
Presence of asexual stage parasites (may be reported as treatment failure rate);
-
Asexual parasite clearance time (duration of asexual carriage).
We also restricted infectiousness and gametocyte prevalence outcomes to day 8 of follow‐up. We excluded any trial arms with < 0.2 mg/kg PQ (three arms). We converted analysis figures of infections acquired by mosquitoes to tables.
Notes
We received comments from Professor Nick White, who has published extensively on using PQ to prevent transmission. Professor White sent some helpful comments on the use of the data and its interpretation. These were considered by the authorship team and disaggregated into key points that needed to be addressed by the review. The Cochrane Contact Editor moderated the process. The main points raised and addressed were:
-
The lack of effect in low dose categories of PQ does not mean there is no effect and the data suggests a dose response relationship. Response: we have adjusted the wording within the review.
-
Data from Pukrittayakamee 2004 has been incorrectly extracted/interpreted. Response: Two review authors working independently assumed "after treatment" meant after the seven day course, and it was helpful to have it clarified that this was not the case. Therefore we excluded the data for day 8 gametocyte prevalence from this analysis. We inserted additional text on the gametocyte clearance time and duration of gametocyte carriage to the Results section.
Professor White's comments subsequently appeared in a publication about the topic (White 2014). We corrected all points of factual detail in the 2015 review version.
Keywords
MeSH
Medical Subject Headings (MeSH) Keywords
- Antimalarials [*administration & dosage];
- Artemisinins [administration & dosage, therapeutic use];
- Chloroquine [administration & dosage, therapeutic use];
- Drug Combinations;
- Glucosephosphate Dehydrogenase Deficiency [*diagnosis];
- Malaria, Falciparum [parasitology, *prevention & control, transmission];
- Mefloquine [administration & dosage, therapeutic use];
- Non-Randomized Controlled Trials as Topic;
- Plasmodium falciparum [drug effects];
- Primaquine [*administration & dosage, analogs & derivatives];
- Pyrimethamine [administration & dosage];
- Quinine [therapeutic use];
- Randomized Controlled Trials as Topic;
- Sulfadoxine [administration & dosage];
- Time Factors;
Medical Subject Headings Check Words
Adult; Child; Humans;
PICO

Review logic framework: the potential points in the Plasmodium parasite life cycle that could be impacted by PQ and the outcomes used to measure impact. Abbreviations: AUC: area under the curve. EIR: entomological inoculation rate; PQ: primaquine.
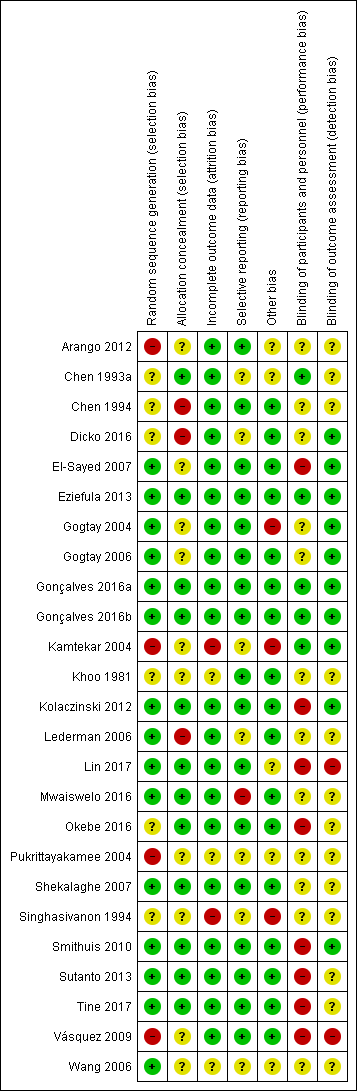
‘Risk of bias' summary: review authors' judgements about each risk of bias item for each included trial.
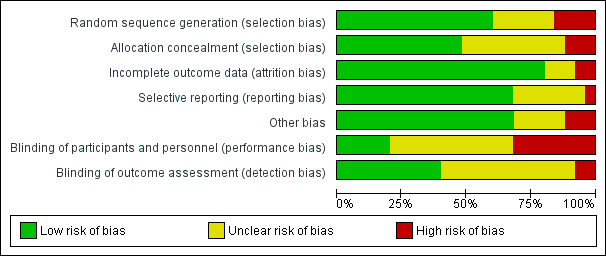
‘Risk of bias' graph: review authors' judgements about each risk of bias item presented as percentages across all included trials.
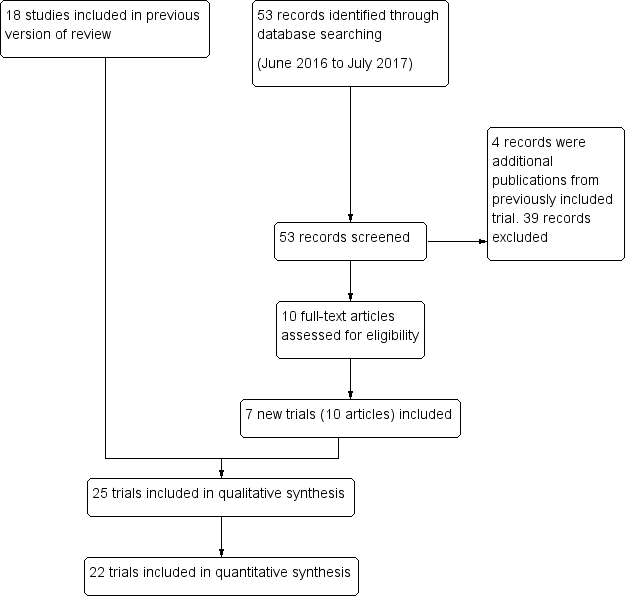
Study flow diagram

Comparison 1 Artemisinin treatment regimen: PQ versus no PQ, Outcome 1 Participants infectious, day 3 or 4, by dose.

Comparison 1 Artemisinin treatment regimen: PQ versus no PQ, Outcome 2 Participants with gametocytes (PCR), day 3 or 4, by dose.

Comparison 1 Artemisinin treatment regimen: PQ versus no PQ, Outcome 3 Participants with gametocytes (microscopy), day 3 or 4, by dose.

Comparison 1 Artemisinin treatment regimen: PQ versus no PQ, Outcome 4 Participants infectious, day 8, by dose.

Comparison 1 Artemisinin treatment regimen: PQ versus no PQ, Outcome 5 Participants with gametocytes (PCR), day 8, by dose.

Comparison 1 Artemisinin treatment regimen: PQ versus no PQ, Outcome 6 Participants with gametocytes (microscopy), day 8, by dose.
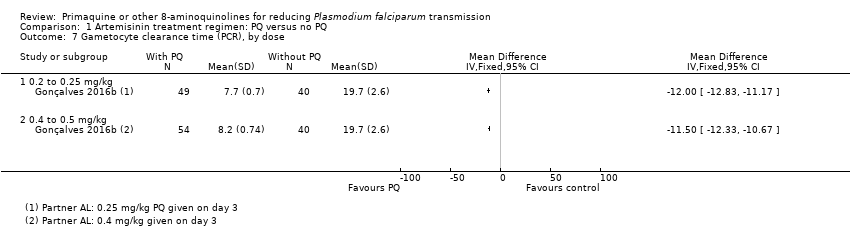
Comparison 1 Artemisinin treatment regimen: PQ versus no PQ, Outcome 7 Gametocyte clearance time (PCR), by dose.

Comparison 1 Artemisinin treatment regimen: PQ versus no PQ, Outcome 8 Area under curve of gametocytes (PCR), days 1 to 15, by dose.

Comparison 1 Artemisinin treatment regimen: PQ versus no PQ, Outcome 9 Participants with severe haemolysis, by dose.
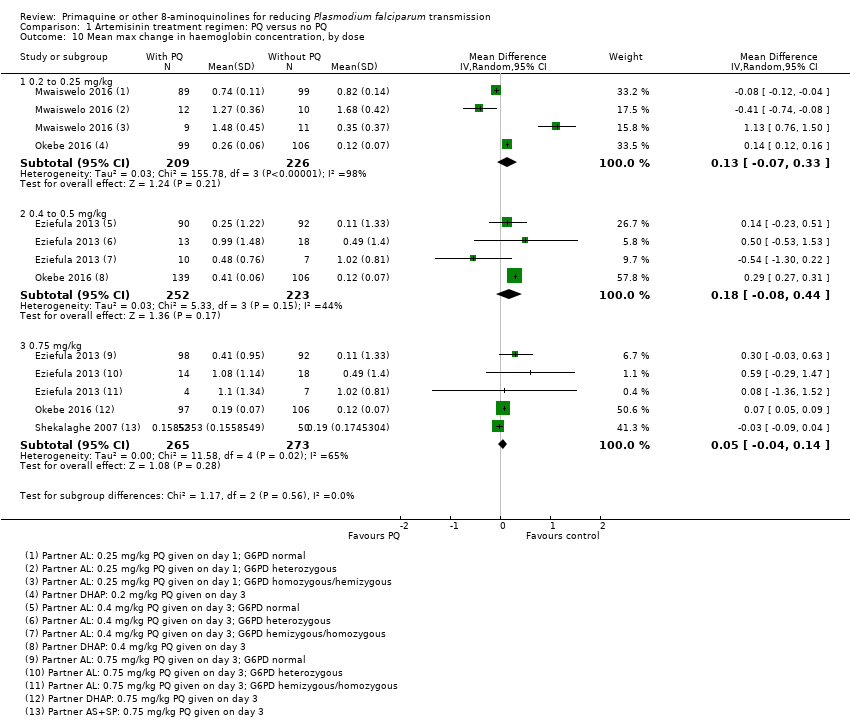
Comparison 1 Artemisinin treatment regimen: PQ versus no PQ, Outcome 10 Mean max change in haemoglobin concentration, by dose.
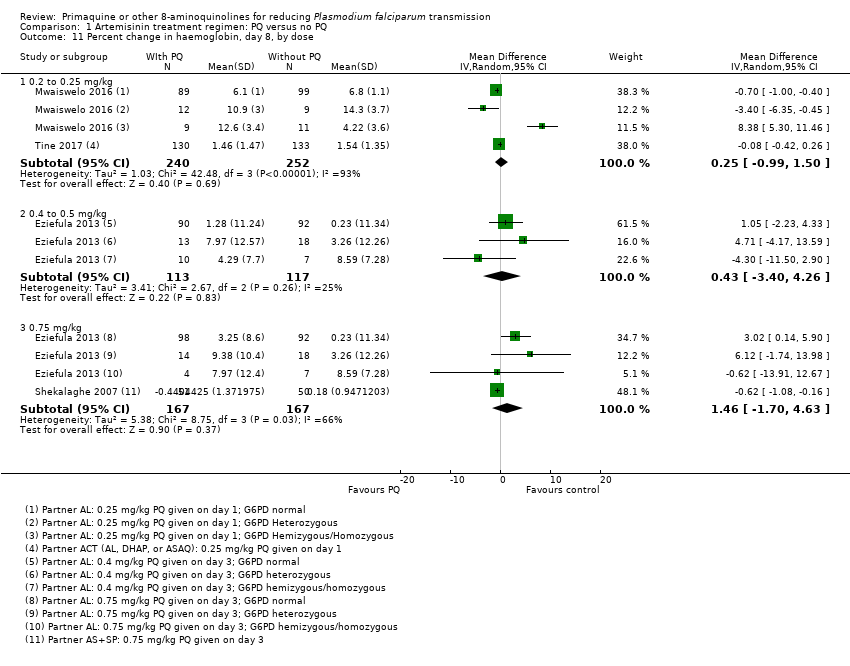
Comparison 1 Artemisinin treatment regimen: PQ versus no PQ, Outcome 11 Percent change in haemoglobin, day 8, by dose.

Comparison 1 Artemisinin treatment regimen: PQ versus no PQ, Outcome 12 Max percent change in haemoglobin, by dose.

Comparison 1 Artemisinin treatment regimen: PQ versus no PQ, Outcome 13 Haemoglobinuria/dark urine.

Comparison 1 Artemisinin treatment regimen: PQ versus no PQ, Outcome 14 Other adverse effects (CNS symptoms).

Comparison 1 Artemisinin treatment regimen: PQ versus no PQ, Outcome 15 Other adverse effects (systemic).
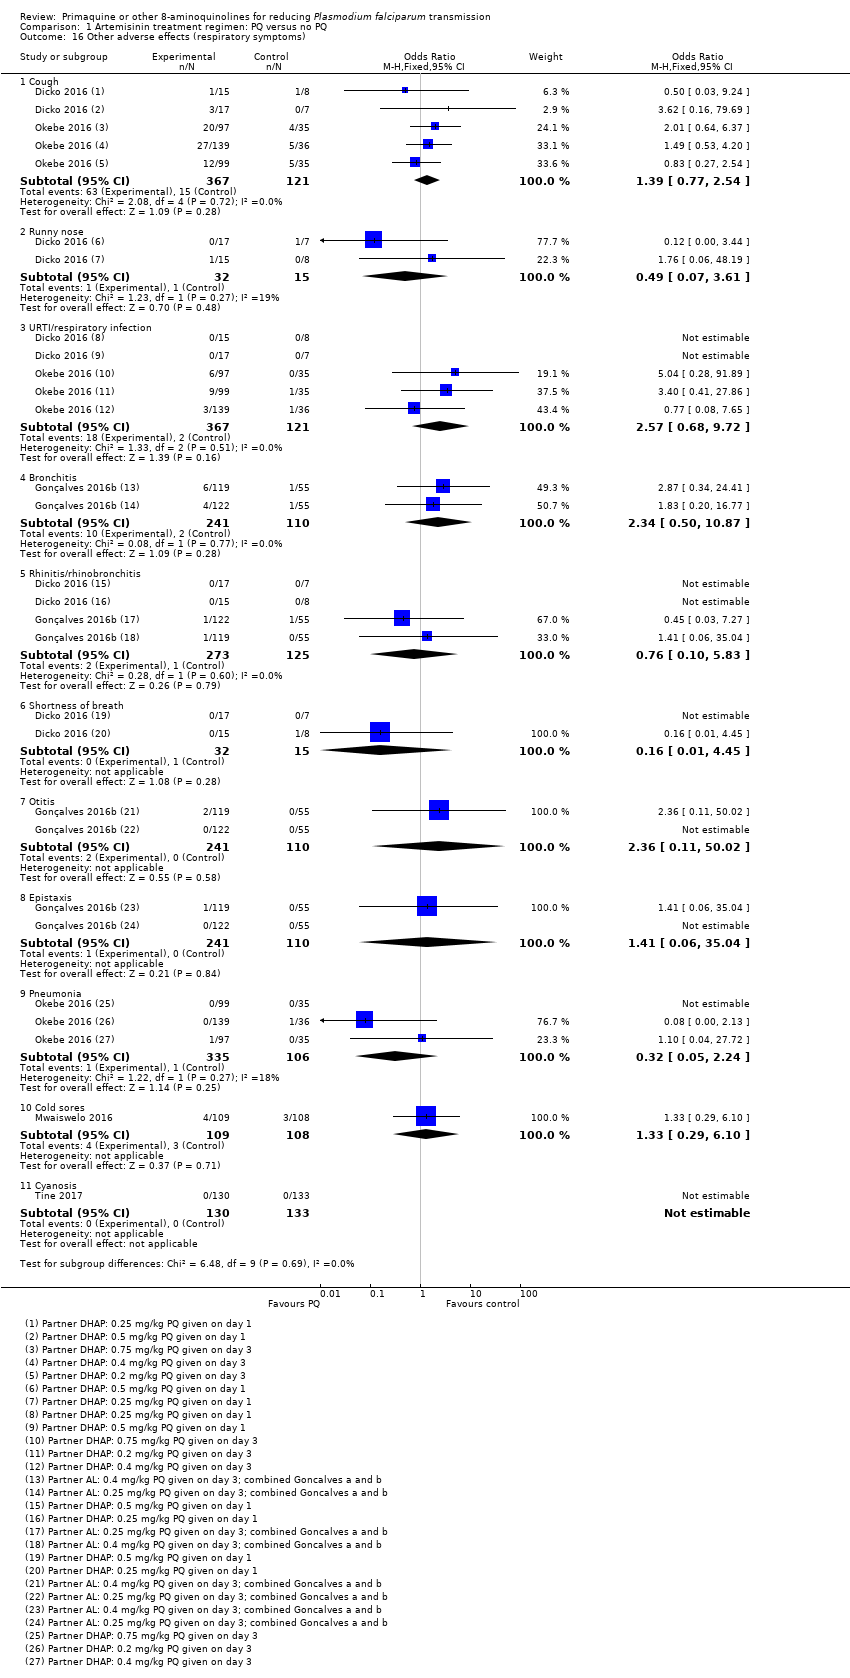
Comparison 1 Artemisinin treatment regimen: PQ versus no PQ, Outcome 16 Other adverse effects (respiratory symptoms).

Comparison 1 Artemisinin treatment regimen: PQ versus no PQ, Outcome 17 Other adverse effects (gastrointestinal symptoms).

Comparison 1 Artemisinin treatment regimen: PQ versus no PQ, Outcome 18 Other adverse effects (Miscellaneous).

Comparison 2 Artemisinin treatment regimen: PQ 0.25 versus 0.50 mg/kg, Outcome 1 Participants infectious, day 3 to 4.
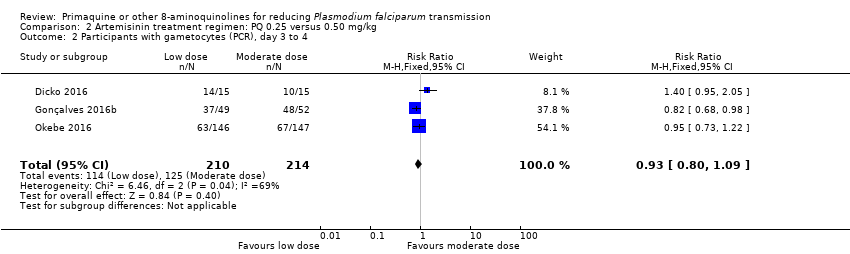
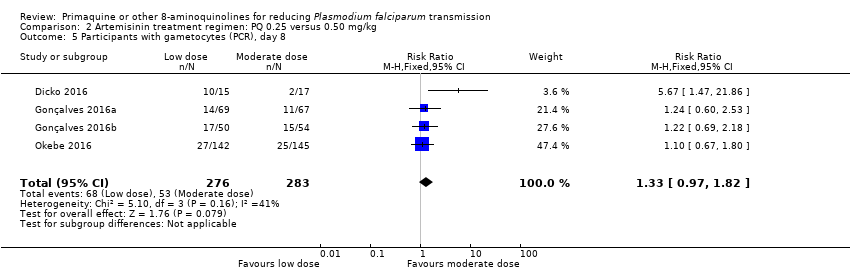
Comparison 2 Artemisinin treatment regimen: PQ 0.25 versus 0.50 mg/kg, Outcome 2 Participants with gametocytes (PCR), day 3 to 4.

Comparison 2 Artemisinin treatment regimen: PQ 0.25 versus 0.50 mg/kg, Outcome 3 Participants with gametocytes (microscopy), day 3 to 4.

Comparison 2 Artemisinin treatment regimen: PQ 0.25 versus 0.50 mg/kg, Outcome 4 Participants infectious, day 8.
Comparison 2 Artemisinin treatment regimen: PQ 0.25 versus 0.50 mg/kg, Outcome 5 Participants with gametocytes (PCR), day 8.

Comparison 2 Artemisinin treatment regimen: PQ 0.25 versus 0.50 mg/kg, Outcome 6 Participants with gametocytes (microscopy), day 8.

Comparison 3 Non‐artemisinin treatment regimen: PQ versus no PQ, Outcome 1 Participants infectious, day 5, by dose.
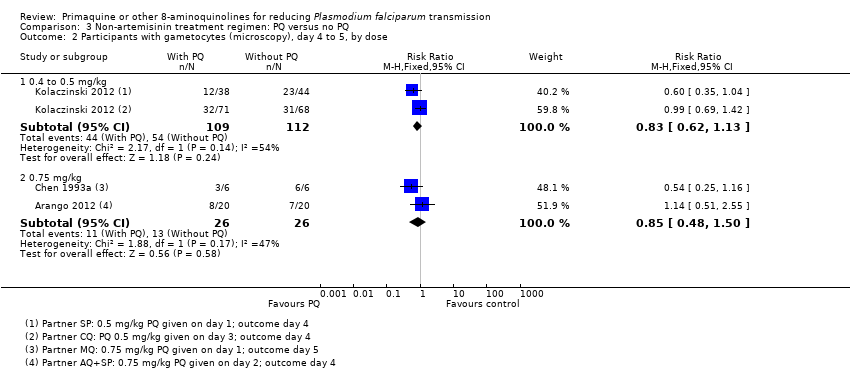
Comparison 3 Non‐artemisinin treatment regimen: PQ versus no PQ, Outcome 2 Participants with gametocytes (microscopy), day 4 to 5, by dose.

Comparison 3 Non‐artemisinin treatment regimen: PQ versus no PQ, Outcome 3 Participants infectious, day 8, by dose.

Comparison 3 Non‐artemisinin treatment regimen: PQ versus no PQ, Outcome 4 Participants with gametocytes (microscopy), day 8, by dose.
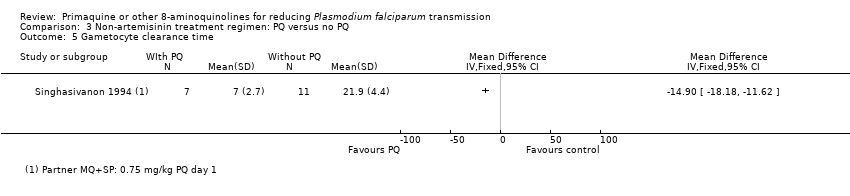
Comparison 3 Non‐artemisinin treatment regimen: PQ versus no PQ, Outcome 5 Gametocyte clearance time.

Comparison 3 Non‐artemisinin treatment regimen: PQ versus no PQ, Outcome 6 Adverse effects.

Comparison 4 PQ versus other 8AQ, Outcome 1 Participants with gametocytes (microscopy), day 8.
| Low‐dose primaquine (PQ) given with artemisinin combination treatment Participants or population: adults and children with malaria being treated with artemisinin combination treatment Settings: Mali, Burkina Faso, The Gambia, Tanzania, Senegal Intervention: single dose PQ dose 0.2 to 0.25 mg/kg Comparison: no PQ | ||||||
| Outcomes | Number of participants | Relative effect | Anticipated absolute effects* (95% CI) | Certainty of the evidence | Comments | |
| Risk with no PQ, with artemisinin partner | Risk with single dose PQ at 0.2 to 0.25 mg/kg | |||||
| Participants infectious at day 3‐4 | 105 | RR 0.12 | 14 per 100 | 2 per 100 | ⊕⊕⊝⊝ Due to imprecision | Low‐dose PQ may reduce infectiousness |
| Participants infectious at day 8 | 243 | RR 0.34 | 4 per 100 | 1 per 100 | ⊕⊕⊝⊝ Due to imprecision | Low‐dose PQ may reduce infectiousness |
| Participants with gametocytes at day 3 to 4 by PCR | 414 | RR 1.02 | 52 per 100 | 53 per 100 | ⊕⊕⊕⊝ Due to imprecision | Low‐dose PQ probably has little or no effect on gametocytes detected by PCR at day 3 to 4 |
| Participants with gametocytes at day 8 by PCR | 532 | RR 0.52 | 47 per 100 | 25 per 100 | ⊕⊕⊕⊕ | Low‐dose PQ reduces gametocytes detected by PCR at day 8 |
| Participants with severe haemolysis | 752 | RR 0.98 | 13 per 100 | 13 per 100 | ⊕⊕⊕⊝ Due to imprecision | Low‐dose PQ probably has little or no effect on severe haemolysis |
| *The risk in the intervention group (and its 95% CI) is based on the assumed risk in the comparison group and the relative effect of the intervention (and its 95% CI). | ||||||
| GRADE Working Group grades of evidence | ||||||
| 1Downgraded by 2 for imprecision: the CIs are wide; in addition, there is a large effect combined with a low number of events, which creates further uncertainty around the point estimate. | ||||||
| Moderate‐dose primaquine (PQ) given with artemisinin combination treatment Participants or population: adults and children with malaria being treated with artemisinin combination treatment Settings: Mali, Burkina Faso, The Gambia, Uganda Intervention: single dose PQ 0.4 to 0.5 mg/kg Comparison: no PQ | ||||||
| Outcomes | Number of participants | Relative effect | Anticipated absolute effects* (95% CI) | Certainty of the evidence | Comments | |
| Risk with no PQ, with artemisinin partner, | Risk with single dose PQ at 0.4 to 0.5 mg/kg | |||||
| Participants infectious at day 3‐4 | 109 | RR 0.13 | 14 per 100 | 2 per 100 | ⊕⊕⊝⊝ Due to imprecision | Medium dose PQ may reduce infectiousness |
| Participants infectious at day 8 | 246 | RR 0.33 | 4 per 100 | 1 per 100 (0 to 6) | ⊕⊕⊝⊝ Due to imprecision | Medium dose PQ may reduce infectiousness |
| Participants with gametocytes at day 3‐4, by PCR | 418 | RR 1.09 | 52 per 100 | 57 per 100 (48 to 67) | ⊕⊕⊕⊝ Due to imprecision | Medium dose PQ probably has little or no effect on gametocytes detected by PCR on day 3 to 4 |
| Participants with gametocytes at day 8, by PCR | 758 | RR 0.37 | 43 per 100 | 16 per 100 (13 to 21) | ⊕⊕⊕⊕ | Medium dose PQ reduces gametocytes detected by PCR on day 8 |
| Participants with severe haemolysis | 260 | RR 1.54 | 2 per 100 | 4 per 100 (1 to 15) | ⊕⊕⊝⊝ Due to imprecision | Medium dose PQ may increase severe haemolysis |
| *The risk in the intervention group (and its 95% confidence interval) is based on the assumed risk in the comparison group and the relative effect of the intervention (and its 95% CI). | ||||||
| GRADE Working Group grades of evidence | ||||||
| 1Downgraded by 2 for imprecision: the CIs are wide; in addition, there is a large effect combined with a low number of events, which creates further uncertainty around the point estimate. | ||||||
| High‐dose primaquine (PQ) given with artemisinin combination treatment Participants or population: adults and children with malaria being treated with artemisinin combination treatment Settings: Cambodia, Mali, Burkina Faso, The Gambia, Tanzania, Sudan, Uganda Intervention: single dose PQ 0.75 mg/kg Comparison: no PQ | ||||||
| Outcomes | Number of participants | Relative effect | Anticipated absolute effects* (95% CI) | Certainty of the evidence | Comments | |
| Risk with no PQ, with artemisinin partner | Risk with single dose PQ at 0.75mg/kg | |||||
| Participants infectious at day 3‐4 | 101 | RR 0.20 (0.02 to 1.68) | 10 per 100 | 2 per 100 (0 to 16) | ⊕⊕⊝⊝ LOW1,2 Due to imprecision | We do not know if high dose PQ may reduce infectiousness |
| Participants infectious at day 8 | 181 | RR 0.18 | 5 per 100 | 1 per 100 (0 to 8) | ⊕⊕⊝⊝ Due to imprecision | High dose PQ may reduce infectiousness |
| Participants with gametocytes at day 3‐4, by PCR | 290 | RR 0.92 | 38 per 100 | 35 per 100 (29 to 43) | ⊕⊕⊝⊝ Due to indirectness and imprecision | High dose PQ may have little or no effect on gametocytes detected by PCR |
| Participants with gametocytes at day 8, by PCR | 793 | RR 0.31 | 36 per 100 | 11 per 100 (8 to 16) | ⊕⊕⊕⊕ | High dose PQ reduces gametocytes detected by PCR |
| Participants with severe haemolysis | 106 | No estimate | Not estimable | Not estimable | No data | We don't know if high dose PQ impacts on haemolysis |
| *The risk in the intervention group (and its 95% CI) is based on the assumed risk in the comparison group and the relative effect of the intervention (and its 95% CI). | ||||||
| GRADE Working Group grades of evidence | ||||||
| 1Downgraded by 2 for imprecision: the CIs are wide; in addition, there is a large effect combined with a low number of events, which creates further uncertainty around the point estimate. In addition, in this one trial baseline. | ||||||
| Moderate‐dose primaquine (PQ) given with non‐artemisinin treatment Participants or population: adults and children with malaria being treated with non‐artemisinin treatment Settings: Pakistan Intervention: single dose PQ 0.4 to 0.5 mg/kg Comparison: no PQ | ||||||
| Outcomes | Number of participants | Relative effect | Anticipated absolute effects* (95% CI) | Certainty of the evidence | Comments | |
| Risk with no PQ, with non‐artemisinin partner | Risk with single dose PQ at 0.4 to 0.5 mg/kg | |||||
| Participants with gametocytes at day 4‐5, by microscopy | 221 | RR 0.83 | 48 per 100 | 40 per 100 (30 to 54) | ⊕⊕⊕⊝ Due to indirectness | Medium dose PQ probably reduces gametocytes detected by microscopy |
| Participants with gametocytes at day 8, by microscopy | 216 | RR 0.60 | 81 per 100 | 49 per 100 (40 to 61) | ⊕⊕⊕⊝ Due to indirectness | Medium dose PQ probably reduces gametocytes detected by microscopy |
| *The risk in the intervention group (and its 95% CI) is based on the assumed risk in the comparison group and the relative effect of the intervention (and its 95% CI). | ||||||
| GRADE Working Group grades of evidence | ||||||
| 1Downgraded by 1 for indirectness: all the results are from one setting. | ||||||
| Medium‐dose primaquine (PQ) given with non‐artemisinin treatment Participants or population: adults and children with malaria being treated with non‐artemisinin treatment Settings: China, Colombia, India, Indonesia Intervention: single dose PQ 0.75 mg/kg Comparison: no PQ | ||||||
| Outcomes | Number of participants | Relative effect | Anticipated absolute effects* (95% CI) | Certainty of the evidence | Comments | |
| Risk with no PQ, with non‐artemisinin partner | Risk with single dose PQ at 0.75 mg/kg | |||||
| Participants infectious at day 5 | 30 | RR 0.09 | 67 per 100 | 6 per 100 (1 to 41) | ⊕⊝⊝⊝ Due to risk of bias and imprecision | We are uncertain whether high dose PQ reduces infectiousness |
| Participants infectious at day 8 | 30 | RR 0.07 | 93 per 100 | 7 per 100 (1 to 42) | ⊕⊝⊝⊝ Due to risk of bias and imprecision | We are uncertain whether high dose PQ reduces infectiousness |
| Participants with gametocytes at day 5, by microscopy | 52 | RR 0.85 | 50 per 100 | 43 per 100 (24 to 75) | ⊕⊕⊝⊝ Due to risk of bias and imprecision | High dose PQ may reduce gametocytes detected by microscopy |
| Participants with gametocytes at day 8, by microscopy | 186 | RR 0.39 | 48 per 100 | 19 per 100 (12 to 29) | ⊕⊕⊕⊝ Due to risk of bias | High dose PQ probably reduces gametocytes detected by microscopy |
| *The risk in the intervention group (and its 95% CI) is based on the assumed risk in the comparison group and the relative effect of the intervention (and its 95% CI). | ||||||
| GRADE Working Group grades of evidence | ||||||
| 1Downgraded by 1 for risk of bias: unclear risk of bias in several domains from both studies. | ||||||
| Comparator | Trial | Arm | Place | G6PD status | Parasite species | Partner or alternative drug | Proportion with gametocytes at onset (control group) | Proportion with gametocytes at onset (experimental group) | Day(s)* PQ given | Target PQ dose per day |
| Artemisinin‐based partner | ||||||||||
| AS or ACT | b | Colombia | Not reported | Pf only | AS+MQ days 1 to 3 | 34.8% Mic (N = 23) | 26.3% Mic (N = 19) | day 2 | 0.75 mg/kg | |
| a | Mali | Only non‐deficient included1 | Pf only | DHAP days 1 to 3 | 100% Mic (N = 15) Table 1 | 100% Mic (N = 16) | day 1 | 0.0625 mg/kg** | ||
| b | 100% Mic (N = 16) | day 1 | 0.125 mg/kg** | |||||||
| c | 100% Mic (N = 15) | day 1 | 0.25 mg/kg | |||||||
| d | 100% Mic (N = 17) | day 1 | 0.5 mg/kg | |||||||
| Sudan (east) | Not reported | Pf only | AS+SP days 1 to 3 | 11.5% PCR (N = 52) Table 2 | 11.5% PCR (N = 52) | day 4 | 0.75 mg/kg | |||
| a | Uganda | Only non‐deficient included2 (PCR testing of those included after FST) | Pf only | AL days 1 to 3 | 23.1% Mic (N = 117) 79.8% PCR (N = 114) Table 1 | 24.3% MIc (N = 115) 86.7% PCR (N = 113) | day 3 | 0.1 mg/kg** | ||
| b | 20.4% Mic (N = 113) 78.7% PCR (N = 108) | day 3 | 0.4 mg/kg | |||||||
| c | 22.4% Mic (N = 116) 82.0% PCR (N = 111) | day 3 | 0.75 mg/kg | |||||||
| a | Burkina Faso | Only non‐deficient included3 | Pf only | AL days 1 to 3 | 17.7% Mic (N = 62) Table 2 | 32% Mic (N = 75) 92.9% PCR (N = 70) | day 3 | 0.25 mg/kg | ||
| b | 20.5% Mic (N = 73) 85.5% PCR (N = 62) | day 3 | 0.4 mg/kg | |||||||
| a | Burkina Faso | Only non‐deficient included3 | Pf only | AL days 1 to 3 | 69.4% Mic (N = 49) Table 2 | 55.3% Mic (N = 47) 93.7% PCR (N = 48) | day 3 | 0.25 mg/kg | ||
| b | 83.3% Mic (N = 46) 100.0% PCR (N = 46) | day 3 | 0.4 mg/kg | |||||||
| Cambodia | Screened and severely deficient excluded4 | Pf or Pf+Pv | DHAP days 1 to 3 | 10% Mic 44% PCR (N = 51) Table 1 | 8% Mic 49% PCR (N = 50) Table 1 | day 3 | 0.75 mg/kg | |||
| Tanzania | Screened and all included5 | Pf only | AL days 1 to 3 | 1 patient had gametocytes at recruitment but treatment group not given | 0.5% Mic (N = 220) both groups | day 1 | 0.25 mg/kg | |||
| a | The Gambia | Only non‐deficient included2 | Pf only | DHAP days 1 to 3 | 47.7% PCR (N = 153) Table 1 | 53.4% PCR (N = 148) | day 3 | 0.2 mg/kg | ||
| b | 54.6% PCR (N = 152) | day 3 | 0.4 mg/kg | |||||||
| c | 53.4% PCR (N = 146) | day 3 | 0.75 mg/kg | |||||||
| c | Thailand | Only non‐deficient included10 | Pf only | AS days 1 to 7 | 26.1% Mic (N = 23) Table 3 | 26.0% Mic (N = 50) | days 1 to 7 | 0.5 mg/kg | ||
| Tanzania (North east) | Screened and all included6 | Pf only | AS+SP days 1 to 3 | 26.4% Mic (N = 63) 88.2% PCR (N = 51) Table 1 | 18.9% Mic (N = 53) 90.6% PCR (N = 53) | day 3 | 0.75 mg/kg | |||
| a | Myanmar (3 states) | Not screened | Pf or mixed | AS+AQ days 1 to 3 | 32.1% Mic (N = 84) | 36.6% Mic (N = 71) | day 1 | 0.75 mg/kg | ||
| b | AL days 1 to 3 | 34.5% Mic (N = 84) | 32.1% Mic (N = 78) | day 1 | 0.75 mg/kg | |||||
| c | AS+MQ fixed dose days 1 to 3 | 31.3% Mic (N = 83) | 27.9%% Mic (N = 86) | day 1 | 0.75 mg/kg | |||||
| d | AS days 1 to 3 + MQ day 1 loose | 30.5% Mic (N = 82) | 26.6% Mic (N = 79) | day 1 | 0.75 mg/kg | |||||
| e | DHAP days 1 to 3 | 43.6% Mic (N = 78) | 32.5% Mic (N = 83) | day 1 | 0.75 mg/kg | |||||
| Indonesia (south Sumatra) | Only non‐deficient included7 | Pf only | DHAP days 1 to 3 | 17.4% Mic (N = 178) Figure 1 | 24.0% Mic (on day 3) (N = 171) | day 4 | 0.75 mg/kg | |||
| a | Senegal | Screened and all included5 | Pf only | AL days 1 to 3 | 6.7% Mic (N = 135) Table 5 | 7.9% Mic (N = 139) Table 5 | day 1 | 0.25 mg/kg | ||
| b | DHAP days 1 to 3 | |||||||||
| c | AS+AQ days 1 to 3 | |||||||||
| Colombia (Antioquia) | Not reported | Pf only | AS+MQ days 1 to 3 (MQ only on day 2 for children < 6) | 16% Mic (N = 25) Figure 1 estimated | 24.0% Mic (N = 25) | day 3 | 45 mg (˜0.75 mg/kg) | |||
| Gabon | Not reported | Pf | AS i.m. days 1 to 5 | Not reported (N = 106) | Not reported (N = 108) | days 1 to 5 | 22.5 mg (˜0.38 mg/kg) | |||
| Non‐artemisinin partner | ||||||||||
| CQ or (CQ+SP) | a | India (Mumbai) | Not screened | Pf only | CQ days 1 to 3 or CQ days 1 to 3 + SP day 1 | 100% Mic (N = 44) | 100% Mic (within 3 days) (N = 45) | day 4 | 45 mg (˜0.75 mg/kg) | |
| Malaysia (Sabah) | Only deficient included8 | Pf, Pv or mixed | CQ days 1 to 3 | Not reported | Not reported | days 1 to 3 | 25 mg (˜0.42 mg/kg) | |||
| a | Pakistan (3 Afghan refugee camps) | Not reported | Pf only | CQ days 1 to 3 | 17.6% Mic (N = 239) Table 2 (combined CQ, CQ+AS, SP, SP+AS groups) | 19.7% Mic (N = 76) | day 3 | 0.5 mg/kg | ||
| a | Indonesia (Central Java) | Only non‐deficient included9 | Pf only | CQ days 1 to 3 + SP day 1 | 8.2% Mic (N = 61) Figure 3 est (combined CQ, CQ+SP groups) | 25% Mic (N = 28) Figure 3 est | day 1 | 45 mg (˜0.75 mg/kg) | ||
| b | 14.3% (N = 28) Figure 3 est | day 3 | 45 mg (˜0.75 mg/kg) | |||||||
| SP | b | Pakistan (2 Afghan refugee camps) | Not reported | Pf only | SP day 1 | See above under Kolaczinski 2012 a | 27.1% Mic (N = 85) | day 1 | 0.5 mg/kg | |
| AQ+SP | a | Colombia | Not reported | Pf only | AQ days 1 to 3 + SP day 1 | 15% Mic (N = 20) Table 3 | 30% Mic (N = 20) | day 2 | 0.75 mg/kg | |
| MQ or (MQ+SP) | China | Not reported | Pf only | MQ day 1 | 100% Mic (N = 6) | 100% Mic (N = 6) | day 1 | 45 mg (˜0.75 mg/kg) | ||
| China (Hainan province) | Not reported | Pf only | MQ day 1 | 100% Mic (N = 9) MQ group only | 100% Mic (N = 9) | day 1 | 45 mg (˜0.75 mg/kg) | |||
| Thailand (Bangkok) | Not reported | Pf only | MQ+SP fixed day 1 | Not reported (N = 11) | Not reported (N = 7) | day 1 | 0.75 mg/kg | |||
| QN | b | India (Mumbai) | Not screened | Pf only | QN i.v. days 1 to 2 and orally days 1 to 7 | 88.6% Mic (N = 44) | 100% Mic (within 3 days) (N = 45) | day 8 | 45 mg (˜0.75 mg/kg) | |
| a | Thailand | Only non‐deficient included10 | Pf only | QN days 1 to 7 | 23.3% Mic (N = 60) QN, QN+TC groups | 18.6% Mic (N = 59) | days 1 to 7 | 0.25 mg base/kg | ||
| b | 22.4% Mic (N = 67) | days 1 to 7 | 0.5 mg base/kg | |||||||
| Comparison of different 8AQ | ||||||||||
| PQ versus Bulaquine | India (Mumbai) | Only non‐deficient included10 | Pf | QN + doxycycline days 1 to 7 + BQ day 4 | No control group without 8‐AQ | 100% Mic (N = 22) | day 4 | 45 mg (˜0.75 mg/kg) | ||
| India | Only non‐deficient included10 | Pf | QN + doxycycline days 1 to 7 + BQ day 4 | No control group without 8‐AQ | 100% Mic (N = 93) | day 4 | 45 mg (˜0.75 mg/kg) | |||
| *first day of any treatment = day 1 **arm excluded as dose < 0.2 mg/kg 1G6PD colorimetric method, R&D diagnostics, Papagos, Greece. Abbreviations: G6PD = glucose‐6‐phosphate dehydrogenase; FST = fluorescent spot test; PQ = primaquine; CQ = chloroquine; SP = sulfadoxine‐pyrimethamine; MQ = mefloquine; QN = quinine; AS = artesunate; ACT = artemisinin‐based combination therapy; 8AQ: 8‐aminoquinoline; AQ = amodiaquine; AL = artemether‐lumefantrine; DHAP = dihydroxyartemisinin‐piperaquine; BQ = bulaquine; i.v. = intravenous injection; i.m. = intramuscular injection; Mic = microscopy; Pf = P. falciparum; Pv = P. vivax. | ||||||||||
| Dose | Study | With PQ | Without PQ | Absolute difference (reduction or increase) in % of mosquitoes infected in PQ group | Average number of mosquitoes dissected per participant (both arms combined) | ||||
| Total number | Number of infectious | Average % of mosquitoes infected | Total number of | Number of infectious | Average % | ||||
| 0.25 mg/kg | 15 | 14 | 35.5 | 14 | 10 | 6.7 | +28.8 | 143.1 | |
| 27 | 8 | 4.5 | 32 | 15 | 14.8 | −10.3 | 44.0 | ||
| 0.4 to 0.5 mg/kg | 14 | 12 | 11.0 | 14 | 10 | 6.7 | +4.3 | 136.6 | |
| 20 | 7 | 8.9 | 32 | 15 | 14.8 | −5.8 | 44.3 | ||
| 0.75 mg/kg | 50 | 1 | 1.4 | 51 | 6 | 5.3 | −3.9 | 50 | |
| Abbreviations: PQ: primaquine. | |||||||||
| Dose | Study | With PQ | Without PQ | Absolute difference (reduction or increase) in % of mosquitoes infected in PQ group | Average number of mosquitoes | ||||
| Total number | Number of infectious | Average % of | Total number of | Number of infectious | Average % | ||||
| 0.25 mg/kg | 15 | 1 | 0.6 | 13 | 7 | 8.1 | −7.5 | 71.6 | |
| 27 | 0 | 0.0 | 32 | 0 | 0.0 | 0.0 | 26.9 | ||
| 23 | 0 | 0.0 | 19 | 0 | 0.0 | 0.0 | 45.6 | ||
| 0.4 to 0.5 mg/kg | 14 | 1 | 0.3 | 13 | 7 | 8.1 | −7.8 | 70.2 | |
| 20 | 0 | 0.0 | 32 | 0 | 0.0 | 0.0 | 33.4 | ||
| 28 | 0 | 0.0 | 19 | 0 | 0.0 | 0.0 | 45.6 | ||
| 0.75 mg/kg | 50 | 1 | 1.4 | 51 | 5 | 6.6 | ‐5.2 | 50 | |
| Abbreviations: PQ: primaquine. | |||||||||
| Dose | Study | With PQ | Without PQ | Absolute difference (reduction or increase) in % of mosquitoes infected in PQ group | Average number of mosquitoes dissected per participant (both arms combined) | ||||
| Total number of | Number of infectious | Average % | Total number of | Number of infectious people | Average % | ||||
| 0.2 to 0.25 mg/kg | 15 | 0 | 0.0 | 13 | 3 | 3.7 | −3.7 | 72.8 | |
| 27 | 0 | 0.0 | 32 | 0 | 0.0 | 0.0 | 26.6 | ||
| 49 | 0 | 0.0 | 49 | 1 | 0.2 | −0.2 | 43.7 | ||
| 44 | 1 | 29.2 | 46 | 1 | 1.3 | +27.9 | 80 | ||
| 0.4 to 0.5 mg/kg | 14 | 1 | 0.1 | 13 | 3 | 3.7 | −3.6 | 71 | |
| 20 | 0 | 0.0 | 32 | 0 | 0.0 | 0.0 | 31.4 | ||
| 46 | 0 | 0.0 | 49 | 1 | 0.2 | −0.2 | 43.4 | ||
| 42 | 0 | 0.0 | 46 | 1 | 1.3 | −1.3 | 80 | ||
| 0.75 mg/kg | 48 | 0 | 0.0 | 48 | 4 | 6.9 | −6.9 | 50 | |
| 39 | 0 | 0.0 | 46 | 1 | 1.3 | −1.3 | 80 | ||
| ¹Okebe 2016 reported the median number of mosquitoes per person. Abbreviations: PQ: primaquine. | |||||||||
| Outcome or subgroup title | No. of studies | No. of participants | Statistical method | Effect size |
| 1 Participants infectious, day 3 or 4, by dose Show forest plot | 4 | Risk Ratio (M‐H, Fixed, 95% CI) | Subtotals only | |
| 1.1 0.2 to 0.25 mg/kg | 3 | 105 | Risk Ratio (M‐H, Fixed, 95% CI) | 0.12 [0.02, 0.88] |
| 1.2 0.4 to 0.5 mg/kg | 3 | 109 | Risk Ratio (M‐H, Fixed, 95% CI) | 0.13 [0.02, 0.94] |
| 1.3 0.75 mg/kg | 1 | 101 | Risk Ratio (M‐H, Fixed, 95% CI) | 0.20 [0.02, 1.68] |
| 2 Participants with gametocytes (PCR), day 3 or 4, by dose Show forest plot | 4 | Risk Ratio (M‐H, Fixed, 95% CI) | Subtotals only | |
| 2.1 0.2 to 0.25 mg/kg | 3 | 414 | Risk Ratio (M‐H, Fixed, 95% CI) | 1.02 [0.87, 1.21] |
| 2.2 0.4 to 0.5 mg/kg | 3 | 418 | Risk Ratio (M‐H, Fixed, 95% CI) | 1.09 [0.93, 1.28] |
| 2.3 0.75 mg/kg | 2 | 394 | Risk Ratio (M‐H, Fixed, 95% CI) | 0.92 [0.75, 1.13] |
| 3 Participants with gametocytes (microscopy), day 3 or 4, by dose Show forest plot | 6 | Risk Ratio (M‐H, Random, 95% CI) | Subtotals only | |
| 3.1 0.2 to 0.25 mg/kg | 3 | 490 | Risk Ratio (M‐H, Random, 95% CI) | 0.73 [0.21, 2.50] |
| 3.2 0.4 to 0.5 mg/kg | 2 | 225 | Risk Ratio (M‐H, Random, 95% CI) | 0.86 [0.33, 2.25] |
| 3.3 0.75 mg/kg | 3 | 248 | Risk Ratio (M‐H, Random, 95% CI) | 0.42 [0.20, 0.85] |
| 4 Participants infectious, day 8, by dose Show forest plot | 5 | Risk Ratio (M‐H, Fixed, 95% CI) | Subtotals only | |
| 4.1 0.2 to 0.25 mg/kg | 4 | 243 | Risk Ratio (M‐H, Fixed, 95% CI) | 0.34 [0.07, 1.58] |
| 4.2 0.4 to 0.5 mg/kg | 4 | 246 | Risk Ratio (M‐H, Fixed, 95% CI) | 0.33 [0.07, 1.57] |
| 4.3 0.75 mg/kg | 2 | 181 | Risk Ratio (M‐H, Fixed, 95% CI) | 0.18 [0.02, 1.41] |
| 5 Participants with gametocytes (PCR), day 8, by dose Show forest plot | 8 | Risk Ratio (M‐H, Fixed, 95% CI) | Subtotals only | |
| 5.1 0.2 to 0.25 mg/kg PQ | 4 | 532 | Risk Ratio (M‐H, Fixed, 95% CI) | 0.52 [0.41, 0.65] |
| 5.2 0.4 to 0.5 mg/kg PQ | 5 | 758 | Risk Ratio (M‐H, Fixed, 95% CI) | 0.37 [0.29, 0.48] |
| 5.3 0.75 mg/kg PQ | 5 | 793 | Risk Ratio (M‐H, Fixed, 95% CI) | 0.31 [0.23, 0.43] |
| 6 Participants with gametocytes (microscopy), day 8, by dose Show forest plot | 9 | Risk Ratio (M‐H, Fixed, 95% CI) | Subtotals only | |
| 6.1 0.2 to 0.25 mg/kg | 3 | 491 | Risk Ratio (M‐H, Fixed, 95% CI) | 0.35 [0.16, 0.78] |
| 6.2 0.4 to 0.5 mg/kg | 2 | 225 | Risk Ratio (M‐H, Fixed, 95% CI) | 0.25 [0.08, 0.75] |
| 6.3 0.75 mg/kg | 6 | 1443 | Risk Ratio (M‐H, Fixed, 95% CI) | 0.27 [0.19, 0.37] |
| 7 Gametocyte clearance time (PCR), by dose Show forest plot | 1 | Mean Difference (IV, Fixed, 95% CI) | Totals not selected | |
| 7.1 0.2 to 0.25 mg/kg | 1 | Mean Difference (IV, Fixed, 95% CI) | 0.0 [0.0, 0.0] | |
| 7.2 0.4 to 0.5 mg/kg | 1 | Mean Difference (IV, Fixed, 95% CI) | 0.0 [0.0, 0.0] | |
| 8 Area under curve of gametocytes (PCR), days 1 to 15, by dose Show forest plot | 1 | Mean Difference (IV, Fixed, 95% CI) | Totals not selected | |
| 8.1 0.2 to 0.25 mg/kg | 1 | Mean Difference (IV, Fixed, 95% CI) | 0.0 [0.0, 0.0] | |
| 8.2 0.4 to 0.5 mg/kg | 1 | Mean Difference (IV, Fixed, 95% CI) | 0.0 [0.0, 0.0] | |
| 9 Participants with severe haemolysis, by dose Show forest plot | 5 | Risk Ratio (M‐H, Fixed, 95% CI) | Subtotals only | |
| 9.1 0.2 to 0.25 mg/kg | 4 | 752 | Risk Ratio (M‐H, Fixed, 95% CI) | 0.98 [0.69, 1.39] |
| 9.2 0.4 to 0.5 mg/kg | 2 | 260 | Risk Ratio (M‐H, Fixed, 95% CI) | 1.54 [0.38, 6.30] |
| 9.3 0.75 mg/kg | 1 | 102 | Risk Ratio (M‐H, Fixed, 95% CI) | 0.0 [0.0, 0.0] |
| 10 Mean max change in haemoglobin concentration, by dose Show forest plot | 4 | Mean Difference (IV, Random, 95% CI) | Subtotals only | |
| 10.1 0.2 to 0.25 mg/kg | 2 | 435 | Mean Difference (IV, Random, 95% CI) | 0.13 [‐0.07, 0.33] |
| 10.2 0.4 to 0.5 mg/kg | 2 | 475 | Mean Difference (IV, Random, 95% CI) | 0.18 [‐0.08, 0.44] |
| 10.3 0.75 mg/kg | 3 | 538 | Mean Difference (IV, Random, 95% CI) | 0.05 [‐0.04, 0.14] |
| 11 Percent change in haemoglobin, day 8, by dose Show forest plot | 4 | Mean Difference (IV, Random, 95% CI) | Subtotals only | |
| 11.1 0.2 to 0.25 mg/kg | 2 | 492 | Mean Difference (IV, Random, 95% CI) | 0.25 [‐0.99, 1.50] |
| 11.2 0.4 to 0.5 mg/kg | 1 | 230 | Mean Difference (IV, Random, 95% CI) | 0.43 [‐3.40, 4.26] |
| 11.3 0.75 mg/kg | 2 | 334 | Mean Difference (IV, Random, 95% CI) | 1.46 [‐1.70, 4.63] |
| 12 Max percent change in haemoglobin, by dose Show forest plot | 2 | Mean Difference (IV, Fixed, 95% CI) | Totals not selected | |
| 12.1 0.2 to 0.25 mg/kg | 1 | Mean Difference (IV, Fixed, 95% CI) | 0.0 [0.0, 0.0] | |
| 12.2 0.4 to 0.5 mg/kg | 1 | Mean Difference (IV, Fixed, 95% CI) | 0.0 [0.0, 0.0] | |
| 12.3 0.75 mg/kg | 1 | Mean Difference (IV, Fixed, 95% CI) | 0.0 [0.0, 0.0] | |
| 13 Haemoglobinuria/dark urine Show forest plot | 3 | 527 | Odds Ratio (M‐H, Fixed, 95% CI) | 3.40 [2.15, 5.38] |
| 14 Other adverse effects (CNS symptoms) Show forest plot | 6 | Odds Ratio (M‐H, Fixed, 95% CI) | Subtotals only | |
| 14.1 Headache | 5 | 1706 | Odds Ratio (M‐H, Fixed, 95% CI) | 0.95 [0.66, 1.36] |
| 14.2 Paresthesia | 1 | 331 | Odds Ratio (M‐H, Fixed, 95% CI) | 0.95 [0.13, 6.80] |
| 14.3 Dizziness | 4 | 1335 | Odds Ratio (M‐H, Fixed, 95% CI) | 0.95 [0.74, 1.23] |
| 14.4 Meningitis | 1 | 441 | Odds Ratio (M‐H, Fixed, 95% CI) | 0.08 [0.00, 2.13] |
| 14.5 Blurred vision | 1 | 217 | Odds Ratio (M‐H, Fixed, 95% CI) | 0.33 [0.01, 8.12] |
| 14.6 Insomnia | 1 | 808 | Odds Ratio (M‐H, Fixed, 95% CI) | 0.97 [0.64, 1.47] |
| 15 Other adverse effects (systemic) Show forest plot | 6 | 4142 | Odds Ratio (M‐H, Fixed, 95% CI) | 0.96 [0.74, 1.24] |
| 15.1 Fatigue | 2 | 236 | Odds Ratio (M‐H, Fixed, 95% CI) | 1.00 [0.46, 2.19] |
| 15.2 Pruritis | 1 | 347 | Odds Ratio (M‐H, Fixed, 95% CI) | 0.0 [0.0, 0.0] |
| 15.3 Fever | 4 | 1056 | Odds Ratio (M‐H, Fixed, 95% CI) | 1.01 [0.65, 1.55] |
| 15.4 Muscle ache/pain | 2 | 398 | Odds Ratio (M‐H, Fixed, 95% CI) | 0.66 [0.12, 3.55] |
| 15.5 Skin rash | 3 | 921 | Odds Ratio (M‐H, Fixed, 95% CI) | 1.51 [0.46, 5.01] |
| 15.6 Pallor | 2 | 704 | Odds Ratio (M‐H, Fixed, 95% CI) | 0.95 [0.59, 1.54] |
| 15.7 Weakness/asthenia | 2 | 480 | Odds Ratio (M‐H, Fixed, 95% CI) | 0.80 [0.43, 1.49] |
| 16 Other adverse effects (respiratory symptoms) Show forest plot | 5 | Odds Ratio (M‐H, Fixed, 95% CI) | Subtotals only | |
| 16.1 Cough | 2 | 488 | Odds Ratio (M‐H, Fixed, 95% CI) | 1.39 [0.77, 2.54] |
| 16.2 Runny nose | 1 | 47 | Odds Ratio (M‐H, Fixed, 95% CI) | 0.49 [0.07, 3.61] |
| 16.3 URTI/respiratory infection | 2 | 488 | Odds Ratio (M‐H, Fixed, 95% CI) | 2.57 [0.68, 9.72] |
| 16.4 Bronchitis | 1 | 351 | Odds Ratio (M‐H, Fixed, 95% CI) | 2.34 [0.50, 10.87] |
| 16.5 Rhinitis/rhinobronchitis | 2 | 398 | Odds Ratio (M‐H, Fixed, 95% CI) | 0.76 [0.10, 5.83] |
| 16.6 Shortness of breath | 1 | 47 | Odds Ratio (M‐H, Fixed, 95% CI) | 0.16 [0.01, 4.45] |
| 16.7 Otitis | 1 | 351 | Odds Ratio (M‐H, Fixed, 95% CI) | 2.36 [0.11, 50.02] |
| 16.8 Epistaxis | 1 | 351 | Odds Ratio (M‐H, Fixed, 95% CI) | 1.41 [0.06, 35.04] |
| 16.9 Pneumonia | 1 | 441 | Odds Ratio (M‐H, Fixed, 95% CI) | 0.32 [0.05, 2.24] |
| 16.10 Cold sores | 1 | 217 | Odds Ratio (M‐H, Fixed, 95% CI) | 1.33 [0.29, 6.10] |
| 16.11 Cyanosis | 1 | 263 | Odds Ratio (M‐H, Fixed, 95% CI) | 0.0 [0.0, 0.0] |
| 17 Other adverse effects (gastrointestinal symptoms) Show forest plot | 7 | Odds Ratio (M‐H, Fixed, 95% CI) | Subtotals only | |
| 17.1 Nausea | 5 | 1624 | Odds Ratio (M‐H, Fixed, 95% CI) | 1.20 [0.88, 1.64] |
| 17.2 Vomiting | 7 | 2459 | Odds Ratio (M‐H, Fixed, 95% CI) | 1.00 [0.65, 1.56] |
| 17.3 Abdominal pain | 7 | 2453 | Odds Ratio (M‐H, Fixed, 95% CI) | 1.14 [0.86, 1.51] |
| 17.4 Diarrhoea/dysentery/stooling | 7 | 2462 | Odds Ratio (M‐H, Fixed, 95% CI) | 0.74 [0.50, 1.10] |
| 17.5 Anorexia/loss of appetite | 3 | 1296 | Odds Ratio (M‐H, Fixed, 95% CI) | 0.66 [0.45, 0.95] |
| 18 Other adverse effects (Miscellaneous) Show forest plot | 5 | Risk Ratio (M‐H, Fixed, 95% CI) | Subtotals only | |
| 18.1 Back pain | 1 | 47 | Risk Ratio (M‐H, Fixed, 95% CI) | 0.28 [0.04, 2.05] |
| 18.2 Burning with urination | 1 | 47 | Risk Ratio (M‐H, Fixed, 95% CI) | 1.33 [0.06, 29.31] |
| 18.3 Pain with urination | 1 | 47 | Risk Ratio (M‐H, Fixed, 95% CI) | 1.33 [0.06, 29.31] |
| 18.4 Whitlow | 1 | 47 | Risk Ratio (M‐H, Fixed, 95% CI) | 1.33 [0.06, 29.31] |
| 18.5 Leg osteoarthritis | 1 | 47 | Risk Ratio (M‐H, Fixed, 95% CI) | 0.19 [0.01, 4.14] |
| 18.6 Uncomplicated malaria | 1 | 351 | Risk Ratio (M‐H, Fixed, 95% CI) | 0.69 [0.12, 4.04] |
| 18.7 Dental pain | 1 | 351 | Risk Ratio (M‐H, Fixed, 95% CI) | 0.15 [0.01, 3.67] |
| 18.8 High transaminase | 1 | 351 | Risk Ratio (M‐H, Fixed, 95% CI) | 0.15 [0.01, 3.67] |
| 18.9 Palpebral inflammation | 1 | 351 | Risk Ratio (M‐H, Fixed, 95% CI) | 0.15 [0.01, 3.67] |
| 18.10 Wound/trauma | 2 | 792 | Risk Ratio (M‐H, Fixed, 95% CI) | 0.35 [0.12, 0.97] |
| 18.11 Foot trauma | 1 | 351 | Risk Ratio (M‐H, Fixed, 95% CI) | 1.37 [0.06, 33.01] |
| 18.12 Foot inflammation | 1 | 351 | Risk Ratio (M‐H, Fixed, 95% CI) | 1.4 [0.06, 33.83] |
| 18.13 Skin infection | 1 | 441 | Risk Ratio (M‐H, Fixed, 95% CI) | 0.82 [0.30, 2.29] |
| 18.14 Palpitations | 1 | 808 | Risk Ratio (M‐H, Fixed, 95% CI) | 1.05 [0.80, 1.37] |
| 18.15 Unspecified | 2 | 655 | Risk Ratio (M‐H, Fixed, 95% CI) | 0.95 [0.46, 1.96] |
| Outcome or subgroup title | No. of studies | No. of participants | Statistical method | Effect size |
| 1 Participants infectious, day 3 to 4 Show forest plot | 3 | 116 | Risk Ratio (M‐H, Fixed, 95% CI) | 0.93 [0.06, 13.54] |
| 2 Participants with gametocytes (PCR), day 3 to 4 Show forest plot | 3 | 424 | Risk Ratio (M‐H, Fixed, 95% CI) | 0.93 [0.80, 1.09] |
| 3 Participants with gametocytes (microscopy), day 3 to 4 Show forest plot | 2 | 231 | Risk Ratio (M‐H, Fixed, 95% CI) | 1.23 [0.68, 2.20] |
| 4 Participants infectious, day 8 Show forest plot | 4 | 237 | Risk Ratio (M‐H, Fixed, 95% CI) | 0.95 [0.14, 6.48] |
| 5 Participants with gametocytes (PCR), day 8 Show forest plot | 4 | 559 | Risk Ratio (M‐H, Fixed, 95% CI) | 1.33 [0.97, 1.82] |
| 6 Participants with gametocytes (microscopy), day 8 Show forest plot | 2 | 235 | Risk Ratio (M‐H, Fixed, 95% CI) | 1.80 [0.51, 6.38] |
| Outcome or subgroup title | No. of studies | No. of participants | Statistical method | Effect size |
| 1 Participants infectious, day 5, by dose Show forest plot | 2 | Risk Ratio (M‐H, Fixed, 95% CI) | Subtotals only | |
| 1.1 0.75 mg/kg | 2 | 30 | Risk Ratio (M‐H, Fixed, 95% CI) | 0.09 [0.01, 0.62] |
| 2 Participants with gametocytes (microscopy), day 4 to 5, by dose Show forest plot | 3 | Risk Ratio (M‐H, Fixed, 95% CI) | Subtotals only | |
| 2.1 0.4 to 0.5 mg/kg | 1 | 221 | Risk Ratio (M‐H, Fixed, 95% CI) | 0.83 [0.62, 1.13] |
| 2.2 0.75 mg/kg | 2 | 52 | Risk Ratio (M‐H, Fixed, 95% CI) | 0.85 [0.48, 1.50] |
| 3 Participants infectious, day 8, by dose Show forest plot | 2 | Risk Ratio (M‐H, Fixed, 95% CI) | Subtotals only | |
| 3.1 0.75 mg/kg PQ | 2 | 30 | Risk Ratio (M‐H, Fixed, 95% CI) | 0.07 [0.01, 0.45] |
| 4 Participants with gametocytes (microscopy), day 8, by dose Show forest plot | 5 | Risk Ratio (M‐H, Fixed, 95% CI) | Subtotals only | |
| 4.1 0.4 to 0.5 mg/kg PQ | 1 | 216 | Risk Ratio (M‐H, Fixed, 95% CI) | 0.60 [0.49, 0.75] |
| 4.2 0.75 mg/kg PQ | 4 | 186 | Risk Ratio (M‐H, Fixed, 95% CI) | 0.39 [0.25, 0.62] |
| 5 Gametocyte clearance time Show forest plot | 1 | Mean Difference (IV, Fixed, 95% CI) | Totals not selected | |
| 6 Adverse effects Show forest plot | 1 | Risk Ratio (M‐H, Fixed, 95% CI) | Totals not selected | |
| 6.1 Nausea | 1 | Risk Ratio (M‐H, Fixed, 95% CI) | 0.0 [0.0, 0.0] | |
| 6.2 Vomiting | 1 | Risk Ratio (M‐H, Fixed, 95% CI) | 0.0 [0.0, 0.0] | |
| 6.3 Dizziness | 1 | Risk Ratio (M‐H, Fixed, 95% CI) | 0.0 [0.0, 0.0] | |
| 6.4 Any adverse effect | 1 | Risk Ratio (M‐H, Fixed, 95% CI) | 0.0 [0.0, 0.0] | |
| Outcome or subgroup title | No. of studies | No. of participants | Statistical method | Effect size |
| 1 Participants with gametocytes (microscopy), day 8 Show forest plot | 2 | 112 | Risk Ratio (M‐H, Fixed, 95% CI) | 0.41 [0.26, 0.66] |