| 1 Participants infectious, day 3 or 4, by dose Show forest plot | 4 | | Risk Ratio (M‐H, Fixed, 95% CI) | Subtotals only |
|
| 1.1 0.2 to 0.25 mg/kg | 3 | 105 | Risk Ratio (M‐H, Fixed, 95% CI) | 0.12 [0.02, 0.88] |
| 1.2 0.4 to 0.5 mg/kg | 3 | 109 | Risk Ratio (M‐H, Fixed, 95% CI) | 0.13 [0.02, 0.94] |
| 1.3 0.75 mg/kg | 1 | 101 | Risk Ratio (M‐H, Fixed, 95% CI) | 0.20 [0.02, 1.68] |
| 2 Participants with gametocytes (PCR), day 3 or 4, by dose Show forest plot | 4 | | Risk Ratio (M‐H, Fixed, 95% CI) | Subtotals only |
|
| 2.1 0.2 to 0.25 mg/kg | 3 | 414 | Risk Ratio (M‐H, Fixed, 95% CI) | 1.02 [0.87, 1.21] |
| 2.2 0.4 to 0.5 mg/kg | 3 | 418 | Risk Ratio (M‐H, Fixed, 95% CI) | 1.09 [0.93, 1.28] |
| 2.3 0.75 mg/kg | 2 | 394 | Risk Ratio (M‐H, Fixed, 95% CI) | 0.92 [0.75, 1.13] |
| 3 Participants with gametocytes (microscopy), day 3 or 4, by dose Show forest plot | 6 | | Risk Ratio (M‐H, Random, 95% CI) | Subtotals only |
|
| 3.1 0.2 to 0.25 mg/kg | 3 | 490 | Risk Ratio (M‐H, Random, 95% CI) | 0.73 [0.21, 2.50] |
| 3.2 0.4 to 0.5 mg/kg | 2 | 225 | Risk Ratio (M‐H, Random, 95% CI) | 0.86 [0.33, 2.25] |
| 3.3 0.75 mg/kg | 3 | 248 | Risk Ratio (M‐H, Random, 95% CI) | 0.42 [0.20, 0.85] |
| 4 Participants infectious, day 8, by dose Show forest plot | 5 | | Risk Ratio (M‐H, Fixed, 95% CI) | Subtotals only |
|
| 4.1 0.2 to 0.25 mg/kg | 4 | 243 | Risk Ratio (M‐H, Fixed, 95% CI) | 0.34 [0.07, 1.58] |
| 4.2 0.4 to 0.5 mg/kg | 4 | 246 | Risk Ratio (M‐H, Fixed, 95% CI) | 0.33 [0.07, 1.57] |
| 4.3 0.75 mg/kg | 2 | 181 | Risk Ratio (M‐H, Fixed, 95% CI) | 0.18 [0.02, 1.41] |
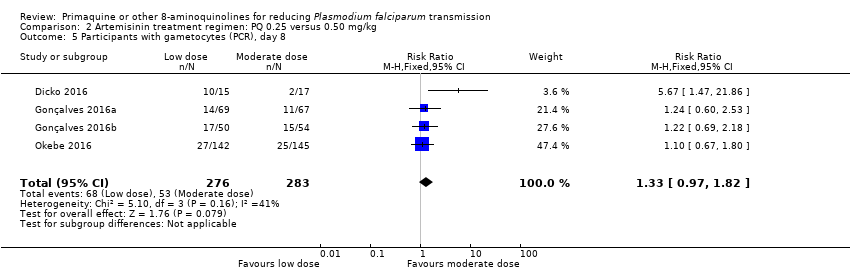
| 5 Participants with gametocytes (PCR), day 8, by dose Show forest plot | 8 | | Risk Ratio (M‐H, Fixed, 95% CI) | Subtotals only |
|
| 5.1 0.2 to 0.25 mg/kg PQ | 4 | 532 | Risk Ratio (M‐H, Fixed, 95% CI) | 0.52 [0.41, 0.65] |
| 5.2 0.4 to 0.5 mg/kg PQ | 5 | 758 | Risk Ratio (M‐H, Fixed, 95% CI) | 0.37 [0.29, 0.48] |
| 5.3 0.75 mg/kg PQ | 5 | 793 | Risk Ratio (M‐H, Fixed, 95% CI) | 0.31 [0.23, 0.43] |
| 6 Participants with gametocytes (microscopy), day 8, by dose Show forest plot | 9 | | Risk Ratio (M‐H, Fixed, 95% CI) | Subtotals only |
|
| 6.1 0.2 to 0.25 mg/kg | 3 | 491 | Risk Ratio (M‐H, Fixed, 95% CI) | 0.35 [0.16, 0.78] |
| 6.2 0.4 to 0.5 mg/kg | 2 | 225 | Risk Ratio (M‐H, Fixed, 95% CI) | 0.25 [0.08, 0.75] |
| 6.3 0.75 mg/kg | 6 | 1443 | Risk Ratio (M‐H, Fixed, 95% CI) | 0.27 [0.19, 0.37] |
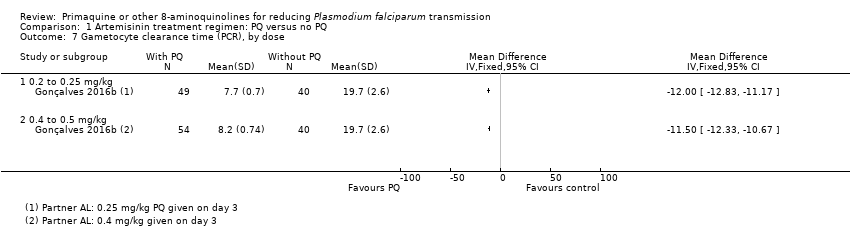
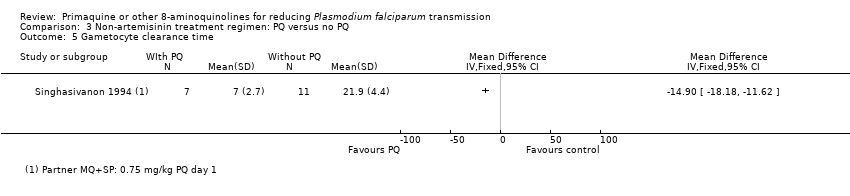
| 7 Gametocyte clearance time (PCR), by dose Show forest plot | 1 | | Mean Difference (IV, Fixed, 95% CI) | Totals not selected |
|
| 7.1 0.2 to 0.25 mg/kg | 1 | | Mean Difference (IV, Fixed, 95% CI) | 0.0 [0.0, 0.0] |
| 7.2 0.4 to 0.5 mg/kg | 1 | | Mean Difference (IV, Fixed, 95% CI) | 0.0 [0.0, 0.0] |
| 8 Area under curve of gametocytes (PCR), days 1 to 15, by dose Show forest plot | 1 | | Mean Difference (IV, Fixed, 95% CI) | Totals not selected |
|
| 8.1 0.2 to 0.25 mg/kg | 1 | | Mean Difference (IV, Fixed, 95% CI) | 0.0 [0.0, 0.0] |
| 8.2 0.4 to 0.5 mg/kg | 1 | | Mean Difference (IV, Fixed, 95% CI) | 0.0 [0.0, 0.0] |
| 9 Participants with severe haemolysis, by dose Show forest plot | 5 | | Risk Ratio (M‐H, Fixed, 95% CI) | Subtotals only |
|
| 9.1 0.2 to 0.25 mg/kg | 4 | 752 | Risk Ratio (M‐H, Fixed, 95% CI) | 0.98 [0.69, 1.39] |
| 9.2 0.4 to 0.5 mg/kg | 2 | 260 | Risk Ratio (M‐H, Fixed, 95% CI) | 1.54 [0.38, 6.30] |
| 9.3 0.75 mg/kg | 1 | 102 | Risk Ratio (M‐H, Fixed, 95% CI) | 0.0 [0.0, 0.0] |
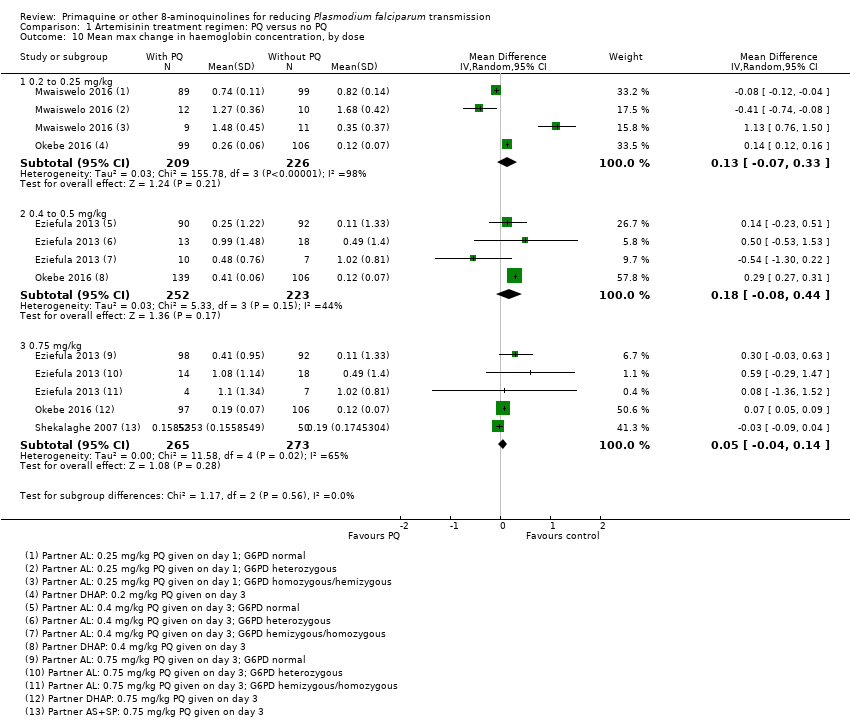
| 10 Mean max change in haemoglobin concentration, by dose Show forest plot | 4 | | Mean Difference (IV, Random, 95% CI) | Subtotals only |
|
| 10.1 0.2 to 0.25 mg/kg | 2 | 435 | Mean Difference (IV, Random, 95% CI) | 0.13 [‐0.07, 0.33] |
| 10.2 0.4 to 0.5 mg/kg | 2 | 475 | Mean Difference (IV, Random, 95% CI) | 0.18 [‐0.08, 0.44] |
| 10.3 0.75 mg/kg | 3 | 538 | Mean Difference (IV, Random, 95% CI) | 0.05 [‐0.04, 0.14] |
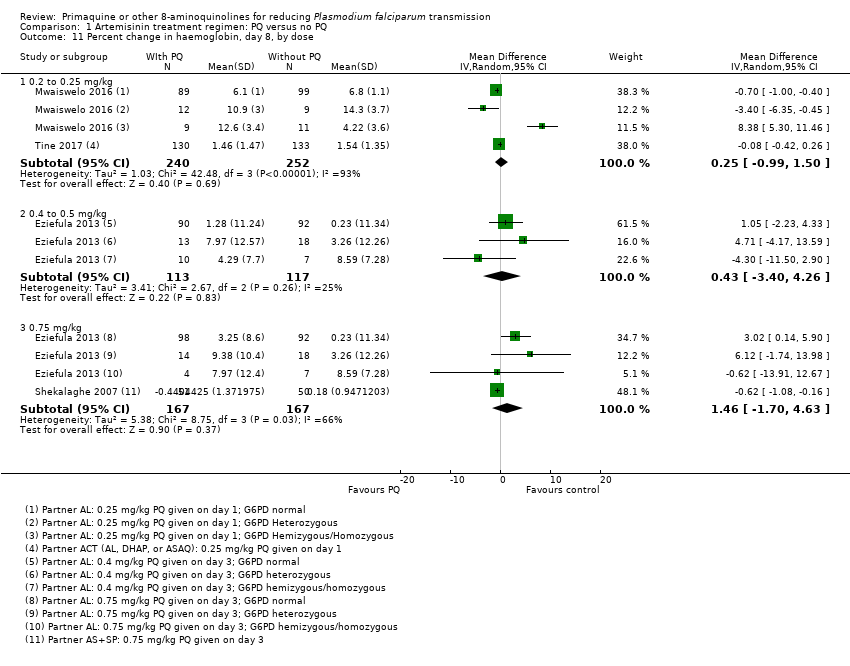
| 11 Percent change in haemoglobin, day 8, by dose Show forest plot | 4 | | Mean Difference (IV, Random, 95% CI) | Subtotals only |
|
| 11.1 0.2 to 0.25 mg/kg | 2 | 492 | Mean Difference (IV, Random, 95% CI) | 0.25 [‐0.99, 1.50] |
| 11.2 0.4 to 0.5 mg/kg | 1 | 230 | Mean Difference (IV, Random, 95% CI) | 0.43 [‐3.40, 4.26] |
| 11.3 0.75 mg/kg | 2 | 334 | Mean Difference (IV, Random, 95% CI) | 1.46 [‐1.70, 4.63] |
| 12 Max percent change in haemoglobin, by dose Show forest plot | 2 | | Mean Difference (IV, Fixed, 95% CI) | Totals not selected |
|
| 12.1 0.2 to 0.25 mg/kg | 1 | | Mean Difference (IV, Fixed, 95% CI) | 0.0 [0.0, 0.0] |
| 12.2 0.4 to 0.5 mg/kg | 1 | | Mean Difference (IV, Fixed, 95% CI) | 0.0 [0.0, 0.0] |
| 12.3 0.75 mg/kg | 1 | | Mean Difference (IV, Fixed, 95% CI) | 0.0 [0.0, 0.0] |
| 13 Haemoglobinuria/dark urine Show forest plot | 3 | 527 | Odds Ratio (M‐H, Fixed, 95% CI) | 3.40 [2.15, 5.38] |
|
| 14 Other adverse effects (CNS symptoms) Show forest plot | 6 | | Odds Ratio (M‐H, Fixed, 95% CI) | Subtotals only |
|
| 14.1 Headache | 5 | 1706 | Odds Ratio (M‐H, Fixed, 95% CI) | 0.95 [0.66, 1.36] |
| 14.2 Paresthesia | 1 | 331 | Odds Ratio (M‐H, Fixed, 95% CI) | 0.95 [0.13, 6.80] |
| 14.3 Dizziness | 4 | 1335 | Odds Ratio (M‐H, Fixed, 95% CI) | 0.95 [0.74, 1.23] |
| 14.4 Meningitis | 1 | 441 | Odds Ratio (M‐H, Fixed, 95% CI) | 0.08 [0.00, 2.13] |
| 14.5 Blurred vision | 1 | 217 | Odds Ratio (M‐H, Fixed, 95% CI) | 0.33 [0.01, 8.12] |
| 14.6 Insomnia | 1 | 808 | Odds Ratio (M‐H, Fixed, 95% CI) | 0.97 [0.64, 1.47] |
| 15 Other adverse effects (systemic) Show forest plot | 6 | 4142 | Odds Ratio (M‐H, Fixed, 95% CI) | 0.96 [0.74, 1.24] |
|
| 15.1 Fatigue | 2 | 236 | Odds Ratio (M‐H, Fixed, 95% CI) | 1.00 [0.46, 2.19] |
| 15.2 Pruritis | 1 | 347 | Odds Ratio (M‐H, Fixed, 95% CI) | 0.0 [0.0, 0.0] |
| 15.3 Fever | 4 | 1056 | Odds Ratio (M‐H, Fixed, 95% CI) | 1.01 [0.65, 1.55] |
| 15.4 Muscle ache/pain | 2 | 398 | Odds Ratio (M‐H, Fixed, 95% CI) | 0.66 [0.12, 3.55] |
| 15.5 Skin rash | 3 | 921 | Odds Ratio (M‐H, Fixed, 95% CI) | 1.51 [0.46, 5.01] |
| 15.6 Pallor | 2 | 704 | Odds Ratio (M‐H, Fixed, 95% CI) | 0.95 [0.59, 1.54] |
| 15.7 Weakness/asthenia | 2 | 480 | Odds Ratio (M‐H, Fixed, 95% CI) | 0.80 [0.43, 1.49] |
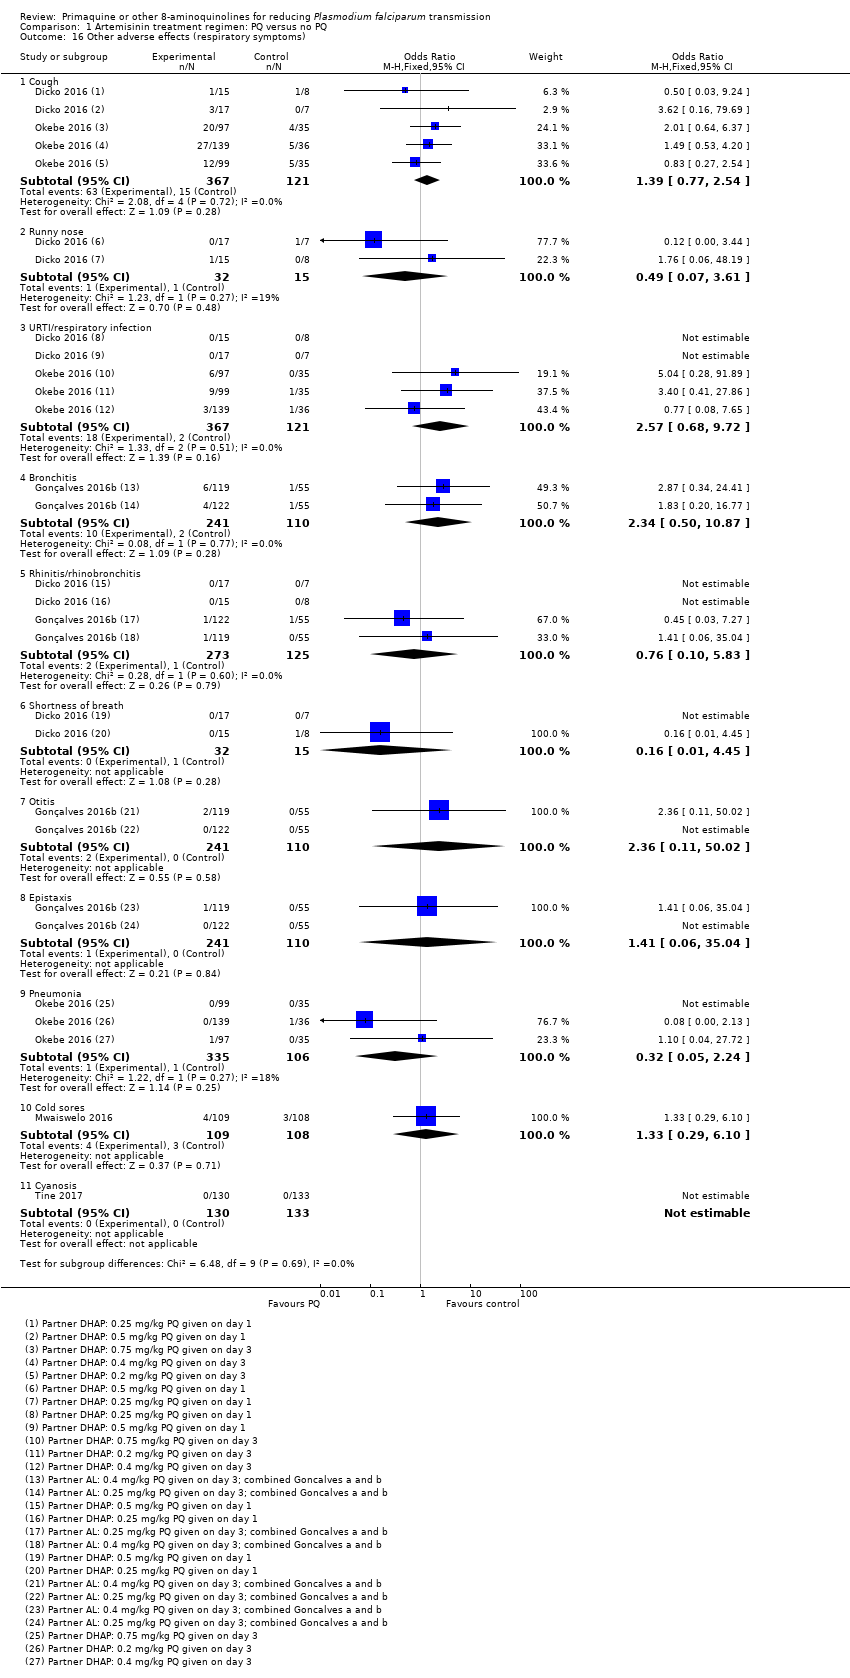
| 16 Other adverse effects (respiratory symptoms) Show forest plot | 5 | | Odds Ratio (M‐H, Fixed, 95% CI) | Subtotals only |
|
| 16.1 Cough | 2 | 488 | Odds Ratio (M‐H, Fixed, 95% CI) | 1.39 [0.77, 2.54] |
| 16.2 Runny nose | 1 | 47 | Odds Ratio (M‐H, Fixed, 95% CI) | 0.49 [0.07, 3.61] |
| 16.3 URTI/respiratory infection | 2 | 488 | Odds Ratio (M‐H, Fixed, 95% CI) | 2.57 [0.68, 9.72] |
| 16.4 Bronchitis | 1 | 351 | Odds Ratio (M‐H, Fixed, 95% CI) | 2.34 [0.50, 10.87] |
| 16.5 Rhinitis/rhinobronchitis | 2 | 398 | Odds Ratio (M‐H, Fixed, 95% CI) | 0.76 [0.10, 5.83] |
| 16.6 Shortness of breath | 1 | 47 | Odds Ratio (M‐H, Fixed, 95% CI) | 0.16 [0.01, 4.45] |
| 16.7 Otitis | 1 | 351 | Odds Ratio (M‐H, Fixed, 95% CI) | 2.36 [0.11, 50.02] |
| 16.8 Epistaxis | 1 | 351 | Odds Ratio (M‐H, Fixed, 95% CI) | 1.41 [0.06, 35.04] |
| 16.9 Pneumonia | 1 | 441 | Odds Ratio (M‐H, Fixed, 95% CI) | 0.32 [0.05, 2.24] |
| 16.10 Cold sores | 1 | 217 | Odds Ratio (M‐H, Fixed, 95% CI) | 1.33 [0.29, 6.10] |
| 16.11 Cyanosis | 1 | 263 | Odds Ratio (M‐H, Fixed, 95% CI) | 0.0 [0.0, 0.0] |
| 17 Other adverse effects (gastrointestinal symptoms) Show forest plot | 7 | | Odds Ratio (M‐H, Fixed, 95% CI) | Subtotals only |
|
| 17.1 Nausea | 5 | 1624 | Odds Ratio (M‐H, Fixed, 95% CI) | 1.20 [0.88, 1.64] |
| 17.2 Vomiting | 7 | 2459 | Odds Ratio (M‐H, Fixed, 95% CI) | 1.00 [0.65, 1.56] |
| 17.3 Abdominal pain | 7 | 2453 | Odds Ratio (M‐H, Fixed, 95% CI) | 1.14 [0.86, 1.51] |
| 17.4 Diarrhoea/dysentery/stooling | 7 | 2462 | Odds Ratio (M‐H, Fixed, 95% CI) | 0.74 [0.50, 1.10] |
| 17.5 Anorexia/loss of appetite | 3 | 1296 | Odds Ratio (M‐H, Fixed, 95% CI) | 0.66 [0.45, 0.95] |
| 18 Other adverse effects (Miscellaneous) Show forest plot | 5 | | Risk Ratio (M‐H, Fixed, 95% CI) | Subtotals only |
|
| 18.1 Back pain | 1 | 47 | Risk Ratio (M‐H, Fixed, 95% CI) | 0.28 [0.04, 2.05] |
| 18.2 Burning with urination | 1 | 47 | Risk Ratio (M‐H, Fixed, 95% CI) | 1.33 [0.06, 29.31] |
| 18.3 Pain with urination | 1 | 47 | Risk Ratio (M‐H, Fixed, 95% CI) | 1.33 [0.06, 29.31] |
| 18.4 Whitlow | 1 | 47 | Risk Ratio (M‐H, Fixed, 95% CI) | 1.33 [0.06, 29.31] |
| 18.5 Leg osteoarthritis | 1 | 47 | Risk Ratio (M‐H, Fixed, 95% CI) | 0.19 [0.01, 4.14] |
| 18.6 Uncomplicated malaria | 1 | 351 | Risk Ratio (M‐H, Fixed, 95% CI) | 0.69 [0.12, 4.04] |
| 18.7 Dental pain | 1 | 351 | Risk Ratio (M‐H, Fixed, 95% CI) | 0.15 [0.01, 3.67] |
| 18.8 High transaminase | 1 | 351 | Risk Ratio (M‐H, Fixed, 95% CI) | 0.15 [0.01, 3.67] |
| 18.9 Palpebral inflammation | 1 | 351 | Risk Ratio (M‐H, Fixed, 95% CI) | 0.15 [0.01, 3.67] |
| 18.10 Wound/trauma | 2 | 792 | Risk Ratio (M‐H, Fixed, 95% CI) | 0.35 [0.12, 0.97] |
| 18.11 Foot trauma | 1 | 351 | Risk Ratio (M‐H, Fixed, 95% CI) | 1.37 [0.06, 33.01] |
| 18.12 Foot inflammation | 1 | 351 | Risk Ratio (M‐H, Fixed, 95% CI) | 1.4 [0.06, 33.83] |
| 18.13 Skin infection | 1 | 441 | Risk Ratio (M‐H, Fixed, 95% CI) | 0.82 [0.30, 2.29] |
| 18.14 Palpitations | 1 | 808 | Risk Ratio (M‐H, Fixed, 95% CI) | 1.05 [0.80, 1.37] |
| 18.15 Unspecified | 2 | 655 | Risk Ratio (M‐H, Fixed, 95% CI) | 0.95 [0.46, 1.96] |