| 1 Total UPDRS score change Show forest plot | 3 | 330 | Mean Difference (IV, Fixed, 95% CI) | 0.49 [‐0.64, 1.63] |
|
| 1.1 300‐400mg/d VS Placebo | 2 | 80 | Mean Difference (IV, Fixed, 95% CI) | 0.83 [‐0.97, 2.63] |
| 1.2 600mg/d VS Placebo | 1 | 50 | Mean Difference (IV, Fixed, 95% CI) | 0.60 [‐3.10, 4.31] |
| 1.3 1200mg/d VS Placebo | 1 | 58 | Mean Difference (IV, Fixed, 95% CI) | ‐0.25 [‐2.18, 1.67] |
| 1.4 2400mg/d VS Placebo | 1 | 142 | Mean Difference (IV, Fixed, 95% CI) | 1.21 [‐1.64, 4.06] |
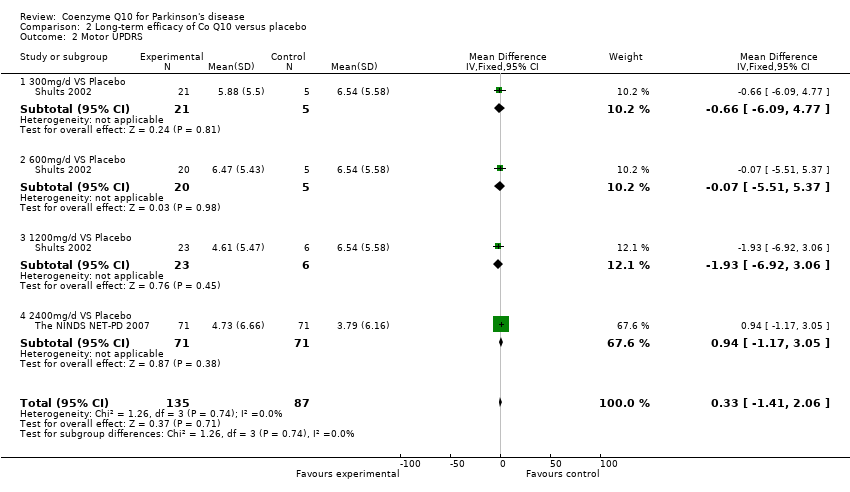
| 2 Motor UPDRS Show forest plot | 3 | 330 | Mean Difference (IV, Fixed, 95% CI) | ‐0.07 [‐0.71, 0.58] |
|
| 2.1 300‐400mg/d VS Placebo | 2 | 80 | Mean Difference (IV, Fixed, 95% CI) | ‐0.27 [‐0.99, 0.45] |
| 2.2 600mg/d VS Placebo | 1 | 50 | Mean Difference (IV, Fixed, 95% CI) | 0.89 [‐2.02, 3.81] |
| 2.3 1200mg/d VS Placebo | 1 | 58 | Mean Difference (IV, Fixed, 95% CI) | 0.37 [‐2.31, 3.04] |
| 2.4 2400mg/d VS Placebo | 1 | 142 | Mean Difference (IV, Fixed, 95% CI) | 0.94 [‐1.17, 3.05] |
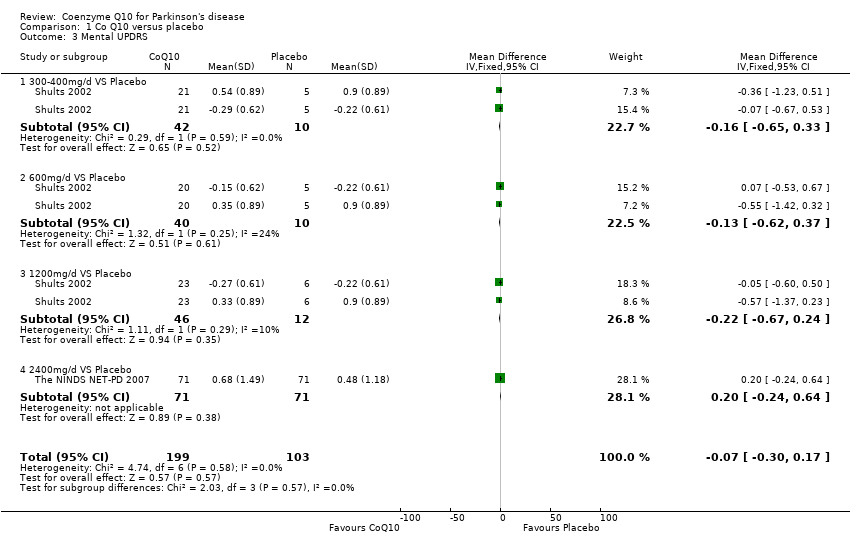
| 3 Mental UPDRS Show forest plot | 2 | 302 | Mean Difference (IV, Fixed, 95% CI) | ‐0.07 [‐0.30, 0.17] |
|
| 3.1 300‐400mg/d VS Placebo | 1 | 52 | Mean Difference (IV, Fixed, 95% CI) | ‐0.16 [‐0.65, 0.33] |
| 3.2 600mg/d VS Placebo | 1 | 50 | Mean Difference (IV, Fixed, 95% CI) | ‐0.13 [‐0.62, 0.37] |
| 3.3 1200mg/d VS Placebo | 1 | 58 | Mean Difference (IV, Fixed, 95% CI) | ‐0.22 [‐0.67, 0.24] |
| 3.4 2400mg/d VS Placebo | 1 | 142 | Mean Difference (IV, Fixed, 95% CI) | 0.20 [‐0.24, 0.64] |
| 4 ADL UPDRS Show forest plot | 2 | 302 | Mean Difference (IV, Fixed, 95% CI) | ‐0.52 [‐1.15, 0.11] |
|
| 4.1 300‐400mg/d VS Placebo | 1 | 52 | Mean Difference (IV, Fixed, 95% CI) | ‐0.83 [‐2.31, 0.64] |
| 4.2 600mg/d VS Placebo | 1 | 50 | Mean Difference (IV, Fixed, 95% CI) | ‐0.29 [‐1.77, 1.19] |
| 4.3 1200mg/d VS Placebo | 1 | 58 | Mean Difference (IV, Fixed, 95% CI) | ‐1.65 [‐3.01, ‐0.29] |
| 4.4 2400mg/d VS Placebo | 1 | 142 | Mean Difference (IV, Fixed, 95% CI) | 0.11 [‐0.87, 1.09] |
| 5 Hoehn & Yahr Show forest plot | 2 | 302 | Mean Difference (IV, Fixed, 95% CI) | 0.05 [‐0.05, 0.15] |
|
| 5.1 300‐400mg/d VS Placebo | 1 | 52 | Mean Difference (IV, Fixed, 95% CI) | 0.08 [‐0.11, 0.28] |
| 5.2 600mg/d VS Placebo | 1 | 50 | Mean Difference (IV, Fixed, 95% CI) | 0.05 [‐0.15, 0.25] |
| 5.3 1200mg/d VS Placebo | 1 | 58 | Mean Difference (IV, Fixed, 95% CI) | 0.06 [‐0.12, 0.24] |
| 5.4 2400mg/d VS Placebo | 1 | 142 | Mean Difference (IV, Fixed, 95% CI) | 0.01 [‐0.20, 0.22] |
| 6 Schwab & England (investigator) Show forest plot | 2 | 302 | Mean Difference (IV, Fixed, 95% CI) | 0.30 [‐0.79, 1.39] |
|
| 6.1 300‐400mg/d VS Placebo | 1 | 52 | Mean Difference (IV, Fixed, 95% CI) | 0.27 [‐1.87, 2.41] |
| 6.2 600mg/d VS Placebo | 1 | 50 | Mean Difference (IV, Fixed, 95% CI) | ‐0.13 [‐2.28, 2.01] |
| 6.3 1200mg/d VS Placebo | 1 | 58 | Mean Difference (IV, Fixed, 95% CI) | 1.22 [‐0.75, 3.19] |
| 6.4 2400mg/d VS Placebo | 1 | 142 | Mean Difference (IV, Fixed, 95% CI) | ‐0.60 [‐3.20, 2.00] |
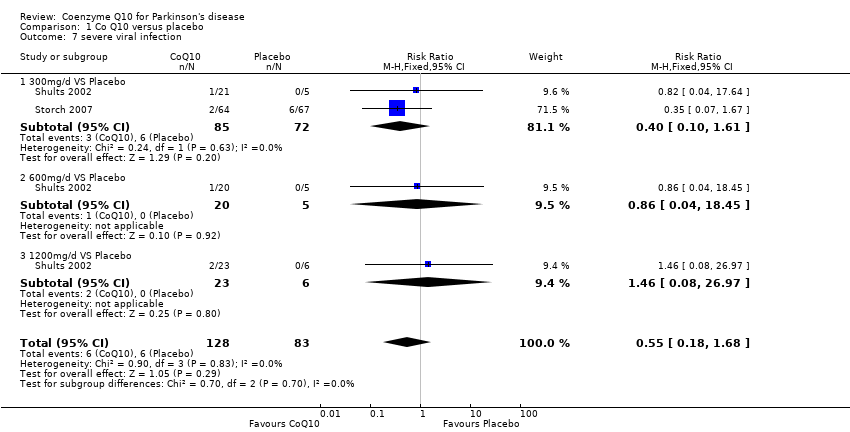
| 7 severe viral infection Show forest plot | 2 | 211 | Risk Ratio (M‐H, Fixed, 95% CI) | 0.55 [0.18, 1.68] |
|
| 7.1 300mg/d VS Placebo | 2 | 157 | Risk Ratio (M‐H, Fixed, 95% CI) | 0.40 [0.10, 1.61] |
| 7.2 600mg/d VS Placebo | 1 | 25 | Risk Ratio (M‐H, Fixed, 95% CI) | 0.86 [0.04, 18.45] |
| 7.3 1200mg/d VS Placebo | 1 | 29 | Risk Ratio (M‐H, Fixed, 95% CI) | 1.46 [0.08, 26.97] |
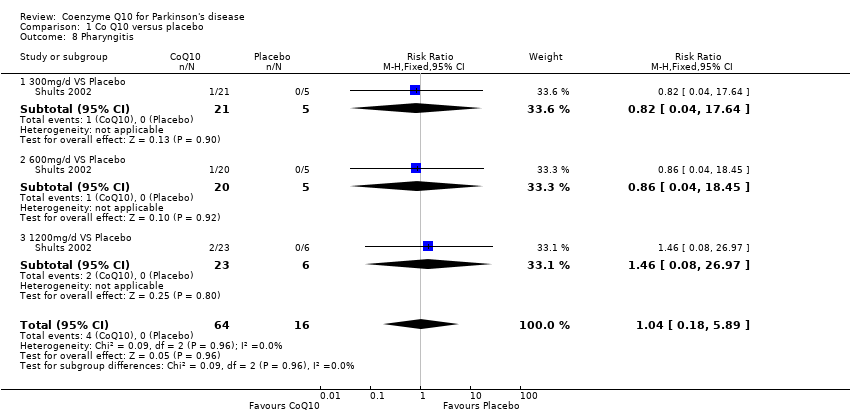
| 8 Pharyngitis Show forest plot | 1 | 80 | Risk Ratio (M‐H, Fixed, 95% CI) | 1.04 [0.18, 5.89] |
|
| 8.1 300mg/d VS Placebo | 1 | 26 | Risk Ratio (M‐H, Fixed, 95% CI) | 0.82 [0.04, 17.64] |
| 8.2 600mg/d VS Placebo | 1 | 25 | Risk Ratio (M‐H, Fixed, 95% CI) | 0.86 [0.04, 18.45] |
| 8.3 1200mg/d VS Placebo | 1 | 29 | Risk Ratio (M‐H, Fixed, 95% CI) | 1.46 [0.08, 26.97] |
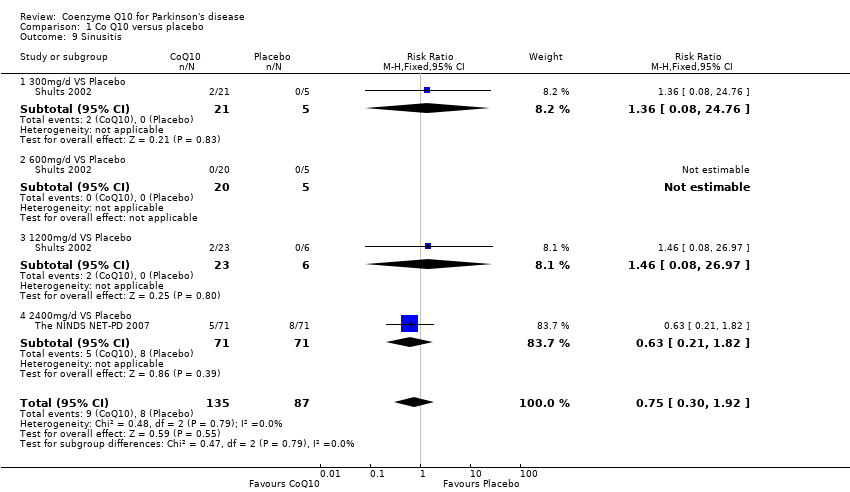
| 9 Sinusitis Show forest plot | 2 | 222 | Risk Ratio (M‐H, Fixed, 95% CI) | 0.75 [0.30, 1.92] |
|
| 9.1 300mg/d VS Placebo | 1 | 26 | Risk Ratio (M‐H, Fixed, 95% CI) | 1.36 [0.08, 24.76] |
| 9.2 600mg/d VS Placebo | 1 | 25 | Risk Ratio (M‐H, Fixed, 95% CI) | 0.0 [0.0, 0.0] |
| 9.3 1200mg/d VS Placebo | 1 | 29 | Risk Ratio (M‐H, Fixed, 95% CI) | 1.46 [0.08, 26.97] |
| 9.4 2400mg/d VS Placebo | 1 | 142 | Risk Ratio (M‐H, Fixed, 95% CI) | 0.63 [0.21, 1.82] |
| 10 Flatulence Show forest plot | 1 | 80 | Risk Ratio (M‐H, Fixed, 95% CI) | 0.26 [0.06, 1.04] |
|
| 10.1 300mg/d VS Placebo | 1 | 26 | Risk Ratio (M‐H, Fixed, 95% CI) | 0.09 [0.00, 1.96] |
| 10.2 600mg/d VS Placebo | 1 | 25 | Risk Ratio (M‐H, Fixed, 95% CI) | 0.5 [0.06, 4.47] |
| 10.3 1200mg/d VS Placebo | 1 | 29 | Risk Ratio (M‐H, Fixed, 95% CI) | 0.26 [0.02, 3.59] |
| 11 Back pain Show forest plot | 2 | 222 | Risk Ratio (M‐H, Fixed, 95% CI) | 1.00 [0.43, 2.35] |
|
| 11.1 300mg/d VS Placebo | 1 | 26 | Risk Ratio (M‐H, Fixed, 95% CI) | 0.48 [0.05, 4.27] |
| 11.2 600mg/d VS Placebo | 1 | 25 | Risk Ratio (M‐H, Fixed, 95% CI) | 0.25 [0.02, 3.34] |
| 11.3 1200mg/d VS Placebo | 1 | 29 | Risk Ratio (M‐H, Fixed, 95% CI) | 1.04 [0.14, 7.70] |
| 11.4 2400mg/d VS Placebo | 1 | 142 | Risk Ratio (M‐H, Fixed, 95% CI) | 1.5 [0.44, 5.09] |
| 12 Coughing Show forest plot | 2 | 222 | Risk Ratio (M‐H, Fixed, 95% CI) | 0.53 [0.21, 1.36] |
|
| 12.1 300mg/d VS Placebo | 1 | 26 | Risk Ratio (M‐H, Fixed, 95% CI) | 0.24 [0.02, 3.19] |
| 12.2 600mg/d VS Placebo | 1 | 25 | Risk Ratio (M‐H, Fixed, 95% CI) | 0.25 [0.02, 3.34] |
| 12.3 1200mg/d VS Placebo | 1 | 29 | Risk Ratio (M‐H, Fixed, 95% CI) | 0.26 [0.02, 3.59] |
| 12.4 2400mg/d VS Placebo | 1 | 142 | Risk Ratio (M‐H, Fixed, 95% CI) | 0.8 [0.22, 2.86] |
| 13 Diarrhea Show forest plot | 3 | 353 | Risk Ratio (M‐H, Fixed, 95% CI) | 1.39 [0.62, 3.16] |
|
| 13.1 300mg/d VS Placebo | 2 | 157 | Risk Ratio (M‐H, Fixed, 95% CI) | 3.51 [0.68, 18.19] |
| 13.2 600mg/d VS Placebo | 1 | 25 | Risk Ratio (M‐H, Fixed, 95% CI) | 0.86 [0.04, 18.45] |
| 13.3 1200mg/d VS Placebo | 1 | 29 | Risk Ratio (M‐H, Fixed, 95% CI) | 1.46 [0.08, 26.97] |
| 13.4 2400mg/d VS Placebo | 1 | 142 | Risk Ratio (M‐H, Fixed, 95% CI) | 0.83 [0.27, 2.61] |
| 14 Fall Show forest plot | 2 | 222 | Risk Ratio (M‐H, Fixed, 95% CI) | 0.55 [0.22, 1.35] |
|
| 14.1 300mg/d VS Placebo | 1 | 26 | Risk Ratio (M‐H, Fixed, 95% CI) | 0.71 [0.09, 5.51] |
| 14.2 600mg/d VS Placebo | 1 | 25 | Risk Ratio (M‐H, Fixed, 95% CI) | 0.10 [0.00, 2.05] |
| 14.3 1200mg/d VS Placebo | 1 | 29 | Risk Ratio (M‐H, Fixed, 95% CI) | 0.26 [0.02, 3.59] |
| 14.4 2400mg/d VS Placebo | 1 | 142 | Risk Ratio (M‐H, Fixed, 95% CI) | 0.8 [0.22, 2.86] |
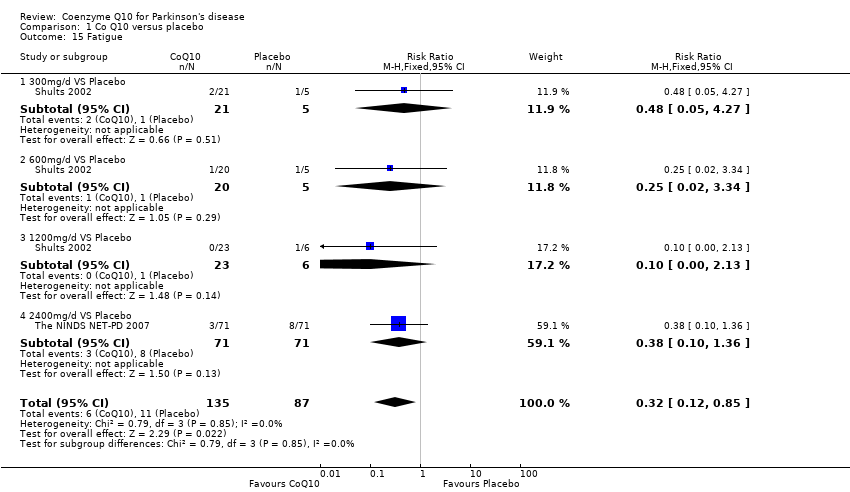
| 15 Fatigue Show forest plot | 2 | 222 | Risk Ratio (M‐H, Fixed, 95% CI) | 0.32 [0.12, 0.85] |
|
| 15.1 300mg/d VS Placebo | 1 | 26 | Risk Ratio (M‐H, Fixed, 95% CI) | 0.48 [0.05, 4.27] |
| 15.2 600mg/d VS Placebo | 1 | 25 | Risk Ratio (M‐H, Fixed, 95% CI) | 0.25 [0.02, 3.34] |
| 15.3 1200mg/d VS Placebo | 1 | 29 | Risk Ratio (M‐H, Fixed, 95% CI) | 0.10 [0.00, 2.13] |
| 15.4 2400mg/d VS Placebo | 1 | 142 | Risk Ratio (M‐H, Fixed, 95% CI) | 0.38 [0.10, 1.36] |
| 16 Hypercholesterolemia Show forest plot | 2 | 223 | Risk Ratio (M‐H, Fixed, 95% CI) | 0.14 [0.04, 0.44] |
|
| 16.1 300mg/d VS Placebo | 1 | 26 | Risk Ratio (M‐H, Fixed, 95% CI) | 0.12 [0.01, 1.07] |
| 16.2 600mg/d VS Placebo | 1 | 26 | Risk Ratio (M‐H, Fixed, 95% CI) | 0.05 [0.00, 0.99] |
| 16.3 1200mg/d VS Placebo | 1 | 29 | Risk Ratio (M‐H, Fixed, 95% CI) | 0.13 [0.01, 1.21] |
| 16.4 2400mg/d VS Placebo | 1 | 142 | Risk Ratio (M‐H, Fixed, 95% CI) | 0.25 [0.03, 2.18] |
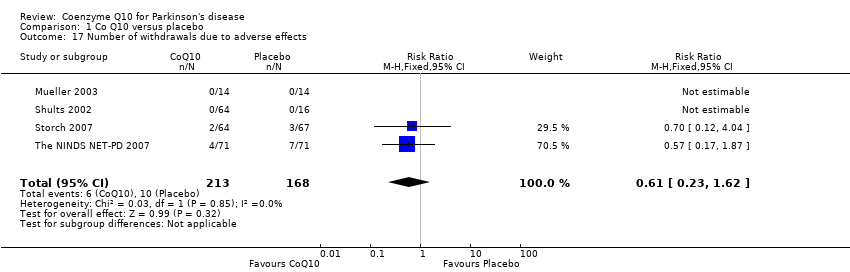
| 17 Number of withdrawals due to adverse effects Show forest plot | 4 | 381 | Risk Ratio (M‐H, Fixed, 95% CI) | 0.61 [0.23, 1.62] |
|