| 1 No clinically important response (as defined by original study) Show forest plot | 2 | 371 | Odds Ratio (M‐H, Random, 95% CI) | 0.57 [0.36, 0.89] |
|
| 2 Remission ‐ number of participants without remission ‐ as defined by the original study Show forest plot | 2 | 371 | Odds Ratio (M‐H, Fixed, 95% CI) | 0.39 [0.22, 0.69] |
|
| 3 Relapse (as defined by the original study) Show forest plot | 1 | 243 | Odds Ratio (M‐H, Random, 95% CI) | 0.95 [0.57, 1.57] |
|
| 4 Mental state: 1a. Depressive symptoms ‐ MADRS score at endpoint Show forest plot | 2 | 264 | Mean Difference (IV, Random, 95% CI) | ‐1.85 [‐9.17, 5.47] |
|
| 4.1 short‐term | 1 | 23 | Mean Difference (IV, Random, 95% CI) | ‐7.11 [‐16.50, 2.28] |
| 4.2 medium‐term | 1 | 241 | Mean Difference (IV, Random, 95% CI) | 0.80 [‐2.21, 3.81] |
| 5 Mental state: 1b. Depressive symptoms ‐ no clinically important change ‐ HAM‐D Show forest plot | 2 | 371 | Odds Ratio (M‐H, Random, 95% CI) | 0.60 [0.38, 0.95] |
|
| 6 Mental state: 1c. Depressive symptoms ‐ HAM‐D score at endpoint Show forest plot | 2 | 509 | Mean Difference (IV, Random, 95% CI) | ‐1.69 [‐4.13, 0.74] |
|
| 6.1 short‐term | 1 | 268 | Mean Difference (IV, Random, 95% CI) | ‐2.80 [‐4.14, ‐1.46] |
| 6.2 medium‐term | 1 | 241 | Mean Difference (IV, Random, 95% CI) | ‐0.30 [‐2.43, 1.83] |
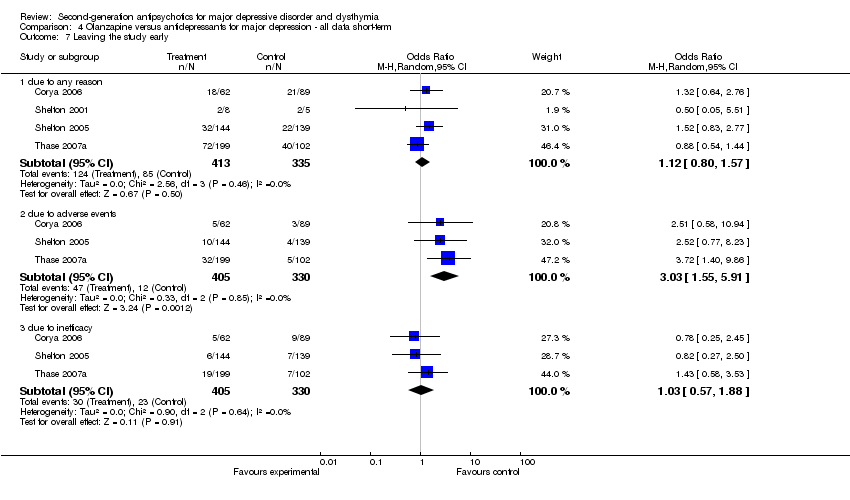
| 7 Leaving the study early Show forest plot | 4 | | Odds Ratio (M‐H, Random, 95% CI) | Subtotals only |
|
| 7.1 due to any reason | 4 | 637 | Odds Ratio (M‐H, Random, 95% CI) | 1.04 [0.59, 1.83] |
| 7.2 due to adverse events | 2 | 517 | Odds Ratio (M‐H, Random, 95% CI) | 2.11 [0.79, 5.68] |
| 7.3 due to inefficacy | 2 | 517 | Odds Ratio (M‐H, Random, 95% CI) | 0.95 [0.59, 1.51] |
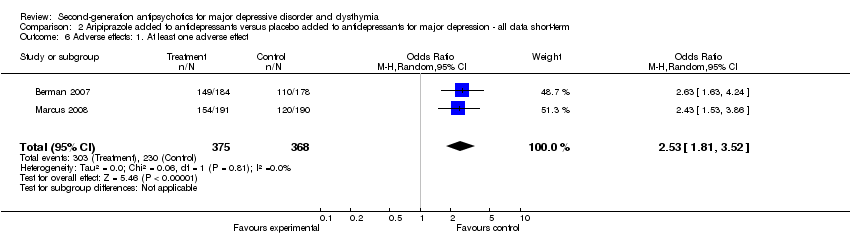
| 8 Adverse effects: 1. At least one adverse effect Show forest plot | 2 | 371 | Odds Ratio (M‐H, Random, 95% CI) | 0.75 [0.48, 1.16] |
|
| 9 Adverse effects: 2a. Extrapyramidal effects ‐ tremor Show forest plot | 2 | | Odds Ratio (M‐H, Random, 95% CI) | Subtotals only |
|
| 9.1 EPS general ‐ medium‐term | 1 | 243 | Odds Ratio (M‐H, Random, 95% CI) | 1.98 [0.36, 11.04] |
| 9.2 akathisia ‐ short‐term | 1 | 274 | Odds Ratio (M‐H, Random, 95% CI) | 2.85 [0.12, 70.59] |
| 9.3 dystonia ‐ short‐term | 1 | 274 | Odds Ratio (M‐H, Random, 95% CI) | 0.31 [0.01, 7.73] |
| 9.4 tremor ‐ short‐term | 1 | 274 | Odds Ratio (M‐H, Random, 95% CI) | 0.94 [0.06, 15.23] |
| 9.5 use of antiparkinson medication ‐ short‐term | 1 | 274 | Odds Ratio (M‐H, Random, 95% CI) | 0.0 [0.0, 0.0] |
| 10 Adverse effects: 3a. Prolactin increase ‐ associated effects Show forest plot | 1 | 243 | Odds Ratio (M‐H, Random, 95% CI) | 7.0 [0.36, 136.98] |
|
| 11 Adverse effects: 3b. Prolactin ‐ change from baseline in ng/ml ‐ endpoint Show forest plot | 2 | 256 | Mean Difference (IV, Random, 95% CI) | 29.42 [19.49, 39.34] |
|
| 11.1 short‐term | 1 | 15 | Mean Difference (IV, Random, 95% CI) | 40.42 [‐2.67, 83.51] |
| 11.2 medium‐term | 1 | 241 | Mean Difference (IV, Random, 95% CI) | 28.8 [18.60, 39.00] |
| 12 Adverse effects: 4a. Significant weight gain Show forest plot | 3 | | Odds Ratio (M‐H, Random, 95% CI) | Subtotals only |
|
| 12.1 ≥ 7% weight gain from baseline | 2 | 340 | Odds Ratio (M‐H, Random, 95% CI) | 3.32 [0.99, 11.12] |
| 12.2 spontaneously reported | 2 | 371 | Odds Ratio (M‐H, Random, 95% CI) | 2.12 [0.55, 8.16] |
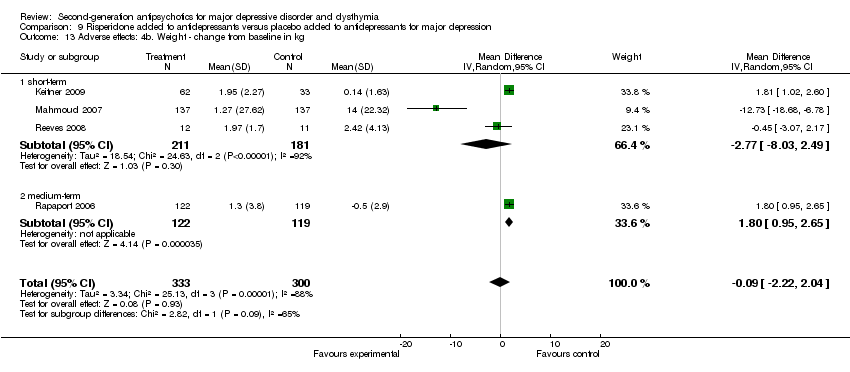
| 13 Adverse effects: 4b. Weight ‐ change from baseline in kg Show forest plot | 4 | 633 | Mean Difference (IV, Random, 95% CI) | ‐0.09 [‐2.22, 2.04] |
|
| 13.1 short‐term | 3 | 392 | Mean Difference (IV, Random, 95% CI) | ‐2.77 [‐8.03, 2.49] |
| 13.2 medium‐term | 1 | 241 | Mean Difference (IV, Random, 95% CI) | 1.80 [0.95, 2.65] |
| 14 Adverse effects: 5. Sedation Show forest plot | 4 | 637 | Odds Ratio (M‐H, Random, 95% CI) | 1.10 [0.31, 3.99] |
|
| 14.1 short‐term | 3 | 394 | Odds Ratio (M‐H, Random, 95% CI) | 1.21 [0.17, 8.46] |
| 14.2 medium‐term | 1 | 243 | Odds Ratio (M‐H, Random, 95% CI) | 0.73 [0.16, 3.31] |