Fármacos antipsicóticos de segunda generación para el trastorno depresivo mayor y la distimia
Referencias
References to studies included in this review
References to studies excluded from this review
References to studies awaiting assessment
References to ongoing studies
NCT00517387. Ongoing studySeptember 2007.
NCT00683852. Ongoing studyJuly 2008.
NCT00520507. Ongoing studyOctober 2007.
NCT00273624. Ongoing studyJune 2005.
NCT00555997. Ongoing studyMarch 2008.
NCT00633399. Ongoing studyJuly 2008.
NCT00675896. Ongoing studyApril 2007.
NCT00253266. Ongoing studyApril 2008.
NCT00657592. Ongoing studyMarch 2008.
NCT00688818. Ongoing studyJune 2008.
Additional references
Characteristics of studies
Characteristics of included studies [ordered by study ID]
| Methods | Allocation: random, no further details. | |
| Participants | Diagnosis: dysthymia (DSM IV) ± major depressive episode (double depression), HAM‐D of at least 12, HAM‐D‐item depression of at least 2. | |
| Interventions | 1. Amisulpride: fixed dose (allowed dose range: 50 mg/day, mean dose: not reported) N = 157. | |
| Outcomes | Global state: CGI. Unable to use ‐ | |
| Notes | — | |
| Risk of bias | ||
| Bias | Authors' judgement | Support for judgement |
| Random sequence generation (selection bias) | Unclear risk | Random, no further details. |
| Allocation concealment (selection bias) | Unclear risk | No further details. |
| Blinding (performance bias and detection bias) | Unclear risk | Double, no further details. Whether blinding has been successful has not been tested. |
| Blinding (performance bias and detection bias) | Low risk | Objective outcomes such as laboratory measures or death are unlikely to have been much affected by problems of blinding. |
| Incomplete outcome data (attrition bias) | Unclear risk | Analysis was based on last observation carried forward (LOCF). Attrition: amisulpride: 11.5%, sertraline: 17.3%. The attrition is considered as moderate. Data on leaving the study early due to inefficacy of treatment were not fully addressed. |
| Selective reporting (reporting bias) | High risk | Data on secondary outcomes were incomplete. |
| Other bias | Unclear risk | The study was sponsored by the manufacturers of amisulpride. |
| Methods | Allocation: random, no further details. | |
| Participants | Diagnosis: single episode or recurrent major depressive disorder (DSM‐IV), treatment‐resistant, HAM‐D of at least 20, HAM‐D‐item 1 of at least 2. N = 491. | |
| Interventions | 1. Quetiapine: fixed dose (allowed dose range: 150 or 300 mg/day, mean dose: not reported) N = 330 | |
| Outcomes | Global State: CGI. Unable to use ‐ | |
| Notes | — | |
| Risk of bias | ||
| Bias | Authors' judgement | Support for judgement |
| Random sequence generation (selection bias) | Unclear risk | Random, no further details. |
| Allocation concealment (selection bias) | Unclear risk | No further details. |
| Blinding (performance bias and detection bias) | Unclear risk | Double, double‐dummy. Whether blinding has been successful has not been tested |
| Blinding (performance bias and detection bias) | Low risk | Objective outcomes such as laboratory measures or death are unlikely to have been much affected by problems of blinding |
| Incomplete outcome data (attrition bias) | High risk | Analysis based on last observation carried forward (LOCF). Only attrition data due to adverse events were reported. |
| Selective reporting (reporting bias) | High risk | Adverse events had to occur in more than 5% to be reported. Statistics reporting was incomplete (e.g. SDs). |
| Other bias | Unclear risk | The study was sponsored by the manufacturers of quetiapine. |
| Methods | Allocation: random, permuted block design stratified by site (block size of 4). | |
| Participants | Diagnosis: major depressive disorder (DSM IV), treatment‐resistant, HAM‐D of at least 14, CGI‐I of at least 3, < 50% reduction in HAM‐D during prospective treatment phase. N = 362. | |
| Interventions | 1. Aripiprazole: flexible dose (allowed dose range:2 to 15/20 mg/day (start dose 5 mg/d, could be weekly increased by 5 mg/day to max.15 mg/day (augmentation: fluoxetine, paroxetine) or 20 mg/day (other augmentations); if unable to tolerate, could be decreased to 2 mg/day; no increase in last week), mean dose: 11.8mg/day) N = 184. | |
| Outcomes | Global state: CGI. Unable to use ‐ | |
| Notes | — | |
| Risk of bias | ||
| Bias | Authors' judgement | Support for judgement |
| Random sequence generation (selection bias) | Unclear risk | Random, permuted block design with 4 blocks. |
| Allocation concealment (selection bias) | Unclear risk | No further details. |
| Blinding (performance bias and detection bias) | Unclear risk | Double, no further details. Whether blinding has been successful has not been tested. |
| Blinding (performance bias and detection bias) | Low risk | Objective outcomes such as laboratory measures or death are unlikely to have been much affected by problems of blinding. |
| Incomplete outcome data (attrition bias) | Low risk | Analysis based on the last observation carried forward (LOCF). Attrition aripiprazole: 13%. |
| Selective reporting (reporting bias) | High risk | Adverse events had to occur in at least 5% to be reported. Statistics reporting was incomplete (e.g. SDs). |
| Other bias | Unclear risk | The study was sponsored by the manufacturers of aripiprazole. |
| Methods | Allocation: random, no further details. | |
| Participants | Diagnosis: major depressive episode (DSM‐IV), treatment‐resistant ( = ?50% reduction in HAM‐D 17 total score from baseline to end of prospective treatment phase, a HAM‐D total score of at least 14, CGI‐I of at least 3 at week 6 and 8) | |
| Interventions | 1. Drug A: aripiprazole added on: various antidepressants 2. Drug B: placebo added on: various antidepressants. | |
| Outcomes | Global state: CGI. Unable to use: | |
| Notes | — | |
| Risk of bias | ||
| Bias | Authors' judgement | Support for judgement |
| Random sequence generation (selection bias) | Unclear risk | Random, no further details. |
| Allocation concealment (selection bias) | Unclear risk | No further details. |
| Blinding (performance bias and detection bias) | Unclear risk | Double, no further details. Whether blinding has been successful has not been tested. |
| Blinding (performance bias and detection bias) | Low risk | Objective outcomes such as laboratory measures or death are unlikely to have been much affected by problems of blinding. |
| Incomplete outcome data (attrition bias) | Unclear risk | Analysis based on the last observation carried forward (LOCF). Attrition aripiprazole: 17%. |
| Selective reporting (reporting bias) | High risk | Adverse events had to occur in at least 5% to be reported. Only median value on prolactin data. Statistics reporting was incomplete (e.g. SDs). |
| Other bias | Unclear risk | The study was sponsored by the manufacturers of aripiprazole. |
| Methods | Allocation: random, no further details. | |
| Participants | Diagnosis: (DSM‐III‐R) primary dysthymia or dysthymia with major depressive episode of mild severity, MADRS < 21. N = 319. | |
| Interventions | 1. Amisulpride: fixed dose (allowed dose range: 50 mg/day, mean dose: not reported). N = 104. | |
| Outcomes | Global state: CGI. Unable to use: | |
| Notes | There was an additional amineptine group | |
| Risk of bias | ||
| Bias | Authors' judgement | Support for judgement |
| Random sequence generation (selection bias) | Unclear risk | Random, no further details. |
| Allocation concealment (selection bias) | Unclear risk | No further details |
| Blinding (performance bias and detection bias) | Unclear risk | Double, no further details |
| Blinding (performance bias and detection bias) | Low risk | Objective outcomes such as laboratory measures or death are unlikely to have been much affected by problems of blinding |
| Incomplete outcome data (attrition bias) | Unclear risk | The analysis was based on the LOCF method |
| Selective reporting (reporting bias) | High risk | Primary outcomes were not fully addressed. Additional diazepam treatment was allowed, but data on this were not provided. Statistics reporting was incomplete (e.g. SDs). |
| Other bias | Unclear risk | Quote: "A limitation to this study is that a detailed history specifying the coexistence of major depression was not documented". The study was sponsored by the manufacturers of amisulpride. |
| Methods | Allocation: random , no further details | |
| Participants | Diagnosis: major depressive disorder (DSM IV), HAM‐D of at least 18, resistant to at least 2 antidepressants. N = 277. | |
| Interventions | 1. Amisulpride: fixed dose (allowed dose range: 50 mg/day, mean dose: not reported). N = 138 | |
| Outcomes | Global state: CGI | |
| Notes | — | |
| Risk of bias | ||
| Bias | Authors' judgement | Support for judgement |
| Random sequence generation (selection bias) | Unclear risk | Random, no further details |
| Allocation concealment (selection bias) | Unclear risk | No further details |
| Blinding (performance bias and detection bias) | Unclear risk | Double, no further details. Whether blinding has been successful has not been tested |
| Blinding (performance bias and detection bias) | Low risk | Objective outcomes such as laboratory measures or death are unlikely to have been much affected by problems of blinding |
| Incomplete outcome data (attrition bias) | Low risk | Analysis based on last observation carried forward (LOCF). Attrition: amisulpride: 14% |
| Selective reporting (reporting bias) | Unclear risk | Adverse effects were not fully addressed for both groups |
| Other bias | Unclear risk | The study was sponsored by the manufacturers of amisulpride |
| Methods | Allocation: random, no further details | |
| Participants | Diagnosis: major depressive disorder (DSM IV), episode without psychotic features, CGI‐S of at least 4, response failure to SSRI after at least 6 weeks of treatment. N = 483 | |
| Interventions | 1. Olanzapine: fixed dose (allowed dose range: 6 or 12 mg/day, mean dose: 7.9 mg/day). N = 62. | |
| Outcomes | Mental state: Y‐BOCS, MADRS, CGI‐Depression, HAM‐A, Brief Psychiatric Rating Scale Unable to use ‐ | |
| Notes | — | |
| Risk of bias | ||
| Bias | Authors' judgement | Support for judgement |
| Random sequence generation (selection bias) | Unclear risk | Random, no further details |
| Allocation concealment (selection bias) | Unclear risk | No further details |
| Blinding (performance bias and detection bias) | Unclear risk | Double, QUOTE: "to maintain blindness at the completion of the lead‐in phase, all subjects appeared to taper off venlafaxine all single treatment regimen groups also took a second placebo pill to preserve the blind. Whether blinding has been successful has not been tested". |
| Blinding (performance bias and detection bias) | Low risk | Objective outcomes such as laboratory measures or death are unlikely to have been much affected by problems of blinding |
| Incomplete outcome data (attrition bias) | Unclear risk | Analysis based on last observation carried forward (LOCF) and mixed‐effect models repeated measures (MMRM) |
| Selective reporting (reporting bias) | High risk | Predefined secondary outcomes were not fully addressed CGI. Treatment adverse events had to occur in at least 10% to be reported. Statistics reporting was incomplete (e.g. SDs). |
| Other bias | Unclear risk | One group (venlafaxine) stayed on previous treatment. The study was sponsored by the manufacturers of olanzapine. |
| Methods | Allocation: random, no further details | |
| Participants | Diagnosis: primary dysthymia (DSM‐III‐R / ICD‐9) | |
| Interventions | 1. Amisulpride: fixed dose (allowed dose range: 50 mg/day, mean dose: not reported). N = 20 | |
| Outcomes | Mental state: HAM‐D, SANS | |
| Notes | — | |
| Risk of bias | ||
| Bias | Authors' judgement | Support for judgement |
| Random sequence generation (selection bias) | Unclear risk | Random, no further details |
| Allocation concealment (selection bias) | Unclear risk | No further details |
| Blinding (performance bias and detection bias) | Unclear risk | Double, no further details. Whether blinding has been successful has not been tested. |
| Blinding (performance bias and detection bias) | Low risk | Objective outcomes such as laboratory measures or death are unlikely to have been much affected by problems of blinding |
| Incomplete outcome data (attrition bias) | Low risk | One person left the study early, details on this were not reported but due to small number the risk of bias may be considered as low |
| Selective reporting (reporting bias) | High risk | Data on secondary outcomes were incomplete. Statistics reporting was incomplete (e.g. SDs). |
| Other bias | Unclear risk | Data on funding has not been provided |
| Methods | Allocation: random, computer‐generated | |
| Participants | Diagnosis: single episode or recurrent major depressive disorder (DSM‐IV), HAM‐D of at least 20, HAM‐D‐item 1 of at least 2. | |
| Interventions | 1. Quetiapine: fixed dose (allowed dose range: 150 or 300 mg/day, mean dose: 124.7 mg/day and 244.8 mg/day). N = 304 | |
| Outcomes | Global state: CGI | |
| Notes | — | |
| Risk of bias | ||
| Bias | Authors' judgement | Support for judgement |
| Random sequence generation (selection bias) | Low risk | Random, computer‐generated |
| Allocation concealment (selection bias) | Unclear risk | No further details |
| Blinding (performance bias and detection bias) | Unclear risk | Double, identical capsules. Whether blinding has been successful has not been tested |
| Blinding (performance bias and detection bias) | Low risk | Objective outcomes such as laboratory measures or death are unlikely to have been much affected by problems of blinding |
| Incomplete outcome data (attrition bias) | High risk | Analysis based on last observation carried forward (LOCF). Data on leaving the study early were rather high 28%. |
| Selective reporting (reporting bias) | High risk | Adverse events had to occur in more than 5% to be reported. Statistics reporting was incomplete (e.g. SDs). |
| Other bias | Unclear risk | The study was sponsored by the manufacturers of quetiapine |
| Methods | Allocation: random, no further details | |
| Participants | Diagnosis: single episode or recurrent major depressive disorder (DSM‐IV), HAM‐D of at least 20, HAM‐D‐item 1 of at least 2, MADRS equal or less than 12, CGI‐S equal or less than 3, preceding open‐label phase. N = 776 | |
| Interventions | 1. Quetiapine: flexible dose (allowed dose range: 50, 150 or 300 mg/day, mean dose: 177.1 mg/day). N = 391 | |
| Outcomes | Mental state: MADRS, HAM‐A Unable to use ‐ | |
| Notes | — | |
| Risk of bias | ||
| Bias | Authors' judgement | Support for judgement |
| Random sequence generation (selection bias) | Unclear risk | Random, no further details |
| Allocation concealment (selection bias) | Unclear risk | No further details |
| Blinding (performance bias and detection bias) | Unclear risk | Double, no further details. Whether blinding has been successful has not been tested |
| Blinding (performance bias and detection bias) | Low risk | Objective outcomes such as laboratory measures or death are unlikely to have been much affected by problems of blinding |
| Incomplete outcome data (attrition bias) | High risk | Data on leaving the study early are only reported due to adverse events. Group membership of 11 patients remained unclear |
| Selective reporting (reporting bias) | High risk | Adverse events had to occur in more than 5% to be reported |
| Other bias | Unclear risk | The study was a time to event study. The study was sponsored by the manufacturers of quetiapine. |
| Methods | Allocation: random, no further details | |
| Participants | Diagnosis: single episode or recurrent major depressive disorder (DSM‐IV), HAM‐D of at least 20, HAM‐D‐item 1 of at least 2. N = 310 | |
| Interventions | 1. Quetiapine: fixed dose (allowed dose range: 150 to 300 mg/day (with an inadequate response at week 2 the dose was adjusted to 300 mg/day for the last 6 weeks), mean dose: not reported). N = 154. | |
| Outcomes | Global state: CGI Unable to use: | |
| Notes | — | |
| Risk of bias | ||
| Bias | Authors' judgement | Support for judgement |
| Random sequence generation (selection bias) | Unclear risk | Random, no further details |
| Allocation concealment (selection bias) | Unclear risk | No further details |
| Blinding (performance bias and detection bias) | Unclear risk | Double, no further details. Whether blinding has been successful has not been tested |
| Blinding (performance bias and detection bias) | Low risk | Objective outcomes such as laboratory measures or death are unlikely to have been much affected by problems of blinding |
| Incomplete outcome data (attrition bias) | High risk | Analysis based on last observation carried forward (LOCF). Data on leaving the study early due to any reason are not provided. |
| Selective reporting (reporting bias) | High risk | Adverse events had to occur in more than 5% to be reported |
| Other bias | Unclear risk | The study was sponsored by the manufacturers of quetiapine |
| Methods | Allocation: random, no further details | |
| Participants | Diagnosis: single episode or recurrent major depressive disorder (DSM‐IV), treatment‐resistant, HAM‐D of at least 20, HAM‐D‐item 1 of at least 2. N = 446 | |
| Interventions | 1. Quetiapine: fixed dose (allowed dose range: 150 or 300 mg/day, mean dose: not reported). N = 298 | |
| Outcomes | Global state: CGI Unable to use: | |
| Notes | — | |
| Risk of bias | ||
| Bias | Authors' judgement | Support for judgement |
| Random sequence generation (selection bias) | Unclear risk | Random, no further details |
| Allocation concealment (selection bias) | Unclear risk | No further details |
| Blinding (performance bias and detection bias) | Unclear risk | Double, no further details. Whether blinding has been successful has not been tested |
| Blinding (performance bias and detection bias) | Low risk | Objective outcomes such as laboratory measures or death are unlikely to have been much affected by problems of blinding |
| Incomplete outcome data (attrition bias) | High risk | Analysis based on last observation carried forward (LOCF). Data on number of people leaving the study early for any reason have not been indicated. |
| Selective reporting (reporting bias) | High risk | Adverse events had to occur in more than 5% to be reported. Statistics reporting was incomplete (e.g. SDs). |
| Other bias | Unclear risk | The study was sponsored by the manufacturers of quetiapine |
| Methods | Allocation: random, no further details | |
| Participants | Diagnosis: unipolar major depression (DSM:IV), resistant to antidepressants for 5 weeks, MADRS of at least 15. N = 97 | |
| Interventions | 1. Risperidone: flexible dose (allowed dose range: 0.5 to 3 mg/d (start dose 0.5 mg/day) mean dose: 1.6 mg/day). N = 64 | |
| Outcomes | Global state: CGI Unable to use ‐ | |
| Notes | — | |
| Risk of bias | ||
| Bias | Authors' judgement | Support for judgement |
| Random sequence generation (selection bias) | Unclear risk | Random, no further details |
| Allocation concealment (selection bias) | Unclear risk | No further details |
| Blinding (performance bias and detection bias) | Unclear risk | Trained blinded research raters. Whether blinding has been successful has not been tested. |
| Blinding (performance bias and detection bias) | Low risk | Objective outcomes such as laboratory measures or death are unlikely to have been much affected by problems of blinding |
| Incomplete outcome data (attrition bias) | Unclear risk | Analysis based on last observation carried forward method. Attrition: risperidone:12.5% |
| Selective reporting (reporting bias) | High risk | Additional benztropine was permitted but data on usage was not presented |
| Other bias | Unclear risk | The study was sponsored by the manufacturers of risperidone |
| Methods | Allocation: random, stratified by centre for diagnosis of major depression | |
| Participants | Setting: outpatient. | |
| Interventions | 1. Amisulpride: fixed dose (allowed dose range: 50 mg/day, mean dose: not reported). N = 73. | |
| Outcomes | Global state: CGI Unable to use: | |
| Notes | — | |
| Risk of bias | ||
| Bias | Authors' judgement | Support for judgement |
| Random sequence generation (selection bias) | Unclear risk | Random, stratified by centre for diagnosis of major depression |
| Allocation concealment (selection bias) | Unclear risk | No further details |
| Blinding (performance bias and detection bias) | Unclear risk | Double, identical capsules. Whether blinding has been successful has not been tested. |
| Blinding (performance bias and detection bias) | Low risk | Objective outcomes such as laboratory measures or death are unlikely to have been much affected by problems of blinding |
| Incomplete outcome data (attrition bias) | High risk | Efficacy data described for per protocol population. Attrition: amisulpride: 41%, imipramine: 48%, placebo: 49%. |
| Selective reporting (reporting bias) | High risk | Reporting on secondary outcomes was incomplete. Statistics reporting was incomplete (e.g. SDs). |
| Other bias | Unclear risk | QUOTE: "Secondly the inclusion of ineligible patients and some major deviations from the protocol were rather frequent; although the bias related to this factor cannot be evaluated" |
| Methods | Allocation/allocation concealment: random, code centrally generated and administered by a telephone interactive voice response system, was stratified by antidepressant class (SSRI or non‐SSRI) and centre, and occurred in random permuted blocks. An independent statistician provided the randomisation codes. | |
| Participants | Diagnosis: unremitting major depressive disorder (DSM‐IV) single or recurrent episode, CGI‐S ? 4, Carroll Depression Scale (40) ? 20, treatment‐resistant to antidepressants | |
| Interventions | 1. Risperidone | |
| Outcomes | Global state: CGI Unable to use ‐ | |
| Notes | — | |
| Risk of bias | ||
| Bias | Authors' judgement | Support for judgement |
| Random sequence generation (selection bias) | Unclear risk | Random, no further details |
| Allocation concealment (selection bias) | Low risk | Code centrally generated and administered by a telephone interactive voice response system, was stratified by antidepressant class (SSRI or non‐SSRI) and centre, and occurred in random permuted blocks. An independent statistician provided the randomisation codes. |
| Blinding (performance bias and detection bias) | Unclear risk | Double, identical capsules. Whether blinding was successful has not been tested. |
| Blinding (performance bias and detection bias) | Low risk | Objective outcomes such as laboratory measures or death are unlikely to have been much affected by problems of blinding |
| Incomplete outcome data (attrition bias) | Unclear risk | The analysis is based on last observation carried forward method (LOCF) and mixed‐model repeated measures analysis. Attrition rate: risperidone: 21.3%, placebo: 13.5%. The overall attrition is considered to be moderate. |
| Selective reporting (reporting bias) | High risk | No data about use of sedative agents available. Some primary outcomes are missing (CGI‐I). Statistics reporting was incomplete (e.g. SDs). |
| Other bias | Unclear risk | The study was sponsored by the manufacturers of risperidone |
| Methods | Allocation: random, no further details | |
| Participants | Diagnosis: major depressive episode (DSM:IV) for at least 8 weeks, inadequate response to previous antidepressant treatment, non‐responders during prospective treatment phase. N = 381 | |
| Interventions | 1. Aripiprazole: flexible dose (allowed dose range: 2 to 20 mg/day (start dose: 5 mg/d) (max.: 15 mg/d if added on fluoxetine or paroxetine) mean dose: 11.0 mg/day). N = 191 | |
| Outcomes | Global state: CGI Unable to use ‐ | |
| Notes | ||
| Risk of bias | ||
| Bias | Authors' judgement | Support for judgement |
| Random sequence generation (selection bias) | Unclear risk | Random, no further details |
| Allocation concealment (selection bias) | Unclear risk | No further details |
| Blinding (performance bias and detection bias) | Unclear risk | Double, no further details |
| Blinding (performance bias and detection bias) | Low risk | Objective outcomes such as laboratory measures or death are unlikely to have been much affected by problems of blindness |
| Incomplete outcome data (attrition bias) | Unclear risk | Analysis was based on last observation carried forward (LOCF). Attrition: aripiprazole = 15% |
| Selective reporting (reporting bias) | High risk | Data on CGI were not reported. Adverse events had to occur in at least 5% of patient population to be reported. Statistics reporting was incomplete (e.g. SDs). |
| Other bias | Unclear risk | The study was sponsored by the manufacturers of aripiprazole |
| Methods | Allocation: random, no further details | |
| Participants | Diagnosis: major depressive disorder (DSM:IV), HAM‐D of at least 18, CGI‐S of at least 4, 14‐item HAM‐A of at least 14, comorbid anxiety disorders and residual depressive symptoms | |
| Interventions | 1. Quetiapine: flexible dose (1st week: 50 mg/day; 2nd week: 100 mg/day; 3rd week: 200 mg/day; then at the investigator's discretion, allowed dose range: 200 to 600 mg/day, mean dose: 182 mg/day). N = 29. | |
| Outcomes | Global state: CGI | |
| Notes | — | |
| Risk of bias | ||
| Bias | Authors' judgement | Support for judgement |
| Random sequence generation (selection bias) | Unclear risk | Random, no further details |
| Allocation concealment (selection bias) | Unclear risk | No further details |
| Blinding (performance bias and detection bias) | Unclear risk | Double, no further details. Whether blinding has been successful has not been tested. |
| Blinding (performance bias and detection bias) | Low risk | Objective outcomes such as laboratory measures or death are unlikely to have been much affected by problems of blinding |
| Incomplete outcome data (attrition bias) | High risk | Analysis was based on last observation carried forward (LOCF) |
| Selective reporting (reporting bias) | High risk | Reporting on statistics (SDs) was incomplete |
| Other bias | High risk | Baseline imbalances (in terms of venlafaxine mean dose in quetiapine group (278.6 mg/d) and placebo group (356.3 mg/d) and the mean body weight was 7 kg higher in the placebo group than in quetiapine group). Patients who did not tolerate 200 mg/d were withdrawn from the study. The study was sponsored by the manufacturers of quetiapine. |
| Methods | Allocation: random, generated by a statistician independent of the study, non‐centralised and stratified by site, age and presence of psychotic features/automated interactive voice response system | |
| Participants | Diagnosis: major depressive disorder (DSM IV), 17‐HAM‐D ≤ 7 or CGI‐S less or equal to 2, 1‐3 antidepressant treatment failures. N = 243 | |
| Interventions | 1. Risperidone: flexible dose (allowed dose range: 0.25 to 2 mg/day, mean dose: 1.2 mg/day). N=123 | |
| Outcomes | Global state: CGI, relapse Unable to use ‐ | |
| Notes | — | |
| Risk of bias | ||
| Bias | Authors' judgement | Support for judgement |
| Random sequence generation (selection bias) | Low risk | Randomised, generated by a statistician independent of the study, non‐centralised and stratified by site, age and presence of psychotic features, probably yes |
| Allocation concealment (selection bias) | Low risk | Usage of an automated interactive voice response system |
| Blinding (performance bias and detection bias) | Unclear risk | Double, no further details |
| Blinding (performance bias and detection bias) | Low risk | Objective outcomes such as laboratory measures or death are unlikely to have been much affected by problems of blindness |
| Incomplete outcome data (attrition bias) | High risk | The analysis was based on last observation carried forward (LOCF), which might not deal with a high rate of subjects leaving the study early of 65% |
| Selective reporting (reporting bias) | High risk | The reporting is incomplete. QUOTE: "other scales assessing anxiety, quality of life, sexual functioning, resource utilization, and cognition were also administered. Their results will be presented elsewhere". |
| Other bias | Unclear risk | The study was sponsored by the manufacturers of risperidone |
| Methods | Allocation: random, no further details | |
| Participants | Diagnosis: dysthymia (DSM‐III‐R) or single episode of major depression with partial remission, MADRS 14‐26 (primary dysthymia: amisulpride: 162, amitriptyline: 85). N = 253 | |
| Interventions | 1. Amisulpride: fixed dose (allowed dose range: 50 mg/day, mean dose: 50 mg/day). N = 166 | |
| Outcomes | Global state: CGI | |
| Notes | — | |
| Risk of bias | ||
| Bias | Authors' judgement | Support for judgement |
| Random sequence generation (selection bias) | Unclear risk | Random, no further details |
| Allocation concealment (selection bias) | Unclear risk | No further details |
| Blinding (performance bias and detection bias) | Unclear risk | Double, identical capsules. Whether blinding has been successful has not been tested. |
| Blinding (performance bias and detection bias) | Low risk | Objective outcomes such as laboratory measures or death are unlikely to have been much affected by problems of blinding |
| Incomplete outcome data (attrition bias) | High risk | Analysis was based on last observation carried forward (LOCF), but the attrition rate was rather high. Attrition: amisulpride: 44%. Attrition: amitriptyline: 47%. |
| Selective reporting (reporting bias) | Unclear risk | Secondary outcomes have not been fully addressed |
| Other bias | Unclear risk | Data on funding were not provided |
| Methods | Allocation: random, no further details | |
| Participants | Diagnosis: major depressive disorder (DSM‐IV), current depressive episode with suicidality, treatment resistant, MADRS of at least 25 and suicidal subscore of at least 4. N = 23 | |
| Interventions | 1. Risperidone: flexible dose (allowed dose range: 0.25 to 2 mg/day (start dose 0.5 mg/day), mean dose: 1.17 mg/day). N = 12 | |
| Outcomes | Global state: CGI Unable to use ‐ | |
| Notes | — | |
| Risk of bias | ||
| Bias | Authors' judgement | Support for judgement |
| Random sequence generation (selection bias) | Unclear risk | Random, no further details |
| Allocation concealment (selection bias) | Unclear risk | No further details |
| Blinding (performance bias and detection bias) | Unclear risk | Double, no further details. Whether blinding has been successful has not been tested. |
| Blinding (performance bias and detection bias) | Low risk | Objective outcomes such as laboratory measures or death are unlikely to have been much affected by problems of blinding |
| Incomplete outcome data (attrition bias) | Unclear risk | Analysis was based on the last observation carried forward (LOCF) |
| Selective reporting (reporting bias) | High risk | Reporting on EPS data was incomplete. Statistics reporting was incomplete (e.g. SDs). |
| Other bias | Unclear risk | QUOTE: "gender distribution between treatment groups was uneven". The study was sponsored by the manufacturers of risperidone. |
| Methods | Allocation: random, no further details | |
| Participants | Diagnosis: major depression with psychotic features MDpsy (DSM IV), HAM‐D‐24 of at least 20. N = 124 | |
| Interventions | 1. Olanzapine: flexible dose (allowed dose range: 5 to 20 mg/day (start dose: 10 mg/day, dose‐steps of 5 mg/day), mean dose: 11.9 mg/day). N = 48 | |
| Outcomes | Global state: CGI Unable to use ‐ | |
| Notes | — | |
| Risk of bias | ||
| Bias | Authors' judgement | Support for judgement |
| Random sequence generation (selection bias) | Unclear risk | Random, no further details |
| Allocation concealment (selection bias) | Unclear risk | No further details |
| Blinding (performance bias and detection bias) | Unclear risk | Double, no further details. Whether blinding has been successful has not been tested. |
| Blinding (performance bias and detection bias) | Low risk | Objective outcomes such as laboratory measures or death are unlikely to have been much affected by problems of blinding |
| Incomplete outcome data (attrition bias) | High risk | Analysis based on last observation carried forward (LOCF) and mixed‐effects model repeated measures (MMRM) |
| Selective reporting (reporting bias) | High risk | Only pooled data on secondary outcomes. Statistics reporting was incomplete (e.g. SDs). |
| Other bias | Unclear risk | The study was sponsored by the manufacturers of olanzapine |
| Methods | Allocation: random, no further details | |
| Participants | Diagnosis: major depression with psychotic features MDpsy (DSM IV), HAM‐D‐24 of at least 20. N = 125 | |
| Interventions | 1. Olanzapine: flexible dose (allowed dose range: 5 to 20 mg/day (start dose: 10 mg/day, dose‐steps of 5 mg/day), mean dose: 14.0 mg/day). N = 53 | |
| Outcomes | Global state: CGI Unable to use ‐ | |
| Notes | — | |
| Risk of bias | ||
| Bias | Authors' judgement | Support for judgement |
| Random sequence generation (selection bias) | Unclear risk | Random, no further details |
| Allocation concealment (selection bias) | Unclear risk | No further details |
| Blinding (performance bias and detection bias) | Unclear risk | Double, no further details. Whether blinding has been successful has not been tested. |
| Blinding (performance bias and detection bias) | Low risk | Objective outcomes such as laboratory measures or death are unlikely to have been much affected by problems of blinding |
| Incomplete outcome data (attrition bias) | High risk | Analysis based on last observation carried forward (LOCF) and mixed‐effects model repeated measures (MMRM). Attrition: olanzapine: 53%, OFC: 39%. Attrition: placebo: 59%. The attrition was rather high. |
| Selective reporting (reporting bias) | High risk | Reporting on secondary outcomes such as EPS was incomplete. Statistics reporting was incomplete (e.g. SDs). |
| Other bias | Unclear risk | The study was sponsored by the manufacturers of olanzapine |
| Methods | Allocation: random, no further details | |
| Participants | Diagnosis: recurrent major depressive disorder (DSM:IV), HAM‐D‐21 of at least 20, treatment‐resistant without psychotic features. N = 28 | |
| Interventions | 1. Olanzapine: flexible dose (allowed dose range: 5 to 20 mg/day (initial does: 5 mg/day), mean dose: 12.5 mg/day). N = 8. | |
| Outcomes | Global state: CGI Unable to use ‐ | |
| Notes | — | |
| Risk of bias | ||
| Bias | Authors' judgement | Support for judgement |
| Random sequence generation (selection bias) | Unclear risk | Random, no further details |
| Allocation concealment (selection bias) | Unclear risk | No further details |
| Blinding (performance bias and detection bias) | Unclear risk | Double, no further details. Whether blinding has been successful has not been tested. |
| Blinding (performance bias and detection bias) | Low risk | Objective outcomes such as laboratory measures or death are unlikely to have been much affected by problems of blindness |
| Incomplete outcome data (attrition bias) | Unclear risk | Analysis based on mixed and linear effects models and last observation carried forward (LOCF) and repeated measures analysis of variance. Attrition: olanzapine: 25%, OFC: 10%, fluoxetine: 30%. The overall attrition was considered as moderate. |
| Selective reporting (reporting bias) | High risk | The reporting on adverse events was incomplete. Statistics reporting was incomplete (e.g. SDs). |
| Other bias | Unclear risk | The study was sponsored by the manufacturers of olanzapine |
| Methods | Allocation: random, no further details | |
| Participants | Diagnosis: major depressive disorder (DSM IV), resistant to SSRI and no response to nortriptyline in open‐label phase, MADRS of at least 20. N = 492 | |
| Interventions | 1. Olanzapine: flexible dose (allowed dose range: 6 to 12 mg/day, mean dose: 8.3 mg/day). N = 144 | |
| Outcomes | Global state: CGI, relapse Unable to use: | |
| Notes | — | |
| Risk of bias | ||
| Bias | Authors' judgement | Support for judgement |
| Random sequence generation (selection bias) | Unclear risk | Random, no further details |
| Allocation concealment (selection bias) | Unclear risk | No further details |
| Blinding (performance bias and detection bias) | Unclear risk | Double, identical capsules. Whether blinding has been successful has not been tested. |
| Blinding (performance bias and detection bias) | Low risk | Objective outcomes such as laboratory measures or death are unlikely to have been much affected by problems of blindness |
| Incomplete outcome data (attrition bias) | Unclear risk | Analysis based on mixed and linear‐effects models and last observation carried forward (LOCF). Attrition: olanzapine: 22%, OFC: 21%, fluoxetine: 20%, nortriptyline: 12%. The attrition was rather moderate. |
| Selective reporting (reporting bias) | High risk | Outcomes were not fully addressed |
| Other bias | Unclear risk | The study was sponsored by the manufacturers of olanzapine |
| Methods | Allocation: random, no further details | |
| Participants | Diagnosis: dysthymia or single episode of major depression partial remission (DSM‐III‐R), MADRS 14‐26 (primary dysthymia (DSM‐III‐R 300.4: amisulpride: 132, fluoxetine: 121; single episode of major depression in partial remission amisulpride: 7, fluoxetine: 8). N = 281. | |
| Interventions | 1. Amisulpride: fixed dose (allowed dose range: 50 mg/day, mean dose: 50 mg/day). N = 142 | |
| Outcomes | Global state: CGI | |
| Notes | — | |
| Risk of bias | ||
| Bias | Authors' judgement | Support for judgement |
| Random sequence generation (selection bias) | Unclear risk | Random, no further details |
| Allocation concealment (selection bias) | Unclear risk | No further details |
| Blinding (performance bias and detection bias) | Unclear risk | Double, no further details. Whether blinding has been successful has not been tested. |
| Blinding (performance bias and detection bias) | Low risk | Objective outcomes such as laboratory measures or death are unlikely to have been much affected by problems of blinding |
| Incomplete outcome data (attrition bias) | High risk | Analysis was based on last observation carried forward (LOCF). Attrition: amisulpride = 23%, fluoxetine = 29%. The attrition was considered as rather high. |
| Selective reporting (reporting bias) | Unclear risk | For some outcomes only pooled data were available |
| Other bias | Unclear risk | Data on funding were not reported |
| Methods | Allocation: random, no further details | |
| Participants | Diagnosis: major depressive disorder (DSM:IV), HAM‐D of at least 22, 6 weeks treatment‐resistant. N = 298 | |
| Interventions | 1. Olanzapine: flexible dose (allowed dose range: 6, 12 or 18 mg/day, mean dose: 8.7 mg/day). N = 95. | |
| Outcomes | Global state: CGI Unable to use ‐ | |
| Notes | — | |
| Risk of bias | ||
| Bias | Authors' judgement | Support for judgement |
| Random sequence generation (selection bias) | Unclear risk | Random, no further details |
| Allocation concealment (selection bias) | Unclear risk | No further details |
| Blinding (performance bias and detection bias) | Unclear risk | Double, no further details. Whether blinding has been successful has not been tested. |
| Blinding (performance bias and detection bias) | Low risk | Objective outcomes such as laboratory measures or death are unlikely to have been much affected by problems of blindness |
| Incomplete outcome data (attrition bias) | High risk | Analysis was based on last observation carried forward (LOCF) and mixed‐effects model repeated measures (MMRM). Only pooled data on subjects leaving the study early. |
| Selective reporting (reporting bias) | High risk | Outcome data were not fully addressed (AIMS, BAS, SAS, HAM‐D).For some outcomes only pooled data were available. Adverse events only reported when occurring in at least 10% of subjects. |
| Other bias | High risk | Quote: methodological problems (e.g. lack of blinding of the investigators to the criteria for randomisation, inadequate lead‐in duration and insufficient criteria for establishing TRD) made the results of these studies difficult to interpret |
| Methods | Allocation: random, no further details | |
| Participants | Diagnosis: major depressive disorder (DSM:IV), HAM‐D of at least 22, 6 weeks treatment‐resistant. N = 300 | |
| Interventions | 1. Olanzapine: flexible dose (allowed dose range: 6, 12 or 18 mg/day, mean dose: 8.7 mg/day). N = 102 | |
| Outcomes | Global state: CGI Unable to use ‐ | |
| Notes | — | |
| Risk of bias | ||
| Bias | Authors' judgement | Support for judgement |
| Random sequence generation (selection bias) | Unclear risk | Random, no further details |
| Allocation concealment (selection bias) | Unclear risk | No further details |
| Blinding (performance bias and detection bias) | Unclear risk | Double, no further details. Whether blinding has been successful has not been tested. |
| Blinding (performance bias and detection bias) | Low risk | Objective outcomes such as laboratory measures or death are unlikely to have been much affected by problems of blinding |
| Incomplete outcome data (attrition bias) | High risk | Analysis was based on last observation carried forward (LOCF) and mixed‐effects model repeated measures (MMRM). Only pooled data on subjects leaving the study early. |
| Selective reporting (reporting bias) | High risk | Outcome data were not fully addressed (AIMS, BAS, SAS, HAM‐D). For some outcomes only pooled data were available. Adverse events only reported when occurring in at least 10% of subjects. |
| Other bias | High risk | Quote: methodological problems (e.g. lack of blinding of the investigators to the criteria for randomisation, inadequate lead‐in duration and insufficient criteria for establishing TRD) made the results of these studies difficult to interpret |
| Methods | Allocation: random, no further details | |
| Participants | Diagnosis: single episode or recurrent major depressive disorder (DSM‐IV), HAM‐D of at least 20, HAM‐D‐item 1 of at least 2. N = 723. | |
| Interventions | 1. Quetiapine: fixed dose (allowed dose range: 50, 150 or 300 mg/day, mean dose: not reported). N = 539. | |
| Outcomes | Global state: CGI Unable to use: | |
| Notes | — | |
| Risk of bias | ||
| Bias | Authors' judgement | Support for judgement |
| Random sequence generation (selection bias) | Unclear risk | Random, no further details |
| Allocation concealment (selection bias) | Unclear risk | No further details |
| Blinding (performance bias and detection bias) | Unclear risk | Double, no further details. Whether blinding has been successful has not been tested. |
| Blinding (performance bias and detection bias) | Low risk | Objective outcomes such as laboratory measures or death are unlikely to have been much affected by problems of blinding. |
| Incomplete outcome data (attrition bias) | High risk | Analysis based on last observation carried forward (LOCF). Data on leaving early for any reason were not indicated |
| Selective reporting (reporting bias) | High risk | Adverse events had to occur in more than 5% to be reported. Statistics reporting was incomplete (e.g. SDs). |
| Other bias | Unclear risk | The study was sponsored by the manufacturers of quetiapine |
AIMS: abnormal involuntary movement scale
BAS: Barnes akathisia scale
CGI: Clinical Global Impressions Scale
D: day
EPS: extrapyramidal symptoms
ECG: electrocardiogram
f: female
Fl: fluoxetine
HAM‐A/HAM‐D: Hamilton Anxiety Scale/Hamilton Depression Scale
LOCF: last observation carried forward
m: male
MADRS: Montgomery Åsberg Depression Rating Scale
MD: major depression
MDD: major depressive disorder
n.i.: not indicated, not reported.
OFC: olanzapine added to olanzapine
Ol: olanzapine
SAS: Simpson Angus scale
SD: standard deviation
SSRI: selective serotonin reuptake inhibitor
TRD: treatment resistant depression
Y‐BOCS: Yale‐Brown obsessive compulsive scale
Characteristics of excluded studies [ordered by study ID]
| Study | Reason for exclusion |
| Allocation: not randomised, review | |
| Allocation: randomised | |
| Allocation: randomised | |
| Allocation: randomised | |
| Allocation: randomised | |
| Allocation: randomised | |
| Allocation: randomised | |
| Allocation: randomised. | |
| Allocation: randomised | |
| Allocation: randomised | |
| Allocation: randomised | |
| Allocation: not randomised | |
| Allocation: randomised | |
| Allocation: randomised | |
| Allocation: randomised | |
| Allocation: randomised | |
| Allocation: randomised | |
| Allocation: randomised | |
| Allocation: randomised | |
| Allocation: randomised | |
| Allocation: not randomised |
Characteristics of studies awaiting assessment [ordered by study ID]
| Methods | Allocation: randomised |
| Participants | Diagnosis: major depressive disorder |
| Interventions | 1. Quetiapine added on escitalopram |
| Outcomes | 1. Primary outcome: change in MADRS |
| Notes | ClinicalTrials.gov: NCT00351169 |
| Methods | Allocation: randomised |
| Participants | Diagnosis: major depressive disorder |
| Interventions | 1. Quetiapine |
| Outcomes | 1. Primary outcome: change in MADRS |
| Notes | ClinicalTrials.gov: NCT00388973 |
| Methods | Allocation: randomised |
| Participants | Diagnosis: major depressive disorder |
| Interventions | 1. Quetiapine added on various antidepressants |
| Outcomes | 1. Outcome: MADRS, HAM‐D, HAM‐A, CGI |
| Notes | Additional references to Bauer 2007 |
| Methods | Allocation: randomised |
| Participants | Diagnosis: major depressive disorder |
| Interventions | 1. Quetiapine |
| Outcomes | 1. Outcome: change in MADRS |
| Notes | Additional reference to El‐Khalili 2008a |
| Methods | Allocation: randomised |
| Participants | Diagnosis: major depressive disorder |
| Interventions | 1. Quetiapine added on cognitive‐behaviour therapy |
| Outcomes | 1. Primary outcome: MADRS, HAM‐D, |
| Notes |
| Methods | Allocation: randomised |
| Participants | Diagnosis: major depressive disorder |
| Interventions | 1. Quetiapine added on various antidepressants |
| Outcomes | 1. Outcome: MADRS, HAM‐D, HAM‐A |
| Notes | Additional reference to El‐Khalili 2008b |
| Methods | Allocation: randomised |
| Participants | Diagnosis: major depressive disorder |
| Interventions | 1. Quetiapine added on fluoxetin |
| Outcomes | 1. Outcome: MADRS, HAM‐A, CGI |
| Notes |
| Methods | Allocation: randomised |
| Participants | Diagnosis: major depressive disorder |
| Interventions | 1. Quetiapine |
| Outcomes | 1. Outcome: MADRS, HAM‐A |
| Notes | Additional reference to Datto 2008 |
| Methods | Allocation: randomised |
| Participants | Diagnosis: major depressive disorder |
| Interventions | 1. Quetiapine |
| Outcomes | 1. Outcome: MADRS, HAM‐D, HAM‐A |
| Notes | Additional reference to Weisler 2008 |
MADRS: Montgomery Åsberg Depression Rating Scale
Characteristics of ongoing studies [ordered by study ID]
| Trial name or title | The Effects of Quetiapine XR on Cognition, Mood and Anxiety Symptoms in SSRI‐Resistant Unipolar Depression |
| Methods | Allocation: random, no further details |
| Participants | Diagnosis: unipolar Depression (DSM‐IV‐TR), 21‐item HAM‐D GRID score of at least 15, treatment‐resistant to SSRIs |
| Interventions | 1. Quetiapine: fixed dose (allowed dose range: 50 to 300 mg/day (start dose: 50 mg/day, day 2: 50 mg/day, day 3: 150 mg/day, day 4: 300 mg/day), mean dose: not reported). N = not reported. |
| Outcomes | Mental state: MADRS, 21‐item HAM‐D GRID, HAM‐A |
| Starting date | September 2007 |
| Contact information | University of British Columbia |
| Notes | — |
| Trial name or title | A Double‐Blind, Placebo‐Controlled Study of Aripiprazole Adjunctive to Antidepressant Therapy. |
| Methods | Allocation: random, no further details |
| Participants | Diagnosis: Major Depressive Disorder (DSM‐IV‐TR), based on SCID‐I/P, treatment‐resistant to antidepressants, HAM‐D‐17 of at least 18, Quick Inventory of Depressive Symptomatology ‐ Self Rated (22) score of at least 16, treated with adequate doses of SSRIs for at least the last 8 weeks, MADRS greater than 16. N = 224 |
| Interventions | 1. Ziprasidone: fixed dose (allowed dose range: 2 to 5 mg/day (day 1 to 30: 2 mg/day, day 31 to 60: 5 mg/day), mean dose: not reported). N = not reported |
| Outcomes | Mental state: MADRS, HAM‐D‐17, Quick Inventory of Depressive Symptomatology‐Self Rated(22) |
| Starting date | July 2008 |
| Contact information | Massachusetts General Hospital |
| Notes | — |
| Trial name or title | An Investigation of the Sleep Architecture and Consequent Cognitive Changes in Olanzapine‐Treated Depressed Patients. |
| Methods | Allocation: random, no further details |
| Participants | Diagnosis: Major Depressive Disorder or Bipolar Disorder I or II (DSM‐IV), HAM‐D‐17 higher than 15 |
| Interventions | 1. Olanzapine: flexible dose (allowed dose range: max. 5 mg/day, mean dose: not reported). N = not reported. |
| Outcomes | Mental state: MADRS, HAM‐D, CGI, HAM‐A |
| Starting date | October 2007 |
| Contact information | Queen's University |
| Notes | — |
| Trial name or title | Olanzapine Augmentation Therapy in Treatment‐Resistant Depression: a Double‐Blind Placebo‐Controlled Trial |
| Methods | Allocation: random, computer program |
| Participants | Diagnosis: Major Depressive Disorder (DSM‐IV), treatment‐resistant to antidepressants, HAM‐D of at least 17 |
| Interventions | 1. Olanzapine: fixed dose (allowed dose range: 10 mg/day, mean dose: not reported). N = not reported. |
| Outcomes | Mental state: MADRS, HAM‐D Adverse effects: laboratory, vital signs, weight |
| Starting date | June 2005 |
| Contact information | University Hospital Freiburg |
| Notes | — |
| Trial name or title | A 12‐Week, Placebo Controlled Trial of Ziprasidone as single treatment regimen for Major Depressive Disorder (Geodon) |
| Methods | Allocation: random, no further details |
| Participants | Diagnosis: Major Depressive Disorder (DSM‐IV), Quick Inventory of Depressive Symptomatology ‐ Self Rated score of at least 10. N = not reported |
| Interventions | 1. Ziprasidone: flexible dose (allowed dose range: 20 to 80 mg/day (increases of 20 mg/day may occur at 3 study visits), mean dose: not reported). N = not reported |
| Outcomes | Mental state: HAM‐D‐17, 6‐VAS‐D, Quick Inventory of Depressive Symptomatology‐Self Rated |
| Starting date | March 2008 |
| Contact information | Massachusetts General Hospital |
| Notes | — |
| Trial name or title | Ziprasidone Augmentation of SSRIs for Patients With Major Depressive Disorder (MDD) That do Not Sufficiently Respond to Treatment With SSRIs |
| Methods | Allocation: random, no further details |
| Participants | Diagnosis: Major Depressive Disorder (DSM‐IV), HAM‐D‐17 of at least 14 |
| Interventions | 1. Ziprasidone: flexible dose (allowed dose range: 20 to 80 mg/day (dose increases of 20 mg/day may occur at 3 study visits), mean dose: not reported). N = not reported |
| Outcomes | Mental state: HAM‐D‐17, HAM‐A, Quick Inventory of Depressive Symptomatology‐Self Rated |
| Starting date | July 2008 |
| Contact information | Massachusetts General Hospital |
| Notes | — |
| Trial name or title | A Study of Quetiapine Fumarate Sustained Release in Major Depression With Comorbid Fibromyalgia Syndrome |
| Methods | Allocation: random, no further details |
| Participants | Diagnosis: major depressive disorder (DSM‐IV) and fibromyalgia (American College of Rheumatology criteria), HAM‐D‐17 of at least 22 and at least 4 on CGI |
| Interventions | 1. Quetiapine: flexible dose (allowed dose range: 50 to 150 mg/day(day 1 to 2: 50 mg/day, day 3 to 14: 150 mg/day, then up to 300 mg/day at the investigator's discretion), mean dose: not reported). N = not reported. |
| Outcomes | Mental state: HAM‐D, HAM‐A |
| Starting date | April 2007 |
| Contact information | Dr. Alexander McIntyre Inc |
| Notes | — |
| Trial name or title | Venlafaxine Augmentation in treatment‐resistant Depression |
| Methods | Allocation: random, no further details |
| Participants | Diagnosis: major depressive disorder or bipolar I or II, HAM‐D greater than 18, treatment‐resistant to antidepressants |
| Interventions | 1. Quetiapine for 4 weeks: fixed/flexible dose: not reported (allowed dose range: up to 200 mg/day, mean dose: not reported). N = not reported |
| Outcomes | Mental state: HAM‐D, Beck Depression Inventory |
| Starting date | April 2008 |
| Contact information | Max‐Planck‐Institute of Psychiatry |
| Notes | — |
| Trial name or title | Treatment of major depressive disorder with ziprasidone |
| Methods | Allocation: random, no further details |
| Participants | Diagnosis: major depressive disorder (DSM‐IV) |
| Interventions | 1. ziprasidone 40 to 160 mg/day |
| Outcomes | Mental state: HAM‐D |
| Starting date | March 2008 |
| Contact information | Lindsay Christ, MA, [email protected] |
| Notes | Estimated completion data December 2008 |
| Trial name or title | Quetiapine in Co‐Morbid Depressive and Anxiety Disorders |
| Methods | Allocation: random, no further details |
| Participants | Diagnosis: major depressive disorder or dysthymic disorder (DSM‐IV), resistant to at least one first‐line treatment, patient must be receiving SSRIs, SNRIs or mirtazepine, 17‐item HAM‐D of at least 17. N = not reported |
| Interventions | 1. Quetiapine: fixed (first 8 weeks flexible) dose (allowed dose range: 50 to 600 mg/day (start dose: 50 mg/day), mean dose: not reported). N = not reported |
| Outcomes | Mental state: HAM‐D‐17, HAM‐A |
| Starting date | June 2008 |
| Contact information | Centre for Addiction and Mental Health |
| Notes | — |
CGI: Clinical Global Impressions Scale
HAM‐A/HAM‐D: Hamilton Anxiety Scale/Hamilton Depression Scale
MADRS: Montgomery Åsberg Depression Rating Scale
SNRI: serotonin norepinephrine reuptake inhibitors
SSRI: selective serotonin reuptake inhibitor
Data and analyses
| Outcome or subgroup title | No. of studies | No. of participants | Statistical method | Effect size |
| 1 No clinically important response to treatment (as defined by original study) Show forest plot | 1 | 277 | Odds Ratio (M‐H, Random, 95% CI) | 1.55 [0.87, 2.76] |
| Analysis 1.1  Comparison 1 Amisulpride versus antidepressants for major depression ‐ all data short‐term, Outcome 1 No clinically important response to treatment (as defined by original study). | ||||
| 2 Global state: no clinically important change ‐ CGI Show forest plot | 1 | 277 | Odds Ratio (M‐H, Random, 95% CI) | 1.17 [0.63, 2.17] |
| Analysis 1.2  Comparison 1 Amisulpride versus antidepressants for major depression ‐ all data short‐term, Outcome 2 Global state: no clinically important change ‐ CGI. | ||||
| 3 Mental state: 1a. Depressive symptoms ‐ no clinically important change ‐ MADRS Show forest plot | 1 | 277 | Odds Ratio (M‐H, Random, 95% CI) | 1.20 [0.67, 2.15] |
| Analysis 1.3  Comparison 1 Amisulpride versus antidepressants for major depression ‐ all data short‐term, Outcome 3 Mental state: 1a. Depressive symptoms ‐ no clinically important change ‐ MADRS. | ||||
| 4 Mental state: 1b. Depressive symptoms ‐ no clinically important change ‐ HAM‐D Show forest plot | 1 | 277 | Odds Ratio (M‐H, Random, 95% CI) | 1.55 [0.87, 2.76] |
| Analysis 1.4  Comparison 1 Amisulpride versus antidepressants for major depression ‐ all data short‐term, Outcome 4 Mental state: 1b. Depressive symptoms ‐ no clinically important change ‐ HAM‐D. | ||||
| 5 Mental state: 1c. Depressive symptoms ‐ MADRS score at endpoint Show forest plot | 1 | 272 | Mean Difference (IV, Random, 95% CI) | 1.20 [‐0.78, 3.18] |
| Analysis 1.5  Comparison 1 Amisulpride versus antidepressants for major depression ‐ all data short‐term, Outcome 5 Mental state: 1c. Depressive symptoms ‐ MADRS score at endpoint. | ||||
| 6 Mental state: 1d. Depressive symptoms ‐ HAM‐D score at endpoint Show forest plot | 1 | 272 | Mean Difference (IV, Random, 95% CI) | 0.90 [‐0.69, 2.49] |
| Analysis 1.6  Comparison 1 Amisulpride versus antidepressants for major depression ‐ all data short‐term, Outcome 6 Mental state: 1d. Depressive symptoms ‐ HAM‐D score at endpoint. | ||||
| 7 Leaving the study early Show forest plot | 1 | Odds Ratio (M‐H, Random, 95% CI) | Subtotals only | |
| Analysis 1.7  Comparison 1 Amisulpride versus antidepressants for major depression ‐ all data short‐term, Outcome 7 Leaving the study early. | ||||
| 7.1 due to any reason | 1 | 277 | Odds Ratio (M‐H, Random, 95% CI) | 1.14 [0.57, 2.26] |
| 7.2 due to adverse events | 1 | 277 | Odds Ratio (M‐H, Random, 95% CI) | 0.83 [0.25, 2.80] |
| 7.3 due to inefficacy | 1 | 277 | Odds Ratio (M‐H, Random, 95% CI) | 1.01 [0.29, 3.56] |
| 8 Adverse effects: 1. At least one adverse effect Show forest plot | 1 | 277 | Odds Ratio (M‐H, Random, 95% CI) | 0.67 [0.40, 1.12] |
| Analysis 1.8  Comparison 1 Amisulpride versus antidepressants for major depression ‐ all data short‐term, Outcome 8 Adverse effects: 1. At least one adverse effect. | ||||
| Outcome or subgroup title | No. of studies | No. of participants | Statistical method | Effect size |
| 1 No clinically important response (as defined by original study) Show forest plot | 3 | 1092 | Odds Ratio (M‐H, Random, 95% CI) | 0.48 [0.37, 0.63] |
| Analysis 2.1  Comparison 2 Aripiprazole added to antidepressants versus placebo added to antidepressants for major depression ‐ all data short‐term, Outcome 1 No clinically important response (as defined by original study). | ||||
| 2 Global state: no clinically important change ‐ CGI Show forest plot | 1 | 362 | Odds Ratio (M‐H, Random, 95% CI) | 0.51 [0.34, 0.78] |
| Analysis 2.2  Comparison 2 Aripiprazole added to antidepressants versus placebo added to antidepressants for major depression ‐ all data short‐term, Outcome 2 Global state: no clinically important change ‐ CGI. | ||||
| 3 Remission ‐ number of people without remission ‐ as defined by the original study Show forest plot | 3 | 1092 | Odds Ratio (M‐H, Random, 95% CI) | 0.48 [0.36, 0.64] |
| Analysis 2.3  Comparison 2 Aripiprazole added to antidepressants versus placebo added to antidepressants for major depression ‐ all data short‐term, Outcome 3 Remission ‐ number of people without remission ‐ as defined by the original study. | ||||
| 4 Mental state: 1a. Depressive symptoms ‐ MADRS score at endpoint Show forest plot | 3 | 1077 | Mean Difference (IV, Random, 95% CI) | ‐3.04 [‐4.09, 0.00] |
| Analysis 2.4  Comparison 2 Aripiprazole added to antidepressants versus placebo added to antidepressants for major depression ‐ all data short‐term, Outcome 4 Mental state: 1a. Depressive symptoms ‐ MADRS score at endpoint. | ||||
| 5 Leaving the study early Show forest plot | 3 | Odds Ratio (M‐H, Random, 95% CI) | Subtotals only | |
| Analysis 2.5  Comparison 2 Aripiprazole added to antidepressants versus placebo added to antidepressants for major depression ‐ all data short‐term, Outcome 5 Leaving the study early. | ||||
| 5.1 due to any reason | 3 | 1092 | Odds Ratio (M‐H, Random, 95% CI) | 1.21 [0.86, 1.71] |
| 5.2 due to adverse events | 3 | 1092 | Odds Ratio (M‐H, Random, 95% CI) | 2.59 [1.18, 5.71] |
| 5.3 due to inefficacy | 3 | 1092 | Odds Ratio (M‐H, Random, 95% CI) | 0.98 [0.36, 2.66] |
| 6 Adverse effects: 1. At least one adverse effect Show forest plot | 2 | 743 | Odds Ratio (M‐H, Random, 95% CI) | 2.53 [1.81, 3.52] |
| Analysis 2.6  Comparison 2 Aripiprazole added to antidepressants versus placebo added to antidepressants for major depression ‐ all data short‐term, Outcome 6 Adverse effects: 1. At least one adverse effect. | ||||
| 7 Adverse effects: 2. Death Show forest plot | 3 | Odds Ratio (M‐H, Random, 95% CI) | Subtotals only | |
| Analysis 2.7  Comparison 2 Aripiprazole added to antidepressants versus placebo added to antidepressants for major depression ‐ all data short‐term, Outcome 7 Adverse effects: 2. Death. | ||||
| 7.1 due to natural causes | 2 | 711 | Odds Ratio (M‐H, Random, 95% CI) | 0.0 [0.0, 0.0] |
| 7.2 due to suicide | 1 | 349 | Odds Ratio (M‐H, Random, 95% CI) | 0.0 [0.0, 0.0] |
| 7.3 suicide attempt | 1 | 362 | Odds Ratio (M‐H, Random, 95% CI) | 0.0 [0.0, 0.0] |
| 7.4 suicidal ideation | 2 | 711 | Odds Ratio (M‐H, Random, 95% CI) | 0.24 [0.03, 2.23] |
| 8 Adverse effects: 3a. Extrapyramidal effects Show forest plot | 3 | Odds Ratio (M‐H, Random, 95% CI) | Subtotals only | |
| Analysis 2.8  Comparison 2 Aripiprazole added to antidepressants versus placebo added to antidepressants for major depression ‐ all data short‐term, Outcome 8 Adverse effects: 3a. Extrapyramidal effects. | ||||
| 8.1 EPS in general | 1 | 362 | Odds Ratio (M‐H, Random, 95% CI) | 3.53 [1.95, 6.41] |
| 8.2 akathisia | 3 | 1092 | Odds Ratio (M‐H, Random, 95% CI) | 6.77 [4.22, 10.84] |
| 8.3 tremor | 1 | 381 | Odds Ratio (M‐H, Random, 95% CI) | 2.48 [0.86, 7.18] |
| 9 Adverse effects: 4a. Significant weight gain Show forest plot | 3 | 1092 | Odds Ratio (M‐H, Random, 95% CI) | 5.93 [2.15, 16.36] |
| Analysis 2.9  Comparison 2 Aripiprazole added to antidepressants versus placebo added to antidepressants for major depression ‐ all data short‐term, Outcome 9 Adverse effects: 4a. Significant weight gain. | ||||
| 10 Adverse effects: 4b. Weight ‐ change from baseline in kg Show forest plot | 3 | 1087 | Mean Difference (IV, Random, 95% CI) | 1.07 [0.30, 1.84] |
| Analysis 2.10  Comparison 2 Aripiprazole added to antidepressants versus placebo added to antidepressants for major depression ‐ all data short‐term, Outcome 10 Adverse effects: 4b. Weight ‐ change from baseline in kg. | ||||
| 11 Adverse effects: 5. Sedation Show forest plot | 2 | 711 | Odds Ratio (M‐H, Random, 95% CI) | 3.42 [0.66, 17.81] |
| Analysis 2.11  Comparison 2 Aripiprazole added to antidepressants versus placebo added to antidepressants for major depression ‐ all data short‐term, Outcome 11 Adverse effects: 5. Sedation. | ||||
| Outcome or subgroup title | No. of studies | No. of participants | Statistical method | Effect size |
| 1 No clinically important response to treatment (as defined by original study) Show forest plot | 2 | 201 | Odds Ratio (M‐H, Random, 95% CI) | 0.84 [0.46, 1.54] |
| Analysis 3.1  Comparison 3 Olanzapine versus placebo for psychotic depression ‐ all data short‐term, Outcome 1 No clinically important response to treatment (as defined by original study). | ||||
| 2 Remission ‐ number of participants without remission ‐ as defined by the original study Show forest plot | 2 | 200 | Odds Ratio (M‐H, Fixed, 95% CI) | 0.84 [0.35, 2.05] |
| Analysis 3.2  Comparison 3 Olanzapine versus placebo for psychotic depression ‐ all data short‐term, Outcome 2 Remission ‐ number of participants without remission ‐ as defined by the original study. | ||||
| 3 Mental state: 1. Depressive symptoms ‐ HAM‐D score at endpoint Show forest plot | 2 | 184 | Mean Difference (IV, Random, 95% CI) | ‐2.86 [‐6.19, 0.47] |
| Analysis 3.3  Comparison 3 Olanzapine versus placebo for psychotic depression ‐ all data short‐term, Outcome 3 Mental state: 1. Depressive symptoms ‐ HAM‐D score at endpoint. | ||||
| 4 Mental state: 2. Anxiety symptoms ‐ HAM‐A score at endpoint Show forest plot | 2 | 184 | Mean Difference (IV, Random, 95% CI) | ‐1.38 [‐3.46, 0.69] |
| Analysis 3.4  Comparison 3 Olanzapine versus placebo for psychotic depression ‐ all data short‐term, Outcome 4 Mental state: 2. Anxiety symptoms ‐ HAM‐A score at endpoint. | ||||
| 5 Leaving the study early Show forest plot | 2 | Odds Ratio (M‐H, Random, 95% CI) | Subtotals only | |
| Analysis 3.5  Comparison 3 Olanzapine versus placebo for psychotic depression ‐ all data short‐term, Outcome 5 Leaving the study early. | ||||
| 5.1 due to any reason | 2 | 201 | Odds Ratio (M‐H, Random, 95% CI) | 0.87 [0.50, 1.52] |
| 5.2 due to adverse events | 2 | 201 | Odds Ratio (M‐H, Random, 95% CI) | 1.67 [0.30, 9.34] |
| 5.3 due to inefficacy | 2 | 201 | Odds Ratio (M‐H, Random, 95% CI) | 0.39 [0.18, 0.86] |
| 6 Adverse effects: 1. At least one adverse effect Show forest plot | 1 | 201 | Odds Ratio (M‐H, Random, 95% CI) | 0.89 [0.45, 1.79] |
| Analysis 3.6  Comparison 3 Olanzapine versus placebo for psychotic depression ‐ all data short‐term, Outcome 6 Adverse effects: 1. At least one adverse effect. | ||||
| 7 Adverse effects: 2. Prolactin increase ‐ number of participants with significant increase ‐ as defined by the original study Show forest plot | 1 | 201 | Odds Ratio (M‐H, Random, 95% CI) | 6.59 [2.41, 17.97] |
| Analysis 3.7  Comparison 3 Olanzapine versus placebo for psychotic depression ‐ all data short‐term, Outcome 7 Adverse effects: 2. Prolactin increase ‐ number of participants with significant increase ‐ as defined by the original study. | ||||
| 8 Adverse effects: 3a. Significant weight gain ‐ spontaneously reported Show forest plot | 1 | 201 | Odds Ratio (M‐H, Random, 95% CI) | 5.99 [1.29, 27.76] |
| Analysis 3.8  Comparison 3 Olanzapine versus placebo for psychotic depression ‐ all data short‐term, Outcome 8 Adverse effects: 3a. Significant weight gain ‐ spontaneously reported. | ||||
| 9 Adverse effects: 3b. Weight ‐ change from baseline in kg Show forest plot | 1 | 201 | Mean Difference (IV, Random, 95% CI) | 3.4 [1.40, 5.40] |
| Analysis 3.9  Comparison 3 Olanzapine versus placebo for psychotic depression ‐ all data short‐term, Outcome 9 Adverse effects: 3b. Weight ‐ change from baseline in kg. | ||||
| 10 Adverse effects: 4. Sedation Show forest plot | 1 | 201 | Odds Ratio (M‐H, Random, 95% CI) | 4.40 [1.57, 12.31] |
| Analysis 3.10  Comparison 3 Olanzapine versus placebo for psychotic depression ‐ all data short‐term, Outcome 10 Adverse effects: 4. Sedation. | ||||
| Outcome or subgroup title | No. of studies | No. of participants | Statistical method | Effect size |
| 1 No clinically important response to treatment (as defined by original study) Show forest plot | 5 | 749 | Odds Ratio (M‐H, Random, 95% CI) | 1.59 [0.98, 2.58] |
| Analysis 4.1  Comparison 4 Olanzapine versus antidepressants for major depression ‐ all data short‐term, Outcome 1 No clinically important response to treatment (as defined by original study). | ||||
| 2 Remission ‐ number of participants without remission ‐ as defined by the original study Show forest plot | 4 | 766 | Odds Ratio (M‐H, Random, 95% CI) | 1.35 [0.89, 2.03] |
| Analysis 4.2  Comparison 4 Olanzapine versus antidepressants for major depression ‐ all data short‐term, Outcome 2 Remission ‐ number of participants without remission ‐ as defined by the original study. | ||||
| 3 Mental state: 1a. Depressive symptoms ‐ no clinically important change ‐ at least 50% MADRS reduction Show forest plot | 2 | 302 | Odds Ratio (M‐H, Fixed, 95% CI) | 1.18 [0.69, 2.00] |
| Analysis 4.3  Comparison 4 Olanzapine versus antidepressants for major depression ‐ all data short‐term, Outcome 3 Mental state: 1a. Depressive symptoms ‐ no clinically important change ‐ at least 50% MADRS reduction. | ||||
| 4 Mental state: 1b. Depressive symptoms ‐ MADRS score at endpoint Show forest plot | 5 | 747 | Mean Difference (IV, Random, 95% CI) | 0.56 [‐1.15, 2.27] |
| Analysis 4.4  Comparison 4 Olanzapine versus antidepressants for major depression ‐ all data short‐term, Outcome 4 Mental state: 1b. Depressive symptoms ‐ MADRS score at endpoint. | ||||
| 5 Mental state: 1c. Depressive symptoms ‐ HAM‐D score at endpoint Show forest plot | 1 | 13 | Mean Difference (IV, Random, 95% CI) | ‐2.10 [‐11.18, 6.98] |
| Analysis 4.5  Comparison 4 Olanzapine versus antidepressants for major depression ‐ all data short‐term, Outcome 5 Mental state: 1c. Depressive symptoms ‐ HAM‐D score at endpoint. | ||||
| 6 Mental state: 2. Anxiety symptoms ‐ HAM‐A score at endpoint Show forest plot | 4 | 734 | Mean Difference (IV, Random, 95% CI) | 0.39 [‐0.63, 1.42] |
| Analysis 4.6  Comparison 4 Olanzapine versus antidepressants for major depression ‐ all data short‐term, Outcome 6 Mental state: 2. Anxiety symptoms ‐ HAM‐A score at endpoint. | ||||
| 7 Leaving the study early Show forest plot | 4 | Odds Ratio (M‐H, Random, 95% CI) | Subtotals only | |
| Analysis 4.7  Comparison 4 Olanzapine versus antidepressants for major depression ‐ all data short‐term, Outcome 7 Leaving the study early. | ||||
| 7.1 due to any reason | 4 | 748 | Odds Ratio (M‐H, Random, 95% CI) | 1.12 [0.80, 1.57] |
| 7.2 due to adverse events | 3 | 735 | Odds Ratio (M‐H, Random, 95% CI) | 3.03 [1.55, 5.91] |
| 7.3 due to inefficacy | 3 | 735 | Odds Ratio (M‐H, Random, 95% CI) | 1.03 [0.57, 1.88] |
| 8 Adverse effects: 1. At least one adverse effect Show forest plot | 1 | 283 | Odds Ratio (M‐H, Random, 95% CI) | 1.10 [0.57, 2.14] |
| Analysis 4.8  Comparison 4 Olanzapine versus antidepressants for major depression ‐ all data short‐term, Outcome 8 Adverse effects: 1. At least one adverse effect. | ||||
| 9 Adverse effects: 2. Death ‐ natural cause Show forest plot | 2 | 355 | Odds Ratio (M‐H, Random, 95% CI) | 0.0 [0.0, 0.0] |
| Analysis 4.9  Comparison 4 Olanzapine versus antidepressants for major depression ‐ all data short‐term, Outcome 9 Adverse effects: 2. Death ‐ natural cause. | ||||
| 10 Adverse effects: 3. Extrapyramidal effects ‐ tremor Show forest plot | 2 | 516 | Odds Ratio (M‐H, Random, 95% CI) | 1.05 [0.49, 2.23] |
| Analysis 4.10  Comparison 4 Olanzapine versus antidepressants for major depression ‐ all data short‐term, Outcome 10 Adverse effects: 3. Extrapyramidal effects ‐ tremor. | ||||
| 11 Adverse effects: 4. Prolactin ‐ change from baseline in ng/ml Show forest plot | 2 | 584 | Mean Difference (IV, Random, 95% CI) | 4.46 [2.17, 6.75] |
| Analysis 4.11  Comparison 4 Olanzapine versus antidepressants for major depression ‐ all data short‐term, Outcome 11 Adverse effects: 4. Prolactin ‐ change from baseline in ng/ml. | ||||
| 12 Adverse effects: 5a. Significant weight gain Show forest plot | 2 | 434 | Odds Ratio (M‐H, Random, 95% CI) | 4.58 [1.84, 11.37] |
| Analysis 4.12  Comparison 4 Olanzapine versus antidepressants for major depression ‐ all data short‐term, Outcome 12 Adverse effects: 5a. Significant weight gain. | ||||
| 12.1 ≥ 10% weight gain from baseline | 1 | 283 | Odds Ratio (M‐H, Random, 95% CI) | 13.09 [0.73, 234.67] |
| 12.2 spontaneously reported | 1 | 151 | Odds Ratio (M‐H, Random, 95% CI) | 4.07 [1.56, 10.63] |
| 13 Adverse effects: 5b. Weight ‐ change from baseline in kg Show forest plot | 2 | 296 | Mean Difference (IV, Random, 95% CI) | 4.07 [2.71, 5.44] |
| Analysis 4.13  Comparison 4 Olanzapine versus antidepressants for major depression ‐ all data short‐term, Outcome 13 Adverse effects: 5b. Weight ‐ change from baseline in kg. | ||||
| 14 Adverse effects: 6. Sedation Show forest plot | 1 | 151 | Odds Ratio (M‐H, Random, 95% CI) | 2.53 [0.92, 6.94] |
| Analysis 4.14  Comparison 4 Olanzapine versus antidepressants for major depression ‐ all data short‐term, Outcome 14 Adverse effects: 6. Sedation. | ||||
| Outcome or subgroup title | No. of studies | No. of participants | Statistical method | Effect size |
| 1 No clinically important response ‐ as defined by original study Show forest plot | 5 | 808 | Odds Ratio (M‐H, Random, 95% CI) | 0.70 [0.48, 1.02] |
| Analysis 5.1  Comparison 5 Olanzapine added to antidepressants versus placebo added to antidepressants for major depression ‐ all data short‐term, Outcome 1 No clinically important response ‐ as defined by original study. | ||||
| 2 Remission ‐ number of people without remission ‐ as defined by the original study Show forest plot | 4 | 793 | Odds Ratio (M‐H, Random, 95% CI) | 0.60 [0.39, 0.92] |
| Analysis 5.2  Comparison 5 Olanzapine added to antidepressants versus placebo added to antidepressants for major depression ‐ all data short‐term, Outcome 2 Remission ‐ number of people without remission ‐ as defined by the original study. | ||||
| 3 Mental state: 1a. No clinically important change ‐ at least 50% MADRS total score reduction Show forest plot | 4 | 793 | Odds Ratio (M‐H, Random, 95% CI) | 0.73 [0.51, 1.04] |
| Analysis 5.3  Comparison 5 Olanzapine added to antidepressants versus placebo added to antidepressants for major depression ‐ all data short‐term, Outcome 3 Mental state: 1a. No clinically important change ‐ at least 50% MADRS total score reduction. | ||||
| 4 Mental state: 1b. Depressive symptoms ‐ MADRS score at endpoint Show forest plot | 5 | 808 | Mean Difference (IV, Random, 95% CI) | ‐2.84 [‐5.48, ‐0.20] |
| Analysis 5.4  Comparison 5 Olanzapine added to antidepressants versus placebo added to antidepressants for major depression ‐ all data short‐term, Outcome 4 Mental state: 1b. Depressive symptoms ‐ MADRS score at endpoint. | ||||
| 5 Mental state: 1c. Depressive symptoms ‐ HAM‐D score at endpoint Show forest plot | 1 | 15 | Mean Difference (IV, Random, 95% CI) | ‐7.90 [‐16.63, 0.83] |
| Analysis 5.5  Comparison 5 Olanzapine added to antidepressants versus placebo added to antidepressants for major depression ‐ all data short‐term, Outcome 5 Mental state: 1c. Depressive symptoms ‐ HAM‐D score at endpoint. | ||||
| 6 Mental state: 2. Anxiety symptoms ‐ HAM‐A score at endpoint Show forest plot | 4 | 793 | Mean Difference (IV, Random, 95% CI) | ‐1.44 [‐2.81, ‐0.06] |
| Analysis 5.6  Comparison 5 Olanzapine added to antidepressants versus placebo added to antidepressants for major depression ‐ all data short‐term, Outcome 6 Mental state: 2. Anxiety symptoms ‐ HAM‐A score at endpoint. | ||||
| 7 Leaving the study early Show forest plot | 4 | Odds Ratio (M‐H, Random, 95% CI) | Subtotals only | |
| Analysis 5.7  Comparison 5 Olanzapine added to antidepressants versus placebo added to antidepressants for major depression ‐ all data short‐term, Outcome 7 Leaving the study early. | ||||
| 7.1 due to any reason | 4 | 807 | Odds Ratio (M‐H, Random, 95% CI) | 1.22 [0.82, 1.83] |
| 7.2 due to adverse events | 3 | 792 | Odds Ratio (M‐H, Random, 95% CI) | 3.51 [1.58, 7.80] |
| 7.3 due to inefficacy | 3 | 792 | Odds Ratio (M‐H, Random, 95% CI) | 0.58 [0.28, 1.21] |
| 8 Adverse effects: 1. At least one adverse effect Show forest plot | 1 | 217 | Odds Ratio (M‐H, Random, 95% CI) | 1.30 [0.58, 2.93] |
| Analysis 5.8  Comparison 5 Olanzapine added to antidepressants versus placebo added to antidepressants for major depression ‐ all data short‐term, Outcome 8 Adverse effects: 1. At least one adverse effect. | ||||
| 9 Adverse effects: 2. Death Show forest plot | 2 | 575 | Odds Ratio (M‐H, Random, 95% CI) | 0.38 [0.02, 9.47] |
| Analysis 5.9  Comparison 5 Olanzapine added to antidepressants versus placebo added to antidepressants for major depression ‐ all data short‐term, Outcome 9 Adverse effects: 2. Death. | ||||
| 10 Adverse effects: 3. Extrapyramidal effects ‐ tremor Show forest plot | 1 | 302 | Odds Ratio (M‐H, Random, 95% CI) | 1.21 [0.53, 2.75] |
| Analysis 5.10  Comparison 5 Olanzapine added to antidepressants versus placebo added to antidepressants for major depression ‐ all data short‐term, Outcome 10 Adverse effects: 3. Extrapyramidal effects ‐ tremor. | ||||
| 11 Adverse effects: 4. Prolactin ‐ change from baseline in ng/ml Show forest plot | 2 | 518 | Mean Difference (IV, Random, 95% CI) | 4.19 [‐0.18, 8.56] |
| Analysis 5.11  Comparison 5 Olanzapine added to antidepressants versus placebo added to antidepressants for major depression ‐ all data short‐term, Outcome 11 Adverse effects: 4. Prolactin ‐ change from baseline in ng/ml. | ||||
| 12 Adverse effects: 5a. Significant weight gain Show forest plot | 3 | 792 | Odds Ratio (M‐H, Random, 95% CI) | 4.77 [1.82, 12.50] |
| Analysis 5.12  Comparison 5 Olanzapine added to antidepressants versus placebo added to antidepressants for major depression ‐ all data short‐term, Outcome 12 Adverse effects: 5a. Significant weight gain. | ||||
| 12.1 ≥ 10% weight gain from baseline | 1 | 217 | Odds Ratio (M‐H, Random, 95% CI) | 12.14 [0.70, 208.95] |
| 12.2 spontaneously reported | 2 | 575 | Odds Ratio (M‐H, Random, 95% CI) | 4.22 [1.29, 13.77] |
| 13 Adverse effects: 5b. Weight ‐ change from baseline in kg Show forest plot | 2 | 519 | Mean Difference (IV, Random, 95% CI) | 4.58 [4.06, 5.09] |
| Analysis 5.13  Comparison 5 Olanzapine added to antidepressants versus placebo added to antidepressants for major depression ‐ all data short‐term, Outcome 13 Adverse effects: 5b. Weight ‐ change from baseline in kg. | ||||
| 14 Adverse effects: 6. Sedation Show forest plot | 2 | 575 | Odds Ratio (M‐H, Random, 95% CI) | 3.53 [1.64, 7.60] |
| Analysis 5.14  Comparison 5 Olanzapine added to antidepressants versus placebo added to antidepressants for major depression ‐ all data short‐term, Outcome 14 Adverse effects: 6. Sedation. | ||||
| Outcome or subgroup title | No. of studies | No. of participants | Statistical method | Effect size |
| 1 Non‐response to treatment ‐ as defined by the original study Show forest plot | 3 | 1342 | Odds Ratio (M‐H, Random, 95% CI) | 0.52 [0.41, 0.66] |
| Analysis 6.1  Comparison 6 Quetiapine versus placebo for major depression, Outcome 1 Non‐response to treatment ‐ as defined by the original study. | ||||
| 2 Global state: no clinically important change ‐ CGI Show forest plot | 3 | 1342 | Odds Ratio (M‐H, Random, 95% CI) | 0.56 [0.44, 0.71] |
| Analysis 6.2  Comparison 6 Quetiapine versus placebo for major depression, Outcome 2 Global state: no clinically important change ‐ CGI. | ||||
| 3 Remission ‐ number of participants without remission ‐ as defined by the original study Show forest plot | 3 | 1337 | Odds Ratio (M‐H, Fixed, 95% CI) | 0.65 [0.49, 0.86] |
| Analysis 6.3  Comparison 6 Quetiapine versus placebo for major depression, Outcome 3 Remission ‐ number of participants without remission ‐ as defined by the original study. | ||||
| 4 Relapse Show forest plot | 1 | 776 | Odds Ratio (M‐H, Fixed, 95% CI) | 0.34 [0.24, 0.48] |
| Analysis 6.4  Comparison 6 Quetiapine versus placebo for major depression, Outcome 4 Relapse. | ||||
| 5 Mental state: 1a. Depressive symptoms ‐ no clinically important change‐ MADRS Show forest plot | 3 | 1342 | Odds Ratio (M‐H, Random, 95% CI) | 0.52 [0.41, 0.66] |
| Analysis 6.5  Comparison 6 Quetiapine versus placebo for major depression, Outcome 5 Mental state: 1a. Depressive symptoms ‐ no clinically important change‐ MADRS. | ||||
| 6 Mental state: 1b. Depressive symptoms ‐ MADRS score at endpoint Show forest plot | 4 | 2069 | Mean Difference (IV, Random, 95% CI) | ‐2.59 [‐3.50, ‐1.69] |
| Analysis 6.6  Comparison 6 Quetiapine versus placebo for major depression, Outcome 6 Mental state: 1b. Depressive symptoms ‐ MADRS score at endpoint. | ||||
| 6.1 short‐term | 3 | 1298 | Mean Difference (IV, Random, 95% CI) | ‐3.36 [‐4.62, ‐2.10] |
| 6.2 long‐term | 1 | 771 | Mean Difference (IV, Random, 95% CI) | ‐1.88 [‐1.00, ‐0.76] |
| 7 Mental state: 1c. Depressive symptoms ‐ HAM‐D score at endpoint Show forest plot | 3 | 1298 | Mean Difference (IV, Random, 95% CI) | ‐2.52 [‐3.66, ‐1.37] |
| Analysis 6.7  Comparison 6 Quetiapine versus placebo for major depression, Outcome 7 Mental state: 1c. Depressive symptoms ‐ HAM‐D score at endpoint. | ||||
| 8 Mental state: 2. Anxiety symptoms ‐ HAM‐A score at endpoint Show forest plot | 4 | 2069 | Mean Difference (IV, Random, 95% CI) | ‐1.40 [‐1.97, ‐0.84] |
| Analysis 6.8  Comparison 6 Quetiapine versus placebo for major depression, Outcome 8 Mental state: 2. Anxiety symptoms ‐ HAM‐A score at endpoint. | ||||
| 8.1 short‐term | 3 | 1298 | Mean Difference (IV, Random, 95% CI) | ‐1.42 [‐2.20, ‐0.64] |
| 8.2 long‐term | 1 | 771 | Mean Difference (IV, Random, 95% CI) | ‐1.38 [‐2.20, ‐0.56] |
| 9 Leaving the study early ‐ due to adverse events Show forest plot | 4 | 2118 | Odds Ratio (M‐H, Random, 95% CI) | 2.33 [1.37, 3.98] |
| Analysis 6.9  Comparison 6 Quetiapine versus placebo for major depression, Outcome 9 Leaving the study early ‐ due to adverse events. | ||||
| 9.1 short‐term | 3 | 1342 | Odds Ratio (M‐H, Random, 95% CI) | 3.03 [1.91, 4.80] |
| 9.2 long‐term | 1 | 776 | Odds Ratio (M‐H, Random, 95% CI) | 1.25 [0.68, 2.28] |
| 10 Adverse effects: 1. Death ‐ suicidal thoughts ‐ MADRS item 10 of at least 4 Show forest plot | 1 | 723 | Odds Ratio (M‐H, Random, 95% CI) | 0.48 [0.18, 1.27] |
| Analysis 6.10  Comparison 6 Quetiapine versus placebo for major depression, Outcome 10 Adverse effects: 1. Death ‐ suicidal thoughts ‐ MADRS item 10 of at least 4. | ||||
| 11 Adverse effects: 2. Extrapyramidal effects ‐ general EPS Show forest plot | 4 | 2118 | Odds Ratio (M‐H, Random, 95% CI) | 1.74 [1.01, 3.02] |
| Analysis 6.11  Comparison 6 Quetiapine versus placebo for major depression, Outcome 11 Adverse effects: 2. Extrapyramidal effects ‐ general EPS. | ||||
| 11.1 short‐term | 3 | 1342 | Odds Ratio (M‐H, Random, 95% CI) | 1.84 [0.94, 3.60] |
| 11.2 long‐term | 1 | 776 | Odds Ratio (M‐H, Random, 95% CI) | 1.56 [0.60, 4.08] |
| 12 Adverse effects: 3. Prolactin ‐ change from baseline in ng/ml Show forest plot | 1 | 309 | Mean Difference (IV, Random, 95% CI) | 0.76 [‐0.19, 1.71] |
| Analysis 6.12  Comparison 6 Quetiapine versus placebo for major depression, Outcome 12 Adverse effects: 3. Prolactin ‐ change from baseline in ng/ml. | ||||
| 13 Adverse effects: 4a. Significant weight gain Show forest plot | 4 | Odds Ratio (M‐H, Random, 95% CI) | Subtotals only | |
| Analysis 6.13  Comparison 6 Quetiapine versus placebo for major depression, Outcome 13 Adverse effects: 4a. Significant weight gain. | ||||
| 13.1 ≥7% weight gain from baseline ‐ short‐term | 4 | 2118 | Odds Ratio (M‐H, Random, 95% CI) | 2.12 [1.13, 3.99] |
| 13.2 spontaneously reported | 1 | 776 | Odds Ratio (M‐H, Random, 95% CI) | 6.80 [2.84, 16.28] |
| 14 Adverse effects: 4b. Weight ‐ change from baseline in kg Show forest plot | 4 | 2027 | Mean Difference (IV, Random, 95% CI) | 0.65 [0.11, 1.18] |
| Analysis 6.14  Comparison 6 Quetiapine versus placebo for major depression, Outcome 14 Adverse effects: 4b. Weight ‐ change from baseline in kg. | ||||
| 14.1 short‐term | 3 | 1306 | Mean Difference (IV, Random, 95% CI) | 0.60 [‐0.09, 1.29] |
| 14.2 long‐term | 1 | 721 | Mean Difference (IV, Random, 95% CI) | 0.8 [0.13, 1.47] |
| 15 Adverse effects: 5. Sedation Show forest plot | 4 | 2118 | Odds Ratio (M‐H, Random, 95% CI) | 5.76 [2.32, 14.32] |
| Analysis 6.15  Comparison 6 Quetiapine versus placebo for major depression, Outcome 15 Adverse effects: 5. Sedation. | ||||
| 15.1 short‐term | 3 | 1342 | Odds Ratio (M‐H, Random, 95% CI) | 4.94 [1.97, 12.36] |
| 15.2 long‐term | 1 | 776 | Odds Ratio (M‐H, Random, 95% CI) | 31.74 [1.89, 532.38] |
| Outcome or subgroup title | No. of studies | No. of participants | Statistical method | Effect size |
| 1 No clinically important response to treatment (as defined by original study) Show forest plot | 1 | 303 | Odds Ratio (M‐H, Random, 95% CI) | 0.94 [0.60, 1.47] |
| Analysis 7.1  Comparison 7 Quetiapine versus antidepressants for major depression ‐ all data short‐term, Outcome 1 No clinically important response to treatment (as defined by original study). | ||||
| 2 Global state: no clinically important change ‐ CGI Show forest plot | 1 | 303 | Odds Ratio (M‐H, Random, 95% CI) | 0.94 [0.60, 1.47] |
| Analysis 7.2  Comparison 7 Quetiapine versus antidepressants for major depression ‐ all data short‐term, Outcome 2 Global state: no clinically important change ‐ CGI. | ||||
| 3 Remission ‐ number of participants without remission Show forest plot | 1 | 303 | Odds Ratio (M‐H, Random, 95% CI) | 1.08 [0.66, 1.77] |
| Analysis 7.3  Comparison 7 Quetiapine versus antidepressants for major depression ‐ all data short‐term, Outcome 3 Remission ‐ number of participants without remission. | ||||
| 4 Mental state: 1a. No clinically important change‐ MADRS Show forest plot | 1 | 303 | Odds Ratio (M‐H, Random, 95% CI) | 0.72 [0.46, 1.13] |
| Analysis 7.4  Comparison 7 Quetiapine versus antidepressants for major depression ‐ all data short‐term, Outcome 4 Mental state: 1a. No clinically important change‐ MADRS. | ||||
| 5 Mental state: 1b. Depressive symptoms ‐ MADRS score at endpoint Show forest plot | 1 | 288 | Mean Difference (IV, Random, 95% CI) | ‐0.41 [‐2.65, 1.83] |
| Analysis 7.5  Comparison 7 Quetiapine versus antidepressants for major depression ‐ all data short‐term, Outcome 5 Mental state: 1b. Depressive symptoms ‐ MADRS score at endpoint. | ||||
| 6 Mental state: 1c. Depressive symptoms ‐ HAM‐D score at endpoint Show forest plot | 1 | 288 | Mean Difference (IV, Random, 95% CI) | ‐1.20 [‐2.99, 0.59] |
| Analysis 7.6  Comparison 7 Quetiapine versus antidepressants for major depression ‐ all data short‐term, Outcome 6 Mental state: 1c. Depressive symptoms ‐ HAM‐D score at endpoint. | ||||
| 7 Mental state: 2. Anxiety symptoms ‐ HAM‐A score at endpoint Show forest plot | 1 | 288 | Mean Difference (IV, Random, 95% CI) | 0.26 [‐1.39, 1.91] |
| Analysis 7.7  Comparison 7 Quetiapine versus antidepressants for major depression ‐ all data short‐term, Outcome 7 Mental state: 2. Anxiety symptoms ‐ HAM‐A score at endpoint. | ||||
| 8 Leaving the study early ‐ due to adverse events Show forest plot | 1 | 303 | Odds Ratio (M‐H, Random, 95% CI) | 16.82 [3.93, 72.02] |
| Analysis 7.8  Comparison 7 Quetiapine versus antidepressants for major depression ‐ all data short‐term, Outcome 8 Leaving the study early ‐ due to adverse events. | ||||
| 9 Adverse effects: 1. Extrapyramidal effects ‐ general EPS Show forest plot | 1 | 303 | Odds Ratio (M‐H, Random, 95% CI) | 0.64 [0.26, 1.62] |
| Analysis 7.9  Comparison 7 Quetiapine versus antidepressants for major depression ‐ all data short‐term, Outcome 9 Adverse effects: 1. Extrapyramidal effects ‐ general EPS. | ||||
| 10 Adverse effects: 2. Prolactin ‐ change from baseline in ng/ml Show forest plot | 1 | 301 | Mean Difference (IV, Random, 95% CI) | 0.07 [‐1.21, 1.35] |
| Analysis 7.10  Comparison 7 Quetiapine versus antidepressants for major depression ‐ all data short‐term, Outcome 10 Adverse effects: 2. Prolactin ‐ change from baseline in ng/ml. | ||||
| 11 Adverse effects: 3a. Significant weight gain ‐ ≥7% from baseline Show forest plot | 1 | 303 | Odds Ratio (M‐H, Random, 95% CI) | 4.05 [0.45, 36.70] |
| Analysis 7.11  Comparison 7 Quetiapine versus antidepressants for major depression ‐ all data short‐term, Outcome 11 Adverse effects: 3a. Significant weight gain ‐ ≥7% from baseline. | ||||
| 12 Adverse effects: 3b. Weight ‐ change from baseline in ng/ml Show forest plot | 1 | 301 | Mean Difference (IV, Random, 95% CI) | 1.65 [1.13, 2.17] |
| Analysis 7.12  Comparison 7 Quetiapine versus antidepressants for major depression ‐ all data short‐term, Outcome 12 Adverse effects: 3b. Weight ‐ change from baseline in ng/ml. | ||||
| 13 Adverse effects: 4. Sedation Show forest plot | 1 | 303 | Odds Ratio (M‐H, Random, 95% CI) | 3.27 [1.89, 5.63] |
| Analysis 7.13  Comparison 7 Quetiapine versus antidepressants for major depression ‐ all data short‐term, Outcome 13 Adverse effects: 4. Sedation. | ||||
| Outcome or subgroup title | No. of studies | No. of participants | Statistical method | Effect size |
| 1 No clinically important response (as defined by original study) Show forest plot | 3 | 995 | Odds Ratio (M‐H, Random, 95% CI) | 0.66 [0.51, 0.87] |
| Analysis 8.1  Comparison 8 Quetiapine added to antidepressants versus placebo added to antidepressants for major depression ‐ all data short‐term, Outcome 1 No clinically important response (as defined by original study). | ||||
| 2 Global state: no clinically important change ‐ CGI Show forest plot | 2 | 937 | Odds Ratio (M‐H, Random, 95% CI) | 0.64 [0.49, 0.84] |
| Analysis 8.2  Comparison 8 Quetiapine added to antidepressants versus placebo added to antidepressants for major depression ‐ all data short‐term, Outcome 2 Global state: no clinically important change ‐ CGI. | ||||
| 3 Remission ‐ number of people without remission ‐ as defined by the original study Show forest plot | 3 | 847 | Odds Ratio (M‐H, Random, 95% CI) | 0.52 [0.38, 0.71] |
| Analysis 8.3  Comparison 8 Quetiapine added to antidepressants versus placebo added to antidepressants for major depression ‐ all data short‐term, Outcome 3 Remission ‐ number of people without remission ‐ as defined by the original study. | ||||
| 4 Mental state: 1a. Depressive symptoms ‐ no clinically important change ‐ MADRS Show forest plot | 2 | 937 | Odds Ratio (M‐H, Random, 95% CI) | 0.68 [0.52, 0.90] |
| Analysis 8.4  Comparison 8 Quetiapine added to antidepressants versus placebo added to antidepressants for major depression ‐ all data short‐term, Outcome 4 Mental state: 1a. Depressive symptoms ‐ no clinically important change ‐ MADRS. | ||||
| 5 Mental state: 1b. Depressive symptoms ‐ MADRS score at endpoint Show forest plot | 2 | 919 | Mean Difference (IV, Random, 95% CI) | ‐2.67 [‐4.00, ‐1.34] |
| Analysis 8.5  Comparison 8 Quetiapine added to antidepressants versus placebo added to antidepressants for major depression ‐ all data short‐term, Outcome 5 Mental state: 1b. Depressive symptoms ‐ MADRS score at endpoint. | ||||
| 6 Mental state: 1c. Depressive symptoms ‐ no clinically important change ‐ HAM‐D Show forest plot | 1 | 58 | Odds Ratio (M‐H, Random, 95% CI) | 0.41 [0.14, 1.22] |
| Analysis 8.6  Comparison 8 Quetiapine added to antidepressants versus placebo added to antidepressants for major depression ‐ all data short‐term, Outcome 6 Mental state: 1c. Depressive symptoms ‐ no clinically important change ‐ HAM‐D. | ||||
| 7 Mental state: 1d. Depressive symptoms ‐ HAM‐D score at endpoint Show forest plot | 3 | 977 | Mean Difference (IV, Random, 95% CI) | ‐2.67 [‐3.79, ‐1.55] |
| Analysis 8.7  Comparison 8 Quetiapine added to antidepressants versus placebo added to antidepressants for major depression ‐ all data short‐term, Outcome 7 Mental state: 1d. Depressive symptoms ‐ HAM‐D score at endpoint. | ||||
| 8 Mental state: 2a. Anxiety symptoms ‐ no clinically important change ‐ HAM‐A Show forest plot | 1 | 58 | Odds Ratio (M‐H, Random, 95% CI) | 0.23 [0.08, 0.70] |
| Analysis 8.8  Comparison 8 Quetiapine added to antidepressants versus placebo added to antidepressants for major depression ‐ all data short‐term, Outcome 8 Mental state: 2a. Anxiety symptoms ‐ no clinically important change ‐ HAM‐A. | ||||
| 9 Mental state: 2b. Anxiety symptoms ‐ HAM‐A score at endpoint Show forest plot | 3 | 977 | Mean Difference (IV, Random, 95% CI) | ‐2.62 [‐4.69, ‐0.55] |
| Analysis 8.9  Comparison 8 Quetiapine added to antidepressants versus placebo added to antidepressants for major depression ‐ all data short‐term, Outcome 9 Mental state: 2b. Anxiety symptoms ‐ HAM‐A score at endpoint. | ||||
| 10 Leaving the study early Show forest plot | 3 | Odds Ratio (M‐H, Random, 95% CI) | Subtotals only | |
| Analysis 8.10  Comparison 8 Quetiapine added to antidepressants versus placebo added to antidepressants for major depression ‐ all data short‐term, Outcome 10 Leaving the study early. | ||||
| 10.1 due to any reason | 1 | 58 | Odds Ratio (M‐H, Random, 95% CI) | 0.75 [0.26, 2.14] |
| 10.2 due to adverse events | 3 | 995 | Odds Ratio (M‐H, Random, 95% CI) | 5.59 [1.47, 21.26] |
| 10.3 due to inefficacy | 1 | 58 | Odds Ratio (M‐H, Random, 95% CI) | 0.04 [0.00, 0.66] |
| 11 Adverse effects: 1. Extrapyramidal symptoms Show forest plot | 1 | 446 | Odds Ratio (M‐H, Fixed, 95% CI) | 1.95 [0.71, 5.32] |
| Analysis 8.11  Comparison 8 Quetiapine added to antidepressants versus placebo added to antidepressants for major depression ‐ all data short‐term, Outcome 11 Adverse effects: 1. Extrapyramidal symptoms. | ||||
| 12 Adverse effects: 2. Prolactin ‐ change from baseline in ng/ml Show forest plot | 1 | 491 | Mean Difference (IV, Random, 95% CI) | ‐0.33 [‐1.00, 2.34] |
| Analysis 8.12  Comparison 8 Quetiapine added to antidepressants versus placebo added to antidepressants for major depression ‐ all data short‐term, Outcome 12 Adverse effects: 2. Prolactin ‐ change from baseline in ng/ml. | ||||
| 13 Adverse effects: 3a. Significant weight gain Show forest plot | 3 | Odds Ratio (M‐H, Random, 95% CI) | Subtotals only | |
| Analysis 8.13  Comparison 8 Quetiapine added to antidepressants versus placebo added to antidepressants for major depression ‐ all data short‐term, Outcome 13 Adverse effects: 3a. Significant weight gain. | ||||
| 13.1 ≥ 7% weight gain from baseline | 3 | 995 | Odds Ratio (M‐H, Random, 95% CI) | 3.06 [1.22, 7.68] |
| 13.2 Increase in body weight from baseline to week 8 | 1 | 58 | Odds Ratio (M‐H, Random, 95% CI) | 3.39 [1.01, 11.41] |
| 13.3 spontaneously reported | 1 | 446 | Odds Ratio (M‐H, Random, 95% CI) | 6.17 [0.79, 47.90] |
| 14 Adverse effects: 3b. Weight ‐ change from baseline in kg Show forest plot | 3 | 959 | Mean Difference (IV, Random, 95% CI) | 1.11 [0.56, 1.66] |
| Analysis 8.14  Comparison 8 Quetiapine added to antidepressants versus placebo added to antidepressants for major depression ‐ all data short‐term, Outcome 14 Adverse effects: 3b. Weight ‐ change from baseline in kg. | ||||
| 15 Adverse effects: 4. Sedation Show forest plot | 3 | 995 | Odds Ratio (M‐H, Random, 95% CI) | 8.79 [4.90, 15.77] |
| Analysis 8.15  Comparison 8 Quetiapine added to antidepressants versus placebo added to antidepressants for major depression ‐ all data short‐term, Outcome 15 Adverse effects: 4. Sedation. | ||||
| Outcome or subgroup title | No. of studies | No. of participants | Statistical method | Effect size |
| 1 No clinically important response (as defined by original study) Show forest plot | 2 | 371 | Odds Ratio (M‐H, Random, 95% CI) | 0.57 [0.36, 0.89] |
| Analysis 9.1  Comparison 9 Risperidone added to antidepressants versus placebo added to antidepressants for major depression, Outcome 1 No clinically important response (as defined by original study). | ||||
| 2 Remission ‐ number of participants without remission ‐ as defined by the original study Show forest plot | 2 | 371 | Odds Ratio (M‐H, Fixed, 95% CI) | 0.39 [0.22, 0.69] |
| Analysis 9.2  Comparison 9 Risperidone added to antidepressants versus placebo added to antidepressants for major depression, Outcome 2 Remission ‐ number of participants without remission ‐ as defined by the original study. | ||||
| 3 Relapse (as defined by the original study) Show forest plot | 1 | 243 | Odds Ratio (M‐H, Random, 95% CI) | 0.95 [0.57, 1.57] |
| Analysis 9.3  Comparison 9 Risperidone added to antidepressants versus placebo added to antidepressants for major depression, Outcome 3 Relapse (as defined by the original study). | ||||
| 4 Mental state: 1a. Depressive symptoms ‐ MADRS score at endpoint Show forest plot | 2 | 264 | Mean Difference (IV, Random, 95% CI) | ‐1.85 [‐9.17, 5.47] |
| Analysis 9.4  Comparison 9 Risperidone added to antidepressants versus placebo added to antidepressants for major depression, Outcome 4 Mental state: 1a. Depressive symptoms ‐ MADRS score at endpoint. | ||||
| 4.1 short‐term | 1 | 23 | Mean Difference (IV, Random, 95% CI) | ‐7.11 [‐16.50, 2.28] |
| 4.2 medium‐term | 1 | 241 | Mean Difference (IV, Random, 95% CI) | 0.80 [‐2.21, 3.81] |
| 5 Mental state: 1b. Depressive symptoms ‐ no clinically important change ‐ HAM‐D Show forest plot | 2 | 371 | Odds Ratio (M‐H, Random, 95% CI) | 0.60 [0.38, 0.95] |
| Analysis 9.5  Comparison 9 Risperidone added to antidepressants versus placebo added to antidepressants for major depression, Outcome 5 Mental state: 1b. Depressive symptoms ‐ no clinically important change ‐ HAM‐D. | ||||
| 6 Mental state: 1c. Depressive symptoms ‐ HAM‐D score at endpoint Show forest plot | 2 | 509 | Mean Difference (IV, Random, 95% CI) | ‐1.69 [‐4.13, 0.74] |
| Analysis 9.6  Comparison 9 Risperidone added to antidepressants versus placebo added to antidepressants for major depression, Outcome 6 Mental state: 1c. Depressive symptoms ‐ HAM‐D score at endpoint. | ||||
| 6.1 short‐term | 1 | 268 | Mean Difference (IV, Random, 95% CI) | ‐2.80 [‐4.14, ‐1.46] |
| 6.2 medium‐term | 1 | 241 | Mean Difference (IV, Random, 95% CI) | ‐0.30 [‐2.43, 1.83] |
| 7 Leaving the study early Show forest plot | 4 | Odds Ratio (M‐H, Random, 95% CI) | Subtotals only | |
| Analysis 9.7  Comparison 9 Risperidone added to antidepressants versus placebo added to antidepressants for major depression, Outcome 7 Leaving the study early. | ||||
| 7.1 due to any reason | 4 | 637 | Odds Ratio (M‐H, Random, 95% CI) | 1.04 [0.59, 1.83] |
| 7.2 due to adverse events | 2 | 517 | Odds Ratio (M‐H, Random, 95% CI) | 2.11 [0.79, 5.68] |
| 7.3 due to inefficacy | 2 | 517 | Odds Ratio (M‐H, Random, 95% CI) | 0.95 [0.59, 1.51] |
| 8 Adverse effects: 1. At least one adverse effect Show forest plot | 2 | 371 | Odds Ratio (M‐H, Random, 95% CI) | 0.75 [0.48, 1.16] |
| Analysis 9.8  Comparison 9 Risperidone added to antidepressants versus placebo added to antidepressants for major depression, Outcome 8 Adverse effects: 1. At least one adverse effect. | ||||
| 9 Adverse effects: 2a. Extrapyramidal effects ‐ tremor Show forest plot | 2 | Odds Ratio (M‐H, Random, 95% CI) | Subtotals only | |
| Analysis 9.9  Comparison 9 Risperidone added to antidepressants versus placebo added to antidepressants for major depression, Outcome 9 Adverse effects: 2a. Extrapyramidal effects ‐ tremor. | ||||
| 9.1 EPS general ‐ medium‐term | 1 | 243 | Odds Ratio (M‐H, Random, 95% CI) | 1.98 [0.36, 11.04] |
| 9.2 akathisia ‐ short‐term | 1 | 274 | Odds Ratio (M‐H, Random, 95% CI) | 2.85 [0.12, 70.59] |
| 9.3 dystonia ‐ short‐term | 1 | 274 | Odds Ratio (M‐H, Random, 95% CI) | 0.31 [0.01, 7.73] |
| 9.4 tremor ‐ short‐term | 1 | 274 | Odds Ratio (M‐H, Random, 95% CI) | 0.94 [0.06, 15.23] |
| 9.5 use of antiparkinson medication ‐ short‐term | 1 | 274 | Odds Ratio (M‐H, Random, 95% CI) | 0.0 [0.0, 0.0] |
| 10 Adverse effects: 3a. Prolactin increase ‐ associated effects Show forest plot | 1 | 243 | Odds Ratio (M‐H, Random, 95% CI) | 7.0 [0.36, 136.98] |
| Analysis 9.10  Comparison 9 Risperidone added to antidepressants versus placebo added to antidepressants for major depression, Outcome 10 Adverse effects: 3a. Prolactin increase ‐ associated effects. | ||||
| 11 Adverse effects: 3b. Prolactin ‐ change from baseline in ng/ml ‐ endpoint Show forest plot | 2 | 256 | Mean Difference (IV, Random, 95% CI) | 29.42 [19.49, 39.34] |
| Analysis 9.11  Comparison 9 Risperidone added to antidepressants versus placebo added to antidepressants for major depression, Outcome 11 Adverse effects: 3b. Prolactin ‐ change from baseline in ng/ml ‐ endpoint. | ||||
| 11.1 short‐term | 1 | 15 | Mean Difference (IV, Random, 95% CI) | 40.42 [‐2.67, 83.51] |
| 11.2 medium‐term | 1 | 241 | Mean Difference (IV, Random, 95% CI) | 28.8 [18.60, 39.00] |
| 12 Adverse effects: 4a. Significant weight gain Show forest plot | 3 | Odds Ratio (M‐H, Random, 95% CI) | Subtotals only | |
| Analysis 9.12  Comparison 9 Risperidone added to antidepressants versus placebo added to antidepressants for major depression, Outcome 12 Adverse effects: 4a. Significant weight gain. | ||||
| 12.1 ≥ 7% weight gain from baseline | 2 | 340 | Odds Ratio (M‐H, Random, 95% CI) | 3.32 [0.99, 11.12] |
| 12.2 spontaneously reported | 2 | 371 | Odds Ratio (M‐H, Random, 95% CI) | 2.12 [0.55, 8.16] |
| 13 Adverse effects: 4b. Weight ‐ change from baseline in kg Show forest plot | 4 | 633 | Mean Difference (IV, Random, 95% CI) | ‐0.09 [‐2.22, 2.04] |
| Analysis 9.13  Comparison 9 Risperidone added to antidepressants versus placebo added to antidepressants for major depression, Outcome 13 Adverse effects: 4b. Weight ‐ change from baseline in kg. | ||||
| 13.1 short‐term | 3 | 392 | Mean Difference (IV, Random, 95% CI) | ‐2.77 [‐8.03, 2.49] |
| 13.2 medium‐term | 1 | 241 | Mean Difference (IV, Random, 95% CI) | 1.80 [0.95, 2.65] |
| 14 Adverse effects: 5. Sedation Show forest plot | 4 | 637 | Odds Ratio (M‐H, Random, 95% CI) | 1.10 [0.31, 3.99] |
| Analysis 9.14  Comparison 9 Risperidone added to antidepressants versus placebo added to antidepressants for major depression, Outcome 14 Adverse effects: 5. Sedation. | ||||
| 14.1 short‐term | 3 | 394 | Odds Ratio (M‐H, Random, 95% CI) | 1.21 [0.17, 8.46] |
| 14.2 medium‐term | 1 | 243 | Odds Ratio (M‐H, Random, 95% CI) | 0.73 [0.16, 3.31] |
| Outcome or subgroup title | No. of studies | No. of participants | Statistical method | Effect size |
| 1 No clinically important response (as defined by original study) Show forest plot | 2 | 322 | Odds Ratio (M‐H, Random, 95% CI) | 0.29 [0.18, 0.46] |
| Analysis 10.1  Comparison 10 Amisulpride versus placebo for dysthymia, Outcome 1 No clinically important response (as defined by original study). | ||||
| 2 Global state: no clinically important change ‐ CGI Show forest plot | 2 | 322 | Odds Ratio (M‐H, Random, 95% CI) | 0.29 [0.18, 0.46] |
| Analysis 10.2  Comparison 10 Amisulpride versus placebo for dysthymia, Outcome 2 Global state: no clinically important change ‐ CGI. | ||||
| 3 Mental state: 1a. Depressive symptoms ‐ no clinically important change‐ MADRS < 7 Show forest plot | 1 | 212 | Odds Ratio (M‐H, Random, 95% CI) | 0.28 [0.15, 0.51] |
| Analysis 10.3  Comparison 10 Amisulpride versus placebo for dysthymia, Outcome 3 Mental state: 1a. Depressive symptoms ‐ no clinically important change‐ MADRS < 7. | ||||
| 4 Mental state: 1b. Depressive symptoms ‐ MADRS score at endpoint Show forest plot | 2 | 284 | Mean Difference (IV, Random, 95% CI) | ‐4.90 [‐6.67, ‐3.12] |
| Analysis 10.4  Comparison 10 Amisulpride versus placebo for dysthymia, Outcome 4 Mental state: 1b. Depressive symptoms ‐ MADRS score at endpoint. | ||||
| 5 Mental state: 1c. Depressive symptoms ‐ HAM‐D score at endpoint Show forest plot | 1 | 39 | Mean Difference (IV, Random, 95% CI) | ‐7.20 [‐10.08, ‐4.32] |
| Analysis 10.5  Comparison 10 Amisulpride versus placebo for dysthymia, Outcome 5 Mental state: 1c. Depressive symptoms ‐ HAM‐D score at endpoint. | ||||
| 6 Leaving the study early Show forest plot | 3 | Odds Ratio (M‐H, Random, 95% CI) | Subtotals only | |
| Analysis 10.6  Comparison 10 Amisulpride versus placebo for dysthymia, Outcome 6 Leaving the study early. | ||||
| 6.1 due to any reason | 3 | 361 | Odds Ratio (M‐H, Random, 95% CI) | 0.65 [0.38, 1.11] |
| 6.2 due to adverse events | 3 | 361 | Odds Ratio (M‐H, Random, 95% CI) | 3.85 [0.96, 15.39] |
| 6.3 due to inefficacy | 3 | 361 | Odds Ratio (M‐H, Random, 95% CI) | 0.40 [0.20, 0.83] |
| 7 Adverse effects: 1. At least one adverse effect Show forest plot | 3 | 361 | Odds Ratio (M‐H, Random, 95% CI) | 1.39 [0.71, 2.73] |
| Analysis 10.7  Comparison 10 Amisulpride versus placebo for dysthymia, Outcome 7 Adverse effects: 1. At least one adverse effect. | ||||
| 7.1 short‐term | 1 | 39 | Odds Ratio (M‐H, Random, 95% CI) | 4.58 [0.81, 25.80] |
| 7.2 medium‐term | 2 | 322 | Odds Ratio (M‐H, Random, 95% CI) | 1.20 [0.67, 2.15] |
| 8 Adverse effects: 2. Extrapyramidal effects Show forest plot | 2 | 149 | Odds Ratio (M‐H, Random, 95% CI) | 3.58 [0.74, 17.40] |
| Analysis 10.8  Comparison 10 Amisulpride versus placebo for dysthymia, Outcome 8 Adverse effects: 2. Extrapyramidal effects. | ||||
| 8.1 tremor | 1 | 39 | Odds Ratio (M‐H, Random, 95% CI) | 5.27 [0.24, 117.26] |
| 8.2 EPS in general | 1 | 110 | Odds Ratio (M‐H, Random, 95% CI) | 3.13 [0.50, 19.63] |
| 9 Adverse effects: 3. Prolactin associated effects Show forest plot | 2 | Odds Ratio (M‐H, Random, 95% CI) | Subtotals only | |
| Analysis 10.9  Comparison 10 Amisulpride versus placebo for dysthymia, Outcome 9 Adverse effects: 3. Prolactin associated effects. | ||||
| 9.1 galactorrhoea | 1 | 212 | Odds Ratio (M‐H, Random, 95% CI) | 11.99 [0.65, 219.71] |
| 9.2 menstrual disorder | 1 | 212 | Odds Ratio (M‐H, Random, 95% CI) | 10.14 [1.26, 81.50] |
| 9.3 general | 1 | 84 | Odds Ratio (M‐H, Random, 95% CI) | 8.65 [1.01, 73.75] |
| 10 Adverse effects: 4. Significant weight gain ‐ spontaneously reported Show forest plot | 1 | 212 | Odds Ratio (M‐H, Random, 95% CI) | 6.55 [0.77, 55.38] |
| Analysis 10.10  Comparison 10 Amisulpride versus placebo for dysthymia, Outcome 10 Adverse effects: 4. Significant weight gain ‐ spontaneously reported. | ||||
| Outcome or subgroup title | No. of studies | No. of participants | Statistical method | Effect size |
| 1 No clinically important response ‐ as defined by original study Show forest plot | 4 | 957 | Odds Ratio (M‐H, Random, 95% CI) | 0.61 [0.38, 0.99] |
| Analysis 11.1  Comparison 11 Amisulpride versus antidepressants for dysthymia, Outcome 1 No clinically important response ‐ as defined by original study. | ||||
| 1.1 short‐term | 1 | 313 | Odds Ratio (M‐H, Random, 95% CI) | 0.61 [0.35, 1.07] |
| 1.2 medium‐term | 3 | 644 | Odds Ratio (M‐H, Random, 95% CI) | 0.60 [0.30, 1.19] |
| 2 Global state: no clinically important change ‐ CGI Show forest plot | 4 | 957 | Odds Ratio (M‐H, Random, 95% CI) | 0.52 [0.32, 0.86] |
| Analysis 11.2  Comparison 11 Amisulpride versus antidepressants for dysthymia, Outcome 2 Global state: no clinically important change ‐ CGI. | ||||
| 2.1 short‐term | 1 | 313 | Odds Ratio (M‐H, Random, 95% CI) | 0.50 [0.28, 0.90] |
| 2.2 medium‐term | 3 | 644 | Odds Ratio (M‐H, Random, 95% CI) | 0.52 [0.26, 1.06] |
| 3 Service use ‐ number of patients rehospitalised Show forest plot | 2 | 528 | Odds Ratio (M‐H, Random, 95% CI) | 5.91 [0.73, 48.09] |
| Analysis 11.3  Comparison 11 Amisulpride versus antidepressants for dysthymia, Outcome 3 Service use ‐ number of patients rehospitalised. | ||||
| 4 Mental state: 1a. Depressive symptoms ‐ MADRS ‐ score at endpoint Show forest plot | 4 | 902 | Mean Difference (IV, Random, 95% CI) | ‐1.28 [‐2.75, 0.18] |
| Analysis 11.4  Comparison 11 Amisulpride versus antidepressants for dysthymia, Outcome 4 Mental state: 1a. Depressive symptoms ‐ MADRS ‐ score at endpoint. | ||||
| 4.1 short‐term | 1 | 306 | Mean Difference (IV, Random, 95% CI) | ‐1.10 [‐2.84, 0.64] |
| 4.2 medium‐term | 3 | 596 | Mean Difference (IV, Random, 95% CI) | ‐1.60 [‐3.97, 0.78] |
| 5 Mental state: 1b. No clinically important change ‐ at least 50% HAM‐D reduction Show forest plot | 1 | 313 | Odds Ratio (M‐H, Random, 95% CI) | 0.61 [0.35, 1.07] |
| Analysis 11.5  Comparison 11 Amisulpride versus antidepressants for dysthymia, Outcome 5 Mental state: 1b. No clinically important change ‐ at least 50% HAM‐D reduction. | ||||
| 6 Mental state: 1c. No clinically important change ‐ at least 25% HAM‐D reduction Show forest plot | 1 | 313 | Odds Ratio (M‐H, Random, 95% CI) | 0.20 [0.09, 0.41] |
| Analysis 11.6  Comparison 11 Amisulpride versus antidepressants for dysthymia, Outcome 6 Mental state: 1c. No clinically important change ‐ at least 25% HAM‐D reduction. | ||||
| 7 Mental state: 1d. Depressive symptoms ‐ HAM‐D score at endpoint Show forest plot | 1 | 306 | Mean Difference (IV, Random, 95% CI) | ‐0.90 [‐2.24, 0.44] |
| Analysis 11.7  Comparison 11 Amisulpride versus antidepressants for dysthymia, Outcome 7 Mental state: 1d. Depressive symptoms ‐ HAM‐D score at endpoint. | ||||
| 8 Mental state: 2. Anxiety symptoms‐ HAM‐A score at endpoint Show forest plot | 3 | 824 | Mean Difference (IV, Random, 95% CI) | ‐0.98 [‐2.33, 0.38] |
| Analysis 11.8  Comparison 11 Amisulpride versus antidepressants for dysthymia, Outcome 8 Mental state: 2. Anxiety symptoms‐ HAM‐A score at endpoint. | ||||
| 8.1 short‐term | 1 | 306 | Mean Difference (IV, Random, 95% CI) | ‐0.90 [‐2.25, 0.45] |
| 8.2 medium‐term | 2 | 518 | Mean Difference (IV, Random, 95% CI) | ‐1.04 [‐3.69, 1.60] |
| 9 Leaving the study early Show forest plot | 4 | Odds Ratio (M‐H, Random, 95% CI) | Subtotals only | |
| Analysis 11.9  Comparison 11 Amisulpride versus antidepressants for dysthymia, Outcome 9 Leaving the study early. | ||||
| 9.1 due to any reason | 4 | 957 | Odds Ratio (M‐H, Random, 95% CI) | 0.74 [0.55, 1.00] |
| 9.2 due to adverse events | 4 | 957 | Odds Ratio (M‐H, Random, 95% CI) | 1.17 [0.74, 1.86] |
| 9.3 due to inefficacy | 3 | 644 | Odds Ratio (M‐H, Random, 95% CI) | 0.93 [0.30, 2.83] |
| 10 Adverse effects: 1. At least one adverse effect Show forest plot | 4 | 957 | Odds Ratio (M‐H, Random, 95% CI) | 0.95 [0.73, 1.25] |
| Analysis 11.10  Comparison 11 Amisulpride versus antidepressants for dysthymia, Outcome 10 Adverse effects: 1. At least one adverse effect. | ||||
| 10.1 short‐term | 1 | 313 | Odds Ratio (M‐H, Random, 95% CI) | 0.89 [0.57, 1.39] |
| 10.2 medium‐term | 3 | 644 | Odds Ratio (M‐H, Random, 95% CI) | 0.96 [0.63, 1.46] |
| 11 Adverse effects: 2.Death ‐ suicide attempt Show forest plot | 1 | 253 | Odds Ratio (M‐H, Random, 95% CI) | 0.17 [0.01, 4.30] |
| Analysis 11.11  Comparison 11 Amisulpride versus antidepressants for dysthymia, Outcome 11 Adverse effects: 2.Death ‐ suicide attempt. | ||||
| 12 Adverse effects: 3. Extrapyramidal effects Show forest plot | 3 | Odds Ratio (M‐H, Random, 95% CI) | Subtotals only | |
| Analysis 11.12  Comparison 11 Amisulpride versus antidepressants for dysthymia, Outcome 12 Adverse effects: 3. Extrapyramidal effects. | ||||
| 12.1 tremor | 1 | 253 | Odds Ratio (M‐H, Random, 95% CI) | 0.05 [0.00, 0.82] |
| 12.2 EPS in general | 3 | 644 | Odds Ratio (M‐H, Random, 95% CI) | 0.68 [0.09, 4.86] |
| 13 Adverse effects: 4. Significant weight gain Show forest plot | 2 | Odds Ratio (M‐H, Random, 95% CI) | Subtotals only | |
| Analysis 11.13  Comparison 11 Amisulpride versus antidepressants for dysthymia, Outcome 13 Adverse effects: 4. Significant weight gain. | ||||
| 13.1 ≥ 5% weight gain from baseline | 2 | 534 | Odds Ratio (M‐H, Random, 95% CI) | 2.23 [1.21, 4.13] |
| 13.2 spontaneously reported | 1 | 253 | Odds Ratio (M‐H, Random, 95% CI) | 1.29 [0.65, 2.57] |
| 14 Adverse effects: 5. Prolactin associated effects ‐ amenorrhoea Show forest plot | 2 | 236 | Odds Ratio (M‐H, Random, 95% CI) | 7.07 [1.60, 31.29] |
| Analysis 11.14  Comparison 11 Amisulpride versus antidepressants for dysthymia, Outcome 14 Adverse effects: 5. Prolactin associated effects ‐ amenorrhoea. | ||||
| 15 Adverse effects: 6. Sedation Show forest plot | 2 | 531 | Odds Ratio (M‐H, Random, 95% CI) | 0.70 [0.08, 6.42] |
| Analysis 11.15  Comparison 11 Amisulpride versus antidepressants for dysthymia, Outcome 15 Adverse effects: 6. Sedation. | ||||
| Outcome or subgroup title | No. of studies | No. of participants | Statistical method | Effect size |
| 1 Mental state: 1b. Depressive symptoms ‐ MADRS score at endpoint Show forest plot | 2 | 1070 | Mean Difference (IV, Random, 95% CI) | ‐2.18 [‐3.35, ‐1.00] |
| Analysis 12.1  Comparison 12 Sensitivity analysis ‐ imputed statistics excluded ‐ 3. Quetiapine versus placebo for major depression, Outcome 1 Mental state: 1b. Depressive symptoms ‐ MADRS score at endpoint. | ||||
| 1.1 short‐term | 1 | 299 | Mean Difference (IV, Random, 95% CI) | ‐3.39 [‐5.95, ‐0.83] |
| 1.2 long‐term | 1 | 771 | Mean Difference (IV, Random, 95% CI) | ‐1.88 [‐1.00, ‐0.76] |
| 2 Mental state: 1c. Depressive symptoms ‐ HAM‐D score at endpoint Show forest plot | 1 | 299 | Mean Difference (IV, Random, 95% CI) | ‐2.40 [‐5.79, 0.99] |
| Analysis 12.2  Comparison 12 Sensitivity analysis ‐ imputed statistics excluded ‐ 3. Quetiapine versus placebo for major depression, Outcome 2 Mental state: 1c. Depressive symptoms ‐ HAM‐D score at endpoint. | ||||
| 3 Mental state: 2. Anxiety symptoms ‐ HAM‐A score at endpoint Show forest plot | 2 | 1070 | Mean Difference (IV, Random, 95% CI) | ‐1.39 [‐2.11, ‐0.68] |
| Analysis 12.3  Comparison 12 Sensitivity analysis ‐ imputed statistics excluded ‐ 3. Quetiapine versus placebo for major depression, Outcome 3 Mental state: 2. Anxiety symptoms ‐ HAM‐A score at endpoint. | ||||
| 3.1 short‐term | 1 | 299 | Mean Difference (IV, Random, 95% CI) | ‐1.44 [‐2.88, ‐0.00] |
| 3.2 long‐term | 1 | 771 | Mean Difference (IV, Random, 95% CI) | ‐1.38 [‐2.20, ‐0.56] |
| Outcome or subgroup title | No. of studies | No. of participants | Statistical method | Effect size |
| 1 Mental state: 1a. Depressive symptoms ‐ MADRS ‐ score at endpoint Show forest plot | 3 | 824 | Mean Difference (IV, Random, 95% CI) | ‐0.89 [‐2.01, 0.23] |
| Analysis 13.1  Comparison 13 Sensitivity analysis ‐ imputed statistics excluded ‐ 4. Amisulpride versus antidepressants for dysthymia, Outcome 1 Mental state: 1a. Depressive symptoms ‐ MADRS ‐ score at endpoint. | ||||
| 1.1 short‐term | 1 | 306 | Mean Difference (IV, Random, 95% CI) | ‐1.10 [‐2.84, 0.64] |
| 1.2 medium‐term | 2 | 518 | Mean Difference (IV, Random, 95% CI) | ‐0.74 [‐2.20, 0.73] |
| Outcome or subgroup title | No. of studies | No. of participants | Statistical method | Effect size |
| 1 Mental state: 1b. Depressive symptoms ‐ MADRS score at endpoint Show forest plot | 2 | 302 | Mean Difference (IV, Random, 95% CI) | 0.38 [‐1.86, 2.62] |
| Analysis 14.1  Comparison 14 Sensitivity analysis ‐ imputed statistics excluded ‐ 6. Olanzapine versus antidepressants for major depression ‐ all data short‐term, Outcome 1 Mental state: 1b. Depressive symptoms ‐ MADRS score at endpoint. | ||||
| 2 Mental state: 2. Anxiety symptoms ‐ HAM‐A score at endpoint Show forest plot | 2 | 302 | Mean Difference (IV, Random, 95% CI) | 0.78 [‐0.77, 2.34] |
| Analysis 14.2  Comparison 14 Sensitivity analysis ‐ imputed statistics excluded ‐ 6. Olanzapine versus antidepressants for major depression ‐ all data short‐term, Outcome 2 Mental state: 2. Anxiety symptoms ‐ HAM‐A score at endpoint. | ||||
| 3 Adverse effects: 4. Prolactin ‐ change from baseline in ng/ml Show forest plot | 1 | 301 | Mean Difference (IV, Random, 95% CI) | 4.1 [1.35, 6.85] |
| Analysis 14.3  Comparison 14 Sensitivity analysis ‐ imputed statistics excluded ‐ 6. Olanzapine versus antidepressants for major depression ‐ all data short‐term, Outcome 3 Adverse effects: 4. Prolactin ‐ change from baseline in ng/ml. | ||||
| Outcome or subgroup title | No. of studies | No. of participants | Statistical method | Effect size |
| 1 Mental state: 1b. Depressive symptoms ‐ MADRS score at endpoint Show forest plot | 2 | 303 | Mean Difference (IV, Random, 95% CI) | ‐3.50 [‐7.62, 0.61] |
| Analysis 15.1  Comparison 15 Sensitivity analysis ‐ imputed statistics excluded ‐ 9. Olanzapine added to antidepressants versus placebo added to antidepressants for major depression ‐ all data short‐term, Outcome 1 Mental state: 1b. Depressive symptoms ‐ MADRS score at endpoint. | ||||
| 2 Mental state: 2. Anxiety symptoms ‐ HAM‐A score at endpoint Show forest plot | 2 | 303 | Mean Difference (IV, Random, 95% CI) | ‐1.27 [‐4.41, 1.86] |
| Analysis 15.2  Comparison 15 Sensitivity analysis ‐ imputed statistics excluded ‐ 9. Olanzapine added to antidepressants versus placebo added to antidepressants for major depression ‐ all data short‐term, Outcome 2 Mental state: 2. Anxiety symptoms ‐ HAM‐A score at endpoint. | ||||
| 3 Adverse effects: 4. Prolactin ‐ change from baseline in ng/ml Show forest plot | 1 | 301 | Mean Difference (IV, Random, 95% CI) | 2.5 [0.41, 4.59] |
| Analysis 15.3  Comparison 15 Sensitivity analysis ‐ imputed statistics excluded ‐ 9. Olanzapine added to antidepressants versus placebo added to antidepressants for major depression ‐ all data short‐term, Outcome 3 Adverse effects: 4. Prolactin ‐ change from baseline in ng/ml. | ||||
| Outcome or subgroup title | No. of studies | No. of participants | Statistical method | Effect size |
| 1 Mental state: 1b. Depressive symptoms ‐ MADRS score at endpoint Show forest plot | 1 | 432 | Mean Difference (IV, Random, 95% CI) | ‐2.46 [‐4.33, ‐0.59] |
| Analysis 16.1  Comparison 16 Sensitivity analysis ‐ imputed statistics excluded ‐ 10. Quetiapine added to antidepressants versus placebo added to antidepressants for major depression ‐ all data short‐term, Outcome 1 Mental state: 1b. Depressive symptoms ‐ MADRS score at endpoint. | ||||
| 2 Mental state: 1d. Depressive symptoms‐ HAM‐D score at endpoint Show forest plot | 1 | 432 | Mean Difference (IV, Random, 95% CI) | ‐2.28 [‐3.97, ‐0.59] |
| Analysis 16.2  Comparison 16 Sensitivity analysis ‐ imputed statistics excluded ‐ 10. Quetiapine added to antidepressants versus placebo added to antidepressants for major depression ‐ all data short‐term, Outcome 2 Mental state: 1d. Depressive symptoms‐ HAM‐D score at endpoint. | ||||
| 3 Mental state: 2b. Anxiety symptoms ‐ HAM‐A score at endpoint Show forest plot | 1 | 432 | Mean Difference (IV, Random, 95% CI) | ‐1.30 [‐2.72, 0.12] |
| Analysis 16.3  Comparison 16 Sensitivity analysis ‐ imputed statistics excluded ‐ 10. Quetiapine added to antidepressants versus placebo added to antidepressants for major depression ‐ all data short‐term, Outcome 3 Mental state: 2b. Anxiety symptoms ‐ HAM‐A score at endpoint. | ||||
| 4 Adverse effects: 3b. Weight ‐ change from baseline in kg Show forest plot | 1 | 491 | Mean Difference (IV, Random, 95% CI) | 0.95 [0.49, 1.41] |
| Analysis 16.4  Comparison 16 Sensitivity analysis ‐ imputed statistics excluded ‐ 10. Quetiapine added to antidepressants versus placebo added to antidepressants for major depression ‐ all data short‐term, Outcome 4 Adverse effects: 3b. Weight ‐ change from baseline in kg. | ||||
| Outcome or subgroup title | No. of studies | No. of participants | Statistical method | Effect size |
| 1 Mental state: 1c. Depressive symptoms ‐ HAM‐D score at endpoint Show forest plot | 1 | 241 | Mean Difference (IV, Random, 95% CI) | ‐0.30 [‐2.43, 1.83] |
| Analysis 17.1  Comparison 17 Sensitivity analysis ‐ imputed statistics excluded ‐ 11. Risperidone added to antidepressants versus placebo added to antidepressants for major depression, Outcome 1 Mental state: 1c. Depressive symptoms ‐ HAM‐D score at endpoint. | ||||

Methodological quality graph: review authors' judgements about each methodological quality item presented as percentages across all included studies.

Methodological quality summary: review authors' judgements about each methodological quality item for each included study.

Comparison 1 Amisulpride versus antidepressants for major depression ‐ all data short‐term, Outcome 1 No clinically important response to treatment (as defined by original study).

Comparison 1 Amisulpride versus antidepressants for major depression ‐ all data short‐term, Outcome 2 Global state: no clinically important change ‐ CGI.

Comparison 1 Amisulpride versus antidepressants for major depression ‐ all data short‐term, Outcome 3 Mental state: 1a. Depressive symptoms ‐ no clinically important change ‐ MADRS.

Comparison 1 Amisulpride versus antidepressants for major depression ‐ all data short‐term, Outcome 4 Mental state: 1b. Depressive symptoms ‐ no clinically important change ‐ HAM‐D.

Comparison 1 Amisulpride versus antidepressants for major depression ‐ all data short‐term, Outcome 5 Mental state: 1c. Depressive symptoms ‐ MADRS score at endpoint.

Comparison 1 Amisulpride versus antidepressants for major depression ‐ all data short‐term, Outcome 6 Mental state: 1d. Depressive symptoms ‐ HAM‐D score at endpoint.

Comparison 1 Amisulpride versus antidepressants for major depression ‐ all data short‐term, Outcome 7 Leaving the study early.

Comparison 1 Amisulpride versus antidepressants for major depression ‐ all data short‐term, Outcome 8 Adverse effects: 1. At least one adverse effect.

Comparison 2 Aripiprazole added to antidepressants versus placebo added to antidepressants for major depression ‐ all data short‐term, Outcome 1 No clinically important response (as defined by original study).

Comparison 2 Aripiprazole added to antidepressants versus placebo added to antidepressants for major depression ‐ all data short‐term, Outcome 2 Global state: no clinically important change ‐ CGI.

Comparison 2 Aripiprazole added to antidepressants versus placebo added to antidepressants for major depression ‐ all data short‐term, Outcome 3 Remission ‐ number of people without remission ‐ as defined by the original study.

Comparison 2 Aripiprazole added to antidepressants versus placebo added to antidepressants for major depression ‐ all data short‐term, Outcome 4 Mental state: 1a. Depressive symptoms ‐ MADRS score at endpoint.

Comparison 2 Aripiprazole added to antidepressants versus placebo added to antidepressants for major depression ‐ all data short‐term, Outcome 5 Leaving the study early.
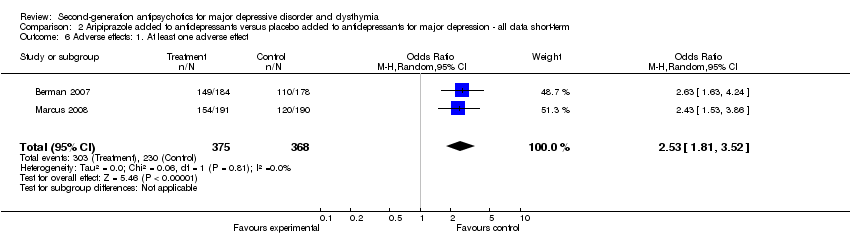
Comparison 2 Aripiprazole added to antidepressants versus placebo added to antidepressants for major depression ‐ all data short‐term, Outcome 6 Adverse effects: 1. At least one adverse effect.

Comparison 2 Aripiprazole added to antidepressants versus placebo added to antidepressants for major depression ‐ all data short‐term, Outcome 7 Adverse effects: 2. Death.

Comparison 2 Aripiprazole added to antidepressants versus placebo added to antidepressants for major depression ‐ all data short‐term, Outcome 8 Adverse effects: 3a. Extrapyramidal effects.

Comparison 2 Aripiprazole added to antidepressants versus placebo added to antidepressants for major depression ‐ all data short‐term, Outcome 9 Adverse effects: 4a. Significant weight gain.

Comparison 2 Aripiprazole added to antidepressants versus placebo added to antidepressants for major depression ‐ all data short‐term, Outcome 10 Adverse effects: 4b. Weight ‐ change from baseline in kg.

Comparison 2 Aripiprazole added to antidepressants versus placebo added to antidepressants for major depression ‐ all data short‐term, Outcome 11 Adverse effects: 5. Sedation.

Comparison 3 Olanzapine versus placebo for psychotic depression ‐ all data short‐term, Outcome 1 No clinically important response to treatment (as defined by original study).

Comparison 3 Olanzapine versus placebo for psychotic depression ‐ all data short‐term, Outcome 2 Remission ‐ number of participants without remission ‐ as defined by the original study.

Comparison 3 Olanzapine versus placebo for psychotic depression ‐ all data short‐term, Outcome 3 Mental state: 1. Depressive symptoms ‐ HAM‐D score at endpoint.

Comparison 3 Olanzapine versus placebo for psychotic depression ‐ all data short‐term, Outcome 4 Mental state: 2. Anxiety symptoms ‐ HAM‐A score at endpoint.

Comparison 3 Olanzapine versus placebo for psychotic depression ‐ all data short‐term, Outcome 5 Leaving the study early.

Comparison 3 Olanzapine versus placebo for psychotic depression ‐ all data short‐term, Outcome 6 Adverse effects: 1. At least one adverse effect.

Comparison 3 Olanzapine versus placebo for psychotic depression ‐ all data short‐term, Outcome 7 Adverse effects: 2. Prolactin increase ‐ number of participants with significant increase ‐ as defined by the original study.

Comparison 3 Olanzapine versus placebo for psychotic depression ‐ all data short‐term, Outcome 8 Adverse effects: 3a. Significant weight gain ‐ spontaneously reported.

Comparison 3 Olanzapine versus placebo for psychotic depression ‐ all data short‐term, Outcome 9 Adverse effects: 3b. Weight ‐ change from baseline in kg.

Comparison 3 Olanzapine versus placebo for psychotic depression ‐ all data short‐term, Outcome 10 Adverse effects: 4. Sedation.

Comparison 4 Olanzapine versus antidepressants for major depression ‐ all data short‐term, Outcome 1 No clinically important response to treatment (as defined by original study).

Comparison 4 Olanzapine versus antidepressants for major depression ‐ all data short‐term, Outcome 2 Remission ‐ number of participants without remission ‐ as defined by the original study.

Comparison 4 Olanzapine versus antidepressants for major depression ‐ all data short‐term, Outcome 3 Mental state: 1a. Depressive symptoms ‐ no clinically important change ‐ at least 50% MADRS reduction.

Comparison 4 Olanzapine versus antidepressants for major depression ‐ all data short‐term, Outcome 4 Mental state: 1b. Depressive symptoms ‐ MADRS score at endpoint.

Comparison 4 Olanzapine versus antidepressants for major depression ‐ all data short‐term, Outcome 5 Mental state: 1c. Depressive symptoms ‐ HAM‐D score at endpoint.

Comparison 4 Olanzapine versus antidepressants for major depression ‐ all data short‐term, Outcome 6 Mental state: 2. Anxiety symptoms ‐ HAM‐A score at endpoint.
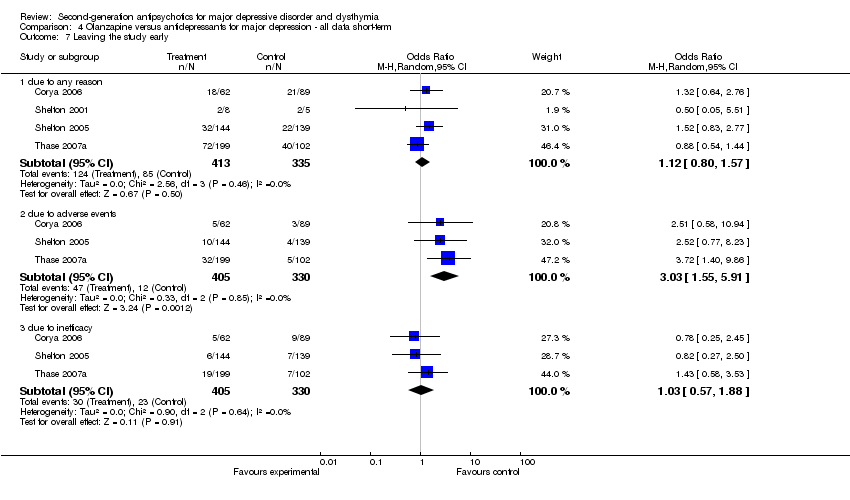
Comparison 4 Olanzapine versus antidepressants for major depression ‐ all data short‐term, Outcome 7 Leaving the study early.

Comparison 4 Olanzapine versus antidepressants for major depression ‐ all data short‐term, Outcome 8 Adverse effects: 1. At least one adverse effect.

Comparison 4 Olanzapine versus antidepressants for major depression ‐ all data short‐term, Outcome 9 Adverse effects: 2. Death ‐ natural cause.

Comparison 4 Olanzapine versus antidepressants for major depression ‐ all data short‐term, Outcome 10 Adverse effects: 3. Extrapyramidal effects ‐ tremor.

Comparison 4 Olanzapine versus antidepressants for major depression ‐ all data short‐term, Outcome 11 Adverse effects: 4. Prolactin ‐ change from baseline in ng/ml.

Comparison 4 Olanzapine versus antidepressants for major depression ‐ all data short‐term, Outcome 12 Adverse effects: 5a. Significant weight gain.

Comparison 4 Olanzapine versus antidepressants for major depression ‐ all data short‐term, Outcome 13 Adverse effects: 5b. Weight ‐ change from baseline in kg.

Comparison 4 Olanzapine versus antidepressants for major depression ‐ all data short‐term, Outcome 14 Adverse effects: 6. Sedation.

Comparison 5 Olanzapine added to antidepressants versus placebo added to antidepressants for major depression ‐ all data short‐term, Outcome 1 No clinically important response ‐ as defined by original study.

Comparison 5 Olanzapine added to antidepressants versus placebo added to antidepressants for major depression ‐ all data short‐term, Outcome 2 Remission ‐ number of people without remission ‐ as defined by the original study.

Comparison 5 Olanzapine added to antidepressants versus placebo added to antidepressants for major depression ‐ all data short‐term, Outcome 3 Mental state: 1a. No clinically important change ‐ at least 50% MADRS total score reduction.

Comparison 5 Olanzapine added to antidepressants versus placebo added to antidepressants for major depression ‐ all data short‐term, Outcome 4 Mental state: 1b. Depressive symptoms ‐ MADRS score at endpoint.

Comparison 5 Olanzapine added to antidepressants versus placebo added to antidepressants for major depression ‐ all data short‐term, Outcome 5 Mental state: 1c. Depressive symptoms ‐ HAM‐D score at endpoint.

Comparison 5 Olanzapine added to antidepressants versus placebo added to antidepressants for major depression ‐ all data short‐term, Outcome 6 Mental state: 2. Anxiety symptoms ‐ HAM‐A score at endpoint.

Comparison 5 Olanzapine added to antidepressants versus placebo added to antidepressants for major depression ‐ all data short‐term, Outcome 7 Leaving the study early.

Comparison 5 Olanzapine added to antidepressants versus placebo added to antidepressants for major depression ‐ all data short‐term, Outcome 8 Adverse effects: 1. At least one adverse effect.

Comparison 5 Olanzapine added to antidepressants versus placebo added to antidepressants for major depression ‐ all data short‐term, Outcome 9 Adverse effects: 2. Death.

Comparison 5 Olanzapine added to antidepressants versus placebo added to antidepressants for major depression ‐ all data short‐term, Outcome 10 Adverse effects: 3. Extrapyramidal effects ‐ tremor.

Comparison 5 Olanzapine added to antidepressants versus placebo added to antidepressants for major depression ‐ all data short‐term, Outcome 11 Adverse effects: 4. Prolactin ‐ change from baseline in ng/ml.

Comparison 5 Olanzapine added to antidepressants versus placebo added to antidepressants for major depression ‐ all data short‐term, Outcome 12 Adverse effects: 5a. Significant weight gain.

Comparison 5 Olanzapine added to antidepressants versus placebo added to antidepressants for major depression ‐ all data short‐term, Outcome 13 Adverse effects: 5b. Weight ‐ change from baseline in kg.

Comparison 5 Olanzapine added to antidepressants versus placebo added to antidepressants for major depression ‐ all data short‐term, Outcome 14 Adverse effects: 6. Sedation.

Comparison 6 Quetiapine versus placebo for major depression, Outcome 1 Non‐response to treatment ‐ as defined by the original study.

Comparison 6 Quetiapine versus placebo for major depression, Outcome 2 Global state: no clinically important change ‐ CGI.

Comparison 6 Quetiapine versus placebo for major depression, Outcome 3 Remission ‐ number of participants without remission ‐ as defined by the original study.

Comparison 6 Quetiapine versus placebo for major depression, Outcome 4 Relapse.

Comparison 6 Quetiapine versus placebo for major depression, Outcome 5 Mental state: 1a. Depressive symptoms ‐ no clinically important change‐ MADRS.

Comparison 6 Quetiapine versus placebo for major depression, Outcome 6 Mental state: 1b. Depressive symptoms ‐ MADRS score at endpoint.

Comparison 6 Quetiapine versus placebo for major depression, Outcome 7 Mental state: 1c. Depressive symptoms ‐ HAM‐D score at endpoint.

Comparison 6 Quetiapine versus placebo for major depression, Outcome 8 Mental state: 2. Anxiety symptoms ‐ HAM‐A score at endpoint.

Comparison 6 Quetiapine versus placebo for major depression, Outcome 9 Leaving the study early ‐ due to adverse events.

Comparison 6 Quetiapine versus placebo for major depression, Outcome 10 Adverse effects: 1. Death ‐ suicidal thoughts ‐ MADRS item 10 of at least 4.

Comparison 6 Quetiapine versus placebo for major depression, Outcome 11 Adverse effects: 2. Extrapyramidal effects ‐ general EPS.

Comparison 6 Quetiapine versus placebo for major depression, Outcome 12 Adverse effects: 3. Prolactin ‐ change from baseline in ng/ml.

Comparison 6 Quetiapine versus placebo for major depression, Outcome 13 Adverse effects: 4a. Significant weight gain.

Comparison 6 Quetiapine versus placebo for major depression, Outcome 14 Adverse effects: 4b. Weight ‐ change from baseline in kg.

Comparison 6 Quetiapine versus placebo for major depression, Outcome 15 Adverse effects: 5. Sedation.

Comparison 7 Quetiapine versus antidepressants for major depression ‐ all data short‐term, Outcome 1 No clinically important response to treatment (as defined by original study).

Comparison 7 Quetiapine versus antidepressants for major depression ‐ all data short‐term, Outcome 2 Global state: no clinically important change ‐ CGI.

Comparison 7 Quetiapine versus antidepressants for major depression ‐ all data short‐term, Outcome 3 Remission ‐ number of participants without remission.

Comparison 7 Quetiapine versus antidepressants for major depression ‐ all data short‐term, Outcome 4 Mental state: 1a. No clinically important change‐ MADRS.

Comparison 7 Quetiapine versus antidepressants for major depression ‐ all data short‐term, Outcome 5 Mental state: 1b. Depressive symptoms ‐ MADRS score at endpoint.

Comparison 7 Quetiapine versus antidepressants for major depression ‐ all data short‐term, Outcome 6 Mental state: 1c. Depressive symptoms ‐ HAM‐D score at endpoint.

Comparison 7 Quetiapine versus antidepressants for major depression ‐ all data short‐term, Outcome 7 Mental state: 2. Anxiety symptoms ‐ HAM‐A score at endpoint.

Comparison 7 Quetiapine versus antidepressants for major depression ‐ all data short‐term, Outcome 8 Leaving the study early ‐ due to adverse events.

Comparison 7 Quetiapine versus antidepressants for major depression ‐ all data short‐term, Outcome 9 Adverse effects: 1. Extrapyramidal effects ‐ general EPS.

Comparison 7 Quetiapine versus antidepressants for major depression ‐ all data short‐term, Outcome 10 Adverse effects: 2. Prolactin ‐ change from baseline in ng/ml.

Comparison 7 Quetiapine versus antidepressants for major depression ‐ all data short‐term, Outcome 11 Adverse effects: 3a. Significant weight gain ‐ ≥7% from baseline.

Comparison 7 Quetiapine versus antidepressants for major depression ‐ all data short‐term, Outcome 12 Adverse effects: 3b. Weight ‐ change from baseline in ng/ml.

Comparison 7 Quetiapine versus antidepressants for major depression ‐ all data short‐term, Outcome 13 Adverse effects: 4. Sedation.

Comparison 8 Quetiapine added to antidepressants versus placebo added to antidepressants for major depression ‐ all data short‐term, Outcome 1 No clinically important response (as defined by original study).

Comparison 8 Quetiapine added to antidepressants versus placebo added to antidepressants for major depression ‐ all data short‐term, Outcome 2 Global state: no clinically important change ‐ CGI.

Comparison 8 Quetiapine added to antidepressants versus placebo added to antidepressants for major depression ‐ all data short‐term, Outcome 3 Remission ‐ number of people without remission ‐ as defined by the original study.

Comparison 8 Quetiapine added to antidepressants versus placebo added to antidepressants for major depression ‐ all data short‐term, Outcome 4 Mental state: 1a. Depressive symptoms ‐ no clinically important change ‐ MADRS.

Comparison 8 Quetiapine added to antidepressants versus placebo added to antidepressants for major depression ‐ all data short‐term, Outcome 5 Mental state: 1b. Depressive symptoms ‐ MADRS score at endpoint.

Comparison 8 Quetiapine added to antidepressants versus placebo added to antidepressants for major depression ‐ all data short‐term, Outcome 6 Mental state: 1c. Depressive symptoms ‐ no clinically important change ‐ HAM‐D.

Comparison 8 Quetiapine added to antidepressants versus placebo added to antidepressants for major depression ‐ all data short‐term, Outcome 7 Mental state: 1d. Depressive symptoms ‐ HAM‐D score at endpoint.

Comparison 8 Quetiapine added to antidepressants versus placebo added to antidepressants for major depression ‐ all data short‐term, Outcome 8 Mental state: 2a. Anxiety symptoms ‐ no clinically important change ‐ HAM‐A.

Comparison 8 Quetiapine added to antidepressants versus placebo added to antidepressants for major depression ‐ all data short‐term, Outcome 9 Mental state: 2b. Anxiety symptoms ‐ HAM‐A score at endpoint.

Comparison 8 Quetiapine added to antidepressants versus placebo added to antidepressants for major depression ‐ all data short‐term, Outcome 10 Leaving the study early.

Comparison 8 Quetiapine added to antidepressants versus placebo added to antidepressants for major depression ‐ all data short‐term, Outcome 11 Adverse effects: 1. Extrapyramidal symptoms.

Comparison 8 Quetiapine added to antidepressants versus placebo added to antidepressants for major depression ‐ all data short‐term, Outcome 12 Adverse effects: 2. Prolactin ‐ change from baseline in ng/ml.

Comparison 8 Quetiapine added to antidepressants versus placebo added to antidepressants for major depression ‐ all data short‐term, Outcome 13 Adverse effects: 3a. Significant weight gain.

Comparison 8 Quetiapine added to antidepressants versus placebo added to antidepressants for major depression ‐ all data short‐term, Outcome 14 Adverse effects: 3b. Weight ‐ change from baseline in kg.

Comparison 8 Quetiapine added to antidepressants versus placebo added to antidepressants for major depression ‐ all data short‐term, Outcome 15 Adverse effects: 4. Sedation.

Comparison 9 Risperidone added to antidepressants versus placebo added to antidepressants for major depression, Outcome 1 No clinically important response (as defined by original study).

Comparison 9 Risperidone added to antidepressants versus placebo added to antidepressants for major depression, Outcome 2 Remission ‐ number of participants without remission ‐ as defined by the original study.

Comparison 9 Risperidone added to antidepressants versus placebo added to antidepressants for major depression, Outcome 3 Relapse (as defined by the original study).

Comparison 9 Risperidone added to antidepressants versus placebo added to antidepressants for major depression, Outcome 4 Mental state: 1a. Depressive symptoms ‐ MADRS score at endpoint.

Comparison 9 Risperidone added to antidepressants versus placebo added to antidepressants for major depression, Outcome 5 Mental state: 1b. Depressive symptoms ‐ no clinically important change ‐ HAM‐D.

Comparison 9 Risperidone added to antidepressants versus placebo added to antidepressants for major depression, Outcome 6 Mental state: 1c. Depressive symptoms ‐ HAM‐D score at endpoint.

Comparison 9 Risperidone added to antidepressants versus placebo added to antidepressants for major depression, Outcome 7 Leaving the study early.

Comparison 9 Risperidone added to antidepressants versus placebo added to antidepressants for major depression, Outcome 8 Adverse effects: 1. At least one adverse effect.

Comparison 9 Risperidone added to antidepressants versus placebo added to antidepressants for major depression, Outcome 9 Adverse effects: 2a. Extrapyramidal effects ‐ tremor.

Comparison 9 Risperidone added to antidepressants versus placebo added to antidepressants for major depression, Outcome 10 Adverse effects: 3a. Prolactin increase ‐ associated effects.

Comparison 9 Risperidone added to antidepressants versus placebo added to antidepressants for major depression, Outcome 11 Adverse effects: 3b. Prolactin ‐ change from baseline in ng/ml ‐ endpoint.

Comparison 9 Risperidone added to antidepressants versus placebo added to antidepressants for major depression, Outcome 12 Adverse effects: 4a. Significant weight gain.
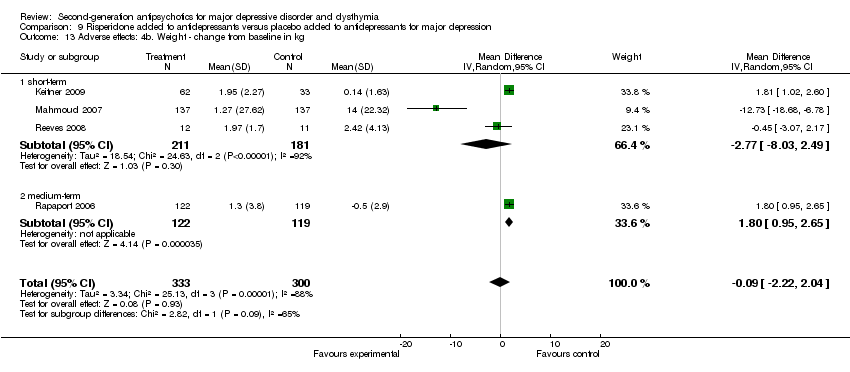
Comparison 9 Risperidone added to antidepressants versus placebo added to antidepressants for major depression, Outcome 13 Adverse effects: 4b. Weight ‐ change from baseline in kg.

Comparison 9 Risperidone added to antidepressants versus placebo added to antidepressants for major depression, Outcome 14 Adverse effects: 5. Sedation.

Comparison 10 Amisulpride versus placebo for dysthymia, Outcome 1 No clinically important response (as defined by original study).

Comparison 10 Amisulpride versus placebo for dysthymia, Outcome 2 Global state: no clinically important change ‐ CGI.

Comparison 10 Amisulpride versus placebo for dysthymia, Outcome 3 Mental state: 1a. Depressive symptoms ‐ no clinically important change‐ MADRS < 7.

Comparison 10 Amisulpride versus placebo for dysthymia, Outcome 4 Mental state: 1b. Depressive symptoms ‐ MADRS score at endpoint.

Comparison 10 Amisulpride versus placebo for dysthymia, Outcome 5 Mental state: 1c. Depressive symptoms ‐ HAM‐D score at endpoint.

Comparison 10 Amisulpride versus placebo for dysthymia, Outcome 6 Leaving the study early.

Comparison 10 Amisulpride versus placebo for dysthymia, Outcome 7 Adverse effects: 1. At least one adverse effect.

Comparison 10 Amisulpride versus placebo for dysthymia, Outcome 8 Adverse effects: 2. Extrapyramidal effects.

Comparison 10 Amisulpride versus placebo for dysthymia, Outcome 9 Adverse effects: 3. Prolactin associated effects.

Comparison 10 Amisulpride versus placebo for dysthymia, Outcome 10 Adverse effects: 4. Significant weight gain ‐ spontaneously reported.

Comparison 11 Amisulpride versus antidepressants for dysthymia, Outcome 1 No clinically important response ‐ as defined by original study.

Comparison 11 Amisulpride versus antidepressants for dysthymia, Outcome 2 Global state: no clinically important change ‐ CGI.

Comparison 11 Amisulpride versus antidepressants for dysthymia, Outcome 3 Service use ‐ number of patients rehospitalised.

Comparison 11 Amisulpride versus antidepressants for dysthymia, Outcome 4 Mental state: 1a. Depressive symptoms ‐ MADRS ‐ score at endpoint.

Comparison 11 Amisulpride versus antidepressants for dysthymia, Outcome 5 Mental state: 1b. No clinically important change ‐ at least 50% HAM‐D reduction.

Comparison 11 Amisulpride versus antidepressants for dysthymia, Outcome 6 Mental state: 1c. No clinically important change ‐ at least 25% HAM‐D reduction.

Comparison 11 Amisulpride versus antidepressants for dysthymia, Outcome 7 Mental state: 1d. Depressive symptoms ‐ HAM‐D score at endpoint.

Comparison 11 Amisulpride versus antidepressants for dysthymia, Outcome 8 Mental state: 2. Anxiety symptoms‐ HAM‐A score at endpoint.

Comparison 11 Amisulpride versus antidepressants for dysthymia, Outcome 9 Leaving the study early.

Comparison 11 Amisulpride versus antidepressants for dysthymia, Outcome 10 Adverse effects: 1. At least one adverse effect.

Comparison 11 Amisulpride versus antidepressants for dysthymia, Outcome 11 Adverse effects: 2.Death ‐ suicide attempt.

Comparison 11 Amisulpride versus antidepressants for dysthymia, Outcome 12 Adverse effects: 3. Extrapyramidal effects.

Comparison 11 Amisulpride versus antidepressants for dysthymia, Outcome 13 Adverse effects: 4. Significant weight gain.

Comparison 11 Amisulpride versus antidepressants for dysthymia, Outcome 14 Adverse effects: 5. Prolactin associated effects ‐ amenorrhoea.

Comparison 11 Amisulpride versus antidepressants for dysthymia, Outcome 15 Adverse effects: 6. Sedation.

Comparison 12 Sensitivity analysis ‐ imputed statistics excluded ‐ 3. Quetiapine versus placebo for major depression, Outcome 1 Mental state: 1b. Depressive symptoms ‐ MADRS score at endpoint.

Comparison 12 Sensitivity analysis ‐ imputed statistics excluded ‐ 3. Quetiapine versus placebo for major depression, Outcome 2 Mental state: 1c. Depressive symptoms ‐ HAM‐D score at endpoint.

Comparison 12 Sensitivity analysis ‐ imputed statistics excluded ‐ 3. Quetiapine versus placebo for major depression, Outcome 3 Mental state: 2. Anxiety symptoms ‐ HAM‐A score at endpoint.

Comparison 13 Sensitivity analysis ‐ imputed statistics excluded ‐ 4. Amisulpride versus antidepressants for dysthymia, Outcome 1 Mental state: 1a. Depressive symptoms ‐ MADRS ‐ score at endpoint.

Comparison 14 Sensitivity analysis ‐ imputed statistics excluded ‐ 6. Olanzapine versus antidepressants for major depression ‐ all data short‐term, Outcome 1 Mental state: 1b. Depressive symptoms ‐ MADRS score at endpoint.

Comparison 14 Sensitivity analysis ‐ imputed statistics excluded ‐ 6. Olanzapine versus antidepressants for major depression ‐ all data short‐term, Outcome 2 Mental state: 2. Anxiety symptoms ‐ HAM‐A score at endpoint.

Comparison 14 Sensitivity analysis ‐ imputed statistics excluded ‐ 6. Olanzapine versus antidepressants for major depression ‐ all data short‐term, Outcome 3 Adverse effects: 4. Prolactin ‐ change from baseline in ng/ml.

Comparison 15 Sensitivity analysis ‐ imputed statistics excluded ‐ 9. Olanzapine added to antidepressants versus placebo added to antidepressants for major depression ‐ all data short‐term, Outcome 1 Mental state: 1b. Depressive symptoms ‐ MADRS score at endpoint.

Comparison 15 Sensitivity analysis ‐ imputed statistics excluded ‐ 9. Olanzapine added to antidepressants versus placebo added to antidepressants for major depression ‐ all data short‐term, Outcome 2 Mental state: 2. Anxiety symptoms ‐ HAM‐A score at endpoint.

Comparison 15 Sensitivity analysis ‐ imputed statistics excluded ‐ 9. Olanzapine added to antidepressants versus placebo added to antidepressants for major depression ‐ all data short‐term, Outcome 3 Adverse effects: 4. Prolactin ‐ change from baseline in ng/ml.

Comparison 16 Sensitivity analysis ‐ imputed statistics excluded ‐ 10. Quetiapine added to antidepressants versus placebo added to antidepressants for major depression ‐ all data short‐term, Outcome 1 Mental state: 1b. Depressive symptoms ‐ MADRS score at endpoint.

Comparison 16 Sensitivity analysis ‐ imputed statistics excluded ‐ 10. Quetiapine added to antidepressants versus placebo added to antidepressants for major depression ‐ all data short‐term, Outcome 2 Mental state: 1d. Depressive symptoms‐ HAM‐D score at endpoint.

Comparison 16 Sensitivity analysis ‐ imputed statistics excluded ‐ 10. Quetiapine added to antidepressants versus placebo added to antidepressants for major depression ‐ all data short‐term, Outcome 3 Mental state: 2b. Anxiety symptoms ‐ HAM‐A score at endpoint.

Comparison 16 Sensitivity analysis ‐ imputed statistics excluded ‐ 10. Quetiapine added to antidepressants versus placebo added to antidepressants for major depression ‐ all data short‐term, Outcome 4 Adverse effects: 3b. Weight ‐ change from baseline in kg.

Comparison 17 Sensitivity analysis ‐ imputed statistics excluded ‐ 11. Risperidone added to antidepressants versus placebo added to antidepressants for major depression, Outcome 1 Mental state: 1c. Depressive symptoms ‐ HAM‐D score at endpoint.
| Outcome or subgroup title | No. of studies | No. of participants | Statistical method | Effect size |
| 1 No clinically important response to treatment (as defined by original study) Show forest plot | 1 | 277 | Odds Ratio (M‐H, Random, 95% CI) | 1.55 [0.87, 2.76] |
| 2 Global state: no clinically important change ‐ CGI Show forest plot | 1 | 277 | Odds Ratio (M‐H, Random, 95% CI) | 1.17 [0.63, 2.17] |
| 3 Mental state: 1a. Depressive symptoms ‐ no clinically important change ‐ MADRS Show forest plot | 1 | 277 | Odds Ratio (M‐H, Random, 95% CI) | 1.20 [0.67, 2.15] |
| 4 Mental state: 1b. Depressive symptoms ‐ no clinically important change ‐ HAM‐D Show forest plot | 1 | 277 | Odds Ratio (M‐H, Random, 95% CI) | 1.55 [0.87, 2.76] |
| 5 Mental state: 1c. Depressive symptoms ‐ MADRS score at endpoint Show forest plot | 1 | 272 | Mean Difference (IV, Random, 95% CI) | 1.20 [‐0.78, 3.18] |
| 6 Mental state: 1d. Depressive symptoms ‐ HAM‐D score at endpoint Show forest plot | 1 | 272 | Mean Difference (IV, Random, 95% CI) | 0.90 [‐0.69, 2.49] |
| 7 Leaving the study early Show forest plot | 1 | Odds Ratio (M‐H, Random, 95% CI) | Subtotals only | |
| 7.1 due to any reason | 1 | 277 | Odds Ratio (M‐H, Random, 95% CI) | 1.14 [0.57, 2.26] |
| 7.2 due to adverse events | 1 | 277 | Odds Ratio (M‐H, Random, 95% CI) | 0.83 [0.25, 2.80] |
| 7.3 due to inefficacy | 1 | 277 | Odds Ratio (M‐H, Random, 95% CI) | 1.01 [0.29, 3.56] |
| 8 Adverse effects: 1. At least one adverse effect Show forest plot | 1 | 277 | Odds Ratio (M‐H, Random, 95% CI) | 0.67 [0.40, 1.12] |
| Outcome or subgroup title | No. of studies | No. of participants | Statistical method | Effect size |
| 1 No clinically important response (as defined by original study) Show forest plot | 3 | 1092 | Odds Ratio (M‐H, Random, 95% CI) | 0.48 [0.37, 0.63] |
| 2 Global state: no clinically important change ‐ CGI Show forest plot | 1 | 362 | Odds Ratio (M‐H, Random, 95% CI) | 0.51 [0.34, 0.78] |
| 3 Remission ‐ number of people without remission ‐ as defined by the original study Show forest plot | 3 | 1092 | Odds Ratio (M‐H, Random, 95% CI) | 0.48 [0.36, 0.64] |
| 4 Mental state: 1a. Depressive symptoms ‐ MADRS score at endpoint Show forest plot | 3 | 1077 | Mean Difference (IV, Random, 95% CI) | ‐3.04 [‐4.09, 0.00] |
| 5 Leaving the study early Show forest plot | 3 | Odds Ratio (M‐H, Random, 95% CI) | Subtotals only | |
| 5.1 due to any reason | 3 | 1092 | Odds Ratio (M‐H, Random, 95% CI) | 1.21 [0.86, 1.71] |
| 5.2 due to adverse events | 3 | 1092 | Odds Ratio (M‐H, Random, 95% CI) | 2.59 [1.18, 5.71] |
| 5.3 due to inefficacy | 3 | 1092 | Odds Ratio (M‐H, Random, 95% CI) | 0.98 [0.36, 2.66] |
| 6 Adverse effects: 1. At least one adverse effect Show forest plot | 2 | 743 | Odds Ratio (M‐H, Random, 95% CI) | 2.53 [1.81, 3.52] |
| 7 Adverse effects: 2. Death Show forest plot | 3 | Odds Ratio (M‐H, Random, 95% CI) | Subtotals only | |
| 7.1 due to natural causes | 2 | 711 | Odds Ratio (M‐H, Random, 95% CI) | 0.0 [0.0, 0.0] |
| 7.2 due to suicide | 1 | 349 | Odds Ratio (M‐H, Random, 95% CI) | 0.0 [0.0, 0.0] |
| 7.3 suicide attempt | 1 | 362 | Odds Ratio (M‐H, Random, 95% CI) | 0.0 [0.0, 0.0] |
| 7.4 suicidal ideation | 2 | 711 | Odds Ratio (M‐H, Random, 95% CI) | 0.24 [0.03, 2.23] |
| 8 Adverse effects: 3a. Extrapyramidal effects Show forest plot | 3 | Odds Ratio (M‐H, Random, 95% CI) | Subtotals only | |
| 8.1 EPS in general | 1 | 362 | Odds Ratio (M‐H, Random, 95% CI) | 3.53 [1.95, 6.41] |
| 8.2 akathisia | 3 | 1092 | Odds Ratio (M‐H, Random, 95% CI) | 6.77 [4.22, 10.84] |
| 8.3 tremor | 1 | 381 | Odds Ratio (M‐H, Random, 95% CI) | 2.48 [0.86, 7.18] |
| 9 Adverse effects: 4a. Significant weight gain Show forest plot | 3 | 1092 | Odds Ratio (M‐H, Random, 95% CI) | 5.93 [2.15, 16.36] |
| 10 Adverse effects: 4b. Weight ‐ change from baseline in kg Show forest plot | 3 | 1087 | Mean Difference (IV, Random, 95% CI) | 1.07 [0.30, 1.84] |
| 11 Adverse effects: 5. Sedation Show forest plot | 2 | 711 | Odds Ratio (M‐H, Random, 95% CI) | 3.42 [0.66, 17.81] |
| Outcome or subgroup title | No. of studies | No. of participants | Statistical method | Effect size |
| 1 No clinically important response to treatment (as defined by original study) Show forest plot | 2 | 201 | Odds Ratio (M‐H, Random, 95% CI) | 0.84 [0.46, 1.54] |
| 2 Remission ‐ number of participants without remission ‐ as defined by the original study Show forest plot | 2 | 200 | Odds Ratio (M‐H, Fixed, 95% CI) | 0.84 [0.35, 2.05] |
| 3 Mental state: 1. Depressive symptoms ‐ HAM‐D score at endpoint Show forest plot | 2 | 184 | Mean Difference (IV, Random, 95% CI) | ‐2.86 [‐6.19, 0.47] |
| 4 Mental state: 2. Anxiety symptoms ‐ HAM‐A score at endpoint Show forest plot | 2 | 184 | Mean Difference (IV, Random, 95% CI) | ‐1.38 [‐3.46, 0.69] |
| 5 Leaving the study early Show forest plot | 2 | Odds Ratio (M‐H, Random, 95% CI) | Subtotals only | |
| 5.1 due to any reason | 2 | 201 | Odds Ratio (M‐H, Random, 95% CI) | 0.87 [0.50, 1.52] |
| 5.2 due to adverse events | 2 | 201 | Odds Ratio (M‐H, Random, 95% CI) | 1.67 [0.30, 9.34] |
| 5.3 due to inefficacy | 2 | 201 | Odds Ratio (M‐H, Random, 95% CI) | 0.39 [0.18, 0.86] |
| 6 Adverse effects: 1. At least one adverse effect Show forest plot | 1 | 201 | Odds Ratio (M‐H, Random, 95% CI) | 0.89 [0.45, 1.79] |
| 7 Adverse effects: 2. Prolactin increase ‐ number of participants with significant increase ‐ as defined by the original study Show forest plot | 1 | 201 | Odds Ratio (M‐H, Random, 95% CI) | 6.59 [2.41, 17.97] |
| 8 Adverse effects: 3a. Significant weight gain ‐ spontaneously reported Show forest plot | 1 | 201 | Odds Ratio (M‐H, Random, 95% CI) | 5.99 [1.29, 27.76] |
| 9 Adverse effects: 3b. Weight ‐ change from baseline in kg Show forest plot | 1 | 201 | Mean Difference (IV, Random, 95% CI) | 3.4 [1.40, 5.40] |
| 10 Adverse effects: 4. Sedation Show forest plot | 1 | 201 | Odds Ratio (M‐H, Random, 95% CI) | 4.40 [1.57, 12.31] |
| Outcome or subgroup title | No. of studies | No. of participants | Statistical method | Effect size |
| 1 No clinically important response to treatment (as defined by original study) Show forest plot | 5 | 749 | Odds Ratio (M‐H, Random, 95% CI) | 1.59 [0.98, 2.58] |
| 2 Remission ‐ number of participants without remission ‐ as defined by the original study Show forest plot | 4 | 766 | Odds Ratio (M‐H, Random, 95% CI) | 1.35 [0.89, 2.03] |
| 3 Mental state: 1a. Depressive symptoms ‐ no clinically important change ‐ at least 50% MADRS reduction Show forest plot | 2 | 302 | Odds Ratio (M‐H, Fixed, 95% CI) | 1.18 [0.69, 2.00] |
| 4 Mental state: 1b. Depressive symptoms ‐ MADRS score at endpoint Show forest plot | 5 | 747 | Mean Difference (IV, Random, 95% CI) | 0.56 [‐1.15, 2.27] |
| 5 Mental state: 1c. Depressive symptoms ‐ HAM‐D score at endpoint Show forest plot | 1 | 13 | Mean Difference (IV, Random, 95% CI) | ‐2.10 [‐11.18, 6.98] |
| 6 Mental state: 2. Anxiety symptoms ‐ HAM‐A score at endpoint Show forest plot | 4 | 734 | Mean Difference (IV, Random, 95% CI) | 0.39 [‐0.63, 1.42] |
| 7 Leaving the study early Show forest plot | 4 | Odds Ratio (M‐H, Random, 95% CI) | Subtotals only | |
| 7.1 due to any reason | 4 | 748 | Odds Ratio (M‐H, Random, 95% CI) | 1.12 [0.80, 1.57] |
| 7.2 due to adverse events | 3 | 735 | Odds Ratio (M‐H, Random, 95% CI) | 3.03 [1.55, 5.91] |
| 7.3 due to inefficacy | 3 | 735 | Odds Ratio (M‐H, Random, 95% CI) | 1.03 [0.57, 1.88] |
| 8 Adverse effects: 1. At least one adverse effect Show forest plot | 1 | 283 | Odds Ratio (M‐H, Random, 95% CI) | 1.10 [0.57, 2.14] |
| 9 Adverse effects: 2. Death ‐ natural cause Show forest plot | 2 | 355 | Odds Ratio (M‐H, Random, 95% CI) | 0.0 [0.0, 0.0] |
| 10 Adverse effects: 3. Extrapyramidal effects ‐ tremor Show forest plot | 2 | 516 | Odds Ratio (M‐H, Random, 95% CI) | 1.05 [0.49, 2.23] |
| 11 Adverse effects: 4. Prolactin ‐ change from baseline in ng/ml Show forest plot | 2 | 584 | Mean Difference (IV, Random, 95% CI) | 4.46 [2.17, 6.75] |
| 12 Adverse effects: 5a. Significant weight gain Show forest plot | 2 | 434 | Odds Ratio (M‐H, Random, 95% CI) | 4.58 [1.84, 11.37] |
| 12.1 ≥ 10% weight gain from baseline | 1 | 283 | Odds Ratio (M‐H, Random, 95% CI) | 13.09 [0.73, 234.67] |
| 12.2 spontaneously reported | 1 | 151 | Odds Ratio (M‐H, Random, 95% CI) | 4.07 [1.56, 10.63] |
| 13 Adverse effects: 5b. Weight ‐ change from baseline in kg Show forest plot | 2 | 296 | Mean Difference (IV, Random, 95% CI) | 4.07 [2.71, 5.44] |
| 14 Adverse effects: 6. Sedation Show forest plot | 1 | 151 | Odds Ratio (M‐H, Random, 95% CI) | 2.53 [0.92, 6.94] |
| Outcome or subgroup title | No. of studies | No. of participants | Statistical method | Effect size |
| 1 No clinically important response ‐ as defined by original study Show forest plot | 5 | 808 | Odds Ratio (M‐H, Random, 95% CI) | 0.70 [0.48, 1.02] |
| 2 Remission ‐ number of people without remission ‐ as defined by the original study Show forest plot | 4 | 793 | Odds Ratio (M‐H, Random, 95% CI) | 0.60 [0.39, 0.92] |
| 3 Mental state: 1a. No clinically important change ‐ at least 50% MADRS total score reduction Show forest plot | 4 | 793 | Odds Ratio (M‐H, Random, 95% CI) | 0.73 [0.51, 1.04] |
| 4 Mental state: 1b. Depressive symptoms ‐ MADRS score at endpoint Show forest plot | 5 | 808 | Mean Difference (IV, Random, 95% CI) | ‐2.84 [‐5.48, ‐0.20] |
| 5 Mental state: 1c. Depressive symptoms ‐ HAM‐D score at endpoint Show forest plot | 1 | 15 | Mean Difference (IV, Random, 95% CI) | ‐7.90 [‐16.63, 0.83] |
| 6 Mental state: 2. Anxiety symptoms ‐ HAM‐A score at endpoint Show forest plot | 4 | 793 | Mean Difference (IV, Random, 95% CI) | ‐1.44 [‐2.81, ‐0.06] |
| 7 Leaving the study early Show forest plot | 4 | Odds Ratio (M‐H, Random, 95% CI) | Subtotals only | |
| 7.1 due to any reason | 4 | 807 | Odds Ratio (M‐H, Random, 95% CI) | 1.22 [0.82, 1.83] |
| 7.2 due to adverse events | 3 | 792 | Odds Ratio (M‐H, Random, 95% CI) | 3.51 [1.58, 7.80] |
| 7.3 due to inefficacy | 3 | 792 | Odds Ratio (M‐H, Random, 95% CI) | 0.58 [0.28, 1.21] |
| 8 Adverse effects: 1. At least one adverse effect Show forest plot | 1 | 217 | Odds Ratio (M‐H, Random, 95% CI) | 1.30 [0.58, 2.93] |
| 9 Adverse effects: 2. Death Show forest plot | 2 | 575 | Odds Ratio (M‐H, Random, 95% CI) | 0.38 [0.02, 9.47] |
| 10 Adverse effects: 3. Extrapyramidal effects ‐ tremor Show forest plot | 1 | 302 | Odds Ratio (M‐H, Random, 95% CI) | 1.21 [0.53, 2.75] |
| 11 Adverse effects: 4. Prolactin ‐ change from baseline in ng/ml Show forest plot | 2 | 518 | Mean Difference (IV, Random, 95% CI) | 4.19 [‐0.18, 8.56] |
| 12 Adverse effects: 5a. Significant weight gain Show forest plot | 3 | 792 | Odds Ratio (M‐H, Random, 95% CI) | 4.77 [1.82, 12.50] |
| 12.1 ≥ 10% weight gain from baseline | 1 | 217 | Odds Ratio (M‐H, Random, 95% CI) | 12.14 [0.70, 208.95] |
| 12.2 spontaneously reported | 2 | 575 | Odds Ratio (M‐H, Random, 95% CI) | 4.22 [1.29, 13.77] |
| 13 Adverse effects: 5b. Weight ‐ change from baseline in kg Show forest plot | 2 | 519 | Mean Difference (IV, Random, 95% CI) | 4.58 [4.06, 5.09] |
| 14 Adverse effects: 6. Sedation Show forest plot | 2 | 575 | Odds Ratio (M‐H, Random, 95% CI) | 3.53 [1.64, 7.60] |
| Outcome or subgroup title | No. of studies | No. of participants | Statistical method | Effect size |
| 1 Non‐response to treatment ‐ as defined by the original study Show forest plot | 3 | 1342 | Odds Ratio (M‐H, Random, 95% CI) | 0.52 [0.41, 0.66] |
| 2 Global state: no clinically important change ‐ CGI Show forest plot | 3 | 1342 | Odds Ratio (M‐H, Random, 95% CI) | 0.56 [0.44, 0.71] |
| 3 Remission ‐ number of participants without remission ‐ as defined by the original study Show forest plot | 3 | 1337 | Odds Ratio (M‐H, Fixed, 95% CI) | 0.65 [0.49, 0.86] |
| 4 Relapse Show forest plot | 1 | 776 | Odds Ratio (M‐H, Fixed, 95% CI) | 0.34 [0.24, 0.48] |
| 5 Mental state: 1a. Depressive symptoms ‐ no clinically important change‐ MADRS Show forest plot | 3 | 1342 | Odds Ratio (M‐H, Random, 95% CI) | 0.52 [0.41, 0.66] |
| 6 Mental state: 1b. Depressive symptoms ‐ MADRS score at endpoint Show forest plot | 4 | 2069 | Mean Difference (IV, Random, 95% CI) | ‐2.59 [‐3.50, ‐1.69] |
| 6.1 short‐term | 3 | 1298 | Mean Difference (IV, Random, 95% CI) | ‐3.36 [‐4.62, ‐2.10] |
| 6.2 long‐term | 1 | 771 | Mean Difference (IV, Random, 95% CI) | ‐1.88 [‐1.00, ‐0.76] |
| 7 Mental state: 1c. Depressive symptoms ‐ HAM‐D score at endpoint Show forest plot | 3 | 1298 | Mean Difference (IV, Random, 95% CI) | ‐2.52 [‐3.66, ‐1.37] |
| 8 Mental state: 2. Anxiety symptoms ‐ HAM‐A score at endpoint Show forest plot | 4 | 2069 | Mean Difference (IV, Random, 95% CI) | ‐1.40 [‐1.97, ‐0.84] |
| 8.1 short‐term | 3 | 1298 | Mean Difference (IV, Random, 95% CI) | ‐1.42 [‐2.20, ‐0.64] |
| 8.2 long‐term | 1 | 771 | Mean Difference (IV, Random, 95% CI) | ‐1.38 [‐2.20, ‐0.56] |
| 9 Leaving the study early ‐ due to adverse events Show forest plot | 4 | 2118 | Odds Ratio (M‐H, Random, 95% CI) | 2.33 [1.37, 3.98] |
| 9.1 short‐term | 3 | 1342 | Odds Ratio (M‐H, Random, 95% CI) | 3.03 [1.91, 4.80] |
| 9.2 long‐term | 1 | 776 | Odds Ratio (M‐H, Random, 95% CI) | 1.25 [0.68, 2.28] |
| 10 Adverse effects: 1. Death ‐ suicidal thoughts ‐ MADRS item 10 of at least 4 Show forest plot | 1 | 723 | Odds Ratio (M‐H, Random, 95% CI) | 0.48 [0.18, 1.27] |
| 11 Adverse effects: 2. Extrapyramidal effects ‐ general EPS Show forest plot | 4 | 2118 | Odds Ratio (M‐H, Random, 95% CI) | 1.74 [1.01, 3.02] |
| 11.1 short‐term | 3 | 1342 | Odds Ratio (M‐H, Random, 95% CI) | 1.84 [0.94, 3.60] |
| 11.2 long‐term | 1 | 776 | Odds Ratio (M‐H, Random, 95% CI) | 1.56 [0.60, 4.08] |
| 12 Adverse effects: 3. Prolactin ‐ change from baseline in ng/ml Show forest plot | 1 | 309 | Mean Difference (IV, Random, 95% CI) | 0.76 [‐0.19, 1.71] |
| 13 Adverse effects: 4a. Significant weight gain Show forest plot | 4 | Odds Ratio (M‐H, Random, 95% CI) | Subtotals only | |
| 13.1 ≥7% weight gain from baseline ‐ short‐term | 4 | 2118 | Odds Ratio (M‐H, Random, 95% CI) | 2.12 [1.13, 3.99] |
| 13.2 spontaneously reported | 1 | 776 | Odds Ratio (M‐H, Random, 95% CI) | 6.80 [2.84, 16.28] |
| 14 Adverse effects: 4b. Weight ‐ change from baseline in kg Show forest plot | 4 | 2027 | Mean Difference (IV, Random, 95% CI) | 0.65 [0.11, 1.18] |
| 14.1 short‐term | 3 | 1306 | Mean Difference (IV, Random, 95% CI) | 0.60 [‐0.09, 1.29] |
| 14.2 long‐term | 1 | 721 | Mean Difference (IV, Random, 95% CI) | 0.8 [0.13, 1.47] |
| 15 Adverse effects: 5. Sedation Show forest plot | 4 | 2118 | Odds Ratio (M‐H, Random, 95% CI) | 5.76 [2.32, 14.32] |
| 15.1 short‐term | 3 | 1342 | Odds Ratio (M‐H, Random, 95% CI) | 4.94 [1.97, 12.36] |
| 15.2 long‐term | 1 | 776 | Odds Ratio (M‐H, Random, 95% CI) | 31.74 [1.89, 532.38] |
| Outcome or subgroup title | No. of studies | No. of participants | Statistical method | Effect size |
| 1 No clinically important response to treatment (as defined by original study) Show forest plot | 1 | 303 | Odds Ratio (M‐H, Random, 95% CI) | 0.94 [0.60, 1.47] |
| 2 Global state: no clinically important change ‐ CGI Show forest plot | 1 | 303 | Odds Ratio (M‐H, Random, 95% CI) | 0.94 [0.60, 1.47] |
| 3 Remission ‐ number of participants without remission Show forest plot | 1 | 303 | Odds Ratio (M‐H, Random, 95% CI) | 1.08 [0.66, 1.77] |
| 4 Mental state: 1a. No clinically important change‐ MADRS Show forest plot | 1 | 303 | Odds Ratio (M‐H, Random, 95% CI) | 0.72 [0.46, 1.13] |
| 5 Mental state: 1b. Depressive symptoms ‐ MADRS score at endpoint Show forest plot | 1 | 288 | Mean Difference (IV, Random, 95% CI) | ‐0.41 [‐2.65, 1.83] |
| 6 Mental state: 1c. Depressive symptoms ‐ HAM‐D score at endpoint Show forest plot | 1 | 288 | Mean Difference (IV, Random, 95% CI) | ‐1.20 [‐2.99, 0.59] |
| 7 Mental state: 2. Anxiety symptoms ‐ HAM‐A score at endpoint Show forest plot | 1 | 288 | Mean Difference (IV, Random, 95% CI) | 0.26 [‐1.39, 1.91] |
| 8 Leaving the study early ‐ due to adverse events Show forest plot | 1 | 303 | Odds Ratio (M‐H, Random, 95% CI) | 16.82 [3.93, 72.02] |
| 9 Adverse effects: 1. Extrapyramidal effects ‐ general EPS Show forest plot | 1 | 303 | Odds Ratio (M‐H, Random, 95% CI) | 0.64 [0.26, 1.62] |
| 10 Adverse effects: 2. Prolactin ‐ change from baseline in ng/ml Show forest plot | 1 | 301 | Mean Difference (IV, Random, 95% CI) | 0.07 [‐1.21, 1.35] |
| 11 Adverse effects: 3a. Significant weight gain ‐ ≥7% from baseline Show forest plot | 1 | 303 | Odds Ratio (M‐H, Random, 95% CI) | 4.05 [0.45, 36.70] |
| 12 Adverse effects: 3b. Weight ‐ change from baseline in ng/ml Show forest plot | 1 | 301 | Mean Difference (IV, Random, 95% CI) | 1.65 [1.13, 2.17] |
| 13 Adverse effects: 4. Sedation Show forest plot | 1 | 303 | Odds Ratio (M‐H, Random, 95% CI) | 3.27 [1.89, 5.63] |
| Outcome or subgroup title | No. of studies | No. of participants | Statistical method | Effect size |
| 1 No clinically important response (as defined by original study) Show forest plot | 3 | 995 | Odds Ratio (M‐H, Random, 95% CI) | 0.66 [0.51, 0.87] |
| 2 Global state: no clinically important change ‐ CGI Show forest plot | 2 | 937 | Odds Ratio (M‐H, Random, 95% CI) | 0.64 [0.49, 0.84] |
| 3 Remission ‐ number of people without remission ‐ as defined by the original study Show forest plot | 3 | 847 | Odds Ratio (M‐H, Random, 95% CI) | 0.52 [0.38, 0.71] |
| 4 Mental state: 1a. Depressive symptoms ‐ no clinically important change ‐ MADRS Show forest plot | 2 | 937 | Odds Ratio (M‐H, Random, 95% CI) | 0.68 [0.52, 0.90] |
| 5 Mental state: 1b. Depressive symptoms ‐ MADRS score at endpoint Show forest plot | 2 | 919 | Mean Difference (IV, Random, 95% CI) | ‐2.67 [‐4.00, ‐1.34] |
| 6 Mental state: 1c. Depressive symptoms ‐ no clinically important change ‐ HAM‐D Show forest plot | 1 | 58 | Odds Ratio (M‐H, Random, 95% CI) | 0.41 [0.14, 1.22] |
| 7 Mental state: 1d. Depressive symptoms ‐ HAM‐D score at endpoint Show forest plot | 3 | 977 | Mean Difference (IV, Random, 95% CI) | ‐2.67 [‐3.79, ‐1.55] |
| 8 Mental state: 2a. Anxiety symptoms ‐ no clinically important change ‐ HAM‐A Show forest plot | 1 | 58 | Odds Ratio (M‐H, Random, 95% CI) | 0.23 [0.08, 0.70] |
| 9 Mental state: 2b. Anxiety symptoms ‐ HAM‐A score at endpoint Show forest plot | 3 | 977 | Mean Difference (IV, Random, 95% CI) | ‐2.62 [‐4.69, ‐0.55] |
| 10 Leaving the study early Show forest plot | 3 | Odds Ratio (M‐H, Random, 95% CI) | Subtotals only | |
| 10.1 due to any reason | 1 | 58 | Odds Ratio (M‐H, Random, 95% CI) | 0.75 [0.26, 2.14] |
| 10.2 due to adverse events | 3 | 995 | Odds Ratio (M‐H, Random, 95% CI) | 5.59 [1.47, 21.26] |
| 10.3 due to inefficacy | 1 | 58 | Odds Ratio (M‐H, Random, 95% CI) | 0.04 [0.00, 0.66] |
| 11 Adverse effects: 1. Extrapyramidal symptoms Show forest plot | 1 | 446 | Odds Ratio (M‐H, Fixed, 95% CI) | 1.95 [0.71, 5.32] |
| 12 Adverse effects: 2. Prolactin ‐ change from baseline in ng/ml Show forest plot | 1 | 491 | Mean Difference (IV, Random, 95% CI) | ‐0.33 [‐1.00, 2.34] |
| 13 Adverse effects: 3a. Significant weight gain Show forest plot | 3 | Odds Ratio (M‐H, Random, 95% CI) | Subtotals only | |
| 13.1 ≥ 7% weight gain from baseline | 3 | 995 | Odds Ratio (M‐H, Random, 95% CI) | 3.06 [1.22, 7.68] |
| 13.2 Increase in body weight from baseline to week 8 | 1 | 58 | Odds Ratio (M‐H, Random, 95% CI) | 3.39 [1.01, 11.41] |
| 13.3 spontaneously reported | 1 | 446 | Odds Ratio (M‐H, Random, 95% CI) | 6.17 [0.79, 47.90] |
| 14 Adverse effects: 3b. Weight ‐ change from baseline in kg Show forest plot | 3 | 959 | Mean Difference (IV, Random, 95% CI) | 1.11 [0.56, 1.66] |
| 15 Adverse effects: 4. Sedation Show forest plot | 3 | 995 | Odds Ratio (M‐H, Random, 95% CI) | 8.79 [4.90, 15.77] |
| Outcome or subgroup title | No. of studies | No. of participants | Statistical method | Effect size |
| 1 No clinically important response (as defined by original study) Show forest plot | 2 | 371 | Odds Ratio (M‐H, Random, 95% CI) | 0.57 [0.36, 0.89] |
| 2 Remission ‐ number of participants without remission ‐ as defined by the original study Show forest plot | 2 | 371 | Odds Ratio (M‐H, Fixed, 95% CI) | 0.39 [0.22, 0.69] |
| 3 Relapse (as defined by the original study) Show forest plot | 1 | 243 | Odds Ratio (M‐H, Random, 95% CI) | 0.95 [0.57, 1.57] |
| 4 Mental state: 1a. Depressive symptoms ‐ MADRS score at endpoint Show forest plot | 2 | 264 | Mean Difference (IV, Random, 95% CI) | ‐1.85 [‐9.17, 5.47] |
| 4.1 short‐term | 1 | 23 | Mean Difference (IV, Random, 95% CI) | ‐7.11 [‐16.50, 2.28] |
| 4.2 medium‐term | 1 | 241 | Mean Difference (IV, Random, 95% CI) | 0.80 [‐2.21, 3.81] |
| 5 Mental state: 1b. Depressive symptoms ‐ no clinically important change ‐ HAM‐D Show forest plot | 2 | 371 | Odds Ratio (M‐H, Random, 95% CI) | 0.60 [0.38, 0.95] |
| 6 Mental state: 1c. Depressive symptoms ‐ HAM‐D score at endpoint Show forest plot | 2 | 509 | Mean Difference (IV, Random, 95% CI) | ‐1.69 [‐4.13, 0.74] |
| 6.1 short‐term | 1 | 268 | Mean Difference (IV, Random, 95% CI) | ‐2.80 [‐4.14, ‐1.46] |
| 6.2 medium‐term | 1 | 241 | Mean Difference (IV, Random, 95% CI) | ‐0.30 [‐2.43, 1.83] |
| 7 Leaving the study early Show forest plot | 4 | Odds Ratio (M‐H, Random, 95% CI) | Subtotals only | |
| 7.1 due to any reason | 4 | 637 | Odds Ratio (M‐H, Random, 95% CI) | 1.04 [0.59, 1.83] |
| 7.2 due to adverse events | 2 | 517 | Odds Ratio (M‐H, Random, 95% CI) | 2.11 [0.79, 5.68] |
| 7.3 due to inefficacy | 2 | 517 | Odds Ratio (M‐H, Random, 95% CI) | 0.95 [0.59, 1.51] |
| 8 Adverse effects: 1. At least one adverse effect Show forest plot | 2 | 371 | Odds Ratio (M‐H, Random, 95% CI) | 0.75 [0.48, 1.16] |
| 9 Adverse effects: 2a. Extrapyramidal effects ‐ tremor Show forest plot | 2 | Odds Ratio (M‐H, Random, 95% CI) | Subtotals only | |
| 9.1 EPS general ‐ medium‐term | 1 | 243 | Odds Ratio (M‐H, Random, 95% CI) | 1.98 [0.36, 11.04] |
| 9.2 akathisia ‐ short‐term | 1 | 274 | Odds Ratio (M‐H, Random, 95% CI) | 2.85 [0.12, 70.59] |
| 9.3 dystonia ‐ short‐term | 1 | 274 | Odds Ratio (M‐H, Random, 95% CI) | 0.31 [0.01, 7.73] |
| 9.4 tremor ‐ short‐term | 1 | 274 | Odds Ratio (M‐H, Random, 95% CI) | 0.94 [0.06, 15.23] |
| 9.5 use of antiparkinson medication ‐ short‐term | 1 | 274 | Odds Ratio (M‐H, Random, 95% CI) | 0.0 [0.0, 0.0] |
| 10 Adverse effects: 3a. Prolactin increase ‐ associated effects Show forest plot | 1 | 243 | Odds Ratio (M‐H, Random, 95% CI) | 7.0 [0.36, 136.98] |
| 11 Adverse effects: 3b. Prolactin ‐ change from baseline in ng/ml ‐ endpoint Show forest plot | 2 | 256 | Mean Difference (IV, Random, 95% CI) | 29.42 [19.49, 39.34] |
| 11.1 short‐term | 1 | 15 | Mean Difference (IV, Random, 95% CI) | 40.42 [‐2.67, 83.51] |
| 11.2 medium‐term | 1 | 241 | Mean Difference (IV, Random, 95% CI) | 28.8 [18.60, 39.00] |
| 12 Adverse effects: 4a. Significant weight gain Show forest plot | 3 | Odds Ratio (M‐H, Random, 95% CI) | Subtotals only | |
| 12.1 ≥ 7% weight gain from baseline | 2 | 340 | Odds Ratio (M‐H, Random, 95% CI) | 3.32 [0.99, 11.12] |
| 12.2 spontaneously reported | 2 | 371 | Odds Ratio (M‐H, Random, 95% CI) | 2.12 [0.55, 8.16] |
| 13 Adverse effects: 4b. Weight ‐ change from baseline in kg Show forest plot | 4 | 633 | Mean Difference (IV, Random, 95% CI) | ‐0.09 [‐2.22, 2.04] |
| 13.1 short‐term | 3 | 392 | Mean Difference (IV, Random, 95% CI) | ‐2.77 [‐8.03, 2.49] |
| 13.2 medium‐term | 1 | 241 | Mean Difference (IV, Random, 95% CI) | 1.80 [0.95, 2.65] |
| 14 Adverse effects: 5. Sedation Show forest plot | 4 | 637 | Odds Ratio (M‐H, Random, 95% CI) | 1.10 [0.31, 3.99] |
| 14.1 short‐term | 3 | 394 | Odds Ratio (M‐H, Random, 95% CI) | 1.21 [0.17, 8.46] |
| 14.2 medium‐term | 1 | 243 | Odds Ratio (M‐H, Random, 95% CI) | 0.73 [0.16, 3.31] |
| Outcome or subgroup title | No. of studies | No. of participants | Statistical method | Effect size |
| 1 No clinically important response (as defined by original study) Show forest plot | 2 | 322 | Odds Ratio (M‐H, Random, 95% CI) | 0.29 [0.18, 0.46] |
| 2 Global state: no clinically important change ‐ CGI Show forest plot | 2 | 322 | Odds Ratio (M‐H, Random, 95% CI) | 0.29 [0.18, 0.46] |
| 3 Mental state: 1a. Depressive symptoms ‐ no clinically important change‐ MADRS < 7 Show forest plot | 1 | 212 | Odds Ratio (M‐H, Random, 95% CI) | 0.28 [0.15, 0.51] |
| 4 Mental state: 1b. Depressive symptoms ‐ MADRS score at endpoint Show forest plot | 2 | 284 | Mean Difference (IV, Random, 95% CI) | ‐4.90 [‐6.67, ‐3.12] |
| 5 Mental state: 1c. Depressive symptoms ‐ HAM‐D score at endpoint Show forest plot | 1 | 39 | Mean Difference (IV, Random, 95% CI) | ‐7.20 [‐10.08, ‐4.32] |
| 6 Leaving the study early Show forest plot | 3 | Odds Ratio (M‐H, Random, 95% CI) | Subtotals only | |
| 6.1 due to any reason | 3 | 361 | Odds Ratio (M‐H, Random, 95% CI) | 0.65 [0.38, 1.11] |
| 6.2 due to adverse events | 3 | 361 | Odds Ratio (M‐H, Random, 95% CI) | 3.85 [0.96, 15.39] |
| 6.3 due to inefficacy | 3 | 361 | Odds Ratio (M‐H, Random, 95% CI) | 0.40 [0.20, 0.83] |
| 7 Adverse effects: 1. At least one adverse effect Show forest plot | 3 | 361 | Odds Ratio (M‐H, Random, 95% CI) | 1.39 [0.71, 2.73] |
| 7.1 short‐term | 1 | 39 | Odds Ratio (M‐H, Random, 95% CI) | 4.58 [0.81, 25.80] |
| 7.2 medium‐term | 2 | 322 | Odds Ratio (M‐H, Random, 95% CI) | 1.20 [0.67, 2.15] |
| 8 Adverse effects: 2. Extrapyramidal effects Show forest plot | 2 | 149 | Odds Ratio (M‐H, Random, 95% CI) | 3.58 [0.74, 17.40] |
| 8.1 tremor | 1 | 39 | Odds Ratio (M‐H, Random, 95% CI) | 5.27 [0.24, 117.26] |
| 8.2 EPS in general | 1 | 110 | Odds Ratio (M‐H, Random, 95% CI) | 3.13 [0.50, 19.63] |
| 9 Adverse effects: 3. Prolactin associated effects Show forest plot | 2 | Odds Ratio (M‐H, Random, 95% CI) | Subtotals only | |
| 9.1 galactorrhoea | 1 | 212 | Odds Ratio (M‐H, Random, 95% CI) | 11.99 [0.65, 219.71] |
| 9.2 menstrual disorder | 1 | 212 | Odds Ratio (M‐H, Random, 95% CI) | 10.14 [1.26, 81.50] |
| 9.3 general | 1 | 84 | Odds Ratio (M‐H, Random, 95% CI) | 8.65 [1.01, 73.75] |
| 10 Adverse effects: 4. Significant weight gain ‐ spontaneously reported Show forest plot | 1 | 212 | Odds Ratio (M‐H, Random, 95% CI) | 6.55 [0.77, 55.38] |
| Outcome or subgroup title | No. of studies | No. of participants | Statistical method | Effect size |
| 1 No clinically important response ‐ as defined by original study Show forest plot | 4 | 957 | Odds Ratio (M‐H, Random, 95% CI) | 0.61 [0.38, 0.99] |
| 1.1 short‐term | 1 | 313 | Odds Ratio (M‐H, Random, 95% CI) | 0.61 [0.35, 1.07] |
| 1.2 medium‐term | 3 | 644 | Odds Ratio (M‐H, Random, 95% CI) | 0.60 [0.30, 1.19] |
| 2 Global state: no clinically important change ‐ CGI Show forest plot | 4 | 957 | Odds Ratio (M‐H, Random, 95% CI) | 0.52 [0.32, 0.86] |
| 2.1 short‐term | 1 | 313 | Odds Ratio (M‐H, Random, 95% CI) | 0.50 [0.28, 0.90] |
| 2.2 medium‐term | 3 | 644 | Odds Ratio (M‐H, Random, 95% CI) | 0.52 [0.26, 1.06] |
| 3 Service use ‐ number of patients rehospitalised Show forest plot | 2 | 528 | Odds Ratio (M‐H, Random, 95% CI) | 5.91 [0.73, 48.09] |
| 4 Mental state: 1a. Depressive symptoms ‐ MADRS ‐ score at endpoint Show forest plot | 4 | 902 | Mean Difference (IV, Random, 95% CI) | ‐1.28 [‐2.75, 0.18] |
| 4.1 short‐term | 1 | 306 | Mean Difference (IV, Random, 95% CI) | ‐1.10 [‐2.84, 0.64] |
| 4.2 medium‐term | 3 | 596 | Mean Difference (IV, Random, 95% CI) | ‐1.60 [‐3.97, 0.78] |
| 5 Mental state: 1b. No clinically important change ‐ at least 50% HAM‐D reduction Show forest plot | 1 | 313 | Odds Ratio (M‐H, Random, 95% CI) | 0.61 [0.35, 1.07] |
| 6 Mental state: 1c. No clinically important change ‐ at least 25% HAM‐D reduction Show forest plot | 1 | 313 | Odds Ratio (M‐H, Random, 95% CI) | 0.20 [0.09, 0.41] |
| 7 Mental state: 1d. Depressive symptoms ‐ HAM‐D score at endpoint Show forest plot | 1 | 306 | Mean Difference (IV, Random, 95% CI) | ‐0.90 [‐2.24, 0.44] |
| 8 Mental state: 2. Anxiety symptoms‐ HAM‐A score at endpoint Show forest plot | 3 | 824 | Mean Difference (IV, Random, 95% CI) | ‐0.98 [‐2.33, 0.38] |
| 8.1 short‐term | 1 | 306 | Mean Difference (IV, Random, 95% CI) | ‐0.90 [‐2.25, 0.45] |
| 8.2 medium‐term | 2 | 518 | Mean Difference (IV, Random, 95% CI) | ‐1.04 [‐3.69, 1.60] |
| 9 Leaving the study early Show forest plot | 4 | Odds Ratio (M‐H, Random, 95% CI) | Subtotals only | |
| 9.1 due to any reason | 4 | 957 | Odds Ratio (M‐H, Random, 95% CI) | 0.74 [0.55, 1.00] |
| 9.2 due to adverse events | 4 | 957 | Odds Ratio (M‐H, Random, 95% CI) | 1.17 [0.74, 1.86] |
| 9.3 due to inefficacy | 3 | 644 | Odds Ratio (M‐H, Random, 95% CI) | 0.93 [0.30, 2.83] |
| 10 Adverse effects: 1. At least one adverse effect Show forest plot | 4 | 957 | Odds Ratio (M‐H, Random, 95% CI) | 0.95 [0.73, 1.25] |
| 10.1 short‐term | 1 | 313 | Odds Ratio (M‐H, Random, 95% CI) | 0.89 [0.57, 1.39] |
| 10.2 medium‐term | 3 | 644 | Odds Ratio (M‐H, Random, 95% CI) | 0.96 [0.63, 1.46] |
| 11 Adverse effects: 2.Death ‐ suicide attempt Show forest plot | 1 | 253 | Odds Ratio (M‐H, Random, 95% CI) | 0.17 [0.01, 4.30] |
| 12 Adverse effects: 3. Extrapyramidal effects Show forest plot | 3 | Odds Ratio (M‐H, Random, 95% CI) | Subtotals only | |
| 12.1 tremor | 1 | 253 | Odds Ratio (M‐H, Random, 95% CI) | 0.05 [0.00, 0.82] |
| 12.2 EPS in general | 3 | 644 | Odds Ratio (M‐H, Random, 95% CI) | 0.68 [0.09, 4.86] |
| 13 Adverse effects: 4. Significant weight gain Show forest plot | 2 | Odds Ratio (M‐H, Random, 95% CI) | Subtotals only | |
| 13.1 ≥ 5% weight gain from baseline | 2 | 534 | Odds Ratio (M‐H, Random, 95% CI) | 2.23 [1.21, 4.13] |
| 13.2 spontaneously reported | 1 | 253 | Odds Ratio (M‐H, Random, 95% CI) | 1.29 [0.65, 2.57] |
| 14 Adverse effects: 5. Prolactin associated effects ‐ amenorrhoea Show forest plot | 2 | 236 | Odds Ratio (M‐H, Random, 95% CI) | 7.07 [1.60, 31.29] |
| 15 Adverse effects: 6. Sedation Show forest plot | 2 | 531 | Odds Ratio (M‐H, Random, 95% CI) | 0.70 [0.08, 6.42] |
| Outcome or subgroup title | No. of studies | No. of participants | Statistical method | Effect size |
| 1 Mental state: 1b. Depressive symptoms ‐ MADRS score at endpoint Show forest plot | 2 | 1070 | Mean Difference (IV, Random, 95% CI) | ‐2.18 [‐3.35, ‐1.00] |
| 1.1 short‐term | 1 | 299 | Mean Difference (IV, Random, 95% CI) | ‐3.39 [‐5.95, ‐0.83] |
| 1.2 long‐term | 1 | 771 | Mean Difference (IV, Random, 95% CI) | ‐1.88 [‐1.00, ‐0.76] |
| 2 Mental state: 1c. Depressive symptoms ‐ HAM‐D score at endpoint Show forest plot | 1 | 299 | Mean Difference (IV, Random, 95% CI) | ‐2.40 [‐5.79, 0.99] |
| 3 Mental state: 2. Anxiety symptoms ‐ HAM‐A score at endpoint Show forest plot | 2 | 1070 | Mean Difference (IV, Random, 95% CI) | ‐1.39 [‐2.11, ‐0.68] |
| 3.1 short‐term | 1 | 299 | Mean Difference (IV, Random, 95% CI) | ‐1.44 [‐2.88, ‐0.00] |
| 3.2 long‐term | 1 | 771 | Mean Difference (IV, Random, 95% CI) | ‐1.38 [‐2.20, ‐0.56] |
| Outcome or subgroup title | No. of studies | No. of participants | Statistical method | Effect size |
| 1 Mental state: 1a. Depressive symptoms ‐ MADRS ‐ score at endpoint Show forest plot | 3 | 824 | Mean Difference (IV, Random, 95% CI) | ‐0.89 [‐2.01, 0.23] |
| 1.1 short‐term | 1 | 306 | Mean Difference (IV, Random, 95% CI) | ‐1.10 [‐2.84, 0.64] |
| 1.2 medium‐term | 2 | 518 | Mean Difference (IV, Random, 95% CI) | ‐0.74 [‐2.20, 0.73] |
| Outcome or subgroup title | No. of studies | No. of participants | Statistical method | Effect size |
| 1 Mental state: 1b. Depressive symptoms ‐ MADRS score at endpoint Show forest plot | 2 | 302 | Mean Difference (IV, Random, 95% CI) | 0.38 [‐1.86, 2.62] |
| 2 Mental state: 2. Anxiety symptoms ‐ HAM‐A score at endpoint Show forest plot | 2 | 302 | Mean Difference (IV, Random, 95% CI) | 0.78 [‐0.77, 2.34] |
| 3 Adverse effects: 4. Prolactin ‐ change from baseline in ng/ml Show forest plot | 1 | 301 | Mean Difference (IV, Random, 95% CI) | 4.1 [1.35, 6.85] |
| Outcome or subgroup title | No. of studies | No. of participants | Statistical method | Effect size |
| 1 Mental state: 1b. Depressive symptoms ‐ MADRS score at endpoint Show forest plot | 2 | 303 | Mean Difference (IV, Random, 95% CI) | ‐3.50 [‐7.62, 0.61] |
| 2 Mental state: 2. Anxiety symptoms ‐ HAM‐A score at endpoint Show forest plot | 2 | 303 | Mean Difference (IV, Random, 95% CI) | ‐1.27 [‐4.41, 1.86] |
| 3 Adverse effects: 4. Prolactin ‐ change from baseline in ng/ml Show forest plot | 1 | 301 | Mean Difference (IV, Random, 95% CI) | 2.5 [0.41, 4.59] |
| Outcome or subgroup title | No. of studies | No. of participants | Statistical method | Effect size |
| 1 Mental state: 1b. Depressive symptoms ‐ MADRS score at endpoint Show forest plot | 1 | 432 | Mean Difference (IV, Random, 95% CI) | ‐2.46 [‐4.33, ‐0.59] |
| 2 Mental state: 1d. Depressive symptoms‐ HAM‐D score at endpoint Show forest plot | 1 | 432 | Mean Difference (IV, Random, 95% CI) | ‐2.28 [‐3.97, ‐0.59] |
| 3 Mental state: 2b. Anxiety symptoms ‐ HAM‐A score at endpoint Show forest plot | 1 | 432 | Mean Difference (IV, Random, 95% CI) | ‐1.30 [‐2.72, 0.12] |
| 4 Adverse effects: 3b. Weight ‐ change from baseline in kg Show forest plot | 1 | 491 | Mean Difference (IV, Random, 95% CI) | 0.95 [0.49, 1.41] |
| Outcome or subgroup title | No. of studies | No. of participants | Statistical method | Effect size |
| 1 Mental state: 1c. Depressive symptoms ‐ HAM‐D score at endpoint Show forest plot | 1 | 241 | Mean Difference (IV, Random, 95% CI) | ‐0.30 [‐2.43, 1.83] |