用于预防心源性猝死的胺碘酮与其他药物干预的比较
摘要
研究背景
心源性猝死(sudden cardiac death, SCD)是导致心源性死亡的主要原因之一。有两种主要的预防策略:管理心血管危险因素和降低室性心律失常的风险。植入式心脏除颤器(Implantable cardiac defibrillators, ICD)是一级和二级预防的标准疗法;然而,该设备在资源有限的环境中并未广泛使用。抗心律失常药胺碘酮已得到提议作为ICD的替代品。
研究目的
评价与安慰剂或无干预或任何其他抗心律失常药物相比,胺碘酮在高风险(一级预防)或因室性心动过速/心室颤动(Ventricular Tachycardia/Ventricular Fibrillation)或VT/VF(二级预防)引起的心脏骤停或晕厥中恢复的受试者的SCD一级或二级预防的有效性。
检索策略
我们于2015年3月26日检索了Cochrane对照试验中心注册库(Cochrane Central Register of Controlled Trials, CENTRAL)、MEDLINE(OVID)、EMBASE(OVID)、CINAHL(EBSCO)和LILACS。我们评价了纳入研究的参考文献列表和关于该主题选取的综述,联系了纳入研究的作者,筛选了相关会议,并在注册库中检索了正在进行的试验。研究未对发表语言进行限制。
纳入排除标准
评价胺碘酮与安慰剂、无干预或其他抗心律失常药在成人中的疗效的随机和半随机试验。对于一级预防,我们考虑了纳入SCD高风险的受试者。对于二级预防,我们考虑纳入因室性心律失常导致的心脏骤停或晕厥中恢复的受试者。
资料收集与分析
两名作者独立评价纳入的试验并提取相关资料。我们联系了试验作者以获取其中缺失的数据。我们使用随机效应模型进行meta分析。我们计算了二分类结局的风险比(risk ratios, RR)和95%置信区间(confidence intervals, CI)。三项研究包括不止一项对比。
主要结果
我们纳入了24项研究(9997名受试者)。18项研究评价了胺碘酮的一级预防,六项研究评价了二级预防。只有三项研究同时使用ICD和胺碘酮进行比较(均用于二级预防)。
对于一级预防,与安慰剂或无干预(17项研究,8383名受试者)相比,胺碘酮减少了SCD(RR=0.76;95%CI [0.66, 0.88])、心源性死亡(RR=0.86;95%CI [0.77, 0.96])和全因死亡(RR=0.88;95%CI [0.78, 1.00])。证据质量为低。
与其他抗心律失常药(三项研究,540名受试者)相比,胺碘酮减少了SCD(RR=0.44;95%CI [0.19, 1.00])、心源性死亡(RR=0.41;95%CI [0.20, 0.86])和全因死亡(RR=0.37;95%CI [0.18, 0.76])。证据质量为中等。
对于二级预防,与安慰剂或无干预(两项研究,440名受试者)相比,胺碘酮似乎会增加SCD(RR=4.32;95%CI [0.87, 21.49])和全因死亡(RR=3.05;[1.33, 7.01])的风险。然而,证据质量为极低。与其他抗心律失常药(四项研究,839名受试者)相比,胺碘酮似乎会增加SCD的风险(RR=1.40;95%CI [0.56, 3.52];极低质量证据),但对全因死亡无影响(RR=1.03 ;95%CI [0.75, 1.42];低质量证据)。
胺碘酮与肺部及甲状腺不良事件的增加有关。
作者结论
低至中等质量证据表明,与安慰剂或无干预一级预防相比,胺碘酮可减少SCD、心源性死亡和全因死亡,且其效果优于其他抗心律失常药。
由于证据质量极低,尚不确定胺碘酮是否会减少或增加二级预防下的SCD和死亡。
PICO
简语概要
胺碘酮预防心源性猝死
研究背景
心源性猝死(sudden cardiac death, SCD)是当今重要的死亡原因。高危人群(主要为患有任何类型心脏病的人群)因心脏原因意外死亡,主要是由于心律失常(心律不齐)。首选的治疗方法是一种称为植入式心脏除颤器(implantable cardiac defibrillator, ICD)的装置,但该装置在低收入或中等收入国家并未广泛使用。胺碘酮是一种抗心律失常药物,可能会减少此类事件的发生,并且在无可用ICD时可以作为替代药物。
研究特征
我们在科学数据库中检索了比较胺碘酮与其他抗心律失常药或安慰剂对SCD、死亡及任何副作用的影响的临床试验。我们纳入了高危或先前出现过心脏骤停(一种导致心律失常的严重心脏功能障碍)的成年受试者。证据检索截止至2015年3月。
关键结果
我们检索到24项研究,涉及9997名受试者。在高危受试者中,证据表明与安慰剂相比,胺碘酮可以预防SCD或避免死亡,并且可能优于其他抗心律失常药。
另一方面,在先前已经发生过心脏骤停的受试者中,尚不确定胺碘酮是否会增加或减少出现新的心脏骤停或死亡的风险。
此外,与安慰剂或其他抗心律失常药相比,胺碘酮可能会导致或加重甲状腺或肺部的不良反应。
证据质量
研究的总体证据质量为低。
Authors' conclusions
Summary of findings
| Amiodarone versus placebo or no treatment for primary prevention | |||||
| Patient or population: participants with high risk of sudden cardiac death (primary prevention) | |||||
| Outcomes | Illustrative comparative risks* (95% CI) | Relative effect | No of participants | Quality of the evidence | |
|---|---|---|---|---|---|
| Assumed risk | Corresponding risk | ||||
| Placebo or no treatment | Amiodarone | ||||
| Sudden cardiac death | Study population | RR 0.76 | 8383 | ⊕⊕⊝⊝ | |
| 91 per 1000 | 70 per 1000 | ||||
| Moderate | |||||
| 114 per 1000 | 87 per 1000 | ||||
| All‐cause mortality | Study population | RR 0.88 | 8383 | ⊕⊕⊝⊝ | |
| 203 per 1000 | 178 per 1000 | ||||
| Moderate | |||||
| 190 per 1000 | 167 per 1000 | ||||
| *The basis for the assumed risk (e.g. the median control group risk across studies) is provided in footnotes. The corresponding risk (and its 95% confidence interval) is based on the assumed risk in the comparison group and the relative effect of the intervention (and its 95% CI). | |||||
| GRADE Working Group grades of evidence | |||||
| aRandomisation and allocation concealment methods not clear or not adequate in 10/16 studies, including studies with more weight. | |||||
| Amiodarone versus beta blockers | |||||
| Patient or population: beta blockers | |||||
| Outcomes | Illustrative comparative risks* (95% CI) | Relative effect | No of participants | Quality of the evidence | |
|---|---|---|---|---|---|
| Assumed risk | Corresponding risk | ||||
| Control | Amiodarone | ||||
| Sudden cardiac death | Study population | RR 0.37 | 342 | ⊕⊕⊝⊝ | |
| 56 per 1000 | 21 per 1000 | ||||
| Moderate | |||||
| 45 per 1000 | 17 per 1000 | ||||
| All‐cause mortality | Study population | RR 0.27 | 342 | ⊕⊕⊝⊝ | |
| 101 per 1000 | 27 per 1000 | ||||
| Moderate | |||||
| 76 per 1000 | 21 per 1000 | ||||
| *The basis for the assumed risk (e.g. the median control group risk across studies) is provided in footnotes. The corresponding risk (and its 95% confidence interval) is based on the assumed risk in the comparison group and the relative effect of the intervention (and its 95% CI). | |||||
| GRADE Working Group grades of evidence | |||||
| aBoth studies had serious limitations, including lack of blinding for participants and unclear generation of random sequence and allocation concealment. | |||||
| Amiodarone versus other antiarrhythmics for high risk of sudden cardiac death (primary prevention) | |||||
| Patient or population: participants with high risk of sudden cardiac death (primary prevention) | |||||
| Outcomes | Illustrative comparative risks* (95% CI) | Relative effect | No of participants | Quality of the evidence | |
|---|---|---|---|---|---|
| Assumed risk | Corresponding risk | ||||
| Other antiarrhythmics | Amiodarone | ||||
| Sudden cardiac death | Study population | RR 0.44 | 540 | ⊕⊕⊕⊝ | |
| 65 per 1000 | 28 per 1000 | ||||
| All‐cause mortality | Study population | RR 0.37 | 540 | ⊕⊕⊕⊝ | |
| 100 per 1000 | 37 per 1000 | ||||
| *The basis for the assumed risk (e.g. the median control group risk across studies) is provided in footnotes. The corresponding risk (and its 95% confidence interval) is based on the assumed risk in the comparison group and the relative effect of the intervention (and its 95% CI). | |||||
| GRADE Working Group grades of evidence | |||||
| aAll studies had serious limitations, including lack of blinding for participants and unclear allocation concealment. | |||||
| Amiodarone compared to placebo or no treatment for high risk of sudden cardiac death (secondary prevention) | |||||
| Patient or population: participants with high risk of sudden cardiac death (secondary prevention) | |||||
| Outcomes | Illustrative comparative risks* (95% CI) | Relative effect | No of participants | Quality of the evidence | |
|---|---|---|---|---|---|
| Assumed risk | Corresponding risk | ||||
| Placebo or no treatment | Amiodarone | ||||
| Sudden cardiac death | Study population | RR 4.32 | 440 | ⊕⊝⊝⊝ | |
| 8 per 1000 | 35 per 1000 | ||||
| All‐cause mortality | Study population | RR 3.05 | 440 | ⊕⊝⊝⊝ | |
| 32 per 1000 | 99 per 1000 | ||||
| Moderate | |||||
| 35 per 1000 | 107 per 1000 | ||||
| *The basis for the assumed risk (e.g. the median control group risk across studies) is provided in footnotes. The corresponding risk (and its 95% confidence interval) is based on the assumed risk in the comparison group and the relative effect of the intervention (and its 95% CI). | |||||
| GRADE Working Group grades of evidence | |||||
| aVery serious imprecision: quality of the evidence was downgraded two levels because the CI was very wide and includes both important risks and benefits, and because there was a very low number of events. | |||||
| Amiodarone versus other antiarrhythmics for high risk of sudden cardiac death (secondary prevention) | |||||
| Patient or population: participants with high risk of sudden cardiac death (secondary prevention) | |||||
| Outcomes | Illustrative comparative risks* (95% CI) | Relative effect | No of participants | Quality of the evidence | |
|---|---|---|---|---|---|
| Assumed risk | Corresponding risk | ||||
| Other antiarrhythmics | Amiodarone | ||||
| Sudden cardiac death | Study population | RR 1.40 | 839 | ⊕⊝⊝⊝ | |
| 99 per 1000 | 138 per 1000 | ||||
| All‐cause mortality | Study population | RR 1.03 | 898 | ⊕⊕⊝⊝ | |
| 193 per 1000 | 198 per 1000 | ||||
| *The basis for the assumed risk (e.g. the median control group risk across studies) is provided in footnotes. The corresponding risk (and its 95% confidence interval) is based on the assumed risk in the comparison group and the relative effect of the intervention (and its 95% CI). | |||||
| GRADE Working Group grades of evidence | |||||
| aAll studies had serious limitations, including 4/5 not blinded for participants. | |||||
| Amiodarone compared to beta blockers for high risk of sudden cardiac death (secondary prevention) | |||||
| Patient or population: participants with high risk of sudden cardiac death (secondary prevention) | |||||
| Outcomes | Illustrative comparative risks* (95% CI) | Relative effect | No of Participants | Quality of the evidence | |
|---|---|---|---|---|---|
| Assumed risk | Corresponding risk | ||||
| Beta blockers | Amiodarone | ||||
| Sudden cardiac death | Study population | RR 0.84 | 189 | ⊕⊝⊝⊝ | |
| 351 per 1000 | 294 per 1000 | ||||
| All‐cause mortality | Study population | RR 0.96 | 189 | ⊕⊝⊝⊝ | |
| 454 per 1000 | 435 per 1000 | ||||
| *The basis for the assumed risk (e.g. the median control group risk across studies) is provided in footnotes. The corresponding risk (and its 95% confidence interval) is based on the assumed risk in the comparison group and the relative effect of the intervention (and its 95% CI). | |||||
| GRADE Working Group grades of evidence | |||||
| aThe only study has serious limitations, including lack of blinding for participants. | |||||
| Amiodarone versus sotalol for high risk of sudden cardiac death (secondary prevention) | |||||
| Patient or population: participants with high risk of sudden cardiac death (secondary prevention) | |||||
| Outcomes | Illustrative comparative risks* (95% CI) | Relative effect | No of Participants | Quality of the evidence | |
|---|---|---|---|---|---|
| Assumed risk | Corresponding risk | ||||
| Sotalol | Amiodarone | ||||
| Sudden cardiac death | Study population | RR 2.87 | 45 | ⊕⊝⊝⊝ | |
| 45 per 1000 | 130 per 1000 | ||||
| All‐cause mortality | Study population | RR 1.08 | 104 | ⊕⊝⊝⊝ | |
| 137 per 1000 | 148 per 1000 | ||||
| Moderate | |||||
| 132 per 1000 | 143 per 1000 | ||||
| *The basis for the assumed risk (e.g. the median control group risk across studies) is provided in footnotes. The corresponding risk (and its 95% confidence interval) is based on the assumed risk in the comparison group and the relative effect of the intervention (and its 95% CI). | |||||
| GRADE Working Group grades of evidence | |||||
| aThe only study has serious limitations, including lack of blinding for participants. | |||||
Background
Description of the condition
From a clinical point of view, any unexpected death can be considered a 'sudden death', brought on by conditions as diverse as arrhythmias, aortic dissection, subarachnoid haemorrhage, acute myocardial infarction or massive pulmonary embolism. Traumatic death is usually excluded from this category. As there may be prognostic and therapeutic differences (i.e. subarachnoid haemorrhage or pulmonary embolism), researchers and clinicians recognise a distinct category known as 'sudden cardiac death' (SCD). A widely accepted definition is "natural death due to cardiac causes, heralded by abrupt loss of consciousness within an hour of the onset of acute symptoms; pre‐existing heart disease may have been known to be present, but the time and mode of death are unexpected" (Myerburg 2004).
SCD is one of the leading causes of cardiac death. Incidence increases with age and is three to four times more frequent in men than women at all ages (Merghani 2013; MMWR 2002). Accurately estimating its real incidence is difficult, but according to data obtained from death certificates, SCD may cause 63.4% of total cardiac mortality in the United States (MMWR 2002). This data probably overestimates SCD prevalence, as it is based only on clinical presentation (MMWR 2002; Zheng 2001). Incidence rates, varying from 0.36 to 1.28/100,000 participants per year, have been reported by some emergency services, but these tend to underestimate the real incidence, as it only refers to participants who survive to the hospital (Sara 2014). Incidence increases from 1/100,000 for those aged < 35 years to 100/100,000 in individuals aged ≥ 35 years old (John 2012). A prospective observational study reported that 7% to 18% of overall mortality in the general population (of all ages) in the USA was due to SCD (Stecker 2014). Globally, estimated incidence of SCD would then be approximately 4 to 5 million cases every year. However, this number may be inaccurate, as, on the one hand, SCD incidence rates in low‐ and middle‐income countries may not be equivalent to those in high‐income countries (Vedanthan 2012), and on the other hand, incidence has declined over the past two decades, from 4.7 per 1000 person‐years in 1990–2000 to 2.1 per 1000 person‐years in 2001–2010 (Niemeijer 2015).
The main pre‐existing heart disease leading to SCD in high‐income countries is coronary heart disease (CHD); there is a general acceptance that SCD accounts for around 50% of all CHD‐related death and that the proportion of all SCDs resulting from CHD is around 80% (Myerburg 2012). Other types of cardiopathy (e.g. hypertrophic cardiomyopathy, non‐ischaemic cardiomyopathy, arrhythmogenic right ventricular dysplasia) can also lead to SCD, while there is no structural abnormality in only 5% of cases (Consensus 1997). The SCD event is most commonly caused by the sudden onset of monomorphic ventricular tachycardia (VT) that degenerates into ventricular fibrillation (VF), and less frequently by the abrupt onset of polymorphic VT/VF, bradyarrhythmias or heart blocks (Priori 2001; Zipes 2006). However, the proportion of participants with pulseless electrical activity or asystole has increased over the past two decades (Teodorescu 2010).
More recently, research has identified diabetes mellitus as an independent risk factor for SCD (Jouven 2005).
The downward trend in SCD incidence might be due to better diagnosis and treatment of heart disease and most importantly primary prevention of SCD and cardiovascular disease in general through improved management of behaviours and other risk factors (Niemeijer 2015).
In this context, clinicians use electrophysiological (EP) testing with intracardiac recording and electrical stimulation at baseline, followed by administration of antiarrhythmic drugs for arrhythmia assessment and risk stratification. EP testing has been used to document the inducibility of VT, evaluate drug effects, assess the risks of recurrent VT or SCD, and assess the indications for implantable cardiac defibrillator (ICD) therapy. For example, in participants with CHD, asymptomatic non‐sustained VT and a left ventricular ejection fraction (LVEF) less than 40%, the inducibility of sustained VT ranges from 20% to 40% and confers worse prognosis, with an increased risk of SCD or death from other causes (Buxton 2000). However, in participants with CHD and a lower LVEF (less than 30%), non‐inducibility doesn't necessarily portend a good prognosis (Buxton 2002), and persistent inducibility while receiving antiarrhythmic drugs confers an even worse prognosis (Wilber 1990).
Description of the intervention
Amiodarone, one of the main class III antiarrhythmics, is a benzofuran derivative approved by the US Food and Drug Administration (FDA) for the treatment of patients with life‐threatening ventricular tachyarrhythmias when other drugs are ineffective or not tolerated (FDA 2013). Researchers have proposed the drug as an alternative to ICD, categorising it as having a 2a level of evidence (weight of evidence is in favour of usefulness/efficacy) for prophylaxis of SCD in participants with CHD and left ventricular (LV) dysfunction (Zipes 2006).
The onset of action after intravenous administration is generally within one to two hours, but after oral administration, the onset of action may require anywhere from two to three days and often from one to three weeks. On occasion, it may take even longer, to the point that achieving a steady state without a loading dose takes about 265 days (Braunwald 2001).
However, research has also associated the use of amiodarone with toxicity involving the lungs, thyroid gland, liver, eyes, skin and nerves (Connolly 1997). Pulmonary toxicity is the drug's most serious potential adverse effect, and some series have described its frequency as high as 17%, although the incidence when compared with placebo is less than 1% (Pollak 1999). Thyroid toxicity is the most common complication requiring intervention, occurring in up to 10% of participants receiving long‐term amiodarone therapy. Minor adverse effects are nausea, anorexia, photosensitivity, and a blue discolouration of the skin (Siddoway 2003).
The frequency of most adverse effects is related to total amiodarone exposure (Siddoway 2003), but amiodarone is slowly, variably and incompletely absorbed, which makes adverse events unpredictable. Extensive hepatic metabolism occurs with desethylamiodarone as a major metabolite, both extensively accumulating in the liver, lung, fat, 'blue' skin, and other tissues.
How the intervention might work
Generally speaking, class III antiarrhythmic drugs act by prolonging the action potential´s duration of the myocardial cell by lengthening the repolarisation phase and thus the effective refractory period. This prolongation is believed to facilitate termination and prevention of both ventricular re‐entry arrhythmias by producing block within re‐entry circuits, and thus providing both an elevation of the ventricular fibrillation threshold and a reduction of the ventricular defibrillation threshold (Brendorp 2002).
As a class III antiarrhythmic drug, amiodarone prolongs the QT interval, slows the heart rate and atrioventricular nodal conduction (via calcium channel and beta‐receptor blockade), prolongs refractoriness (via potassium and sodium channel blockade), and slows intracardiac conduction (via sodium channel blockade) (Siddoway 2003). By blocking the potassium repolarisation currents, it can inhibit or terminate ventricular arrhythmias by increasing the wavelength for reentry (Zipes 2006).
Why it is important to do this review
According to current evidence, ICD therapy, when compared with antiarrhythmic drugs, reduces mortality in high risk participants with reduced LVEF in both CHD and non‐ischaemic cardiopathy, for both primary and secondary prevention (AVID 1997; Connolly 2000; Desai 2004; Kuck 2000).
While ICD therapy may improve survival in selected patient populations, it may diminish patients' quality of life (Gehi 2006). In a study comparing ICD versus no ICD in participants who underwent coronary artery bypass graft surgery, the use of ICD was associated with lower levels of psychological well‐being and reduced physical and emotional role functioning (Namerow 1999). On the other hand, a recent analysis by Marks et al. from the Sudden Cardiac Death ‐ Heart Failure Trial (SCD‐HeFT) showed that subjective measures of physical function did not differ significantly between the ICD and placebo groups at any time point, but there was a short‐term increase in psychological well‐being among participants with ICD therapy throughout the first year after implantation, a benefit that did not persist at 30 months (Bardy 2005–SCD‐HeFT). The occurrence of ICD shocks reduced the quality of life, but only if quality of life was measured within one to two months after the shock (Bardy 2005–SCD‐HeFT).
However, the elevated up‐front costs of ICD therapy (between EUR 11,000 and 19,000) impede its ready availability in the health systems of low‐ and middle‐income countries, even though costs tend to diminish along patients' longevity (Biffi 2011).
Regarding amiodarone, evidence from trials has been inconsistent, with some studies showing a moderate effect and others no effect at all (Bardy 2005–SCD‐HeFT; Heidenreich 2002; Strickberger 2003). Indirect evidence of effect comes from a recent systematic review concluding that ICD discharges were reduced in participants with ICD plus amiodarone compared to participants with ICD alone. Assuming ICD discharges follow ventricular arrhythmias, one could infer that amiodarone reduces the number of arrhythmic episodes (Ferreira 2007), provided the ICDs were programmed with similar arrhythmia detection times, as different detection times could mean different thresholds for considering any disturbance to be an arrhythmic episode (Scott 2014).
On the other hand, data collected since the 1980s has convincingly proven that beta‐blocking treatment is associated with an improved clinical outcome in several patient groups. The efficacy of this treatment in people with post‐myocardial infarction (MI) relates to a drug‐associated reduction in all‐cause mortality and is not necessarily related to the time after the acute event, when therapy starts (Yusuf 1985). People with a history of congestive heart failure (CHF) or depressed left ventricular function tend to experience the greatest benefits in mortality reduction.
Data suggests that in participants post‐MI, potasium channel blockers such as dofetilide or d‐sotalol have neutral or even harmful effects regarding all‐cause mortality (Køber 2000; Torp‐Pedersen 1999; Waldo 1996), and, for example, both of these drugs result in a higher rate of Torsade de Pointes than amiodarone (Brendorp 2002). However, calcium‐channel blockers such as verapamil have shown favourable effects, if only in people without heart failure (DAVIT II 1990).
It is also important to note that chronic treatment with antiarrhythmic drugs is associated with severe adverse effects, including the potential induction of life‐threatening arrhythmias (e.g. increased mortality is associated with the long‐term use of quinidine; Coplen 1990).
A previous systematic review of randomised controlled trials, which evaluated amiodarone versus other antiarrhythmics or placebo for the prevention of SCD in participants with or without ICD, concluded that it significantly reduced SCD and cardiac mortality, but not all‐cause mortality. However, the authors did not carry out a separate analysis for participants with or without ICD, and the review only evaluated amiodarone for primary prevention (Piccini 2009).
If amiodarone proves to be beneficial in SCD prevention, it would constitute a valid alternative in situations where economic constraints limit the widespread use of ICD.
Objectives
To evaluate the effectiveness of amiodarone for primary or secondary prevention in SCD compared with placebo or no intervention or any other antiarrhythmic drugs in participants with high risk (primary prevention), or who have recovered from a cardiac arrest or a syncope due to Ventricular Tachycardia/Ventricular Fibrillation, or VT/VF (secondary prevention).
Methods
Criteria for considering studies for this review
Types of studies
Randomised and quasi‐randomised controlled trials. We considered a trial as quasi‐randomised when the authors used methods such as alternation or case record number.
Types of participants
Primary prevention
Adults (16 years or older) with:
-
reduced LVEF (< 40%), independent of the aetiology (ischaemic or non‐ischaemic); or
-
high risk for SCD, e.g. participants without structural heart disease but with a high risk cardiac condition, such as refractory sustained or non sustained VT, or non‐suppressible malignant arrhythmias induced by EP study.
Secondary prevention
Adults (16 years or older) who have recovered from cardiac arrest or syncope due to VT/VF of non‐ischaemic aetiology, or of ischaemic aetiology after 48 hours from the ischaemic event.
We also included studies involving participants with an ICD plus amiodarone versus ICD plus placebo or another antiarrhythmic drug.
Exclusion criteria
People with genetic arrhythmia syndromes with specific treatments, such as:
-
Brugada syndrome;
-
long QT syndrome;
-
arrhythmogenic right ventricular dysplasia.
Types of interventions
Amiodarone at ≥ 200 mg/d, by any route of administration, for at least six months, compared to other antiarrhythmics, placebo or no intervention.We excluded studies of amiodarone combined with other antiarrhythmic drugs in a sequential manner (i.e. based on EP studies).
Types of outcome measures
Primary outcomes
-
Sudden cardiac death (as defined in the studies)
-
All‐cause mortality
-
Cardiac mortality (as defined in the studies)
Secondary outcomes
-
Quality of life
-
Adverse effects
Search methods for identification of studies
Electronic searches
We conducted sensitive electronic searches of the Cochrane Central Register of Controlled Trials (CENTRAL) (Issue 2 of 12, 2015), MEDLINE (OVID, 1946 to March week 4 2015), EMBASE (OVID, 1980 to 2015 week 12), CINAHL (EBSCO, 1937 to 26 March 2015), LILACS (1982 to 26 March 2015), Database of Abstracts of Reviews of Effects (DARE) (Issue 3, 2014) and the NHS Economic Evaluation Database (NEED) (The Cochrane Library, Issue 3, 2014) on 26 March 2015. We based our search strategies on a combination of controlled vocabulary and the randomised clinical trials phases of the highly sensitive search strategy for MEDLINE (Lefebvre 2008), the EMBASE strategy for EMBASE or an adaptation of these for the other databases. The detailed strategies for the different databases are in Appendix 1.
We applied no language restrictions.
Searching other resources
We handsearched reference lists of included trials and relevant review articles. We looked for ongoing trials from the WHO International Clinical Trials Registry Platform (http://apps.who.int/trialsearch/) and ClinicalTrials.gov (http://www.clinicaltrials.gov/). We also handsearched for relevant abstracts from the following conferences: World Congress of Cardiology, European Society of Cardiology (ESC) Congress, American College of Cardiology (ACC) Annual Scientific Sessions, the Heart Rhythm Society's Annual Scientific Sessions, and the European Heart Rhythm Association (EUROPACE) Congress for the last eight years (2005‐2013).
We also contacted experts in the field, pharmaceutical companies and authors of identified trials in order to identify studies missed by our search strategy.
Data collection and analysis
Selection of studies
Two authors (JC, RC) independently scanned all the titles and abstracts, selecting potentially eligible studies to be evaluated in full text. JC and RC independently assessed the full text of all potentially eligible studies. A third author (LML) resolved discrepancies.
Data extraction and management
Two authors (JC, RC) independently extracted data from included studies using forms designed by the review authors. We resolved discrepancies by discussion and when we could not reach a consensus, we consulted a third author (LML). We contacted authors by email to provide missing data.
Assessment of risk of bias in included studies
Two authors (JC, RC) independently assessed the risk of bias of each included study using the Cochrane 'Risk of bias' assessment tool for seven domains (Higgins 2011a). We resolved discrepancies by discussion and when we could not reach a consensus, we consulted a third author (LML). The seven domains assessed were: sequence generation, allocation concealment, blinding of participants, blinding of outcome assessors, incomplete outcome data, selective outcome reporting and other sources of bias.
Following the definitions presented in the Cochrane Handbook for Systematic Reviews of Interventions, we decided whether the risk of bias was high, low, or unclear for each domain. We contacted authors whenever there were missing or unclear descriptions.
Measures of treatment effect
We reported pooled outcomes as risk ratios (RRs) with 95% confidence intervals (CI) for dichotomous outcomes. We reported mean difference (MD) with 95% CI for continuous outcomes, or standardised mean differences (SMD) when studies reported outcomes using different scales.
Unit of analysis issues
We analysed data using participants as the unit of analysis. If there were more than two active treatment arms, we pooled the participants included in each arm into a single group (e.g. 'other antiarrhythmics'). We took appropriate action to avoid double‐counting participants between study arms.
Dealing with missing data
We attempted to contact the main author of trials with missing data in order to verify key study characteristics and obtain missing numerical outcome data.
Assessment of heterogeneity
We assessed heterogeneity quantitatively with a formal statistical test (Q statistic) and the I2 statistic. We defined statistically significant heterogeneity as at least one positive test (establishing a cut‐off value of P = 0.10 for the Mantel‐Haenszel Chi2 test, or values over 50% using the I2 statistic) (Higgins 2011b).
Data synthesis
We performed statistical analysis in accordance with the guidelines for statistical analysis developed by Cochrane (Higgins 2011b). Whenever possible, we carried out meta‐analyses using the random‐effects model.
One author (RC) entered data into Review Manager (RevMan 2014) and a second author (JC) checked them (RevMan 2014).
We conducted all our analyses separately for primary and secondary prevention. We conducted separate analyses for participants with and without an ICD, given the much lower baseline risk of the former.
For participants in all of these groups, we evaluated the following comparisons.
-
Amiodarone versus placebo or no intervention.
-
Amiodarone versus other antiarrhythmics (including beta‐blockers).
-
Amiodarone versus beta‐blockers alone.
Subgroup analysis and investigation of heterogeneity
We planned to conduct subgroup analyses for participants with and without ICD, LVEF above and below 35% and ischaemic and non‐ischaemic aetiology, both for primary and secondary prevention, but we were only partly able to do so.
Sensitivity analysis
We intended to perform a sensitivity analysis including and excluding quasi‐randomised trials, but since we did not find any quasi‐randomised trials, we did not perform the analysis.
Summary of findings table and GRADE assessment
We have created summary of findings table for the outcomes sudden cardiac death and all‐cause mortality. We rated the quality of the evidence according to GRADE.
Results
Description of studies
Results of the search
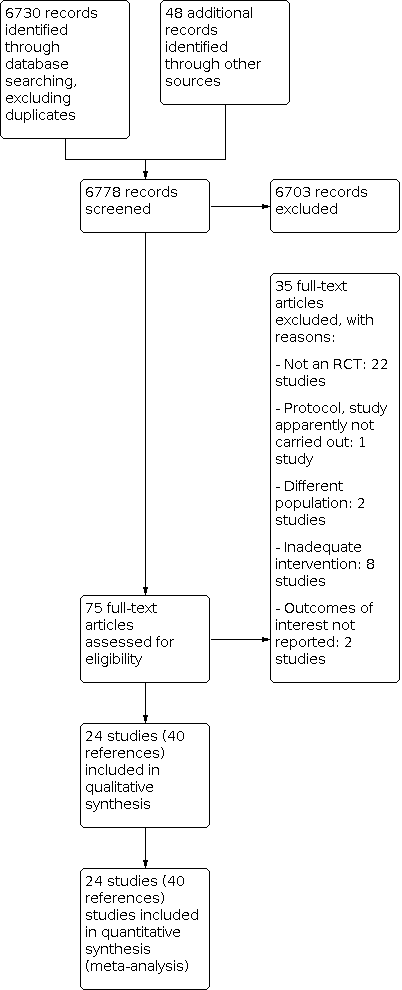
The search yielded 6778 original records. After assessing titles and abstracts, we retrieved 75 full text articles and reviewed them for inclusion. Finally, we included 24 eligible studies comprising 9,997 participants in the review (Figure 1). The trials were reported in 40 records, as some studies presented the information in separate articles (Bardy 2005–SCD‐HeFT; Burkart 1990–BASIS; Ceremuzynski 1992; Elizari 2000–GEMICA; Greene 1993–CASCADE; Hockings 1987; Julian 1997–EMIAT; Kovoor 1999; Kowey 2011–ALPHEE; Navarro‐López 1993–SSSD; Singh 1995–STAT‐CHF; Zehender 1992).

Study flow diagram.
Included studies
Eighteen studies assessed the role of amiodarone for primary prevention (Bardy 2005–SCD‐HeFT; Biswas 1996; Burkart 1990–BASIS; Cairns 1991–CAMIATpilot; Cairns 1997–CAMIAT; Ceremuzynski 1992; Doval 1994–GESICA; Elizari 2000–GEMICA; Fournier 1989; Garguichevich 1995–EPAMSA; Hamer 1989; Hockings 1987; Julian 1997–EMIAT; Navarro‐López 1993–SSSD; Nicklas 1991; Singh 1995–STAT‐CHF; Sousonis 2014; Zehender 1992). Of these, all but Fournier 1989 compared amiodarone with placebo or no intervention. Two compared amiodarone with beta‐blockers (Fournier 1989; Navarro‐López 1993–SSSD), and one compared amiodarone with other antiarrhythmics (Burkart 1990–BASIS). We did not identify any study of amiodarone plus ICD versus ICD alone for primary prevention.
Six studies evaluated amiodarone for secondary prevention (Connolly 2006–OPTIC; Greene 1993–CASCADE; Harper 1989; Kovoor 1999; Kowey 2011–ALPHEE; Kuck 2000–CASH). Three of them evaluated amiodarone plus ICD (Connolly 2006–OPTIC; Greene 1993–CASCADE; Kowey 2011–ALPHEE).
Three studies included more than one comparison (Burkart 1990–BASIS; Kowey 2011–ALPHEE; Navarro‐López 1993–SSSD).
Excluded studies
We excluded 35 studies after reviewing the full text reports, mainly because they were not randomised or were narrative reviews. We considered one study (originally presented as an abstract) to be eligible, but in the end we excluded it because it did not provide enough information, and there was no response from the author (Warner‐Stevenson 1996). One study was published in the form of a protocol, and investigators have not published its results yet (NIPPON 2006). We have attempted to contact the author twice, with no success. For further information see Characteristics of excluded studies and Characteristics of ongoing studies.
Risk of bias in included studies
We present details of our 'Risk of bias' judgments in Characteristics of included studies, and in the summary graphs in Figure 2 and Figure 3.

Risk of bias graph: review authors' judgements about each risk of bias item presented as percentages across all included studies.

Risk of bias summary: review authors' judgements about each risk of bias item for each included study.
Allocation
Only one study had high risk of bias for allocation because some participants were included without proper randomisation (Zehender 1992).
Sixteen studies had an unclear risk of bias, since they stated that randomisation took place but did not provide details on the process of random sequence generation or allocation concealment (Bardy 2005–SCD‐HeFT; Biswas 1996; Burkart 1990–BASIS; Cairns 1991–CAMIATpilot; Ceremuzynski 1992; Fournier 1989; Garguichevich 1995–EPAMSA; Greene 1993–CASCADE; Hamer 1989; Hockings 1987; Kovoor 1999; Kuck 2000–CASH; Navarro‐López 1993–SSSD; Nicklas 1991; Singh 1995–STAT‐CHF; Sousonis 2014).
Blinding
More than half of the studies lacked an appropriate method for patient and personnel blinding (Biswas 1996; Burkart 1990–BASIS; Connolly 2006–OPTIC; Doval 1994–GESICA; Fournier 1989; Garguichevich 1995–EPAMSA; Greene 1993–CASCADE; Hamer 1989; Harper 1989; Hockings 1987; Kovoor 1999; Kuck 2000–CASH; Navarro‐López 1993–SSSD; Sousonis 2014; Zehender 1992). Fourteen studies had an unclear risk of bias in blinding of outcome assessment (Biswas 1996; Elizari 2000–GEMICA; Fournier 1989; Garguichevich 1995–EPAMSA; Greene 1993–CASCADE; Hamer 1989; Harper 1989; Hockings 1987; Kovoor 1999; Kuck 2000–CASH; Navarro‐López 1993–SSSD; Nicklas 1991; Sousonis 2014; Zehender 1992), mainly because of poor reporting.
Incomplete outcome data
We judged four studies to be at high risk of bias due to incomplete outcome data (Biswas 1996; Garguichevich 1995–EPAMSA; Hockings 1987; Sousonis 2014), mainly because of an important loss of participants to follow‐up (up to 21%).
Selective reporting
We judged all of the studies to be at low risk of bias for selective reporting, except Zehender 1992, which we deemed at unclear risk, as it provided little information.
Other potential sources of bias
One study provided different numbers of participants in two reports of the same study (Elizari 2000–GEMICA). Kowey 2011–ALPHEE presented some inconsistencies in the reporting of mortality rates. We deemed four studies as being at high risk of bias because of their small size, which could unbalance some confounding factors (Hamer 1989; Kovoor 1999; Sousonis 2014; Zehender 1992). Two studies stopped early for benefit (Doval 1994–GESICA; Elizari 2000–GEMICA), and another two had a high risk of performance bias due to participants receiving co‐interventions (Harper 1989; Hockings 1987).
Effects of interventions
See: Summary of findings 1 Amiodarone compared to placebo or no treatment for high risk of Sudden Cardiac Death (primary prevention); Summary of findings 2 Amiodarone compared to beta blockers for high risk of sudden cardiac death (primary prevention); Summary of findings 3 Amiodarone compared to other antiarrhythmics for high risk of sudden cardiac death (primary prevention); Summary of findings 4 Amiodarone compared to placebo or no treatment for high risk of sudden cardiac death (secondary prevention); Summary of findings 5 Amiodarone compared to other antiarrhythmics for high risk of sudden cardiac death (secondary prevention); Summary of findings 6 Amiodarone compared to beta blockers for high risk of sudden cardiac death (secondary prevention); Summary of findings 7 Amiodarone compared to sotalol for high risk of sudden cardiac death (secondary prevention)
Primary Prevention
Sudden Cardiac Death
Seventeen studies comprising 8383 participants reported sudden cardiac death when comparing amiodarone versus placebo or no treatment. Amiodarone decreased the risk of SCD (RR 0.76; 95% CI 0.66 to 0.88; I2= 0%; Analysis 1.1).
In absolute terms, using the average SCD in the control group of the studies as baseline risk, the number of SCD may decrease from 91 per 1000 people to 70 per 1000 (95% CI 61 to 81), but the quality of the evidence is low for this outcome (summary of findings Table 1).
In two studies (342 participants) that compared amiodarone with beta‐blockers, amiodarone decreased the risk for SCD (RR 0.37; 95% CI 0.11 to 1.22, I2= 0%, Chi2 P = 0.95, Analysis 3.1).
In absolute terms, based on the baseline risk of these two studies, the risk of SCD may decrease or increase (risk without amiodarone 56 per 1000 participants, with amiodarone to 21 per 1000, 95% CI 6 to 68). The quality of the evidence is low for this outcome (summary of findings Table 2).
In three studies (540 participants) comparing amiodarone to other antiarrhythmics (including beta‐blockers), amiodarone decreased the risk of SCD (RR 0.44; 95% CI 0.19 to 1.00, I2= 0%; Analysis 2.1).
In absolute terms, based on the baseline risk of these three studies, the number of SCD may decrease from 65 per 1000 people to 28 per 1000 (95% CI 12 to 65). The quality of the evidence is moderate for this outcome (summary of findings Table 3).
Cardiac mortality
Seventeen studies (comprising 8383 participants) reported cardiac mortality, comparing to placebo or no treatment. There was a slight but significant decrease in cardiac mortality among the amiodarone group (RR 0.86; 95% CI 0.77 to 0.96, Analysis 1.2). Compared to any other antiarrhythmics (3 studies, 540 participants), amiodarone reduced the risk of cardiac mortality (RR 0.41; 95% CI 0.20 to 0.86, Analysis 2.2), a reduction that persisted when compared solely to beta‐blockers (2 studies, 342 participants), (RR 0.31, 95% CI 0.11 to 0.84, Analysis 3.2).
I2 was < 10% for all the comparisons.
All‐cause mortality
In 17 studies (8383 participants) that compared amiodarone versus placebo or no treatment, amiodarone reduced all‐cause mortality (RR 0.88; 95% CI 0.78 to 1.00, I2 = 28%) (Analysis 1.3).
In absolute terms, and compared to the baseline risk of these studies, the number of deaths may decrease from 203 per 1000 people to 178 per 1000 (95% CI 158 to 203); however, the quality of the evidence is low for this outcome (summary of findings Table 1).
Compared to beta‐blockers, amiodarone significantly decreased the risk of mortality from any cause (RR 0.27; 95% CI 0.10 to 0.75, I2= 0%; Analysis 3.3).
In absolute terms, based on the baseline risk of these studies, the number of deaths may decrease from 101 per 1000 people to 27 per 1000 (95% CI 10 to 75); however, the quality of the evidence is low for this outcome (summary of findings Table 2).
Amiodarone also reduced all‐cause mortality when compared with other antiarrhythmics (RR 0.37; 95% CI 0.18 to 0.76, I2= 0%) (Analysis 2.3).
In absolute terms, compared to the baseline risk of these studies, the number of deaths may decrease from 100 per 1000 people to 37 per 1000 (95% CI 18 to 76), a finding supported by evidence of moderate quality (summary of findings Table 3).
Subgroup analyses
When separately analysing the people at risk due to CHF versus those post‐MI, amiodarone compared with placebo or no treatment reduced the risk of SCD in both subgroups (for post‐MI participants: RR 0.65, 95% CI 0.46 to 0.91, Analysis 1.4; and for CHF participants: RR 0.79, 95% CI 0.67 to 0.93, Analysis 1.5 I2 = 0% for both comparisons).
Regarding all‐cause mortality, there was a small and non‐significant difference favouring amiodarone over the control both in the post‐MI (RR 0.84, 95% CI 0.61 to 1.16, Analysis 1.6) and in the CHF subgroups (RR 0.90, 95% CI 0.80 to 1.01 Analysis 1.7).
We were not able to carry out any other pre‐planned subgroup analyses, as we did not obtain the information regarding different LVEF, and there was no concomitant ICD therapy in primary prevention.
Secondary Prevention
Sudden Cardiac Death
Regarding the role of amiodarone for secondary prevention of SCD when compared with placebo or no intervention, we found two studies comprising 440 participants. Amiodarone appeared to non‐significantly increase the risk for SCD, as the RR is higher than 1 (RR 4.32, 95% CI 0.87 to 21.49, I2= 0%; Analysis 4.1). However, it is not possible to conclude whether amiodarone increases or decreases the risk of SCD compared to placebo or no intervention because the quality of the evidence is very low for this outcome (summary of findings Table 4).
Four studies with 839 participants compared amiodarone with other antiarrhythmics (RR f1.40, 95% CI 0.56 to 3.52, I2 = 72%; Analysis 5.1. Again, it was not possible to determine whether amiodarone increases or decreases the risk of SCD (although it would seem it increases the risk) compared to other antiarrhythmics because the quality of the evidence is very low for this outcome (summary of findings Table 5).
Only one study with 189 participants compared amiodarone with beta‐blockers for secondary prevention of SCD (Kuck 2000–CASH). It would seem that amiodarone has a small, non‐significant effect decreasing the risk of SCD (RR RR 0.84, 95% CI 0.55 to 1.27). However, we must be cautious, because the quality of the evidence, for this single study, is very low for this outcome (summary of findings Table 6). It is not possible to determine whether amiodarone increases or decreases the risk of SCD compared to beta‐blockers .
Likewise, only one study with 45 participants compared amiodarone with sotalol, another class III antiarrhythmic (Kovoor 1999) (RR 2.87, 95% CI 0.32 to 25.55). As stated above, it is not possible to determine whether amiodarone increases or decreases the risk of SCD (although the RR is higher than 1, thus increasing the risk) compared to sotalol because the quality of the evidence, for this single study, is very low for this outcome (summary of findings Table 7).
Cardiac mortality
We found very little information about the effect of amiodarone on reducing the risk of cardiac mortality. Of the six studies evaluating amiodarone for secondary prevention, only two studies (243 participants) considered this outcome, comparing amiodarone with other antiarrhythmics (Greene 1993–CASCADE; Kovoor 1999) (RR of 0.77 with a 95% CI of 0.49 to 1.21, I2=0%; Analysis 5.2) thus showing a small, non‐significant decrease in risk.
All‐cause mortality
The same two studies that evaluated the role of amiodarone in reducing the risk of SCD for secondary prevention when compared with placebo or no intervention evaluated its effect on reducing all‐cause mortality (Connolly 2006–OPTIC; Kowey 2011–ALPHEE). Amiodarone increased the risk for all‐cause mortality in this population (RR 3.05; 95% CI 1.33 to 7.01, I2 = 0%, Chi2 P = 0.96; Analysis 4.2).
In absolute terms, compared with the baseline risk of these studies, amiodarone may increase the risk of SCD from 32 per 1000 people to 99 per 1000 (95% CI 43 to 227), but the quality of the evidence is very low for this outcome (summary of findings Table 4).
Five studies with 898 participants compared the effect of amiodarone versus other antiarrhythmics on all‐cause mortality (RR 1.03, 95% CI 0.75 to 1.42, I2 = 27%; (Analysis 5.3). In absolute terms, compared with the baseline risk of these studies, the risk of all‐cause mortality may decrease or increase (risk without amiodarone 193 per 1000 people, with amiodarone 198 per 1000, 95% CI 144 to 273). The quality of the evidence is low for this outcome (summary of findings Table 5).
Regarding all‐cause mortality, the same study that compared amiodarone and beta‐blockers for SCD prevention also compared them for all‐cause mortality prevention (Kuck 2000–CASH) (RR 0.96, 95% CI 0.70 to 1.32). It was not possible to determine whether amiodarone increases or decreases the risk of SCD compared to beta‐blockers because the quality of the evidence, for this single study, is very low for this outcome (summary of findings Table 6).
However, there were two studies with 104 participants comparing the effect of amiodarone with sotalol on all‐cause mortality (Harper 1989, Kovoor 1999) (RR 1.08, 95% CI 0.41 to 2.83). It was not possible to determine whether amiodarone increases or decreases the risk of SCD compared to sotalol because the quality of the evidence is very low for this outcome (summary of findings Table 7).
Subgroup analyses
For secondary prevention, all of the studies comparing amiodarone with placebo or no intervention enrolled participants with ICD, so we were not able to carry out a subgroup analysis comparing participants with or without ICD. The only subgroup analysis we were able to perform was for amiodarone versus other antiarrhythmics for participants with or without ICD.
There were five studies with 898 participants included in that comparison (Greene 1993–CASCADE; Harper 1989; Kovoor 1999; Kowey 2011–ALPHEE; Kuck 2000–CASH). Of these, Harper 1989; Kovoor 1999 and Kuck 2000–CASH compared amiodarone with other antiarrhythmics in participants without an ICD, whereas Greene 1993–CASCADE and Kowey 2011–ALPHEE compared amiodarone with other antiarrhythmics but in participants with an ICD. However, while in Kowey 2011–ALPHEE all the participants enrolled had an ICD implanted before entering the study, this was true for only about half of the participants in Greene 1993–CASCADE, and we were not able to get the information on which participants in each arm had an ICD implanted before or during the study. Thus, we considered that only Kowey 2011–ALPHEE was fit for this analysis.
Regarding SCD in participants with ICD, amiodarone seemed to increase its risk (RR 24.45, 95% CI 2.79 to 214.59; Analysis 5.4), based solely on Kowey 2011–ALPHEE. However, when analysing the participants without ICD (two studies: Kovoor 1999; Kuck 2000–CASH) (RR 0.96, 95% CI 0.45 to 2.05, I2= 16%; Analysis 5.5).
Furthermore, for all‐cause mortality, amiodarone showed a similar effect; for participants with ICD (RR 1.96, 95% CI 0.98 to 3.93 (Analysis 5.6)), but for participants without ICD (RR is 0.97, 95% CI 0.72 to 1.31, I2 = 0%; (Analysis 5.7).
It is important to acknowledge the fact that the use of amiodarone and sotalol as adjunctive therapy for suppression of supraventricular and ventricular arrhythmias is an important part of management of ICD patients, but one of the studies that evaluated the effect of amiodarone and sotalol on defibrillator thresholds (DFT), the OPTIC trial (Hohnloser 2006), found that although amiodarone increased DFT, the effect size was very small.
Quality of Life
There was only one study that analysed quality of life, in which Marks et al. reported the results in a separate paper from the primary study record (Bardy 2005–SCD‐HeFT). Therefore, we were not able to perform a meta‐analysis. However, it is worth mentioning the authors focused on two pre‐specified primary outcomes, cardiac‐specific physical functioning (laid down in the Duke Activity Status Index (DASI), which ranges from 0 to 58, with higher scores indicating better function), and psychological well‐being (as measured by the Medical Outcomes Study 36‐Item Short‐Form (SF‐36) Mental Health Inventory (MHI‐5), which range from 0 to 100, with higher scores indicating better function).
In both outcomes, the difference in quality of life between amiodarone and placebo was not significant at any point throughout the study; we only displayed the differences at 30 months (Analysis 8.1; Analysis 8.2).
Adverse Effects
Most included studies considered adverse effects in one way or another. Adverse effects were significantly more frequent in the amiodarone arm.
Across all the studies, the incidence of thyroid‐related adverse effects, whether they meant hypo‐ or hyperthyroidism, was higher with amiodarone, regardless of what it was compared to: placebo, no intervention, or other antiarrhythmics. However, it is important to remark that for most of the studies, the alterations in thyroid function were not clinical, but laboratory‐related, both for hypo‐ and hyperthyroidism, which is an important fact to take into consideration when applying these findings to the clinical setting. The RR for the comparison with placebo is 4.14, 95% CI 1.54 to 11.17, I2 = 63% for hyperthyroidism (Analysis 9.1) and a RR of 6.13, 95% CI 2.46 to 15.28, I2 = 14% for hypothyroidism (Analysis 9.2). When comparing with other antiarrhythmics, the RR is 7.43, 95% CI 1.33 to 41.57, I2 = 0% for hyperthyroidism (Analysis 10.1), a RR of 7.77, 95% CI 1.85 to 32.68, I2 = 26% for hypothyroidism (Analysis 10.2) and when comparing with no treatment, the RR is 4.97, 95% CI 0.60 to 41.16, I2 = 0% for hyperthyroidism (Analysis 11.1) and a RR of 12.82 with a 95% CI 0.73 to 225.33, based on events occurring on only one study, for hypothyroidism (Analysis 11.2).
Likewise, regarding the pulmonary effects, when comparing amiodarone with placebo, the RR is 1.66 (95% CI 1.15 to 2.40, I2 = 0%, Analysis 9.3). When comparing it with other antiarrhythmics, the RR is 2.30, 95% CI 0.36 to 14.67, I2 = 51% (Analysis 10.4). The comparison with no treatment has an RR of 14.79, 95% CI 0.85 to 256.43, based on solely one study (Analysis 11.3).
Finally, when we compared the rates of discontinuation as an adverse effect, amiodarone had a higher rate of discontinuation when compared with placebo (RR 1.45, 95% CI 1.26 to 1.67, I2 = 51%, Chi2 P = 0.02, Analysis 9.4). When comparing with other antiarrhythmics, the RR is 1.06, 95% 0.84 to 1.33, I2 = 0%, Analysis 10.4).
Sensitivity analysis
We were unable to do perform a sensitivity analysis including and excluding quasi‐randomised trials because we did not identify any trials using this design.
Discussion
Summary of main results
Amiodarone vs placebo or no treatment
For primary prevention, the meta‐analysis of 17 trials with 8383 participants did show beneficial effects of amiodarone compared with placebo or no treatment relative to SCD, cardiac mortality and all‐cause mortality. However, amiodarone was associated with increased adverse effects, both thyroid and pulmonary (based on 12 studies), and increased risk of discontinuation (based on 13 studies) when compared with placebo.
Only one study reported on quality of life, with no conclusive effects of amiodarone over placebo.
The overall quality of evidence was low.
Regarding secondary prevention, this review could not conclusively rule out either beneficial or harmful effects of amiodarone compared with placebo or no treatment (two studies, 440 participants) relative to SCD, cardiac mortality or all‐cause mortality.
The overall quality of evidence was low or very low.
We were not able to demonstrate a subgroup effect in post‐MI population.
Amiodarone vs alternatives
For primary prevention, when compared to other antiarrhythmics, amiodarone also had a beneficial effect on SCD, cardiac mortality and all‐cause mortality. Moreover, it did not conclusively increase the risk of pulmonary adverse effects (six studies) or discontinuation (eight studies); however, it did increase the risk of thyroid effects (seven studies).
Regarding secondary prevention, this review did not conclusively rule out either beneficial or harmful effects of amiodarone compared with other antiarrhythmics (five studies, 898 participants), relative to SCD or all‐cause mortality because the quality of the evidence was very low.
Very little evidence supports more specific comparisons in this group, like amiodarone versus beta‐blockers or sotalol, and what evidence exists does not change the overall effect of no benefit of amiodarone for any of the mentioned outcomes.
Overall completeness and applicability of evidence
SCD incidence rates may differ significantly between high‐, and low‐ and‐middle income countries, as well as between different geographical regions (Vedanthan 2012), although data regarding SCD in Latin America seems to be similar to high‐income countries in terms of incidence and epidemiological profile, differing only in a higher prevalence of Chagas disease as the cause of SCD (Braggion‐Santos 2015). However, and despite the methodological flaws that studies in low‐ and middle‐income countries may have, CHD remains the most prevalent cause of SCD.
The included trials in our review recruited participants with different baseline risks (primary and secondary prevention) and risk factors for SCD; for example, 12% to 30% of participants across the studies had diabetes, and 11% to 100% had CHD. Trials used different definitions for CHF, and the use of beta‐blockers in study participants varied from 3% in Singh 1995–STAT‐CHF to 90% in Kowey 2011–ALPHEE. Despite this variability, most analyses did not reveal heterogeneity, which should increase the applicability of the results. Differences in clinical practice in some of the earlier trials may explain the variability in the use of beta‐blockers, as their use was not yet widespread in the 1990s despite the evidence supporting the treatment for CHD or CHF (AHA Heart Failure 1995). In fact, analysing trials by descending order of publication date, we observe an increasing use of beta‐blockers, particularly after the year 2000.
Likewise, we found pronounced differences in the definition of heart failure used as inclusion criteria for the primary studies, ranging from LVEF of 30% to 45%. One study did not even quantify LVEF, only stating that all participants had "severe congestive HF" (Hamer 1989).
Similarly, we found great variability regarding the time window after MI when participants were considered eligible for the primary studies, ranging from 24 hours to 28 days.
We had initially intended to carry out a separate analysis for participants with and without ICD. There were only three studies that included participants with ICD (Connolly 2006–OPTIC; Greene 1993–CASCADE; Kowey 2011–ALPHEE), and Greene 1993–CASCADE included participants with an ICD installed during the study, without being planned previously. Furthermore, it didn't state in any of its reports how many participants in each arm finally had an ICD implanted. We were unable to get that information from the authors.
We did not find any main study on primary prevention that enrolled participants with ICD and met our inclusion criteria, or on secondary prevention that compared amiodarone with placebo or no intervention that enrolled participants without ICD. Thus, we were not able to perform the majority of planned analyses.
As the data from Greene 1993–CASCADE did not allow us to clearly identify participants with or without an ICD, we were not able to include this study in any of our subgroup analyses on the effect of amiodarone in participants with or without ICD.
As far as we know, this is the first systematic review to take into account the outcome 'quality of life'. However, only Bardy 2005–SCD‐HeFT included this outcome.
Quality of the evidence
Unfortunately, even though the clinical question we address has been the subject of research for over two decades, the quality of the evidence is very low for many relevant comparisons, and low or moderate for the rest.
For primary prevention in high risk participants, our results show that amiodarone may lead to lower SCD and all‐cause mortality compared with placebo or no treatment, and it may also lead to lower mortality compared with beta blockers. The quality of this evidence is low (summary of findings Table 1; summary of findings Table 2).
Compared to other antiarrhythmics, amiodarone probably decreases the risk of both SCD and all‐cause mortality in high risk participants. The quality of this evidence is moderate (summary of findings Table 3).
The existing evidence of amiodarone for secondary prevention of SCD is of very low quality, so it is uncertain whether it has any impact on mortality (summary of findings Table 4; summary of findings Table 5; summary of findings Table 6; summary of findings Table 7).
We want to underline that when comparing amiodarone with placebo or no intervention in this setting, amiodarone seems to have a deleterious effect both on SCD and all‐cause mortality, but evidence is based on only two studies (440 participants). When evaluating in detail both protocols, we can see that in Connolly 2006–OPTIC, the primary outcome was the number of appropriate shocks delivered by the ICD, while investigators considered death—whether due to arrhythmia or any other cause—to be an adverse effect. Thus, the study was not intended nor had the power to detect differences in mortality between the two groups of participants. Likewise, in Kowey 2011–ALPHEE, the main comparison was celivarone versus placebo, with the inclusion of amiodarone as a positive control arm. For this reason, there was no sample size calculation for amiodarone in this study. Since neither study was designed to evaluate this outcome, we have to interpret their results with certain caution.
It is also important to underline that there is an important underreporting of clinical or methodological data in the primary studies, especially among earlier publications. This fact undoubtedly had an influence in our 'Risk of bias' assessment for the primary studies, which had high degrees of uncertainty for certain domains.
There may also be some publication bias (Figure 4, Figure 5; Figure 6).

Funnel plot of comparison: 1 Amiodarone versus placebo or no treatment for primary prevention, outcome: 1.1 Sudden cardiac death.

Funnel plot of comparison: 1 Amiodarone versus placebo or no treatment for primary prevention, outcome: 1.2 Cardiac mortality.

Funnel plot of comparison: 1 Amiodarone versus placebo or no treatment for primary prevention, outcome: 1.3 All‐cause mortality.
Potential biases in the review process
Our systematic approach to searching, selecting studies, and extracting data should have minimised the likelihood of missing relevant trials. We excluded one trial that included participants with severe CHF but did not report either the rates of SCD or all‐cause mortality (Warner‐Stevenson 1996).
We were not able to obtain key information from several studies despite repeated attempts to contact the main author. This may have introduced bias.
We carried out a subgroup analysis comparing participants with CHF or MI as the main risk factor for presenting SCD. There were no major differences between them, but it is important to note that most of the studies included one or the other population, so the differences were analysed inter‐study, not intra‐study, with all the limitations this can entail (differences can be explained by population characteristics' differences, different co‐interventions, different risks of bias, etc).
Agreements and disagreements with other studies or reviews
There are six previously published systematic reviews analysing the role of amiodarone for prevention of sudden death (Connolly 1997; Heidenreich 2002; Piccini 2009; Piepoli 1998; Sim 1997; Teo 1993). All of them show some benefit from amiodarone over placebo or no intervention, with reduction in death rates varying from 20% to 30%, mainly due to reductions in SCD and cardiac mortality, but with conflicting results regarding all‐cause mortality.
Thus, Connolly 1997 classifies the studies included according to the main risk factor for SCD—CHF or post‐MI—but does not carry out a separate analysis for each subgroup, only analysing the pool of studies as a whole.
However, these systematic reviews have two main differences from our review. First of all, the search strategy is not as comprehensive as the one we used. Secondly, previous meta‐analyses combine studies which bear important differences between them, such as combining primary or secondary prevention, or including participants with and without ICD. These differences, if not taken into account, may distort or change the conclusions.
Thus, for this systematic review, we catalogued and analysed each study according to the baseline characteristics of the participants, whether the study was intended for primary or secondary prevention, whether it compared amiodarone with placebo or other antiarrhythmics, or whether the participants had an ICD implanted or not.
Our review included all of the studies considered in the previous reviews except Mahmarian 1994, which evaluated participants taking placebo or amiodarone in very low doses (two groups, each one taking 50 or 100 mg) and for only three months.
To sum up, we can conclude that our results are quite consistent with the findings of previous reviews, but with a more robust methodology, especially regarding the searching and assessment processes.
Study flow diagram.

Risk of bias graph: review authors' judgements about each risk of bias item presented as percentages across all included studies.

Risk of bias summary: review authors' judgements about each risk of bias item for each included study.

Funnel plot of comparison: 1 Amiodarone versus placebo or no treatment for primary prevention, outcome: 1.1 Sudden cardiac death.

Funnel plot of comparison: 1 Amiodarone versus placebo or no treatment for primary prevention, outcome: 1.2 Cardiac mortality.

Funnel plot of comparison: 1 Amiodarone versus placebo or no treatment for primary prevention, outcome: 1.3 All‐cause mortality.

Comparison 1: Amiodarone versus placebo or no treatment for primary prevention, Outcome 1: Sudden cardiac death

Comparison 1: Amiodarone versus placebo or no treatment for primary prevention, Outcome 2: Cardiac mortality

Comparison 1: Amiodarone versus placebo or no treatment for primary prevention, Outcome 3: All‐cause mortality

Comparison 1: Amiodarone versus placebo or no treatment for primary prevention, Outcome 4: Sudden cardiac death subgroup post‐ AMI patients

Comparison 1: Amiodarone versus placebo or no treatment for primary prevention, Outcome 5: Sudden cardiac death subgroup heart failure

Comparison 1: Amiodarone versus placebo or no treatment for primary prevention, Outcome 6: All‐cause mortality subgroup post‐AMI

Comparison 1: Amiodarone versus placebo or no treatment for primary prevention, Outcome 7: All‐cause mortality subgroup heart failure

Comparison 2: Amiodarone versus other antiarrhythmics for primary prevention, Outcome 1: Sudden cardiac death

Comparison 2: Amiodarone versus other antiarrhythmics for primary prevention, Outcome 2: Cardiac mortality

Comparison 2: Amiodarone versus other antiarrhythmics for primary prevention, Outcome 3: All‐cause mortality

Comparison 3: Amiodarone versus beta‐blockers for primary prevention, Outcome 1: Sudden cardiac death

Comparison 3: Amiodarone versus beta‐blockers for primary prevention, Outcome 2: Cardiac mortality

Comparison 3: Amiodarone versus beta‐blockers for primary prevention, Outcome 3: All‐cause mortality

Comparison 4: Amiodarone versus placebo or no treatment for secondary prevention, Outcome 1: Sudden cardiac death

Comparison 4: Amiodarone versus placebo or no treatment for secondary prevention, Outcome 2: All‐cause mortality

Comparison 5: Amiodarone versus other antiarrhythmics for secondary prevention, Outcome 1: Sudden cardiac death

Comparison 5: Amiodarone versus other antiarrhythmics for secondary prevention, Outcome 2: Cardiac mortality

Comparison 5: Amiodarone versus other antiarrhythmics for secondary prevention, Outcome 3: All‐cause mortality

Comparison 5: Amiodarone versus other antiarrhythmics for secondary prevention, Outcome 4: Sudden cardiac death subgroup with ICD

Comparison 5: Amiodarone versus other antiarrhythmics for secondary prevention, Outcome 5: Sudden cardiac death subgroup without ICD

Comparison 5: Amiodarone versus other antiarrhythmics for secondary prevention, Outcome 6: All‐cause mortality subgroup with ICD

Comparison 5: Amiodarone versus other antiarrhythmics for secondary prevention, Outcome 7: All‐cause mortality subgroup without ICD

Comparison 6: Amiodarone versus beta‐blockers for secondary prevention, Outcome 1: Sudden cardiac death

Comparison 6: Amiodarone versus beta‐blockers for secondary prevention, Outcome 2: All‐cause mortality

Comparison 7: Amiodarone versus sotalol for secondary prevention, Outcome 1: Sudden cardiac death

Comparison 7: Amiodarone versus sotalol for secondary prevention, Outcome 2: Cardiac mortality

Comparison 7: Amiodarone versus sotalol for secondary prevention, Outcome 3: All‐cause mortality

Comparison 8: Amiodarone and quality of life, Outcome 1: Quality of life (DASI at 30 months)

Comparison 8: Amiodarone and quality of life, Outcome 2: Quality of life (MHI‐5 at 30 months)

Comparison 9: Amiodarone versus placebo (adverse effects), Outcome 1: Hyperthyroidism

Comparison 9: Amiodarone versus placebo (adverse effects), Outcome 2: Hypothyroidism

Comparison 9: Amiodarone versus placebo (adverse effects), Outcome 3: Pulmonary

Comparison 9: Amiodarone versus placebo (adverse effects), Outcome 4: Discontinuation

Comparison 10: Amiodarone versus other antiarrhythmics (adverse effects), Outcome 1: Hyperthyroidism

Comparison 10: Amiodarone versus other antiarrhythmics (adverse effects), Outcome 2: Hypothyroidism

Comparison 10: Amiodarone versus other antiarrhythmics (adverse effects), Outcome 3: Pulmonary

Comparison 10: Amiodarone versus other antiarrhythmics (adverse effects), Outcome 4: Discontinuation

Comparison 11: Amiodarone versus no treatment (adverse effects), Outcome 1: Hyperthyroidism

Comparison 11: Amiodarone versus no treatment (adverse effects), Outcome 2: Hypothyroidism

Comparison 11: Amiodarone versus no treatment (adverse effects), Outcome 3: Pulmonary
| Amiodarone versus placebo or no treatment for primary prevention | |||||
| Patient or population: participants with high risk of sudden cardiac death (primary prevention) | |||||
| Outcomes | Illustrative comparative risks* (95% CI) | Relative effect | No of participants | Quality of the evidence | |
|---|---|---|---|---|---|
| Assumed risk | Corresponding risk | ||||
| Placebo or no treatment | Amiodarone | ||||
| Sudden cardiac death | Study population | RR 0.76 | 8383 | ⊕⊕⊝⊝ | |
| 91 per 1000 | 70 per 1000 | ||||
| Moderate | |||||
| 114 per 1000 | 87 per 1000 | ||||
| All‐cause mortality | Study population | RR 0.88 | 8383 | ⊕⊕⊝⊝ | |
| 203 per 1000 | 178 per 1000 | ||||
| Moderate | |||||
| 190 per 1000 | 167 per 1000 | ||||
| *The basis for the assumed risk (e.g. the median control group risk across studies) is provided in footnotes. The corresponding risk (and its 95% confidence interval) is based on the assumed risk in the comparison group and the relative effect of the intervention (and its 95% CI). | |||||
| GRADE Working Group grades of evidence | |||||
| aRandomisation and allocation concealment methods not clear or not adequate in 10/16 studies, including studies with more weight. | |||||
| Amiodarone versus beta blockers | |||||
| Patient or population: beta blockers | |||||
| Outcomes | Illustrative comparative risks* (95% CI) | Relative effect | No of participants | Quality of the evidence | |
|---|---|---|---|---|---|
| Assumed risk | Corresponding risk | ||||
| Control | Amiodarone | ||||
| Sudden cardiac death | Study population | RR 0.37 | 342 | ⊕⊕⊝⊝ | |
| 56 per 1000 | 21 per 1000 | ||||
| Moderate | |||||
| 45 per 1000 | 17 per 1000 | ||||
| All‐cause mortality | Study population | RR 0.27 | 342 | ⊕⊕⊝⊝ | |
| 101 per 1000 | 27 per 1000 | ||||
| Moderate | |||||
| 76 per 1000 | 21 per 1000 | ||||
| *The basis for the assumed risk (e.g. the median control group risk across studies) is provided in footnotes. The corresponding risk (and its 95% confidence interval) is based on the assumed risk in the comparison group and the relative effect of the intervention (and its 95% CI). | |||||
| GRADE Working Group grades of evidence | |||||
| aBoth studies had serious limitations, including lack of blinding for participants and unclear generation of random sequence and allocation concealment. | |||||
| Amiodarone versus other antiarrhythmics for high risk of sudden cardiac death (primary prevention) | |||||
| Patient or population: participants with high risk of sudden cardiac death (primary prevention) | |||||
| Outcomes | Illustrative comparative risks* (95% CI) | Relative effect | No of participants | Quality of the evidence | |
|---|---|---|---|---|---|
| Assumed risk | Corresponding risk | ||||
| Other antiarrhythmics | Amiodarone | ||||
| Sudden cardiac death | Study population | RR 0.44 | 540 | ⊕⊕⊕⊝ | |
| 65 per 1000 | 28 per 1000 | ||||
| All‐cause mortality | Study population | RR 0.37 | 540 | ⊕⊕⊕⊝ | |
| 100 per 1000 | 37 per 1000 | ||||
| *The basis for the assumed risk (e.g. the median control group risk across studies) is provided in footnotes. The corresponding risk (and its 95% confidence interval) is based on the assumed risk in the comparison group and the relative effect of the intervention (and its 95% CI). | |||||
| GRADE Working Group grades of evidence | |||||
| aAll studies had serious limitations, including lack of blinding for participants and unclear allocation concealment. | |||||
| Amiodarone compared to placebo or no treatment for high risk of sudden cardiac death (secondary prevention) | |||||
| Patient or population: participants with high risk of sudden cardiac death (secondary prevention) | |||||
| Outcomes | Illustrative comparative risks* (95% CI) | Relative effect | No of participants | Quality of the evidence | |
|---|---|---|---|---|---|
| Assumed risk | Corresponding risk | ||||
| Placebo or no treatment | Amiodarone | ||||
| Sudden cardiac death | Study population | RR 4.32 | 440 | ⊕⊝⊝⊝ | |
| 8 per 1000 | 35 per 1000 | ||||
| All‐cause mortality | Study population | RR 3.05 | 440 | ⊕⊝⊝⊝ | |
| 32 per 1000 | 99 per 1000 | ||||
| Moderate | |||||
| 35 per 1000 | 107 per 1000 | ||||
| *The basis for the assumed risk (e.g. the median control group risk across studies) is provided in footnotes. The corresponding risk (and its 95% confidence interval) is based on the assumed risk in the comparison group and the relative effect of the intervention (and its 95% CI). | |||||
| GRADE Working Group grades of evidence | |||||
| aVery serious imprecision: quality of the evidence was downgraded two levels because the CI was very wide and includes both important risks and benefits, and because there was a very low number of events. | |||||
| Amiodarone versus other antiarrhythmics for high risk of sudden cardiac death (secondary prevention) | |||||
| Patient or population: participants with high risk of sudden cardiac death (secondary prevention) | |||||
| Outcomes | Illustrative comparative risks* (95% CI) | Relative effect | No of participants | Quality of the evidence | |
|---|---|---|---|---|---|
| Assumed risk | Corresponding risk | ||||
| Other antiarrhythmics | Amiodarone | ||||
| Sudden cardiac death | Study population | RR 1.40 | 839 | ⊕⊝⊝⊝ | |
| 99 per 1000 | 138 per 1000 | ||||
| All‐cause mortality | Study population | RR 1.03 | 898 | ⊕⊕⊝⊝ | |
| 193 per 1000 | 198 per 1000 | ||||
| *The basis for the assumed risk (e.g. the median control group risk across studies) is provided in footnotes. The corresponding risk (and its 95% confidence interval) is based on the assumed risk in the comparison group and the relative effect of the intervention (and its 95% CI). | |||||
| GRADE Working Group grades of evidence | |||||
| aAll studies had serious limitations, including 4/5 not blinded for participants. | |||||
| Amiodarone compared to beta blockers for high risk of sudden cardiac death (secondary prevention) | |||||
| Patient or population: participants with high risk of sudden cardiac death (secondary prevention) | |||||
| Outcomes | Illustrative comparative risks* (95% CI) | Relative effect | No of Participants | Quality of the evidence | |
|---|---|---|---|---|---|
| Assumed risk | Corresponding risk | ||||
| Beta blockers | Amiodarone | ||||
| Sudden cardiac death | Study population | RR 0.84 | 189 | ⊕⊝⊝⊝ | |
| 351 per 1000 | 294 per 1000 | ||||
| All‐cause mortality | Study population | RR 0.96 | 189 | ⊕⊝⊝⊝ | |
| 454 per 1000 | 435 per 1000 | ||||
| *The basis for the assumed risk (e.g. the median control group risk across studies) is provided in footnotes. The corresponding risk (and its 95% confidence interval) is based on the assumed risk in the comparison group and the relative effect of the intervention (and its 95% CI). | |||||
| GRADE Working Group grades of evidence | |||||
| aThe only study has serious limitations, including lack of blinding for participants. | |||||
| Amiodarone versus sotalol for high risk of sudden cardiac death (secondary prevention) | |||||
| Patient or population: participants with high risk of sudden cardiac death (secondary prevention) | |||||
| Outcomes | Illustrative comparative risks* (95% CI) | Relative effect | No of Participants | Quality of the evidence | |
|---|---|---|---|---|---|
| Assumed risk | Corresponding risk | ||||
| Sotalol | Amiodarone | ||||
| Sudden cardiac death | Study population | RR 2.87 | 45 | ⊕⊝⊝⊝ | |
| 45 per 1000 | 130 per 1000 | ||||
| All‐cause mortality | Study population | RR 1.08 | 104 | ⊕⊝⊝⊝ | |
| 137 per 1000 | 148 per 1000 | ||||
| Moderate | |||||
| 132 per 1000 | 143 per 1000 | ||||
| *The basis for the assumed risk (e.g. the median control group risk across studies) is provided in footnotes. The corresponding risk (and its 95% confidence interval) is based on the assumed risk in the comparison group and the relative effect of the intervention (and its 95% CI). | |||||
| GRADE Working Group grades of evidence | |||||
| aThe only study has serious limitations, including lack of blinding for participants. | |||||
| Outcome or subgroup title | No. of studies | No. of participants | Statistical method | Effect size |
| 1.1 Sudden cardiac death Show forest plot | 17 | 8383 | Risk Ratio (M‐H, Random, 95% CI) | 0.76 [0.66, 0.88] |
| 1.2 Cardiac mortality Show forest plot | 17 | 8383 | Risk Ratio (M‐H, Random, 95% CI) | 0.86 [0.77, 0.96] |
| 1.3 All‐cause mortality Show forest plot | 17 | 8383 | Risk Ratio (M‐H, Random, 95% CI) | 0.88 [0.78, 1.00] |
| 1.4 Sudden cardiac death subgroup post‐ AMI patients Show forest plot | 6 | 3377 | Risk Ratio (M‐H, Random, 95% CI) | 0.65 [0.46, 0.91] |
| 1.5 Sudden cardiac death subgroup heart failure Show forest plot | 11 | 5006 | Risk Ratio (M‐H, Random, 95% CI) | 0.79 [0.67, 0.93] |
| 1.6 All‐cause mortality subgroup post‐AMI Show forest plot | 6 | 3377 | Risk Ratio (M‐H, Random, 95% CI) | 0.84 [0.61, 1.16] |
| 1.7 All‐cause mortality subgroup heart failure Show forest plot | 11 | 5006 | Risk Ratio (M‐H, Random, 95% CI) | 0.90 [0.80, 1.01] |
| Outcome or subgroup title | No. of studies | No. of participants | Statistical method | Effect size |
| 2.1 Sudden cardiac death Show forest plot | 3 | 540 | Risk Ratio (M‐H, Random, 95% CI) | 0.44 [0.19, 1.00] |
| 2.2 Cardiac mortality Show forest plot | 3 | 540 | Risk Ratio (M‐H, Random, 95% CI) | 0.41 [0.20, 0.86] |
| 2.3 All‐cause mortality Show forest plot | 3 | 540 | Risk Ratio (M‐H, Random, 95% CI) | 0.37 [0.18, 0.76] |
| Outcome or subgroup title | No. of studies | No. of participants | Statistical method | Effect size |
| 3.1 Sudden cardiac death Show forest plot | 2 | 342 | Risk Ratio (M‐H, Random, 95% CI) | 0.37 [0.11, 1.22] |
| 3.2 Cardiac mortality Show forest plot | 2 | 342 | Risk Ratio (M‐H, Random, 95% CI) | 0.31 [0.11, 0.84] |
| 3.3 All‐cause mortality Show forest plot | 2 | 342 | Risk Ratio (M‐H, Random, 95% CI) | 0.27 [0.10, 0.75] |
| Outcome or subgroup title | No. of studies | No. of participants | Statistical method | Effect size |
| 4.1 Sudden cardiac death Show forest plot | 2 | 440 | Risk Ratio (M‐H, Random, 95% CI) | 4.32 [0.87, 21.49] |
| 4.2 All‐cause mortality Show forest plot | 2 | 440 | Risk Ratio (M‐H, Random, 95% CI) | 3.05 [1.33, 7.01] |
| Outcome or subgroup title | No. of studies | No. of participants | Statistical method | Effect size |
| 5.1 Sudden cardiac death Show forest plot | 4 | 839 | Risk Ratio (M‐H, Random, 95% CI) | 1.40 [0.56, 3.52] |
| 5.2 Cardiac mortality Show forest plot | 2 | 273 | Risk Ratio (M‐H, Random, 95% CI) | 0.77 [0.49, 1.21] |
| 5.3 All‐cause mortality Show forest plot | 5 | 898 | Risk Ratio (M‐H, Random, 95% CI) | 1.03 [0.75, 1.42] |
| 5.4 Sudden cardiac death subgroup with ICD Show forest plot | 1 | 377 | Risk Ratio (M‐H, Random, 95% CI) | 24.45 [2.79, 214.59] |
| 5.5 Sudden cardiac death subgroup without ICD Show forest plot | 2 | 234 | Risk Ratio (M‐H, Random, 95% CI) | 0.96 [0.45, 2.05] |
| 5.6 All‐cause mortality subgroup with ICD Show forest plot | 1 | 377 | Risk Ratio (M‐H, Random, 95% CI) | 1.96 [0.98, 3.93] |
| 5.7 All‐cause mortality subgroup without ICD Show forest plot | 3 | 293 | Risk Ratio (M‐H, Random, 95% CI) | 0.97 [0.72, 1.31] |
| Outcome or subgroup title | No. of studies | No. of participants | Statistical method | Effect size |
| 6.1 Sudden cardiac death Show forest plot | 1 | 189 | Risk Ratio (M‐H, Random, 95% CI) | 0.84 [0.55, 1.27] |
| 6.2 All‐cause mortality Show forest plot | 1 | 189 | Risk Ratio (M‐H, Random, 95% CI) | 0.96 [0.70, 1.32] |
| Outcome or subgroup title | No. of studies | No. of participants | Statistical method | Effect size |
| 7.1 Sudden cardiac death Show forest plot | 1 | 45 | Risk Ratio (M‐H, Random, 95% CI) | 2.87 [0.32, 25.55] |
| 7.2 Cardiac mortality Show forest plot | 1 | 45 | Risk Ratio (M‐H, Random, 95% CI) | 1.43 [0.26, 7.78] |
| 7.3 All‐cause mortality Show forest plot | 2 | 104 | Risk Ratio (M‐H, Random, 95% CI) | 1.08 [0.41, 2.83] |
| Outcome or subgroup title | No. of studies | No. of participants | Statistical method | Effect size |
| 8.1 Quality of life (DASI at 30 months) Show forest plot | 1 | 1160 | Mean Difference (IV, Random, 95% CI) | 1.20 [‐0.56, 2.96] |
| 8.2 Quality of life (MHI‐5 at 30 months) Show forest plot | 1 | 1124 | Mean Difference (IV, Random, 95% CI) | 2.20 [‐0.26, 4.66] |
| Outcome or subgroup title | No. of studies | No. of participants | Statistical method | Effect size |
| 9.1 Hyperthyroidism Show forest plot | 8 | 5972 | Risk Ratio (M‐H, Random, 95% CI) | 4.14 [1.54, 11.17] |
| 9.2 Hypothyroidism Show forest plot | 8 | 4008 | Risk Ratio (M‐H, Random, 95% CI) | 6.13 [2.46, 15.28] |
| 9.3 Pulmonary Show forest plot | 12 | 5924 | Risk Ratio (M‐H, Random, 95% CI) | 1.66 [1.15, 2.40] |
| 9.4 Discontinuation Show forest plot | 13 | 7616 | Risk Ratio (M‐H, Random, 95% CI) | 1.45 [1.26, 1.67] |
| Outcome or subgroup title | No. of studies | No. of participants | Statistical method | Effect size |
| 10.1 Hyperthyroidism Show forest plot | 3 | 514 | Risk Ratio (M‐H, Random, 95% CI) | 7.43 [1.33, 41.57] |
| 10.2 Hypothyroidism Show forest plot | 4 | 886 | Risk Ratio (M‐H, Random, 95% CI) | 7.77 [1.85, 32.68] |
| 10.3 Pulmonary Show forest plot | 6 | 1296 | Risk Ratio (M‐H, Random, 95% CI) | 2.30 [0.36, 14.67] |
| 10.4 Discontinuation Show forest plot | 8 | 1438 | Risk Ratio (M‐H, Random, 95% CI) | 1.06 [0.84, 1.33] |
| Outcome or subgroup title | No. of studies | No. of participants | Statistical method | Effect size |
| 11.1 Hyperthyroidism Show forest plot | 3 | 414 | Risk Ratio (M‐H, Random, 95% CI) | 4.97 [0.60, 41.16] |
| 11.2 Hypothyroidism Show forest plot | 3 | 414 | Risk Ratio (M‐H, Random, 95% CI) | 12.82 [0.73, 225.33] |
| 11.3 Pulmonary Show forest plot | 2 | 405 | Risk Ratio (M‐H, Random, 95% CI) | 14.79 [0.85, 256.43] |