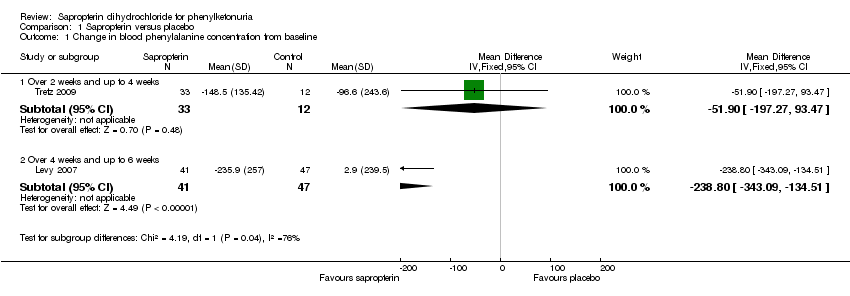
| 1 Change in blood phenylalanine concentration from baseline Show forest plot | 2 | | Mean Difference (IV, Fixed, 95% CI) | Subtotals only |
|
| 1.1 Over 2 weeks and up to 4 weeks | 1 | 45 | Mean Difference (IV, Fixed, 95% CI) | ‐51.90 [‐197.27, 93.47] |
| 1.2 Over 4 weeks and up to 6 weeks | 1 | 88 | Mean Difference (IV, Fixed, 95% CI) | ‐238.8 [‐343.09, ‐134.51] |
| 2 Mean difference in blood phenylalanine concentration between treatment groups Show forest plot | 2 | | Mean Difference (Fixed, 95% CI) | Subtotals only |
|
| 2.1 Over 2 weeks and up to 4 weeks | 1 | 45 | Mean Difference (Fixed, 95% CI) | ‐135.2 [‐187.92, ‐82.48] |
| 2.2 Over 4 weeks and up to 6 weeks | 1 | 88 | Mean Difference (Fixed, 95% CI) | ‐245.0 [‐349.47, ‐140.53] |
| 3 Adverse events due to sapropterin Show forest plot | 2 | | Risk Ratio (M‐H, Fixed, 95% CI) | Subtotals only |
|
| 3.1 Upper respiratory tract infection | 2 | 133 | Risk Ratio (M‐H, Fixed, 95% CI) | 0.63 [0.29, 1.36] |
| 3.2 Headache | 2 | 133 | Risk Ratio (M‐H, Fixed, 95% CI) | 0.84 [0.36, 1.96] |
| 3.3 Vomiting | 2 | 133 | Risk Ratio (M‐H, Fixed, 95% CI) | 1.04 [0.28, 3.91] |
| 3.4 Abdominal pain | 2 | 133 | Risk Ratio (M‐H, Fixed, 95% CI) | 0.51 [0.12, 2.21] |
| 3.5 Diarrhoea | 2 | 133 | Risk Ratio (M‐H, Fixed, 95% CI) | 1.31 [0.32, 5.43] |
| 3.6 Pyrexia | 2 | 133 | Risk Ratio (M‐H, Fixed, 95% CI) | 0.78 [0.23, 2.69] |
| 3.7 Back pain | 1 | 88 | Risk Ratio (M‐H, Fixed, 95% CI) | 0.38 [0.04, 3.53] |
| 3.8 Rhinorrhea | 1 | 45 | Risk Ratio (M‐H, Fixed, 95% CI) | 1.45 [0.18, 11.75] |
| 3.9 Cough | 1 | 45 | Risk Ratio (M‐H, Fixed, 95% CI) | 4.21 [0.25, 70.82] |
| 3.10 Pharybgolaryngeal pain | 1 | 45 | Risk Ratio (M‐H, Fixed, 95% CI) | 1.45 [0.18, 11.75] |
| 3.11 Contusion | 1 | 45 | Risk Ratio (M‐H, Fixed, 95% CI) | 1.09 [0.13, 9.50] |
| 3.12 Nasal congestion | 1 | 45 | Risk Ratio (M‐H, Fixed, 95% CI) | 2.68 [0.15, 48.32] |
| 3.13 Decreased appetite | 1 | 45 | Risk Ratio (M‐H, Fixed, 95% CI) | 1.91 [0.10, 37.20] |
| 3.14 Erythema | 1 | 45 | Risk Ratio (M‐H, Fixed, 95% CI) | 1.91 [0.10, 37.20] |
| 3.15 Excoriation | 1 | 45 | Risk Ratio (M‐H, Fixed, 95% CI) | 1.91 [0.10, 37.20] |
| 3.16 Lymphadenopathy | 1 | 45 | Risk Ratio (M‐H, Fixed, 95% CI) | 1.91 [0.10, 37.20] |
| 3.17 Streptococcal infection | 1 | 45 | Risk Ratio (M‐H, Fixed, 95% CI) | 0.36 [0.06, 2.30] |
| 3.18 Tooth ache | 1 | 45 | Risk Ratio (M‐H, Fixed, 95% CI) | 1.91 [0.10, 37.20] |
| 4 Mean phenylalanine supplement tolerated Show forest plot | 1 | | Mean Difference (IV, Fixed, 95% CI) | Totals not selected |
|
| 4.1 Over 2 months and up to 3 months | 1 | | Mean Difference (IV, Fixed, 95% CI) | 0.0 [0.0, 0.0] |
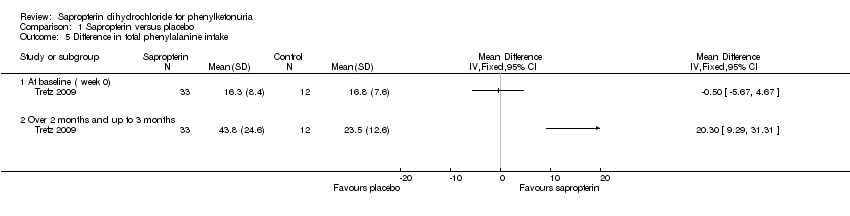
| 5 Difference in total phenylalanine intake Show forest plot | 1 | | Mean Difference (IV, Fixed, 95% CI) | Totals not selected |
|
| 5.1 At baseline ( week 0) | 1 | | Mean Difference (IV, Fixed, 95% CI) | 0.0 [0.0, 0.0] |
| 5.2 Over 2 months and up to 3 months | 1 | | Mean Difference (IV, Fixed, 95% CI) | 0.0 [0.0, 0.0] |
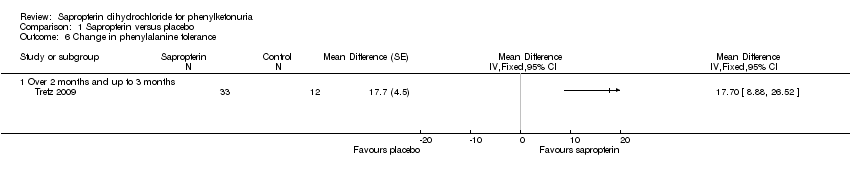
| 6 Change in phenylalanine tolerance Show forest plot | 1 | | Mean Difference (Fixed, 95% CI) | Totals not selected |
|
| 6.1 Over 2 months and up to 3 months | 1 | | Mean Difference (Fixed, 95% CI) | 0.0 [0.0, 0.0] |