Sapropterin dihydrochloride for phenylketonuria
Referencias
References to studies included in this review
References to studies excluded from this review
References to ongoing studies
Additional references
References to other published versions of this review
Characteristics of studies
Characteristics of included studies [ordered by study ID]
| Methods | Randomised, double‐blind placebo‐controlled study. Multicentre, North America and Europe. | |
| Participants | 89 children and adults with PKU, over 8 years of age, with blood phe ≥450μmol/L; individuals who had a reduction of 30% or more in blood phe concentration after 8 days of treatment with sapropterin at a dose of 10 mg/kg in a previous screening test (PKU 001) were eligible for the study. Participants had been involved in a phase 1 screening study. | |
| Interventions | Sapropterin 10 mg/kg/day versus placebo; treatment was for a period of 6 weeks. | |
| Outcomes | Change in blood phe concentration. | |
| Notes | Data published only as a six week study; further details requested from the author. | |
| Risk of bias | ||
| Bias | Authors' judgement | Support for judgement |
| Random sequence generation (selection bias) | Low risk | Treatment allocations were made centrally from randomisation lists generated by a computer program. Each randomisation list started with a block of two, followed by blocks of four. |
| Allocation concealment (selection bias) | Low risk | Described that a central interactive voice response system was used; investigators, patients and sponsors were kept unaware of treatment allocation until database was locked; block size was not divulged to sponsors or investigators until study was completed. |
| Blinding (performance bias and detection bias) | Low risk | Stated as double blind; sapropterin and placebo tablets were identical in taste and appearance. |
| Incomplete outcome data (attrition bias) | Low risk | Two withdrawals (one from each group) described. One withdrawal from the study in the sapropterin group before closing due to an inability to comply with the study course. The data was not included in the analysis as the patient did not receive even one dose of study drug. There was another withdrawal from the control group due to non‐compliance with specified dosing, but the data was included in the analysis. |
| Selective reporting (reporting bias) | High risk | Comparison of the trial protocol available at the ClinicalTrials.gov web site and also the 'Methods' section with the results reported in the final paper showed all the detailed outcomes in the protocol were reported in the published reports. However, in the Levy study they measured data at several time points (weeks 0, 1, 2, 4,and 6) but only reported them at 6 weeks. |
| Other bias | Unclear risk | Sponsored by BioMarin Pharmaceutical Inc. |
| Methods | Randomised, double‐blind placebo‐controlled study. Multicentre, North America and Europe. | |
| Participants | 90 children with PKU between 4 to 12 years of age, under phe‐restricted diet with a phe tolerance ≤ 1000 mg/d, and blood phe ≤ 480 μmol/L; exclusion criteria: history of organ transplantation, usage of investigational agent within 30 days before screening, serum alanine aminotransferase levels more than twice upper limit of normal, concurrent disease, using drugs that inhibit folate synthesis, primary BH4 deficiency. 46 children eligible for inclusion (see 'Notes' below). | |
| Interventions | Sapropterin 20 mg/kg/d versus placebo; treatment was for a period of 10 weeks. | |
| Outcomes | Change in blood phe concentration. Change in phe tolerance. | |
| Notes | Study conducted in two parts. Eligible participants (N = 90) entered part 1, received oral sapropterin 20 mg/kg/d for eight days. Those who had a ≥30% reduction in blood phe and had a blood phe ≤ 300 μmol/L were included in part 2 (N = 46) which was for 10 weeks. The phe supplement was added at the beginning of week 3. Only the part 2 of the study is eligible to be included in analysis. | |
| Risk of bias | ||
| Bias | Authors' judgement | Support for judgement |
| Random sequence generation (selection bias) | Low risk | Described that randomisation was performed by a computer program and interactive voice response system using block sizes of four. |
| Allocation concealment (selection bias) | Low risk | Described that a central interactive voice response system was used; stated that block sizes were not divulged to investigators or study sponsor until the study was completed. |
| Blinding (performance bias and detection bias) | Low risk | Stated as double‐blind. Sapropterin and placebo tablets had similar taste and appearance. |
| Incomplete outcome data (attrition bias) | Low risk | One participant randomised to the sapropterin group did not return to for week 0 visit. The data was not included in the analysis. |
| Selective reporting (reporting bias) | High risk | Comparison of the trial protocol available at the ClinicalTrials.gov web site and also the 'Methods' section with the results reported in the final paper showed all the detailed outcomes in the protocol were reported in the published reports. But the data could not be included in meta‐analysis as the details in control group were not given. |
| Other bias | Unclear risk | Sponsored by BioMarin Pharmaceutical Inc. |
BH4: tetrahydrobiopterin
Phe: phenylalanine
PKU: phenylketonuria
Characteristics of excluded studies [ordered by study ID]
| Study | Reason for exclusion |
| Participants and Outcome measures are not relevant to the review. |
Characteristics of ongoing studies [ordered by study ID]
| Trial name or title | Neuroimaging and Neurocognitive Assessment and Response to Sapropterin Dihydrochloride Treatment in Phenylketonuria |
| Methods | |
| Participants | Patients with PKU |
| Interventions | Sapropterin dihydrochloride, PKU diet |
| Outcomes | Neuroimaging biomarkers at 4 months, an estimate of change in white matter damage and biochemistry, Brain biochemistry at 4 months, assessment of cognitive system abnormalities |
| Starting date | April 2011 |
| Contact information | Andrea Gropman, M.D. 202‐476‐3511, [email protected] |
| Notes | Participants will be randomised into Diet alone group and Kuvan group. |
| Trial name or title | A Double‐blind, Placebo‐controlled, Randomized Study to Evaluate the Safety and Therapeutic Effects of Sapropterin Dihydrochloride on Neuropsychiatric Symptoms in Subjects With Phenylketonuria |
| Methods | Allocation: randomized Endpoint classification: safety/efficacy study Intervention model: parallel assignment Masking: double‐blind (subject, caregiver, investigator, outcome assessor) Primary purpose: treatment |
| Participants | People with PKU. 8 years to 65 years |
| Interventions | Oral sapropterin dihydrochloride (20 mg/kg/day) versus placebo |
| Outcomes | Primary Outcome Measures: Evaluate the therapeutic effects of sapropterin dihydrochloride on the symptoms of ADHD and on global function compared to placebo, in subjects with a blood Phe level reduction after treatment ADHD change will be measured as a change in ADHD from baseline to week 13 using the Attention‐Deficit Hyperactivity Disorder Rating Scale and Adult ADHD Self‐Report Scale (ADHD RS/ASRS) measurement Global function will be measured as a change in global function using the Clinical Global Impression‐Improvement (CGI‐I) scale rating compared from baseline to week 13. Evaluate the therapeutic effects of sapropterin dihydrochloride on the symptoms of anxiety and depression compared to placebo, in subjects with a blood Phe level reduction after treatment |
| Starting date | June 2010 |
| Contact information | Contact: Malathi Jakkula ([email protected]) |
| Notes | Estimated completion date: January 2013. Estimated enrolment: 200 participants ClinicalTrials.gov Identifier: NCT01114737 |
| Trial name or title | Kuvan in Phenylketonuria (PKU) Patients Less Than 4 Years Old |
| Methods | |
| Participants | Children less than 4 years old with PKU |
| Interventions | Kuvan, Phe‐restricted diet |
| Outcomes | Dietary Phe tolerance after 26 weeks, Levels of blood Phe, Change from baseline in dietary Phe tolerance after 26 weeks, number of subjects with adverse events after 26 weeks and 3 years |
| Starting date | June 2011 |
| Contact information | |
| Notes | Participants randomised into Phe‐restricted diet only and Kuvan + Phe‐restricted diet groups. Study period is 26 weeks, with an extension period of three years. |
Data and analyses
| Outcome or subgroup title | No. of studies | No. of participants | Statistical method | Effect size |
| 1 Change in blood phenylalanine concentration from baseline Show forest plot | 2 | Mean Difference (IV, Fixed, 95% CI) | Subtotals only | |
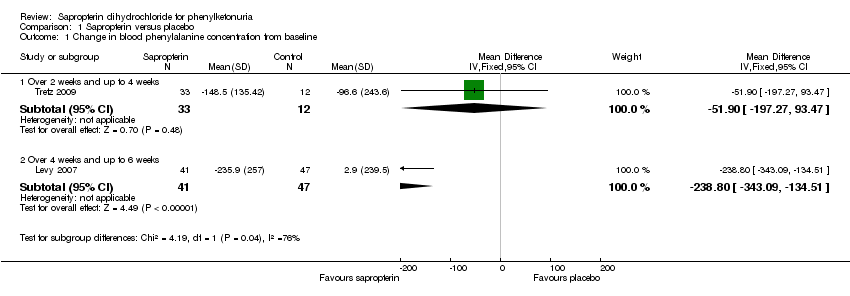
| Analysis 1.1  Comparison 1 Sapropterin versus placebo, Outcome 1 Change in blood phenylalanine concentration from baseline. | ||||
| 1.1 Over 2 weeks and up to 4 weeks | 1 | 45 | Mean Difference (IV, Fixed, 95% CI) | ‐51.90 [‐197.27, 93.47] |
| 1.2 Over 4 weeks and up to 6 weeks | 1 | 88 | Mean Difference (IV, Fixed, 95% CI) | ‐238.8 [‐343.09, ‐134.51] |
| 2 Mean difference in blood phenylalanine concentration between treatment groups Show forest plot | 2 | Mean Difference (Fixed, 95% CI) | Subtotals only | |
| Analysis 1.2  Comparison 1 Sapropterin versus placebo, Outcome 2 Mean difference in blood phenylalanine concentration between treatment groups. | ||||
| 2.1 Over 2 weeks and up to 4 weeks | 1 | 45 | Mean Difference (Fixed, 95% CI) | ‐135.2 [‐187.92, ‐82.48] |
| 2.2 Over 4 weeks and up to 6 weeks | 1 | 88 | Mean Difference (Fixed, 95% CI) | ‐245.0 [‐349.47, ‐140.53] |
| 3 Adverse events due to sapropterin Show forest plot | 2 | Risk Ratio (M‐H, Fixed, 95% CI) | Subtotals only | |
| Analysis 1.3  Comparison 1 Sapropterin versus placebo, Outcome 3 Adverse events due to sapropterin. | ||||
| 3.1 Upper respiratory tract infection | 2 | 133 | Risk Ratio (M‐H, Fixed, 95% CI) | 0.63 [0.29, 1.36] |
| 3.2 Headache | 2 | 133 | Risk Ratio (M‐H, Fixed, 95% CI) | 0.84 [0.36, 1.96] |
| 3.3 Vomiting | 2 | 133 | Risk Ratio (M‐H, Fixed, 95% CI) | 1.04 [0.28, 3.91] |
| 3.4 Abdominal pain | 2 | 133 | Risk Ratio (M‐H, Fixed, 95% CI) | 0.51 [0.12, 2.21] |
| 3.5 Diarrhoea | 2 | 133 | Risk Ratio (M‐H, Fixed, 95% CI) | 1.31 [0.32, 5.43] |
| 3.6 Pyrexia | 2 | 133 | Risk Ratio (M‐H, Fixed, 95% CI) | 0.78 [0.23, 2.69] |
| 3.7 Back pain | 1 | 88 | Risk Ratio (M‐H, Fixed, 95% CI) | 0.38 [0.04, 3.53] |
| 3.8 Rhinorrhea | 1 | 45 | Risk Ratio (M‐H, Fixed, 95% CI) | 1.45 [0.18, 11.75] |
| 3.9 Cough | 1 | 45 | Risk Ratio (M‐H, Fixed, 95% CI) | 4.21 [0.25, 70.82] |
| 3.10 Pharybgolaryngeal pain | 1 | 45 | Risk Ratio (M‐H, Fixed, 95% CI) | 1.45 [0.18, 11.75] |
| 3.11 Contusion | 1 | 45 | Risk Ratio (M‐H, Fixed, 95% CI) | 1.09 [0.13, 9.50] |
| 3.12 Nasal congestion | 1 | 45 | Risk Ratio (M‐H, Fixed, 95% CI) | 2.68 [0.15, 48.32] |
| 3.13 Decreased appetite | 1 | 45 | Risk Ratio (M‐H, Fixed, 95% CI) | 1.91 [0.10, 37.20] |
| 3.14 Erythema | 1 | 45 | Risk Ratio (M‐H, Fixed, 95% CI) | 1.91 [0.10, 37.20] |
| 3.15 Excoriation | 1 | 45 | Risk Ratio (M‐H, Fixed, 95% CI) | 1.91 [0.10, 37.20] |
| 3.16 Lymphadenopathy | 1 | 45 | Risk Ratio (M‐H, Fixed, 95% CI) | 1.91 [0.10, 37.20] |
| 3.17 Streptococcal infection | 1 | 45 | Risk Ratio (M‐H, Fixed, 95% CI) | 0.36 [0.06, 2.30] |
| 3.18 Tooth ache | 1 | 45 | Risk Ratio (M‐H, Fixed, 95% CI) | 1.91 [0.10, 37.20] |
| 4 Mean phenylalanine supplement tolerated Show forest plot | 1 | Mean Difference (IV, Fixed, 95% CI) | Totals not selected | |
| Analysis 1.4  Comparison 1 Sapropterin versus placebo, Outcome 4 Mean phenylalanine supplement tolerated. | ||||
| 4.1 Over 2 months and up to 3 months | 1 | Mean Difference (IV, Fixed, 95% CI) | 0.0 [0.0, 0.0] | |
| 5 Difference in total phenylalanine intake Show forest plot | 1 | Mean Difference (IV, Fixed, 95% CI) | Totals not selected | |
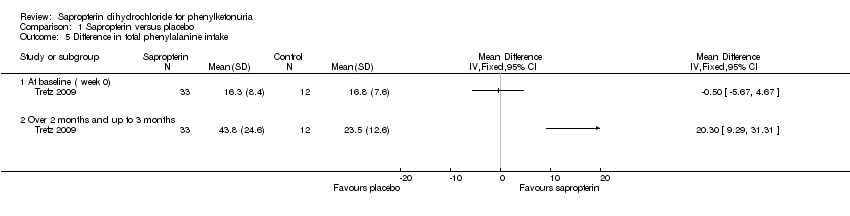
| Analysis 1.5  Comparison 1 Sapropterin versus placebo, Outcome 5 Difference in total phenylalanine intake. | ||||
| 5.1 At baseline ( week 0) | 1 | Mean Difference (IV, Fixed, 95% CI) | 0.0 [0.0, 0.0] | |
| 5.2 Over 2 months and up to 3 months | 1 | Mean Difference (IV, Fixed, 95% CI) | 0.0 [0.0, 0.0] | |
| 6 Change in phenylalanine tolerance Show forest plot | 1 | Mean Difference (Fixed, 95% CI) | Totals not selected | |
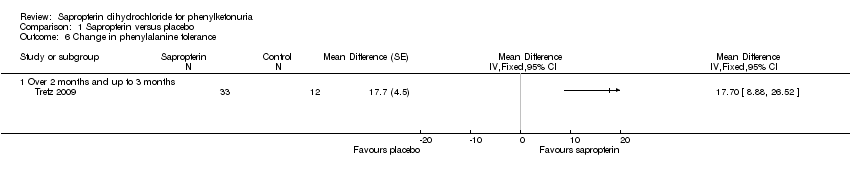
| Analysis 1.6  Comparison 1 Sapropterin versus placebo, Outcome 6 Change in phenylalanine tolerance. | ||||
| 6.1 Over 2 months and up to 3 months | 1 | Mean Difference (Fixed, 95% CI) | 0.0 [0.0, 0.0] | |
Comparison 1 Sapropterin versus placebo, Outcome 1 Change in blood phenylalanine concentration from baseline.

Comparison 1 Sapropterin versus placebo, Outcome 2 Mean difference in blood phenylalanine concentration between treatment groups.

Comparison 1 Sapropterin versus placebo, Outcome 3 Adverse events due to sapropterin.

Comparison 1 Sapropterin versus placebo, Outcome 4 Mean phenylalanine supplement tolerated.
Comparison 1 Sapropterin versus placebo, Outcome 5 Difference in total phenylalanine intake.
Comparison 1 Sapropterin versus placebo, Outcome 6 Change in phenylalanine tolerance.
| Outcome or subgroup title | No. of studies | No. of participants | Statistical method | Effect size |
| 1 Change in blood phenylalanine concentration from baseline Show forest plot | 2 | Mean Difference (IV, Fixed, 95% CI) | Subtotals only | |
| 1.1 Over 2 weeks and up to 4 weeks | 1 | 45 | Mean Difference (IV, Fixed, 95% CI) | ‐51.90 [‐197.27, 93.47] |
| 1.2 Over 4 weeks and up to 6 weeks | 1 | 88 | Mean Difference (IV, Fixed, 95% CI) | ‐238.8 [‐343.09, ‐134.51] |
| 2 Mean difference in blood phenylalanine concentration between treatment groups Show forest plot | 2 | Mean Difference (Fixed, 95% CI) | Subtotals only | |
| 2.1 Over 2 weeks and up to 4 weeks | 1 | 45 | Mean Difference (Fixed, 95% CI) | ‐135.2 [‐187.92, ‐82.48] |
| 2.2 Over 4 weeks and up to 6 weeks | 1 | 88 | Mean Difference (Fixed, 95% CI) | ‐245.0 [‐349.47, ‐140.53] |
| 3 Adverse events due to sapropterin Show forest plot | 2 | Risk Ratio (M‐H, Fixed, 95% CI) | Subtotals only | |
| 3.1 Upper respiratory tract infection | 2 | 133 | Risk Ratio (M‐H, Fixed, 95% CI) | 0.63 [0.29, 1.36] |
| 3.2 Headache | 2 | 133 | Risk Ratio (M‐H, Fixed, 95% CI) | 0.84 [0.36, 1.96] |
| 3.3 Vomiting | 2 | 133 | Risk Ratio (M‐H, Fixed, 95% CI) | 1.04 [0.28, 3.91] |
| 3.4 Abdominal pain | 2 | 133 | Risk Ratio (M‐H, Fixed, 95% CI) | 0.51 [0.12, 2.21] |
| 3.5 Diarrhoea | 2 | 133 | Risk Ratio (M‐H, Fixed, 95% CI) | 1.31 [0.32, 5.43] |
| 3.6 Pyrexia | 2 | 133 | Risk Ratio (M‐H, Fixed, 95% CI) | 0.78 [0.23, 2.69] |
| 3.7 Back pain | 1 | 88 | Risk Ratio (M‐H, Fixed, 95% CI) | 0.38 [0.04, 3.53] |
| 3.8 Rhinorrhea | 1 | 45 | Risk Ratio (M‐H, Fixed, 95% CI) | 1.45 [0.18, 11.75] |
| 3.9 Cough | 1 | 45 | Risk Ratio (M‐H, Fixed, 95% CI) | 4.21 [0.25, 70.82] |
| 3.10 Pharybgolaryngeal pain | 1 | 45 | Risk Ratio (M‐H, Fixed, 95% CI) | 1.45 [0.18, 11.75] |
| 3.11 Contusion | 1 | 45 | Risk Ratio (M‐H, Fixed, 95% CI) | 1.09 [0.13, 9.50] |
| 3.12 Nasal congestion | 1 | 45 | Risk Ratio (M‐H, Fixed, 95% CI) | 2.68 [0.15, 48.32] |
| 3.13 Decreased appetite | 1 | 45 | Risk Ratio (M‐H, Fixed, 95% CI) | 1.91 [0.10, 37.20] |
| 3.14 Erythema | 1 | 45 | Risk Ratio (M‐H, Fixed, 95% CI) | 1.91 [0.10, 37.20] |
| 3.15 Excoriation | 1 | 45 | Risk Ratio (M‐H, Fixed, 95% CI) | 1.91 [0.10, 37.20] |
| 3.16 Lymphadenopathy | 1 | 45 | Risk Ratio (M‐H, Fixed, 95% CI) | 1.91 [0.10, 37.20] |
| 3.17 Streptococcal infection | 1 | 45 | Risk Ratio (M‐H, Fixed, 95% CI) | 0.36 [0.06, 2.30] |
| 3.18 Tooth ache | 1 | 45 | Risk Ratio (M‐H, Fixed, 95% CI) | 1.91 [0.10, 37.20] |
| 4 Mean phenylalanine supplement tolerated Show forest plot | 1 | Mean Difference (IV, Fixed, 95% CI) | Totals not selected | |
| 4.1 Over 2 months and up to 3 months | 1 | Mean Difference (IV, Fixed, 95% CI) | 0.0 [0.0, 0.0] | |
| 5 Difference in total phenylalanine intake Show forest plot | 1 | Mean Difference (IV, Fixed, 95% CI) | Totals not selected | |
| 5.1 At baseline ( week 0) | 1 | Mean Difference (IV, Fixed, 95% CI) | 0.0 [0.0, 0.0] | |
| 5.2 Over 2 months and up to 3 months | 1 | Mean Difference (IV, Fixed, 95% CI) | 0.0 [0.0, 0.0] | |
| 6 Change in phenylalanine tolerance Show forest plot | 1 | Mean Difference (Fixed, 95% CI) | Totals not selected | |
| 6.1 Over 2 months and up to 3 months | 1 | Mean Difference (Fixed, 95% CI) | 0.0 [0.0, 0.0] | |