Scolaris Content Display Scolaris Content Display

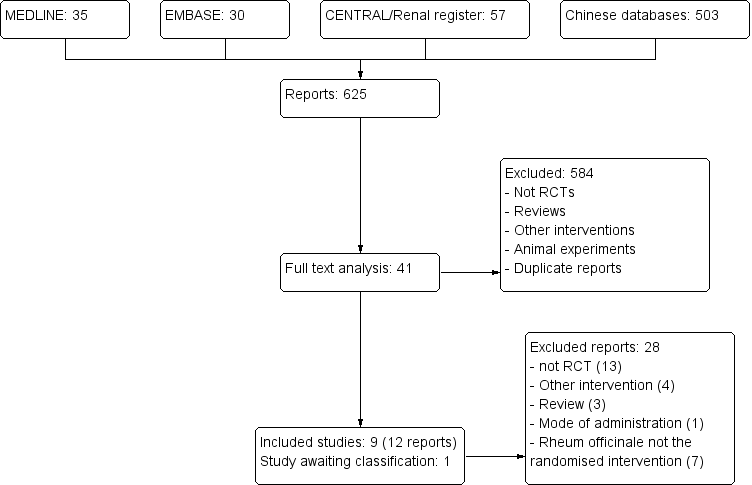
Study flow diagram.
Figuras y tablas -
Figure 1

Study flow diagram.

Methodological quality graph: review authors' judgements about each methodological quality item presented as percentages across all included studies
Figuras y tablas -
Figure 2

Methodological quality graph: review authors' judgements about each methodological quality item presented as percentages across all included studies

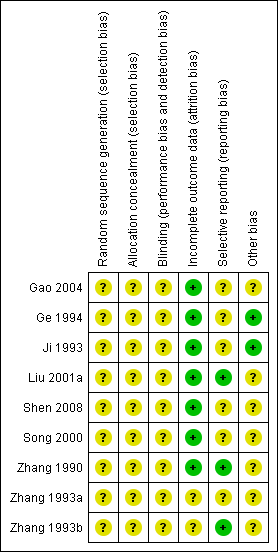
Methodological quality summary: review authors' judgements about each methodological quality item for each included study
Figuras y tablas -
Figure 3

Methodological quality summary: review authors' judgements about each methodological quality item for each included study

Comparison 1 Rheum officinale versus no treatment, Outcome 1 Incidence of ESKD.
Figuras y tablas -
Analysis 1.1

Comparison 1 Rheum officinale versus no treatment, Outcome 1 Incidence of ESKD.

Comparison 1 Rheum officinale versus no treatment, Outcome 2 CrCl.
Figuras y tablas -
Analysis 1.2

Comparison 1 Rheum officinale versus no treatment, Outcome 2 CrCl.

Comparison 1 Rheum officinale versus no treatment, Outcome 3 SCr.
Figuras y tablas -
Analysis 1.3

Comparison 1 Rheum officinale versus no treatment, Outcome 3 SCr.

Comparison 1 Rheum officinale versus no treatment, Outcome 4 Proteinuria.
Figuras y tablas -
Analysis 1.4

Comparison 1 Rheum officinale versus no treatment, Outcome 4 Proteinuria.

Comparison 1 Rheum officinale versus no treatment, Outcome 5 BUN.
Figuras y tablas -
Analysis 1.5

Comparison 1 Rheum officinale versus no treatment, Outcome 5 BUN.

Comparison 2 Rheum officinale versus captopril, Outcome 1 CrCl.
Figuras y tablas -
Analysis 2.1

Comparison 2 Rheum officinale versus captopril, Outcome 1 CrCl.

Comparison 2 Rheum officinale versus captopril, Outcome 2 BUN.
Figuras y tablas -
Analysis 2.2

Comparison 2 Rheum officinale versus captopril, Outcome 2 BUN.

Comparison 2 Rheum officinale versus captopril, Outcome 3 Working capacity.
Figuras y tablas -
Analysis 2.3

Comparison 2 Rheum officinale versus captopril, Outcome 3 Working capacity.

Summary of findings for the main comparison. Rheum officinale versus no treatment for chronic kidney disease

Rheum officinale versus no treatment for chronic kidney disease

Patient or population: Patients with chronic kidney disease
Settings: China
Intervention:Rheum officinale versus no treatment

Outcomes

Illustrative comparative risks* (95% CI)

Relative effect
(95% CI)

No of participants
(studies)

Quality of the evidence
(GRADE)

Comments

Assumed risk

Corresponding risk

Control

Rheum officinale versus no treatment

Incidence of ESKD
Analysis method, calculated by regression analysis: 1/SCr versus time.
Follow‐up: 6 to 48 months

Study population

RR 0.53
(0.28 to 1)

124
(2 studies)

⊕⊕⊝⊝
Low1,2

222 per 1000

118 per 1000
(62 to 222)

Medium risk population

378 per 1000

200 per 1000
(106 to 378)

*The basis for the assumed risk (e.g. the median control group risk across studies) is provided in footnotes. The corresponding risk (and its 95% confidence interval) is based on the assumed risk in the comparison group and the relative effect of the intervention (and its 95% CI).
CI: confidence interval; RR: risk ratio

GRADE Working Group grades of evidence
High quality: Further research is very unlikely to change our confidence in the estimate of effect
Moderate quality: Further research is likely to have an important impact on our confidence in the estimate of effect and may change the estimate
Low quality: Further research is very likely to have an important impact on our confidence in the estimate of effect and is likely to change the estimate
Very low quality: We are very uncertain about the estimate

1 Potential limitations are likely to reduce confidence in the estimate of effect
2 Total number of events < 300

Figuras y tablas -
Summary of findings for the main comparison. Rheum officinale versus no treatment for chronic kidney disease
Summary of findings 2. Rheum officinale versus captopril for chronic kidney disease

Rheum officinale versus captopril for chronic kidney disease

Patient or population: Patients chronic kidney disease
Settings: China
Intervention:Rheum officinale versus captopril

Outcomes

Illustrative comparative risks* (95% CI)

Relative effect
(95% CI)

No of participants
(studies)

Quality of the evidence
(GRADE)

Comments

Assumed risk

Corresponding risk

Control

Rheum officinale versus captopril

Full time working capacity
Unclear quality of life scale
Follow‐up: 6 to 22 months

Study population

RR 1.02
(0.39 to 2.71)

20
(1 study)

⊕⊕⊝⊝
Low1,2

444 per 1000

453 per 1000
(173 to 1000)

Medium risk population

444 per 1000

453 per 1000
(173 to 1000)

Part‐time working capacity
Unclear quality of life scale
Follow‐up: 6 to 22 months

Study population

RR 1.64
(0.38 to 6.98)

20
(1 study)

⊕⊕⊝⊝
Low3,4

222 per 1000

364 per 1000
(84 to 1000)

Medium risk population

222 per 1000

364 per 1000
(84 to 1000)

*The basis for the assumed risk (e.g. the median control group risk across studies) is provided in footnotes. The corresponding risk (and its 95% confidence interval) is based on the assumed risk in the comparison group and the relative effect of the intervention (and its 95% CI).
CI: confidence interval; RR: risk ratio

GRADE Working Group grades of evidence
High quality: Further research is very unlikely to change our confidence in the estimate of effect
Moderate quality: Further research is likely to have an important impact on our confidence in the estimate of effect and may change the estimate
Low quality: Further research is very likely to have an important impact on our confidence in the estimate of effect and is likely to change the estimate
Very low quality: We are very uncertain about the estimate

1 Most information from studies at low or unclear risk of bias
2 Total population size < 400
3 Most information from studies at low or unclear risk of bias
4 Total population size < 400

Figuras y tablas -
Summary of findings 2. Rheum officinale versus captopril for chronic kidney disease
Comparison 1. Rheum officinale versus no treatment

Outcome or subgroup title

No. of studies

No. of participants

Statistical method

Effect size

1 Incidence of ESKD Show forest plot

2

124

Risk Ratio (M‐H, Random, 95% CI)

0.53 [0.28, 1.00]

2 CrCl Show forest plot

1

Mean Difference (IV, Random, 95% CI)

Totals not selected

3 SCr Show forest plot

4

196

Mean Difference (IV, Random, 95% CI)

‐87.49 [‐139.25, ‐35.72]

4 Proteinuria Show forest plot

2

181

Mean Difference (IV, Random, 95% CI)

‐0.35 [‐1.02, 0.31]

5 BUN Show forest plot

4

256

Mean Difference (IV, Random, 95% CI)

‐10.83 [‐19.45, ‐2.21]

Figuras y tablas -
Comparison 1. Rheum officinale versus no treatment
Comparison 2. Rheum officinale versus captopril

Outcome or subgroup title

No. of studies

No. of participants

Statistical method

Effect size

1 CrCl Show forest plot

1

Mean Difference (IV, Random, 95% CI)

Totals not selected

2 BUN Show forest plot

2

66

Mean Difference (IV, Random, 95% CI)

‐0.28 [‐2.21, 1.65]

3 Working capacity Show forest plot

1

Risk Ratio (M‐H, Random, 95% CI)

Totals not selected

3.1 Part‐time working capacity

1

Risk Ratio (M‐H, Random, 95% CI)

0.0 [0.0, 0.0]

3.2 Full‐time working capacity

1

Risk Ratio (M‐H, Random, 95% CI)

0.0 [0.0, 0.0]

Figuras y tablas -
Comparison 2. Rheum officinale versus captopril