Fototerapia con diodo emisor de luz para la hiperbilirrubinemia no conjugada en neonatos
Referencias
Referencias de los estudios incluidos en esta revisión
Referencias de los estudios excluidos de esta revisión
Referencias de los estudios en espera de evaluación
Referencias adicionales
Characteristics of studies
Characteristics of included studies [ordered by study ID]
| Methods | Randomised controlled trial. | |
| Participants | 31 preterm neonates admitted in neonatal intensive care unit enrolled if born at less than 34 weeks of gestational age, did not require respiratory support, and were clinically stable. Neonates with malformations, perinatal asphyxia, respiratory distress, patent ductus arteriosus, intracranial haemorrhage, hypo‐ or hypertension, infection, anaemia (venous Hb<10 g/dL), polycythaemia (venous Hb>22 g/dL), or neonates receiving cardiovascular drugs (i.e., dopamine, dobutamine) excluded. | |
| Interventions | Experimental group (n=17) received phototherapy with a commercial LED device with special blue light emitting diodes. Control group (n=14) received phototherapy with a device incorporating a metal vapour discharge blue lamp with two filters. Phototherapy was started when serum total bilirubin was more than 171.0 μmol/L [>10 mg/dL]) and discontinued when serum total bilirubin declined below 145 μmol/L (<8.5 mg/dL). | |
| Outcomes | Main outcomes were trans‐epidermal water loss and change in cerebral haemodynamics. Also reported duration of phototherapy. | |
| Notes | In both study groups distance between the infants and the light sources kept similar at 30 cm. | |
| Risk of bias | ||
| Bias | Authors' judgement | Support for judgement |
| Random sequence generation (selection bias) | Unclear risk | “......selected to enter either of the two groups randomly” |
| Allocation concealment (selection bias) | Low risk | Using sealed envelopes technique. |
| Blinding (performance bias and detection bias) | High risk | Blinding of intervention or ascertainment of outcome has not been mentioned and are unlikely due to nature of the intervention. |
| Incomplete outcome data (attrition bias) | Low risk | Relevant clinical outcomes for all enrolled neonates have been reported. |
| Selective reporting (reporting bias) | Low risk | Study protocol not available in public domain. However, authors have reported the clinically relevant outcomes. Risk of bias due to selective reporting is unlikely. |
| Other bias | Low risk | Risk of bias due to other reasons is unlikely. |
| Methods | Multi‐centre randomised controlled trial. | |
| Participants | 272 newborn infants born at 35 or more completed weeks of gestation with hyperbilirubinaemia needing phototherapy within first 7 days of life. Infants with perinatal asphyxia (Apgar score <4 at 1 minute or <7 at 5 minute), onset of jaundice within 24 h of age, evidence of haemolysis (positive direct Coombs test), rhesus haemolytic disease, culture‐positive or clinical sepsis, need for exchange transfusion at the time of enrolment, and major congenital malformations excluded. | |
| Interventions | Experimental group (n=142) received phototherapy with a prototype device having multiple LED bulbs arranged in an area of about 20×15 cm. Control group (n=130) received phototherapy with a commercial device having 6 special blue compact fluorescent tubes. Distance kept similar in the two groups. Phototherapy was started on the basis of the age of the baby in hours and serum total bilirubin (STB) levels, as per American Academy of Pediatrics guidelines. Phototherapy was stopped when two consecutive STB levels, measured 6 hours apart were less than 15 mg/dL. | |
| Outcomes | Duration of phototherapy, failure of phototherapy (serum total bilirubin rising or becoming more than 20 mg/dL during phototherapy, which required either use of double surface phototherapy or exchange transfusion), rate of decrease in serum total bilirubin over total duration of phototherapy and incidence of hypothermia. | |
| Notes | Distance of 25‐30 cm was maintained between the baby and the bulb/lamp surface for both type of units. | |
| Risk of bias | ||
| Bias | Authors' judgement | Support for judgement |
| Random sequence generation (selection bias) | Low risk | A web‐based random number generator was used for block randomisation stratified for each centre. |
| Allocation concealment (selection bias) | Low risk | Using sealed envelopes technique. |
| Blinding (performance bias and detection bias) | High risk | Blinding of intervention or ascertainment of outcome has not been mentioned and are unlikely due to nature of the intervention. |
| Incomplete outcome data (attrition bias) | Low risk | Relevant clinical outcomes for all enrolled neonates have been reported. |
| Selective reporting (reporting bias) | Low risk | Study protocol is available from Clinical Trial Regsitry of India (clinical trial registration number: CTRI/2008/091/000072). All relevant clinical outcomes have been reported. |
| Other bias | Low risk | "The prototype LED phototherapy units at all sites were provided by Srichakra Scientifics, Hyderabad,India free of cost." Unpublished information: Srichakra Scientifics, Hyderabad, India were not involved in planning, conducting, analysis or decision to publish the study. |
| Methods | Randomised controlled trial. | |
| Participants | Newborn infants born at 35 or more completed weeks of gestation were eligible for enrolment if decision to start phototherapy was made by attending paediatrician. Among 66 infants enrolled, 30 received phototherapy during birth hospitalisation and 36 during readmission. | |
| Interventions | For infants receiving phototherapy during birth hospitalisation: LED group (n=14) received phototherapy using a prototype device. Control group (n=16) received phototherapy using eight 2‐feet long special blue fluorescent tubes. In both groups a fibreoptic blanket was kept underneath the infant. For infants receiving phototherapy during readmission: LED group (n=19) received phototherapy using a commercially available device. Control group (n=17) received phototherapy using two phototherapy units above the infant with each unit containing four special blue fluorescent tubes. In both groups additional phototherapy provided from underneath the infant using four fluorescent special blue tubes.Decision to start phototherapy was made by the attending paediatrician. | |
| Outcomes | Primary outcome: rate of decline of serum total bilirubin over total duration of phototherapy. | |
| Notes | The distance between the lights and the infants was adjusted to provide an irradiance of approximately 40 μW/cm2/nm. | |
| Risk of bias | ||
| Bias | Authors' judgement | Support for judgement |
| Random sequence generation (selection bias) | Low risk | Computer‐generated set of random numbers. |
| Allocation concealment (selection bias) | Low risk | Sealed enveloped used. |
| Blinding (performance bias and detection bias) | High risk | Blinding of intervention or ascertainment of outcome has not been mentioned and are unlikely due to nature of the intervention. |
| Incomplete outcome data (attrition bias) | Low risk | Relevant clinical outcomes for all enrolled neonates have been reported. |
| Selective reporting (reporting bias) | Low risk | Study protocol not available in public domain. However, authors have reported the clinically relevant outcomes. Risk of bias due to selective reporting is unlikely. |
| Other bias | Unclear risk | Supported by a grant from Natus Medical Inc. |
| Methods | Randomised controlled trial. | |
| Participants | 88 preterm neonates weighing more than 1000 gm admitted to neonatal intensive care unit. Neonates with direct | |
| Interventions | Experimental group (n=44) given treatment with blue LED phototherapy system positioned 30 cm from the patient and illuminating an elliptical area of 38 cm x 27 cm diameter. Control group (n=44) given treatment with a halogen phototherapy system equipped with a single quartz‐halogen lamp with a dichroic reflector, positioned 50 cm from the patient and illuminating a circle of 18 cm diameter. To match surface area exposed in two groups, two halogen light phototherapy systems used for each patient in control group. Criteria to start phototherapy were based on serum bilirubin concentration for different birth weight ranges published in literature (Bhutani 2004). Phototherapy was stopped when serum bilirubin values reached 30% below the initial values. | |
| Outcomes | Rate of decrease of serum total bilirubin (TB) concentration in the first 24 hours of treatment and duration of treatment (hours). | |
| Notes | Two halogen phototherapy systems used for each patient in the control group so that surface area exposed to phototherapy is similar in control and experimental group. | |
| Risk of bias | ||
| Bias | Authors' judgement | Support for judgement |
| Random sequence generation (selection bias) | Unclear risk | “performed stratified randomisation in blocks of 4” method of sequence generation not mentioned. |
| Allocation concealment (selection bias) | Unclear risk | Not mentioned. |
| Blinding (performance bias and detection bias) | High risk | Blinding of intervention or ascertainment of outcome has not been mentioned and are unlikely due to nature of the intervention. |
| Incomplete outcome data (attrition bias) | Low risk | Relevant clinical outcomes for all enrolled neonates have been reported |
| Selective reporting (reporting bias) | Low risk | Study protocol not available in public domain. However, authors have reported the clinically relevant outcomes. Risk of bias due to selective reporting is unlikely. |
| Other bias | Low risk | Risk of bias due to other reasons is unlikely. |
| Methods | Randomised controlled trial. | |
| Participants | 69 healthy term neonates with hyperbilirubinaemia. | |
| Interventions | Experimental group (n=34) received LED phototherapy with a prototype device consisting of 6 focused arrays, each with 100 3‐mm blue LEDs. Control group (n=35) received phototherapy with three halogen‐quartz bulbs. Distance adjusted to provide similar irradiance. Phototherapy was started and stopped based on American Acadmey of Pediatrics practice parameters. | |
| Outcomes | Rate of decrease in serum total bilirubin over total duration of phototherapy , duration of phototherapy. | |
| Notes | LED phototherapy device placed at a distance that provided light intensity within the measured limits of conventional phototherapy device. | |
| Risk of bias | ||
| Bias | Authors' judgement | Support for judgement |
| Random sequence generation (selection bias) | Low risk | Computer‐generated random table. |
| Allocation concealment (selection bias) | Unclear risk | Not described. |
| Blinding (performance bias and detection bias) | High risk | Blinding of intervention or ascertainment of outcome has not been mentioned and are unlikely due to nature of the intervention. |
| Incomplete outcome data (attrition bias) | Low risk | Relevant clinical outcomes for all enrolled neonates have been reported. |
| Selective reporting (reporting bias) | Low risk | Study protocol not available in public domain. However, authors have reported the clinically relevant outcomes. Risk of bias due to selective reporting is unlikely. |
| Other bias | Low risk | Risk of bias due to other reasons is unlikely. |
| Methods | Randomised controlled trial. | |
| Participants | 114 health term neonates with hyperbilirubinaemia. | |
| Interventions | Experimental group (n=47) received LED phototherapy and was further randomised to either blue or blue‐green LED phototherapy. Control group (n=57) received phototherapy with three halogen‐quartz bulbs. Phototherapy was started and stopped based on American Acadmey of Pediatrics practice parameters. | |
| Outcomes | Rate of decrease in serum total bilirubin over total duration of phototherapy, duration of phototherapy. | |
| Notes | LED phototherapy device placed at a distance that provided light intensity within the measured limits of conventional phototherapy device. | |
| Risk of bias | ||
| Bias | Authors' judgement | Support for judgement |
| Random sequence generation (selection bias) | Low risk | Computer‐generated random table. |
| Allocation concealment (selection bias) | Unclear risk | Not described. |
| Blinding (performance bias and detection bias) | High risk | Blinding of intervention or ascertainment of outcome has not been mentioned and are unlikely due to nature of the intervention. |
| Incomplete outcome data (attrition bias) | Low risk | Relevant clinical outcomes for all enrolled neonates have been reported. |
| Selective reporting (reporting bias) | Low risk | Study protocol not available in public domain. However, authors have reported the clinically relevant outcomes. Risk of bias due to selective reporting is unlikely. |
| Other bias | Low risk | Risk of bias due to other reasons is unlikely. |
Characteristics of excluded studies [ordered by study ID]
| Study | Reason for exclusion |
| Compared efficacy of prototype blue gallium nitride LED phototherapy unit with commercially used halogen quartz phototherapy device by measuring both in vitro and in vivo (in Gunn rats) bilirubin photodegradation. | |
| An observational study which compared chromosomal effects caused by conventional phototherapy and intensive (LED) phototherapy in jaundiced newborns. Study also reported rate of decline of serum total bilirubin. | |
| Compared efficacy of a prototype LED device with that of conventional phototherapy devices by measuring the in vitro photodegradation of BR in human serum albumin. |
Characteristics of studies awaiting assessment [ordered by study ID]
| Methods | Multi‐centre randomised controlled trial |
| Participants | 1974 infants with extremely low birth weight (501‐1000 g) at 12 to 36 hours of age |
| Interventions | Subjects were randomised to aggressive or conservative phototherapy groups. Aggressive‐phototherapy was initiated at enrolment or whenever bilirubin level was more than 5‐7 mg/dL). Conservative phototherapy was initiated, continued, or restarted whenever the bilirubin level was more than 8‐10 mg/dL. |
| Outcomes | Primary outcome was death or neurodevelopmental impairment at 18 to 22 months of corrected age |
| Notes | Data from subgroup of neonates who received LED phototherapy is not yet published |
Data and analyses
| Outcome or subgroup title | No. of studies | No. of participants | Statistical method | Effect size |
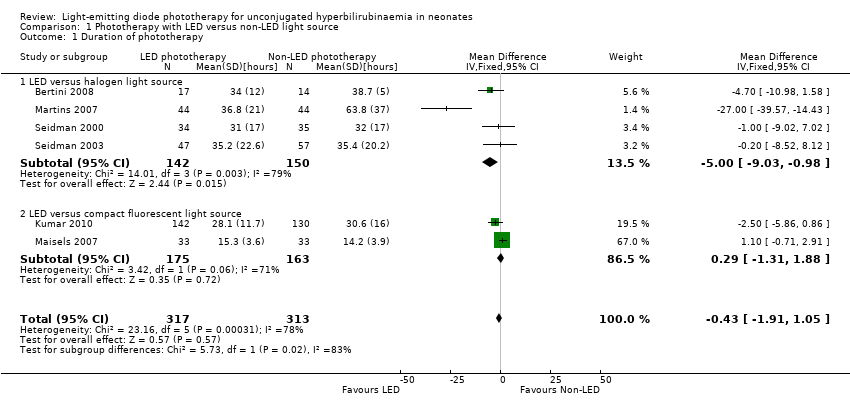
| 1 Duration of phototherapy Show forest plot | 6 | 630 | Mean Difference (IV, Fixed, 95% CI) | ‐0.43 [‐1.91, 1.05] |
| Analysis 1.1  Comparison 1 Phototherapy with LED versus non‐LED light source, Outcome 1 Duration of phototherapy. | ||||
| 1.1 LED versus halogen light source | 4 | 292 | Mean Difference (IV, Fixed, 95% CI) | ‐5.00 [‐9.03, ‐0.98] |
| 1.2 LED versus compact fluorescent light source | 2 | 338 | Mean Difference (IV, Fixed, 95% CI) | 0.29 [‐1.31, 1.88] |
| 2 Rate of decline of serum total bilirubin Show forest plot | 4 | 511 | Mean Difference (IV, Fixed, 95% CI) | 0.01 [‐0.02, 0.04] |
| Analysis 1.2  Comparison 1 Phototherapy with LED versus non‐LED light source, Outcome 2 Rate of decline of serum total bilirubin. | ||||
| 2.1 LED versus halogen light source | 2 | 173 | Mean Difference (IV, Fixed, 95% CI) | 0.02 [‐0.03, 0.07] |
| 2.2 LED versus compact fluorescent light source | 2 | 338 | Mean Difference (IV, Fixed, 95% CI) | 0.01 [‐0.03, 0.04] |
| 3 Treatment failure (need of additional phototherapy or exchange transfusion) Show forest plot | 2 | 360 | Risk Ratio (M‐H, Fixed, 95% CI) | 1.83 [0.47, 7.17] |
| Analysis 1.3  Comparison 1 Phototherapy with LED versus non‐LED light source, Outcome 3 Treatment failure (need of additional phototherapy or exchange transfusion). | ||||
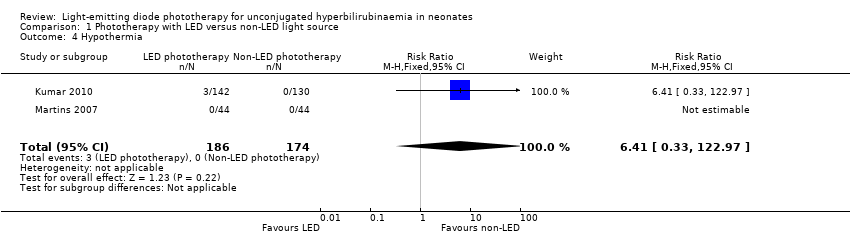
| 4 Hypothermia Show forest plot | 2 | 360 | Risk Ratio (M‐H, Fixed, 95% CI) | 6.41 [0.33, 122.97] |
| Analysis 1.4  Comparison 1 Phototherapy with LED versus non‐LED light source, Outcome 4 Hypothermia. | ||||
| 5 Hyperthermia Show forest plot | 2 | 360 | Risk Ratio (M‐H, Fixed, 95% CI) | 0.61 [0.18, 2.11] |
| Analysis 1.5  Comparison 1 Phototherapy with LED versus non‐LED light source, Outcome 5 Hyperthermia. | ||||
| 6 Skin rash Show forest plot | 2 | 360 | Risk Ratio (M‐H, Fixed, 95% CI) | 1.83 [0.17, 19.96] |
| Analysis 1.6  Comparison 1 Phototherapy with LED versus non‐LED light source, Outcome 6 Skin rash. | ||||
| Outcome or subgroup title | No. of studies | No. of participants | Statistical method | Effect size |
| 1 Duration of phototherapy Show forest plot | 4 | 292 | Mean Difference (IV, Fixed, 95% CI) | ‐5.00 [‐9.03, ‐0.98] |
| Analysis 2.1  Comparison 2 Phototherapy with LED versus halogen light source, Outcome 1 Duration of phototherapy. | ||||
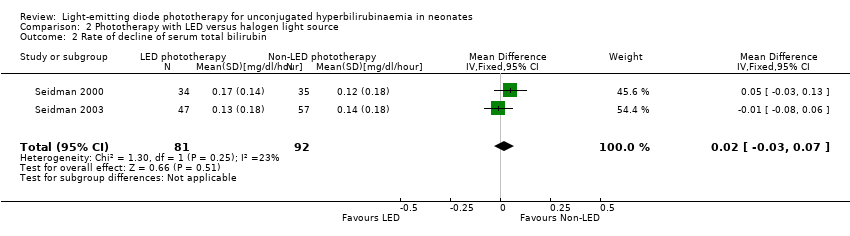
| 2 Rate of decline of serum total bilirubin Show forest plot | 2 | 173 | Mean Difference (IV, Fixed, 95% CI) | 0.02 [‐0.03, 0.07] |
| Analysis 2.2  Comparison 2 Phototherapy with LED versus halogen light source, Outcome 2 Rate of decline of serum total bilirubin. | ||||
| Outcome or subgroup title | No. of studies | No. of participants | Statistical method | Effect size |
| 1 Duration of phototherapy Show forest plot | 2 | 338 | Mean Difference (IV, Fixed, 95% CI) | 0.29 [‐1.31, 1.88] |
| Analysis 3.1  Comparison 3 Phototherapy with LED versus compact fluorescent light source, Outcome 1 Duration of phototherapy. | ||||
| 2 Rate of decline of serum total bilirubin Show forest plot | 2 | 338 | Mean Difference (IV, Fixed, 95% CI) | 0.01 [‐0.03, 0.04] |
| Analysis 3.2  Comparison 3 Phototherapy with LED versus compact fluorescent light source, Outcome 2 Rate of decline of serum total bilirubin. | ||||
| Outcome or subgroup title | No. of studies | No. of participants | Statistical method | Effect size |
| 1 Duration of phototherapy Show forest plot | 4 | 327 | Mean Difference (IV, Fixed, 95% CI) | 0.43 [‐1.28, 2.14] |
| Analysis 4.1  Comparison 4 Phototherapy with LED versus non‐LED light source and irradiance matched, Outcome 1 Duration of phototherapy. | ||||
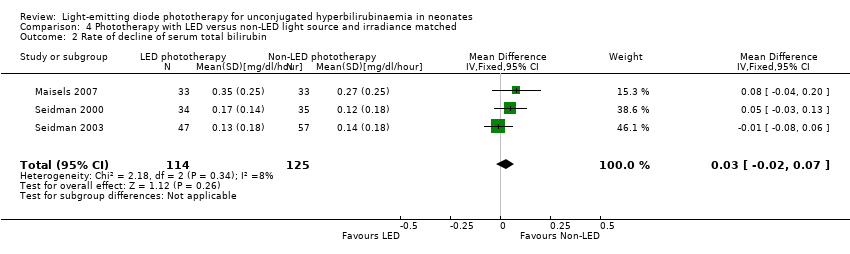
| 2 Rate of decline of serum total bilirubin Show forest plot | 3 | 239 | Mean Difference (IV, Fixed, 95% CI) | 0.03 [‐0.02, 0.07] |
| Analysis 4.2  Comparison 4 Phototherapy with LED versus non‐LED light source and irradiance matched, Outcome 2 Rate of decline of serum total bilirubin. | ||||
| Outcome or subgroup title | No. of studies | No. of participants | Statistical method | Effect size |
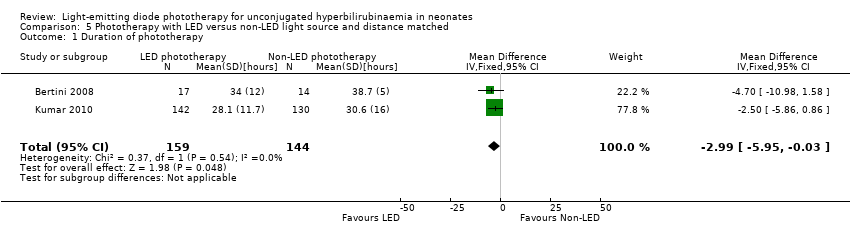
| 1 Duration of phototherapy Show forest plot | 2 | 303 | Mean Difference (IV, Fixed, 95% CI) | ‐2.99 [‐5.95, ‐0.03] |
| Analysis 5.1  Comparison 5 Phototherapy with LED versus non‐LED light source and distance matched, Outcome 1 Duration of phototherapy. | ||||
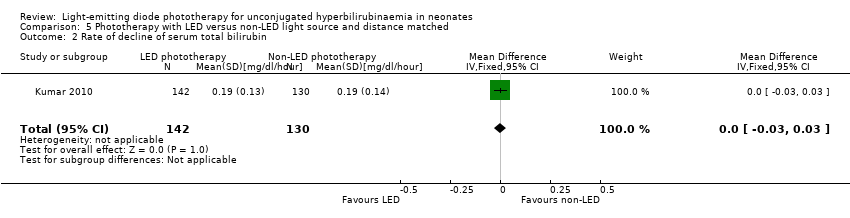
| 2 Rate of decline of serum total bilirubin Show forest plot | 1 | 272 | Mean Difference (IV, Fixed, 95% CI) | 0.0 [‐0.03, 0.03] |
| Analysis 5.2  Comparison 5 Phototherapy with LED versus non‐LED light source and distance matched, Outcome 2 Rate of decline of serum total bilirubin. | ||||
| Outcome or subgroup title | No. of studies | No. of participants | Statistical method | Effect size |
| 1 Duration of phototherapy Show forest plot | 3 | 382 | Mean Difference (IV, Fixed, 95% CI) | ‐1.72 [‐4.89, 1.44] |
| Analysis 6.1  Comparison 6 Phototherapy with LED versus non‐LED light source in term neonates, Outcome 1 Duration of phototherapy. | ||||
| 2 Rate of decline of serum bilirubin Show forest plot | 3 | 382 | Mean Difference (IV, Fixed, 95% CI) | 0.01 [‐0.02, 0.04] |
| Analysis 6.2  Comparison 6 Phototherapy with LED versus non‐LED light source in term neonates, Outcome 2 Rate of decline of serum bilirubin. | ||||
| Outcome or subgroup title | No. of studies | No. of participants | Statistical method | Effect size |
| 1 Duration of phototherapy Show forest plot | 3 | 182 | Mean Difference (IV, Fixed, 95% CI) | ‐7.22 [‐11.69, ‐2.76] |
| Analysis 7.1  Comparison 7 Phototherapy with LED versus non‐LED light source in preterm neonates, Outcome 1 Duration of phototherapy. | ||||
| 2 Rate of decline of serum bilirubin Show forest plot | 1 | 61 | Mean Difference (IV, Fixed, 95% CI) | 0.01 [‐0.05, 0.07] |
| Analysis 7.2  Comparison 7 Phototherapy with LED versus non‐LED light source in preterm neonates, Outcome 2 Rate of decline of serum bilirubin. | ||||

Funnel plot of comparison: 1 Phototherapy with LED versus non‐LED light source, outcome: 1.1 Duration of phototherapy.

Funnel plot of comparison: 1 Phototherapy with LED versus non‐LED light source, outcome: 1.2 Rate of decline of serum total bilirubin.

Methodological quality summary: review authors' judgements about each methodological quality item for each included study.

Methodological quality graph: review authors' judgements about each methodological quality item presented as percentages across all included studies.
Comparison 1 Phototherapy with LED versus non‐LED light source, Outcome 1 Duration of phototherapy.

Comparison 1 Phototherapy with LED versus non‐LED light source, Outcome 2 Rate of decline of serum total bilirubin.

Comparison 1 Phototherapy with LED versus non‐LED light source, Outcome 3 Treatment failure (need of additional phototherapy or exchange transfusion).
Comparison 1 Phototherapy with LED versus non‐LED light source, Outcome 4 Hypothermia.

Comparison 1 Phototherapy with LED versus non‐LED light source, Outcome 5 Hyperthermia.

Comparison 1 Phototherapy with LED versus non‐LED light source, Outcome 6 Skin rash.

Comparison 2 Phototherapy with LED versus halogen light source, Outcome 1 Duration of phototherapy.
Comparison 2 Phototherapy with LED versus halogen light source, Outcome 2 Rate of decline of serum total bilirubin.

Comparison 3 Phototherapy with LED versus compact fluorescent light source, Outcome 1 Duration of phototherapy.

Comparison 3 Phototherapy with LED versus compact fluorescent light source, Outcome 2 Rate of decline of serum total bilirubin.

Comparison 4 Phototherapy with LED versus non‐LED light source and irradiance matched, Outcome 1 Duration of phototherapy.
Comparison 4 Phototherapy with LED versus non‐LED light source and irradiance matched, Outcome 2 Rate of decline of serum total bilirubin.
Comparison 5 Phototherapy with LED versus non‐LED light source and distance matched, Outcome 1 Duration of phototherapy.
Comparison 5 Phototherapy with LED versus non‐LED light source and distance matched, Outcome 2 Rate of decline of serum total bilirubin.

Comparison 6 Phototherapy with LED versus non‐LED light source in term neonates, Outcome 1 Duration of phototherapy.

Comparison 6 Phototherapy with LED versus non‐LED light source in term neonates, Outcome 2 Rate of decline of serum bilirubin.

Comparison 7 Phototherapy with LED versus non‐LED light source in preterm neonates, Outcome 1 Duration of phototherapy.

Comparison 7 Phototherapy with LED versus non‐LED light source in preterm neonates, Outcome 2 Rate of decline of serum bilirubin.
| Phototherapy with LED versus non‐LED light source for unconjugated hyperbilirubinaemia in neonates | ||||||
| Patient or population: neonates with unconjugated hyperbilirubinaemia | ||||||
| Outcomes | Illustrative comparative risks (95% CI) | Relative effect | No of Participants | Quality of the evidence | Comments | |
| Assumed risk | Corresponding risk | |||||
| Control | Phototherapy with LED versus non‐LED light source | |||||
| Duration of phototherapy | The mean duration of phototherapy in the intervention group was | Mean Difference (IV, Fixed, 95% CI [Hours]): ‐0.43 [‐1.91 to 1.05] | 630 | ⊕⊕⊕⊕ | ||
| Rate of decline of serum total bilirubin | The mean Rate of decline of serum total bilirubin in the intervention group was | Mean Difference (IV, Fixed, 95% CI [mg/dL/hour]): 0.01 [‐0.02 to 0.04] | 511 | ⊕⊕⊕⊕ | ||
| *The basis for the assumed risk (e.g. the median control group risk across studies) is provided in footnotes. The corresponding risk (and its 95% confidence interval) is based on the assumed risk in the comparison group and the relative effect of the intervention (and its 95% CI). | ||||||
| GRADE Working Group grades of evidence | ||||||
| Outcome or subgroup title | No. of studies | No. of participants | Statistical method | Effect size |
| 1 Duration of phototherapy Show forest plot | 6 | 630 | Mean Difference (IV, Fixed, 95% CI) | ‐0.43 [‐1.91, 1.05] |
| 1.1 LED versus halogen light source | 4 | 292 | Mean Difference (IV, Fixed, 95% CI) | ‐5.00 [‐9.03, ‐0.98] |
| 1.2 LED versus compact fluorescent light source | 2 | 338 | Mean Difference (IV, Fixed, 95% CI) | 0.29 [‐1.31, 1.88] |
| 2 Rate of decline of serum total bilirubin Show forest plot | 4 | 511 | Mean Difference (IV, Fixed, 95% CI) | 0.01 [‐0.02, 0.04] |
| 2.1 LED versus halogen light source | 2 | 173 | Mean Difference (IV, Fixed, 95% CI) | 0.02 [‐0.03, 0.07] |
| 2.2 LED versus compact fluorescent light source | 2 | 338 | Mean Difference (IV, Fixed, 95% CI) | 0.01 [‐0.03, 0.04] |
| 3 Treatment failure (need of additional phototherapy or exchange transfusion) Show forest plot | 2 | 360 | Risk Ratio (M‐H, Fixed, 95% CI) | 1.83 [0.47, 7.17] |
| 4 Hypothermia Show forest plot | 2 | 360 | Risk Ratio (M‐H, Fixed, 95% CI) | 6.41 [0.33, 122.97] |
| 5 Hyperthermia Show forest plot | 2 | 360 | Risk Ratio (M‐H, Fixed, 95% CI) | 0.61 [0.18, 2.11] |
| 6 Skin rash Show forest plot | 2 | 360 | Risk Ratio (M‐H, Fixed, 95% CI) | 1.83 [0.17, 19.96] |
| Outcome or subgroup title | No. of studies | No. of participants | Statistical method | Effect size |
| 1 Duration of phototherapy Show forest plot | 4 | 292 | Mean Difference (IV, Fixed, 95% CI) | ‐5.00 [‐9.03, ‐0.98] |
| 2 Rate of decline of serum total bilirubin Show forest plot | 2 | 173 | Mean Difference (IV, Fixed, 95% CI) | 0.02 [‐0.03, 0.07] |
| Outcome or subgroup title | No. of studies | No. of participants | Statistical method | Effect size |
| 1 Duration of phototherapy Show forest plot | 2 | 338 | Mean Difference (IV, Fixed, 95% CI) | 0.29 [‐1.31, 1.88] |
| 2 Rate of decline of serum total bilirubin Show forest plot | 2 | 338 | Mean Difference (IV, Fixed, 95% CI) | 0.01 [‐0.03, 0.04] |
| Outcome or subgroup title | No. of studies | No. of participants | Statistical method | Effect size |
| 1 Duration of phototherapy Show forest plot | 4 | 327 | Mean Difference (IV, Fixed, 95% CI) | 0.43 [‐1.28, 2.14] |
| 2 Rate of decline of serum total bilirubin Show forest plot | 3 | 239 | Mean Difference (IV, Fixed, 95% CI) | 0.03 [‐0.02, 0.07] |
| Outcome or subgroup title | No. of studies | No. of participants | Statistical method | Effect size |
| 1 Duration of phototherapy Show forest plot | 2 | 303 | Mean Difference (IV, Fixed, 95% CI) | ‐2.99 [‐5.95, ‐0.03] |
| 2 Rate of decline of serum total bilirubin Show forest plot | 1 | 272 | Mean Difference (IV, Fixed, 95% CI) | 0.0 [‐0.03, 0.03] |
| Outcome or subgroup title | No. of studies | No. of participants | Statistical method | Effect size |
| 1 Duration of phototherapy Show forest plot | 3 | 382 | Mean Difference (IV, Fixed, 95% CI) | ‐1.72 [‐4.89, 1.44] |
| 2 Rate of decline of serum bilirubin Show forest plot | 3 | 382 | Mean Difference (IV, Fixed, 95% CI) | 0.01 [‐0.02, 0.04] |
| Outcome or subgroup title | No. of studies | No. of participants | Statistical method | Effect size |
| 1 Duration of phototherapy Show forest plot | 3 | 182 | Mean Difference (IV, Fixed, 95% CI) | ‐7.22 [‐11.69, ‐2.76] |
| 2 Rate of decline of serum bilirubin Show forest plot | 1 | 61 | Mean Difference (IV, Fixed, 95% CI) | 0.01 [‐0.05, 0.07] |