Comparación de la quimioterapia con BEACOPP escalonado y la quimioterapia con ABVD para pacientes con linfoma de Hodgkin avanzado o temprano no favorable
Referencias
Referencias de los estudios incluidos en esta revisión
Referencias de los estudios excluidos de esta revisión
Referencias de los estudios en curso
Referencias adicionales
Characteristics of studies
Characteristics of included studies [ordered by study ID]
| Methods | Randomisation
Allocation ratios
Recruitment period
Median follow‐up time
| |
| Participants | Eligibility criteria:
Patients recruited (N = 1655), 32 patients excluded
Mean age:
Gender (male, female):
Stage of disease:
Country
| |
| Interventions | BEACOPP
ABVD
After chemotherapy all patients received IF‐RT
| |
| Outcomes | Outcomes and time points from the study that are considered in the review: reported
not reported
| |
| Notes | Funding resources or authors' declarations of "conflict of interest" were not reported. | |
| Risk of bias | ||
| Bias | Authors' judgement | Support for judgement |
| Random sequence generation (selection bias) | Unclear risk | Quote: "patients (...) were randomized" Comment: The HD 14 trial is organized by the GHSG, that also led the HD 9 trial. Sequence generation and allocation concealment should be judged to probably be adequate, because this is a large multi‐centre trial and other trials of this study group have previously been adequately randomised and allocation of these trials have previously been adequately concealed. |
| Allocation concealment (selection bias) | Unclear risk | No information provided. |
| Blinding (performance bias and detection bias) | Low risk | No information about blinding provided. This is judged not to be a source of bias for OS. |
| Blinding (performance bias and detection bias) | Unclear risk | No information about blinding provided. |
| Incomplete outcome data (attrition bias) | Unclear risk | Quote: "[..] 1.655 patients [...] were randomized. [...] The full analysis set comprised 1623 patients [...]. Patient characteristics were well balanced between both arms [...]." Comment: No further information provided |
| Selective reporting (reporting bias) | Unclear risk | A protocol of this trial was not registered. |
| Other bias | Unclear risk | No information provided. |
| Methods | Randomisation
Allocation ratios
Recruitment period
Median follow‐up time
| |
| Participants | Eligibility criteria:
Patients recruited (N = 1282)
Mean age:
Gender (male, female):
Stage of disease:
Bulky disease: escalated BEACOPP: 67%; standard BEACOPP: 68%; COPP/ABVD: 58% Country
| |
| Interventions | escalated BEACOPP (every 22 days)
standard BEACOPP (every 22 days)
COPP/ABVD (every 57 days)
Additional therapy At the end of chemotherapy, radiotherapy was scheduled for sites of initial bulky disease (those at least 5 cm in diameter) and any residual tumour.
| |
| Outcomes | Outcomes and time points from the study that are considered in the review: reported
not reported
| |
| Notes | At the first interim analysis in September 1996, the early stopping boundary was crossed, with the demonstration that both BEACOPP groups together were significantly superior to COPP/ABVD in terms of the rate of FFTF. Therefore, assignment to the COPP/ABVD group was stopped (Diehl 2003a). This study was supported by a grand from: Deutsche Krebshilfe, Swiss Group for Clinical Cancer Research (Diehl 2003a) The author(s) indicated no potential conflicts of interest (Engert 2009). | |
| Risk of bias | ||
| Bias | Authors' judgement | Support for judgement |
| Random sequence generation (selection bias) | Low risk | Quote: "random assignment was performed by computer" |
| Allocation concealment (selection bias) | Low risk | Quote: "after clinical staging patients were randomly assigned by telephone call to the trial coordination center to one of three chemotherapy regimens" |
| Blinding (performance bias and detection bias) | Low risk | No information about blinding provided. This is judged not to be a source of bias for OS. |
| Blinding (performance bias and detection bias) | Unclear risk | No information about blinding provided. |
| Incomplete outcome data (attrition bias) | Low risk | Quote: "Of 1282 patients, 86 were excluded due to incorrect Comment: Missing outcome data are balanced in numbers across intervention groups, with similar reasons for missing data across groups. Therefore, see Diehl 2003a who has given a detailed overview of the reasons for the exclusion of patients: escalated BEACOPP (15 did not have HD, 12 met clinical exclusion criteria, 1 lost to follow‐up), standard BEACOPP (19 did not have HD, 9 met clinical exclusion criteria, 1 lost to follow‐up), COPP/ABVD (12 did not have HD, 13 met clinical exclusion criteria, 3 lost to follow‐up). |
| Selective reporting (reporting bias) | Unclear risk | A protocol of this trial was not registered. |
| Other bias | Low risk | Quote: "Assignment to the COPP/ABVD group was stopped by the safety board after the first interim analysis indicating that both BEACOPP groups were significantly superior in terms of FFTF to COPP/ABVD (P .03)." Comment: In the GHSG HD9 trial randomisation for the escalated BEACOPP‐arm started later than randomisation to both other arms. Furthermore, randomisation to the COPP/ABVD‐arm was stopped after first interim analysis due to the fact that both BEACOPP groups together were significantly superior to COPP/ABVD in terms of the rate of freedom from treatment failure (Diehl 2003). According to this potential risk of bias the analyses of OS and PFS were based on data of patients recruited in parallel, i.e. during the same time period (COPP/ABVD N = 177, BEACOPP N = 265). |
| Methods | Randomisation
Allocation ratios
Recruitment period
Median follow‐up time
| |
| Participants | Eligibility criteria
Patients recruited (not reported)
Mean age:
Gender (male, female):
Stage of disease:
Country
| |
| Interventions | escalated BEACOPP (every 21 days)
standard BEACOPP (every 21 days)
ABVD (every 28 days)
Additional therapy At the end of chemotherapy, radiotherapy was scheduled for sites of initial bulky disease and any residual tumour
For treatment failures
| |
| Outcomes | Outcomes and time points from the study that are considered in the review: reported
not reported
| |
| Notes | Funding resources or authors declarations of "conflict of interest" were not reported. | |
| Risk of bias | ||
| Bias | Authors' judgement | Support for judgement |
| Random sequence generation (selection bias) | Unclear risk | Quote: "patients (...) were randomized" Comment: No further information provided |
| Allocation concealment (selection bias) | Unclear risk | No information provided. |
| Blinding (performance bias and detection bias) | Low risk | No information about blinding provided. This is judged not to be a source of bias for OS. |
| Blinding (performance bias and detection bias) | Unclear risk | No information about blinding provided. |
| Incomplete outcome data (attrition bias) | Unclear risk | Comment: According to a power‐point presentation Gianni offered us for this review 331 patients were registered, whereas 321 were eligible for analysis. Reasons for exclusion were not provided. |
| Selective reporting (reporting bias) | Unclear risk | A protocol of this trial was not registered. |
| Other bias | Unclear risk | No information provided. |
| Methods | Randomisation
Allocation ratios
Recruitment period
Median follow‐up time
| |
| Participants | Eligibility criteria.
Patients recruited (N = 307)
Mean age:
Gender (male, female):
Stage of disease:
Bulky disease: escalated BEACOPP: 37%; CEC: 37%; ABVD: 31% Country
| |
| Interventions | BEACOPP (every 21 days)
CEC (every 28 days)
ABVD (every 28 days)
Additional therapy At the end of chemotherapy, radiotherapy was scheduled for sites of previous bulky disease or on slowly or partially responding sites.
| |
| Outcomes | Outcomes and time points from the study that are considered in the review: reported
not reported
| |
| Notes | This study was in parts funded by: Associazione Angela Serra per la Ricerca sul Cancro, Modena, and the Gruppo Amici Dell’Ematologia, Reggio Emilia, Italy. The author(s) indicated no potential conflicts of interest. | |
| Risk of bias | ||
| Bias | Authors' judgement | Support for judgement |
| Random sequence generation (selection bias) | Unclear risk | Quote: "patients were randomly assigned" Comment: No further information provided |
| Allocation concealment (selection bias) | Unclear risk | No information provided |
| Blinding (performance bias and detection bias) | Low risk | No information about blinding provided. This is judged not to be a source of bias for OS. |
| Blinding (performance bias and detection bias) | Unclear risk | No information about blinding provided. |
| Incomplete outcome data (attrition bias) | Low risk | Missing outcome data balanced in numbers across intervention groups, with similar reasons for missing data across groups (i.e. 4 patients of the BEACOPP arm were excluded from the analyses because of revised histology (N = 1), not compliant (N = 1), missing data (N = 2); 4 patients of the ABVD arm were excluded because of missing data (N = 3) and lost to follow‐up (N = 1)) |
| Selective reporting (reporting bias) | High risk | Quote: "The study was initially designed to compare myelotoxicity (...). Once, in the first 18 months, Gruppo Italiano per lo Studio dei Linfomi centers became familiar with BEACOPP, the protocol was amended and BEACOPP and CEC regimens were tested against ABVD primarily in terms of FFS." Comment: The protocol was registered in the way it was described above (http://clinicaltrials.gov: NCT00443677, last updated: March 19, 2009), but the amendment of this protocol was not published. There are major differences between defined outcomes of the original protocol (primary outcomes: toxicity of the CEC vs BEACOPP vs ABVD regimens; secondary outcomes: response, failure free survival, relapse free survival) |
| Other bias | Unclear risk | Quote: "The study was initially designed to compare myelotoxicity referred of leukopenia of CEC and BEACOPP regimens with respect of that of ABVD (...). Once, in the first 18 months, Gruppo Italiano per lo Studio dei Linfomi centers became familiar with BEACOPP, the protocol was amended and BEACOPP and CEC regimens were tested against ABVD primarily in terms of FFS." Quote: "We used one‐sided test in consideration of the expected superiority of BEACOPP and CEC, in term of FFS in comparison with the historical knowledge about ABVD chemotherapy regimen." Comment: This procedure might have led to a underpowered study. |
Abbreviations: CR ‐ complete response; FFTF ‐ freedom from treatment failure; HD ‐ Hodgkin's disease; HL ‐ Hodgkin lymphoma; LVEF ‐ left ventricular ejection fraction; OS ‐ overall survival; PFS ‐ progression‐free survival
Characteristics of excluded studies [ordered by study ID]
| Study | Reason for exclusion |
| Comparison arms not treated with escalated BEACOPP chemotherapy | |
| Not a randomised controlled trial | |
| Review | |
| Review | |
| Review | |
| Review | |
| Not a randomised controlled trial | |
| Not a randomised controlled trial | |
| Review | |
| Comparison arms not treated with escalated BEACOPP chemotherapy | |
| Not a randomised controlled trial | |
| Not a randomised controlled trial | |
| Comparison arms not treated with escalated BEACOPP chemotherapy | |
| Comparison arms not treated with escalated BEACOPP chemotherapy | |
| Comparison arms not treated with escalated BEACOPP chemotherapy | |
| Comparison arms not treated with escalated BEACOPP chemotherapy | |
| Review | |
| Review | |
| Review | |
| Review | |
| Not a randomised controlled trial | |
| Not a randomised controlled trial | |
| Not a randomised controlled trial | |
| Review | |
| Review | |
| Comparison arms not treated with escalated BEACOPP chemotherapy | |
| Comparison arms not treated with escalated BEACOPP chemotherapy | |
| Comparison arms not treated with ABVD chemotherapy | |
| Not a randomised controlled trial | |
| Not a randomised controlled trial | |
| Not a randomised controlled trial | |
| Comparison arms not treated with escalated BEACOPP chemotherapy |
Characteristics of ongoing studies [ordered by study ID]
| Trial name or title | BEACOPP (4 cycles escalated + 4 cycles baseline) versus ABVD (8 cycles) in Stage III & IV Hodgkin's Lymphoma (Registered at ClinicalTrials.gov identifier: NCT00049595) |
| Methods | Randomisation
Recruitment period
Median follow‐up time
|
| Participants | Eligibility criteria:
Patients recruited (not known)
Mean age:
Gender (male, female):
Country
|
| Interventions | escalated BEACOPP (every 22 days), [no information about dosage]
ABVD (every 28 days) [no information about dosis]
Additional therapy
|
| Outcomes | Outcomes and time points from the registered protocol of the study that are considered in the review: reported
not reported
|
| Starting date | August 2002 |
| Contact information | European Organization for Research and Treatment of Cancer: Patrice Carde, MD, Study coordinator, Ph: 33‐1‐4211‐4321 Further information: http://www.cancer.gov/clinicaltrials/EORTC‐20012 |
| Notes | Up to date no publications provided |
Data and analyses
| Outcome or subgroup title | No. of studies | No. of participants | Statistical method | Effect size |
| 1 OS ‐ all ‐ same recruitment period between the 2 arms (HD9) Show forest plot | 4 | 2583 | Hazard Ratio (Fixed, 95% CI) | 0.80 [0.59, 1.09] |
| Analysis 1.1  Comparison 1 Analysis overall survival, Outcome 1 OS ‐ all ‐ same recruitment period between the 2 arms (HD9). | ||||
| 2 OS subgrouped by stage of disease Show forest plot | 4 | 2583 | Hazard Ratio (Fixed, 95% CI) | 0.80 [0.59, 1.09] |
| Analysis 1.2  Comparison 1 Analysis overall survival, Outcome 2 OS subgrouped by stage of disease. | ||||
| 2.1 early unfavourable stage | 1 | 1623 | Hazard Ratio (Fixed, 95% CI) | 1.02 [0.54, 1.91] |
| 2.2 advanced stage | 3 | 960 | Hazard Ratio (Fixed, 95% CI) | 0.74 [0.52, 1.06] |
| 3 OS subgrouped by treatment Show forest plot | 4 | 2583 | Hazard Ratio (Fixed, 95% CI) | 0.80 [0.59, 1.09] |
| Analysis 1.3  Comparison 1 Analysis overall survival, Outcome 3 OS subgrouped by treatment. | ||||
| 3.1 only ABVD regimen | 3 | 2141 | Hazard Ratio (Fixed, 95% CI) | 1.03 [0.67, 1.59] |
| 3.2 ABVD including regimen | 1 | 442 | Hazard Ratio (Fixed, 95% CI) | 0.62 [0.40, 0.96] |
| 4 OS subgrouped by number of cycles of escalated BEACOPP Show forest plot | 4 | 2583 | Hazard Ratio (Fixed, 95% CI) | 0.80 [0.59, 1.09] |
| Analysis 1.4  Comparison 1 Analysis overall survival, Outcome 4 OS subgrouped by number of cycles of escalated BEACOPP. | ||||
| 4.1 eight cycles of escalated BEACOPP | 1 | 442 | Hazard Ratio (Fixed, 95% CI) | 0.62 [0.40, 0.96] |
| 4.2 four cycles of escalated BEACOPP | 2 | 518 | Hazard Ratio (Fixed, 95% CI) | 1.05 [0.58, 1.90] |
| 4.3 two cycles of escalated BEACOPP | 1 | 1623 | Hazard Ratio (Fixed, 95% CI) | 1.02 [0.54, 1.91] |
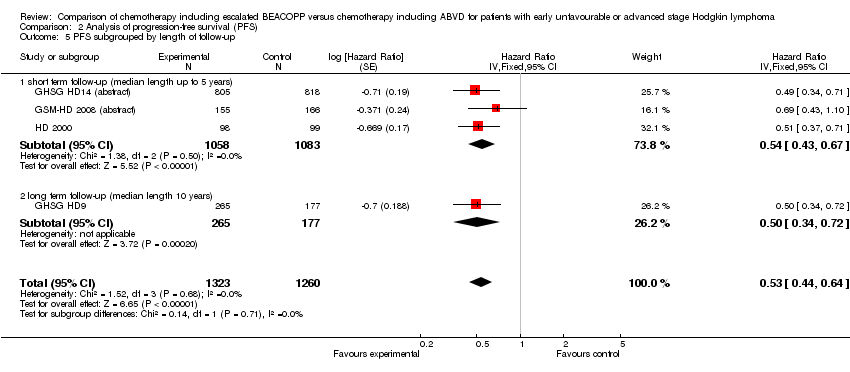
| 5 OS subgrouped by length of follow‐up Show forest plot | 4 | 2583 | Hazard Ratio (Fixed, 95% CI) | 0.80 [0.59, 1.09] |
| Analysis 1.5  Comparison 1 Analysis overall survival, Outcome 5 OS subgrouped by length of follow‐up. | ||||
| 5.1 short term follow‐up (median length up to 5 years) | 3 | 2141 | Hazard Ratio (Fixed, 95% CI) | 1.03 [0.67, 1.59] |
| 5.2 long term follow‐up (median length 10 years) | 1 | 442 | Hazard Ratio (Fixed, 95% CI) | 0.62 [0.40, 0.96] |
| 6 OS subgrouped by publication form Show forest plot | 4 | 2583 | Hazard Ratio (Fixed, 95% CI) | 0.80 [0.59, 1.09] |
| Analysis 1.6  Comparison 1 Analysis overall survival, Outcome 6 OS subgrouped by publication form. | ||||
| 6.1 full text publication | 2 | 639 | Hazard Ratio (Fixed, 95% CI) | 0.67 [0.45, 1.01] |
| 6.2 abstract publication | 2 | 1944 | Hazard Ratio (Fixed, 95% CI) | 1.02 [0.64, 1.65] |
| 7 OS subgrouped by type of results Show forest plot | 4 | 2583 | Hazard Ratio (Fixed, 95% CI) | 0.80 [0.59, 1.09] |
| Analysis 1.7  Comparison 1 Analysis overall survival, Outcome 7 OS subgrouped by type of results. | ||||
| 7.1 preliminary results | 2 | 1944 | Hazard Ratio (Fixed, 95% CI) | 1.02 [0.64, 1.65] |
| 7.2 mature results | 2 | 639 | Hazard Ratio (Fixed, 95% CI) | 0.67 [0.45, 1.01] |
| 8 OS ‐ all recruited patients (HD9) with potential risk of bias due to different time periods of recruitment Show forest plot | 4 | Hazard Ratio (Fixed, 95% CI) | 0.66 [0.50, 0.88] | |
| Analysis 1.8  Comparison 1 Analysis overall survival, Outcome 8 OS ‐ all recruited patients (HD9) with potential risk of bias due to different time periods of recruitment. | ||||
| Outcome or subgroup title | No. of studies | No. of participants | Statistical method | Effect size |
| 1 PFS ‐ all ‐ same recruitment period between the 2 arms (HD9) Show forest plot | 4 | 2583 | Hazard Ratio (Fixed, 95% CI) | 0.53 [0.44, 0.64] |
| Analysis 2.1  Comparison 2 Analysis of progression‐free survival (PFS), Outcome 1 PFS ‐ all ‐ same recruitment period between the 2 arms (HD9). | ||||
| 2 PFS subgrouped by stage of disease Show forest plot | 4 | 2583 | Hazard Ratio (Fixed, 95% CI) | 0.53 [0.44, 0.64] |
| Analysis 2.2  Comparison 2 Analysis of progression‐free survival (PFS), Outcome 2 PFS subgrouped by stage of disease. | ||||
| 2.1 early unfavourable stage | 1 | 1623 | Hazard Ratio (Fixed, 95% CI) | 0.49 [0.34, 0.71] |
| 2.2 advanced stage | 3 | 960 | Hazard Ratio (Fixed, 95% CI) | 0.54 [0.43, 0.67] |
| 3 PFS subgrouped by treatment Show forest plot | 4 | 2583 | Hazard Ratio (Fixed, 95% CI) | 0.53 [0.44, 0.64] |
| Analysis 2.3  Comparison 2 Analysis of progression‐free survival (PFS), Outcome 3 PFS subgrouped by treatment. | ||||
| 3.1 only ABVD regimen | 3 | 2141 | Hazard Ratio (Fixed, 95% CI) | 0.54 [0.43, 0.67] |
| 3.2 ABVD including regimen | 1 | 442 | Hazard Ratio (Fixed, 95% CI) | 0.50 [0.34, 0.72] |
| 4 PFS subgrouped by number of cycles of escalated BEACOPP Show forest plot | 4 | 2583 | Hazard Ratio (Fixed, 95% CI) | 0.53 [0.44, 0.64] |
| Analysis 2.4  Comparison 2 Analysis of progression‐free survival (PFS), Outcome 4 PFS subgrouped by number of cycles of escalated BEACOPP. | ||||
| 4.1 eight cycles of escalated BEACOPP | 1 | 442 | Hazard Ratio (Fixed, 95% CI) | 0.50 [0.34, 0.72] |
| 4.2 four cycles of escalated BEACOPP | 2 | 518 | Hazard Ratio (Fixed, 95% CI) | 0.57 [0.43, 0.74] |
| 4.3 two cycles of escalated BEACOPP | 1 | 1623 | Hazard Ratio (Fixed, 95% CI) | 0.49 [0.34, 0.71] |
| 5 PFS subgrouped by length of follow‐up Show forest plot | 4 | 2583 | Hazard Ratio (Fixed, 95% CI) | 0.53 [0.44, 0.64] |
| Analysis 2.5  Comparison 2 Analysis of progression‐free survival (PFS), Outcome 5 PFS subgrouped by length of follow‐up. | ||||
| 5.1 short term follow‐up (median length up to 5 years) | 3 | 2141 | Hazard Ratio (Fixed, 95% CI) | 0.54 [0.43, 0.67] |
| 5.2 long term follow‐up (median length 10 years) | 1 | 442 | Hazard Ratio (Fixed, 95% CI) | 0.50 [0.34, 0.72] |
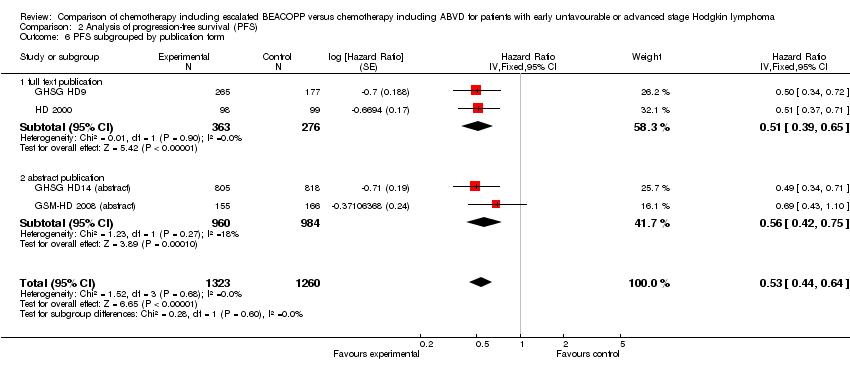
| 6 PFS subgrouped by publication form Show forest plot | 4 | 2583 | Hazard Ratio (Fixed, 95% CI) | 0.53 [0.44, 0.64] |
| Analysis 2.6  Comparison 2 Analysis of progression‐free survival (PFS), Outcome 6 PFS subgrouped by publication form. | ||||
| 6.1 full text publication | 2 | 639 | Hazard Ratio (Fixed, 95% CI) | 0.51 [0.39, 0.65] |
| 6.2 abstract publication | 2 | 1944 | Hazard Ratio (Fixed, 95% CI) | 0.56 [0.42, 0.75] |
| 7 PFS subgrouped by type of results Show forest plot | 4 | 2583 | Hazard Ratio (Fixed, 95% CI) | 0.53 [0.44, 0.64] |
| Analysis 2.7  Comparison 2 Analysis of progression‐free survival (PFS), Outcome 7 PFS subgrouped by type of results. | ||||
| 7.1 preliminary results | 2 | 1944 | Hazard Ratio (Fixed, 95% CI) | 0.56 [0.42, 0.75] |
| 7.2 mature results | 2 | 639 | Hazard Ratio (Fixed, 95% CI) | 0.51 [0.39, 0.65] |
| 8 PFS ‐ all recruited patients (HD9) with potential risk of bias due to different time periods of recruitment Show forest plot | 4 | Hazard Ratio (Fixed, 95% CI) | 0.48 [0.40, 0.58] | |
| Analysis 2.8  Comparison 2 Analysis of progression‐free survival (PFS), Outcome 8 PFS ‐ all recruited patients (HD9) with potential risk of bias due to different time periods of recruitment. | ||||
| Outcome or subgroup title | No. of studies | No. of participants | Statistical method | Effect size |
| 1 CR Show forest plot | 3 | 1245 | Risk Ratio (M‐H, Fixed, 95% CI) | 1.11 [1.06, 1.16] |
| Analysis 3.1  Comparison 3 Analysis of complete response (CR) rate, Outcome 1 CR. | ||||
| 2 CR subgrouped by treatment Show forest plot | 3 | 1245 | Risk Ratio (M‐H, Fixed, 95% CI) | 1.11 [1.06, 1.16] |
| Analysis 3.2  Comparison 3 Analysis of complete response (CR) rate, Outcome 2 CR subgrouped by treatment. | ||||
| 2.1 only ABVD regimen | 2 | 518 | Risk Ratio (M‐H, Fixed, 95% CI) | 1.08 [1.00, 1.16] |
| 2.2 ABVD including regimen | 1 | 727 | Risk Ratio (M‐H, Fixed, 95% CI) | 1.13 [1.07, 1.19] |
| 3 CR subgrouped by number of cycles of escalated BEACOPP Show forest plot | 3 | 1245 | Risk Ratio (M‐H, Fixed, 95% CI) | 1.11 [1.06, 1.16] |
| Analysis 3.3  Comparison 3 Analysis of complete response (CR) rate, Outcome 3 CR subgrouped by number of cycles of escalated BEACOPP. | ||||
| 3.1 eight cycles of escalated BEACOPP | 1 | 727 | Risk Ratio (M‐H, Fixed, 95% CI) | 1.13 [1.07, 1.19] |
| 3.2 four cycles of escalated BEACOPP | 2 | 518 | Risk Ratio (M‐H, Fixed, 95% CI) | 1.08 [1.00, 1.16] |
| 4 CR subgrouped by length of follow‐up Show forest plot | 3 | 1245 | Risk Ratio (M‐H, Fixed, 95% CI) | 1.11 [1.06, 1.16] |
| Analysis 3.4  Comparison 3 Analysis of complete response (CR) rate, Outcome 4 CR subgrouped by length of follow‐up. | ||||
| 4.1 short term follow‐up (median length up to 5 years) | 2 | 518 | Risk Ratio (M‐H, Fixed, 95% CI) | 1.08 [1.00, 1.16] |
| 4.2 long term follow‐up (median length 10 years) | 1 | 727 | Risk Ratio (M‐H, Fixed, 95% CI) | 1.13 [1.07, 1.19] |
| 5 CR subgrouped by publication form Show forest plot | 3 | 1245 | Risk Ratio (M‐H, Fixed, 95% CI) | 1.11 [1.06, 1.16] |
| Analysis 3.5  Comparison 3 Analysis of complete response (CR) rate, Outcome 5 CR subgrouped by publication form. | ||||
| 5.1 full text publication | 2 | 924 | Risk Ratio (M‐H, Fixed, 95% CI) | 1.12 [1.07, 1.18] |
| 5.2 abstract publication | 1 | 321 | Risk Ratio (M‐H, Fixed, 95% CI) | 1.07 [0.97, 1.19] |
| Outcome or subgroup title | No. of studies | No. of participants | Statistical method | Effect size |
| 1 Freedom from first progression Show forest plot | 1 | 321 | Hazard Ratio (Fixed, 95% CI) | 0.51 [0.31, 0.85] |
| Analysis 4.1  Comparison 4 Analysis of freedom from first progression, Outcome 1 Freedom from first progression. | ||||
| Outcome or subgroup title | No. of studies | No. of participants | Statistical method | Effect size |
| 1 Treatment‐related mortality Show forest plot | 1 | 197 | Risk Ratio (M‐H, Fixed, 95% CI) | 5.05 [0.25, 103.87] |
| Analysis 5.1  Comparison 5 Analysis of treatment‐related mortality, Outcome 1 Treatment‐related mortality. | ||||
| Outcome or subgroup title | No. of studies | No. of participants | Statistical method | Effect size |
| 1 Secondary malignancies Show forest plot | 3 | 2547 | Risk Ratio (M‐H, Fixed, 95% CI) | 0.95 [0.61, 1.48] |
| Analysis 6.1  Comparison 6 Analysis of secondary malignancies, Outcome 1 Secondary malignancies. | ||||
| 2 Secondary malignancies subgrouped by stage of disease Show forest plot | 3 | 2547 | Risk Ratio (M‐H, Fixed, 95% CI) | 0.95 [0.61, 1.48] |
| Analysis 6.2  Comparison 6 Analysis of secondary malignancies, Outcome 2 Secondary malignancies subgrouped by stage of disease. | ||||
| 2.1 early unfavourable stage | 1 | 1623 | Risk Ratio (M‐H, Fixed, 95% CI) | 0.86 [0.44, 1.65] |
| 2.2 advanced stage | 2 | 924 | Risk Ratio (M‐H, Fixed, 95% CI) | 1.04 [0.58, 1.89] |
| 3 Subgrouped by treatment Show forest plot | 3 | 2547 | Risk Ratio (M‐H, Fixed, 95% CI) | 0.95 [0.61, 1.48] |
| Analysis 6.3  Comparison 6 Analysis of secondary malignancies, Outcome 3 Subgrouped by treatment. | ||||
| 3.1 only ABVD regimen | 2 | 1820 | Risk Ratio (M‐H, Fixed, 95% CI) | 0.86 [0.46, 1.64] |
| 3.2 ABVD including regimen | 1 | 727 | Risk Ratio (M‐H, Fixed, 95% CI) | 1.05 [0.57, 1.92] |
| 4 Subgrouped by number of cycles of escalated BEACOPP Show forest plot | 3 | 2547 | Risk Ratio (M‐H, Fixed, 95% CI) | 0.95 [0.61, 1.48] |
| Analysis 6.4  Comparison 6 Analysis of secondary malignancies, Outcome 4 Subgrouped by number of cycles of escalated BEACOPP. | ||||
| 4.1 eight cycles of escalated BEACOPP | 1 | 727 | Risk Ratio (M‐H, Fixed, 95% CI) | 1.05 [0.57, 1.92] |
| 4.2 four cycles of escalated BEACOPP | 1 | 197 | Risk Ratio (M‐H, Fixed, 95% CI) | 1.01 [0.06, 15.92] |
| 4.3 two cycles of escalated BEACOPP | 1 | 1623 | Risk Ratio (M‐H, Fixed, 95% CI) | 0.86 [0.44, 1.65] |
| 5 Subgrouped by length of follow‐up Show forest plot | 3 | 2547 | Risk Ratio (M‐H, Fixed, 95% CI) | 0.95 [0.61, 1.48] |
| Analysis 6.5  Comparison 6 Analysis of secondary malignancies, Outcome 5 Subgrouped by length of follow‐up. | ||||
| 5.1 short term follow‐up (median length up to 5 years) | 2 | 1820 | Risk Ratio (M‐H, Fixed, 95% CI) | 0.86 [0.46, 1.64] |
| 5.2 long term follow‐up (median length 10 years) | 1 | 727 | Risk Ratio (M‐H, Fixed, 95% CI) | 1.05 [0.57, 1.92] |
| 6 Subgrouped by publication form Show forest plot | 3 | 2547 | Risk Ratio (M‐H, Fixed, 95% CI) | 0.95 [0.61, 1.48] |
| Analysis 6.6  Comparison 6 Analysis of secondary malignancies, Outcome 6 Subgrouped by publication form. | ||||
| 6.1 full text publication | 2 | 924 | Risk Ratio (M‐H, Fixed, 95% CI) | 1.04 [0.58, 1.89] |
| 6.2 abstract publication | 1 | 1623 | Risk Ratio (M‐H, Fixed, 95% CI) | 0.86 [0.44, 1.65] |
| 7 Subgrouped by type of results Show forest plot | 3 | 2547 | Risk Ratio (M‐H, Fixed, 95% CI) | 0.95 [0.61, 1.48] |
| Analysis 6.7  Comparison 6 Analysis of secondary malignancies, Outcome 7 Subgrouped by type of results. | ||||
| 7.1 preliminary results | 1 | 1623 | Risk Ratio (M‐H, Fixed, 95% CI) | 0.86 [0.44, 1.65] |
| 7.2 mature results | 2 | 924 | Risk Ratio (M‐H, Fixed, 95% CI) | 1.04 [0.58, 1.89] |
| Outcome or subgroup title | No. of studies | No. of participants | Statistical method | Effect size |
| 1 AML or MDS Show forest plot | 2 | 924 | Risk Ratio (M‐H, Fixed, 95% CI) | 7.84 [1.04, 59.29] |
| Analysis 7.1  Comparison 7 Analysis of AML or MDS, Outcome 1 AML or MDS. | ||||
| Outcome or subgroup title | No. of studies | No. of participants | Statistical method | Effect size |
| 1 Secondary amenorrhoea Show forest plot | 1 | 106 | Risk Ratio (M‐H, Fixed, 95% CI) | 1.37 [0.83, 2.26] |
| Analysis 8.1  Comparison 8 Analysis of fertility, Outcome 1 Secondary amenorrhoea. | ||||
| Outcome or subgroup title | No. of studies | No. of participants | Statistical method | Effect size |
| 1 Anaemia Show forest plot | 3 | 2547 | Risk Ratio (M‐H, Fixed, 95% CI) | 10.47 [7.06, 15.54] |
| Analysis 9.1  Comparison 9 Analysis of anaemia, Outcome 1 Anaemia. | ||||
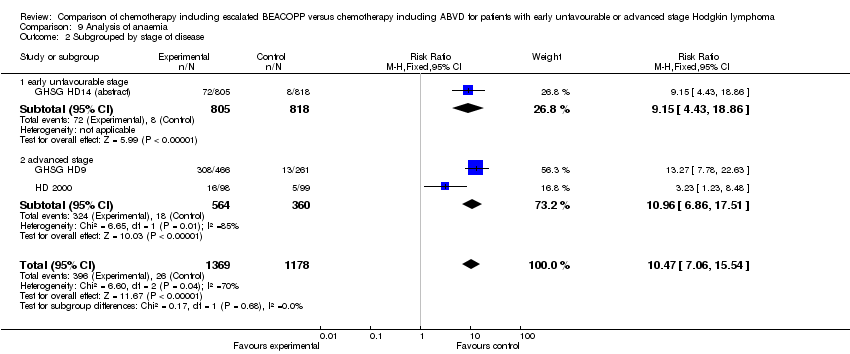
| 2 Subgrouped by stage of disease Show forest plot | 3 | 2547 | Risk Ratio (M‐H, Fixed, 95% CI) | 10.47 [7.06, 15.54] |
| Analysis 9.2  Comparison 9 Analysis of anaemia, Outcome 2 Subgrouped by stage of disease. | ||||
| 2.1 early unfavourable stage | 1 | 1623 | Risk Ratio (M‐H, Fixed, 95% CI) | 9.15 [4.43, 18.86] |
| 2.2 advanced stage | 2 | 924 | Risk Ratio (M‐H, Fixed, 95% CI) | 10.96 [6.86, 17.51] |
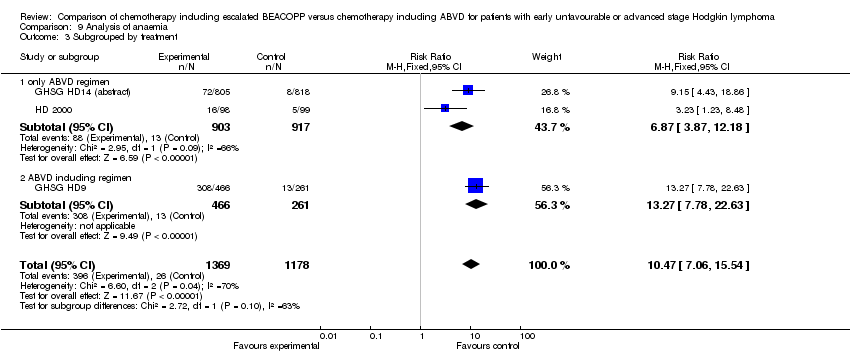
| 3 Subgrouped by treatment Show forest plot | 3 | 2547 | Risk Ratio (M‐H, Fixed, 95% CI) | 10.47 [7.06, 15.54] |
| Analysis 9.3  Comparison 9 Analysis of anaemia, Outcome 3 Subgrouped by treatment. | ||||
| 3.1 only ABVD regimen | 2 | 1820 | Risk Ratio (M‐H, Fixed, 95% CI) | 6.87 [3.87, 12.18] |
| 3.2 ABVD including regimen | 1 | 727 | Risk Ratio (M‐H, Fixed, 95% CI) | 13.27 [7.78, 22.63] |
| 4 Subgrouped by number of cycles of escalated BEACOPP Show forest plot | 3 | 2547 | Risk Ratio (M‐H, Fixed, 95% CI) | 10.47 [7.06, 15.54] |
| Analysis 9.4  Comparison 9 Analysis of anaemia, Outcome 4 Subgrouped by number of cycles of escalated BEACOPP. | ||||
| 4.1 eight cycles of escalated BEACOPP | 1 | 727 | Risk Ratio (M‐H, Fixed, 95% CI) | 13.27 [7.78, 22.63] |
| 4.2 four cycles of escalated BEACOPP | 1 | 197 | Risk Ratio (M‐H, Fixed, 95% CI) | 3.23 [1.23, 8.48] |
| 4.3 two cycles of escalated BEACOPP | 1 | 1623 | Risk Ratio (M‐H, Fixed, 95% CI) | 9.15 [4.43, 18.86] |
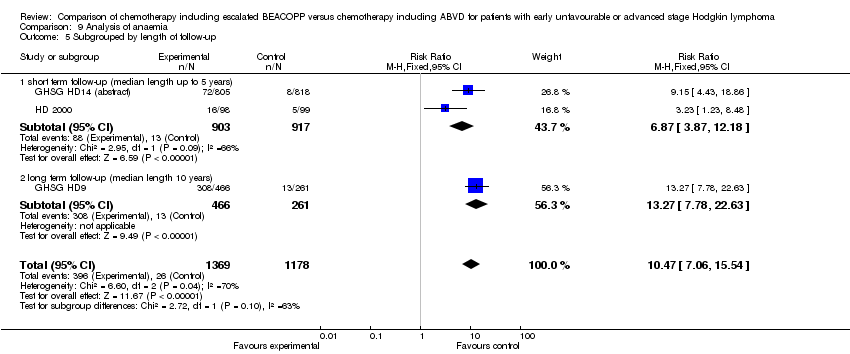
| 5 Subgrouped by length of follow‐up Show forest plot | 3 | 2547 | Risk Ratio (M‐H, Fixed, 95% CI) | 10.47 [7.06, 15.54] |
| Analysis 9.5  Comparison 9 Analysis of anaemia, Outcome 5 Subgrouped by length of follow‐up. | ||||
| 5.1 short term follow‐up (median length up to 5 years) | 2 | 1820 | Risk Ratio (M‐H, Fixed, 95% CI) | 6.87 [3.87, 12.18] |
| 5.2 long term follow‐up (median length 10 years) | 1 | 727 | Risk Ratio (M‐H, Fixed, 95% CI) | 13.27 [7.78, 22.63] |
| 6 Subgrouped by publication form Show forest plot | 3 | 2547 | Risk Ratio (M‐H, Fixed, 95% CI) | 10.47 [7.06, 15.54] |
| Analysis 9.6  Comparison 9 Analysis of anaemia, Outcome 6 Subgrouped by publication form. | ||||
| 6.1 full text publication | 2 | 924 | Risk Ratio (M‐H, Fixed, 95% CI) | 10.96 [6.86, 17.51] |
| 6.2 abstract publication | 1 | 1623 | Risk Ratio (M‐H, Fixed, 95% CI) | 9.15 [4.43, 18.86] |
| 7 Subgrouped by type of results Show forest plot | 3 | 2547 | Risk Ratio (M‐H, Fixed, 95% CI) | 10.47 [7.06, 15.54] |
| Analysis 9.7  Comparison 9 Analysis of anaemia, Outcome 7 Subgrouped by type of results. | ||||
| 7.1 preliminary results | 1 | 1623 | Risk Ratio (M‐H, Fixed, 95% CI) | 9.15 [4.43, 18.86] |
| 7.2 mature results | 2 | 924 | Risk Ratio (M‐H, Fixed, 95% CI) | 10.96 [6.86, 17.51] |
| Outcome or subgroup title | No. of studies | No. of participants | Statistical method | Effect size |
| 1 Infection Show forest plot | 3 | 2547 | Risk Ratio (M‐H, Fixed, 95% CI) | 3.67 [2.57, 5.24] |
| Analysis 10.1  Comparison 10 Analysis of infection, Outcome 1 Infection. | ||||
| 2 Subgrouped by stage of disease Show forest plot | 3 | 2547 | Risk Ratio (M‐H, Fixed, 95% CI) | 3.67 [2.57, 5.24] |
| Analysis 10.2  Comparison 10 Analysis of infection, Outcome 2 Subgrouped by stage of disease. | ||||
| 2.1 early unfavourable stage | 1 | 1623 | Risk Ratio (M‐H, Fixed, 95% CI) | 2.14 [1.38, 3.32] |
| 2.2 advanced stage | 2 | 924 | Risk Ratio (M‐H, Fixed, 95% CI) | 7.13 [3.78, 13.45] |
| 3 Subgrouped by treatment Show forest plot | 3 | 2547 | Risk Ratio (M‐H, Fixed, 95% CI) | 3.67 [2.57, 5.24] |
| Analysis 10.3  Comparison 10 Analysis of infection, Outcome 3 Subgrouped by treatment. | ||||
| 3.1 only ABVD regimen | 2 | 1820 | Risk Ratio (M‐H, Fixed, 95% CI) | 2.47 [1.63, 3.74] |
| 3.2 ABVD including regimen | 1 | 727 | Risk Ratio (M‐H, Fixed, 95% CI) | 7.14 [3.53, 14.43] |
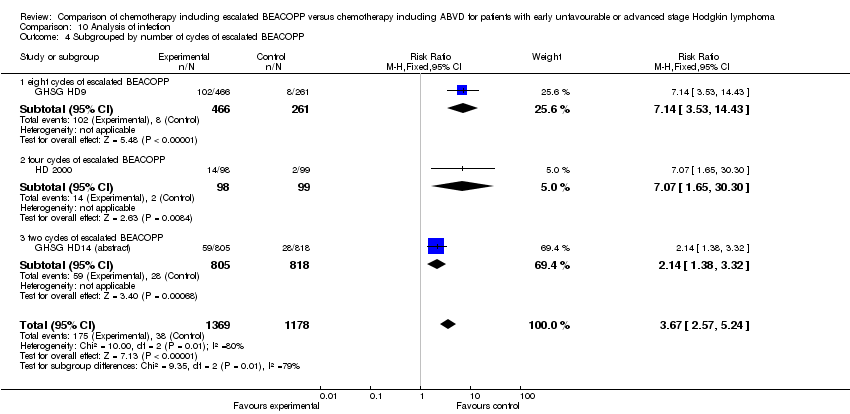
| 4 Subgrouped by number of cycles of escalated BEACOPP Show forest plot | 3 | 2547 | Risk Ratio (M‐H, Fixed, 95% CI) | 3.67 [2.57, 5.24] |
| Analysis 10.4  Comparison 10 Analysis of infection, Outcome 4 Subgrouped by number of cycles of escalated BEACOPP. | ||||
| 4.1 eight cycles of escalated BEACOPP | 1 | 727 | Risk Ratio (M‐H, Fixed, 95% CI) | 7.14 [3.53, 14.43] |
| 4.2 four cycles of escalated BEACOPP | 1 | 197 | Risk Ratio (M‐H, Fixed, 95% CI) | 7.07 [1.65, 30.30] |
| 4.3 two cycles of escalated BEACOPP | 1 | 1623 | Risk Ratio (M‐H, Fixed, 95% CI) | 2.14 [1.38, 3.32] |
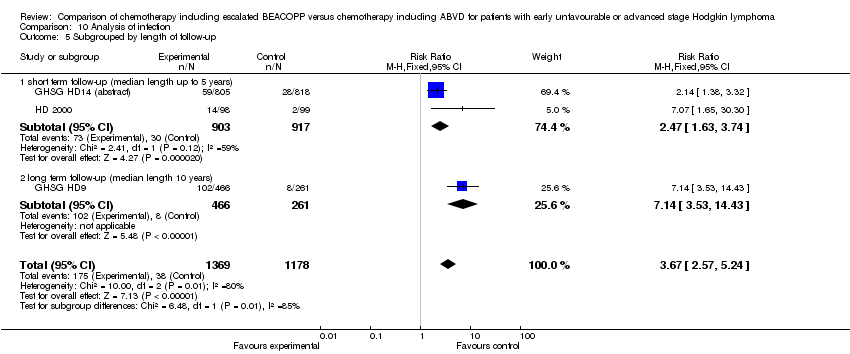
| 5 Subgrouped by length of follow‐up Show forest plot | 3 | 2547 | Risk Ratio (M‐H, Fixed, 95% CI) | 3.67 [2.57, 5.24] |
| Analysis 10.5  Comparison 10 Analysis of infection, Outcome 5 Subgrouped by length of follow‐up. | ||||
| 5.1 short term follow‐up (median length up to 5 years) | 2 | 1820 | Risk Ratio (M‐H, Fixed, 95% CI) | 2.47 [1.63, 3.74] |
| 5.2 long term follow‐up (median length 10 years) | 1 | 727 | Risk Ratio (M‐H, Fixed, 95% CI) | 7.14 [3.53, 14.43] |
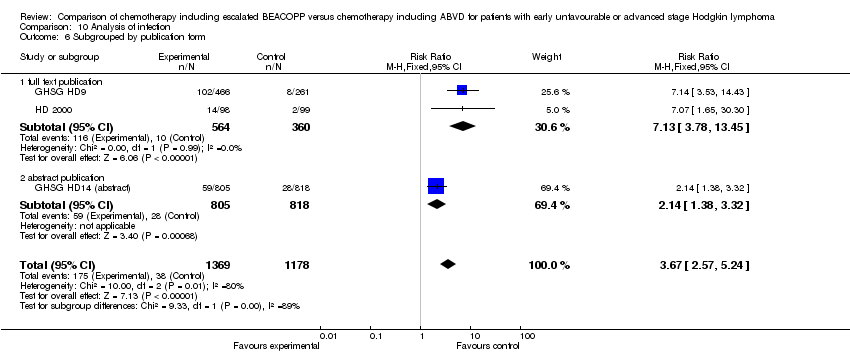
| 6 Subgrouped by publication form Show forest plot | 3 | 2547 | Risk Ratio (M‐H, Fixed, 95% CI) | 3.67 [2.57, 5.24] |
| Analysis 10.6  Comparison 10 Analysis of infection, Outcome 6 Subgrouped by publication form. | ||||
| 6.1 full text publication | 2 | 924 | Risk Ratio (M‐H, Fixed, 95% CI) | 7.13 [3.78, 13.45] |
| 6.2 abstract publication | 1 | 1623 | Risk Ratio (M‐H, Fixed, 95% CI) | 2.14 [1.38, 3.32] |
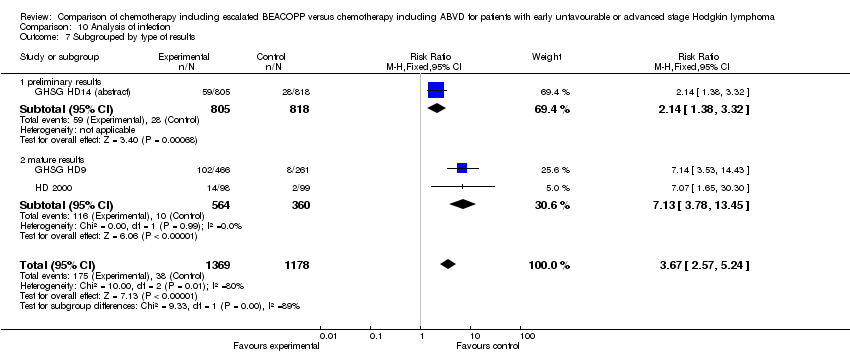
| 7 Subgrouped by type of results Show forest plot | 3 | 2547 | Risk Ratio (M‐H, Fixed, 95% CI) | 3.67 [2.57, 5.24] |
| Analysis 10.7  Comparison 10 Analysis of infection, Outcome 7 Subgrouped by type of results. | ||||
| 7.1 preliminary results | 1 | 1623 | Risk Ratio (M‐H, Fixed, 95% CI) | 2.14 [1.38, 3.32] |
| 7.2 mature results | 2 | 924 | Risk Ratio (M‐H, Fixed, 95% CI) | 7.13 [3.78, 13.45] |
| Outcome or subgroup title | No. of studies | No. of participants | Statistical method | Effect size |
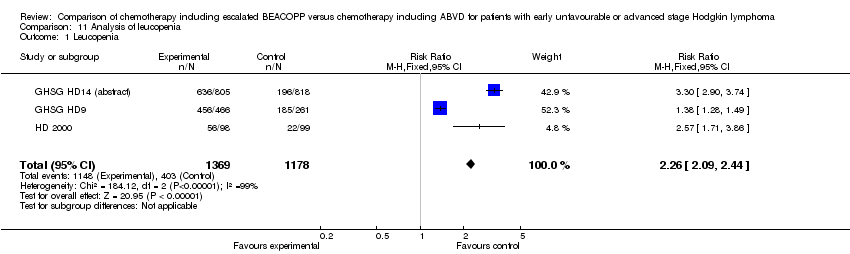
| 1 Leucopenia Show forest plot | 3 | 2547 | Risk Ratio (M‐H, Fixed, 95% CI) | 2.26 [2.09, 2.44] |
| Analysis 11.1  Comparison 11 Analysis of leucopenia, Outcome 1 Leucopenia. | ||||
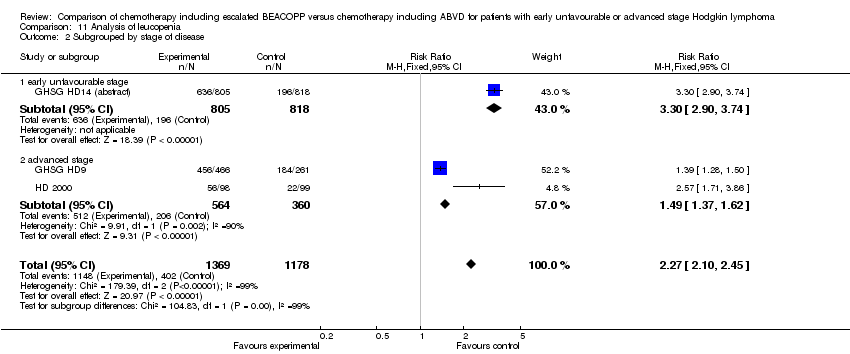
| 2 Subgrouped by stage of disease Show forest plot | 3 | 2547 | Risk Ratio (M‐H, Fixed, 95% CI) | 2.27 [2.10, 2.45] |
| Analysis 11.2  Comparison 11 Analysis of leucopenia, Outcome 2 Subgrouped by stage of disease. | ||||
| 2.1 early unfavourable stage | 1 | 1623 | Risk Ratio (M‐H, Fixed, 95% CI) | 3.30 [2.90, 3.74] |
| 2.2 advanced stage | 2 | 924 | Risk Ratio (M‐H, Fixed, 95% CI) | 1.49 [1.37, 1.62] |
| 3 Subgrouped by treatment Show forest plot | 3 | 2547 | Risk Ratio (M‐H, Fixed, 95% CI) | 2.27 [2.10, 2.45] |
| Analysis 11.3  Comparison 11 Analysis of leucopenia, Outcome 3 Subgrouped by treatment. | ||||
| 3.1 only ABVD regimen | 2 | 1820 | Risk Ratio (M‐H, Fixed, 95% CI) | 3.22 [2.86, 3.64] |
| 3.2 ABVD including regimen | 1 | 727 | Risk Ratio (M‐H, Fixed, 95% CI) | 1.39 [1.28, 1.50] |
| 4 Subgrouped by number of cycles of escalated BEACOPP Show forest plot | 3 | 2547 | Risk Ratio (M‐H, Fixed, 95% CI) | 2.27 [2.10, 2.45] |
| Analysis 11.4  Comparison 11 Analysis of leucopenia, Outcome 4 Subgrouped by number of cycles of escalated BEACOPP. | ||||
| 4.1 eight cycles of escalated BEACOPP | 1 | 727 | Risk Ratio (M‐H, Fixed, 95% CI) | 1.39 [1.28, 1.50] |
| 4.2 two cycles of escalated BEACOPP | 1 | 197 | Risk Ratio (M‐H, Fixed, 95% CI) | 2.57 [1.71, 3.86] |
| 4.3 two cycles of escalated BEACOPP | 1 | 1623 | Risk Ratio (M‐H, Fixed, 95% CI) | 3.30 [2.90, 3.74] |
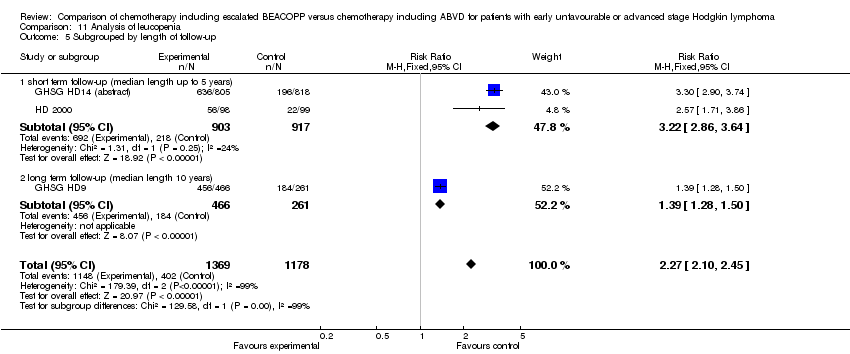
| 5 Subgrouped by length of follow‐up Show forest plot | 3 | 2547 | Risk Ratio (M‐H, Fixed, 95% CI) | 2.27 [2.10, 2.45] |
| Analysis 11.5  Comparison 11 Analysis of leucopenia, Outcome 5 Subgrouped by length of follow‐up. | ||||
| 5.1 short term follow‐up (median length up to 5 years) | 2 | 1820 | Risk Ratio (M‐H, Fixed, 95% CI) | 3.22 [2.86, 3.64] |
| 5.2 long term follow‐up (median length 10 years) | 1 | 727 | Risk Ratio (M‐H, Fixed, 95% CI) | 1.39 [1.28, 1.50] |
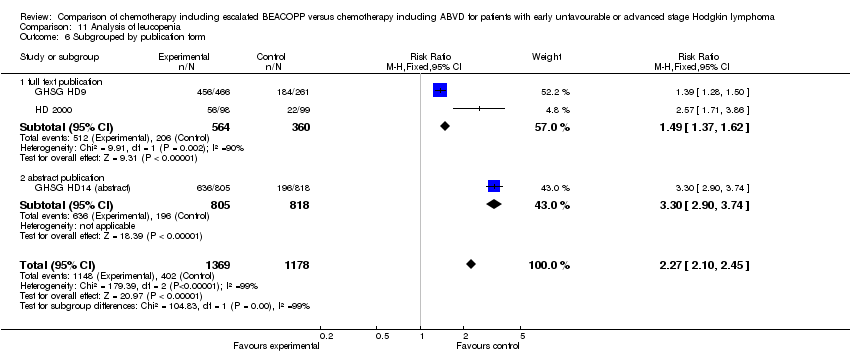
| 6 Subgrouped by publication form Show forest plot | 3 | 2547 | Risk Ratio (M‐H, Fixed, 95% CI) | 2.27 [2.10, 2.45] |
| Analysis 11.6  Comparison 11 Analysis of leucopenia, Outcome 6 Subgrouped by publication form. | ||||
| 6.1 full text publication | 2 | 924 | Risk Ratio (M‐H, Fixed, 95% CI) | 1.49 [1.37, 1.62] |
| 6.2 abstract publication | 1 | 1623 | Risk Ratio (M‐H, Fixed, 95% CI) | 3.30 [2.90, 3.74] |
| 7 Subgrouped by type of results Show forest plot | 3 | 2547 | Risk Ratio (M‐H, Fixed, 95% CI) | 2.27 [2.10, 2.45] |
| Analysis 11.7  Comparison 11 Analysis of leucopenia, Outcome 7 Subgrouped by type of results. | ||||
| 7.1 preliminary results | 1 | 1623 | Risk Ratio (M‐H, Fixed, 95% CI) | 3.30 [2.90, 3.74] |
| 7.2 mature results | 2 | 924 | Risk Ratio (M‐H, Fixed, 95% CI) | 1.49 [1.37, 1.62] |
| Outcome or subgroup title | No. of studies | No. of participants | Statistical method | Effect size |
| 1 Neutropenia Show forest plot | 1 | 197 | Risk Ratio (M‐H, Fixed, 95% CI) | 1.57 [1.13, 2.19] |
| Analysis 12.1  Comparison 12 Analysis of neutropenia, Outcome 1 Neutropenia. | ||||
| Outcome or subgroup title | No. of studies | No. of participants | Statistical method | Effect size |
| 1 Thrombocytopenia Show forest plot | 3 | 2547 | Risk Ratio (M‐H, Fixed, 95% CI) | 18.73 [12.17, 28.82] |
| Analysis 13.1  Comparison 13 Analysis of thrombocytopenia, Outcome 1 Thrombocytopenia. | ||||
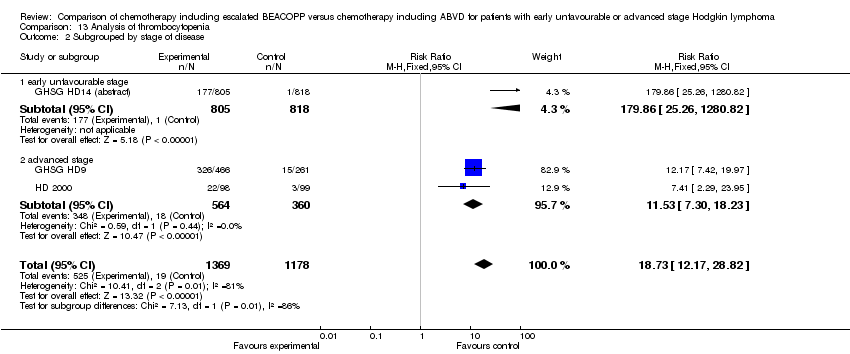
| 2 Subgrouped by stage of disease Show forest plot | 3 | 2547 | Risk Ratio (M‐H, Fixed, 95% CI) | 18.73 [12.17, 28.82] |
| Analysis 13.2  Comparison 13 Analysis of thrombocytopenia, Outcome 2 Subgrouped by stage of disease. | ||||
| 2.1 early unfavourable stage | 1 | 1623 | Risk Ratio (M‐H, Fixed, 95% CI) | 179.86 [25.26, 1280.82] |
| 2.2 advanced stage | 2 | 924 | Risk Ratio (M‐H, Fixed, 95% CI) | 11.53 [7.30, 18.23] |
| 3 Subgrouped by treatment Show forest plot | 3 | 2547 | Risk Ratio (M‐H, Fixed, 95% CI) | 18.73 [12.17, 28.82] |
| Analysis 13.3  Comparison 13 Analysis of thrombocytopenia, Outcome 3 Subgrouped by treatment. | ||||
| 3.1 only ABVD regimen | 2 | 1820 | Risk Ratio (M‐H, Fixed, 95% CI) | 50.43 [18.84, 134.96] |
| 3.2 ABVD including regimen | 1 | 727 | Risk Ratio (M‐H, Fixed, 95% CI) | 12.17 [7.42, 19.97] |
| 4 Subgrouped by number of cycles of escalated BEACOPP Show forest plot | 3 | 2547 | Risk Ratio (M‐H, Fixed, 95% CI) | 18.73 [12.17, 28.82] |
| Analysis 13.4  Comparison 13 Analysis of thrombocytopenia, Outcome 4 Subgrouped by number of cycles of escalated BEACOPP. | ||||
| 4.1 eight cycles of escalated BEACOPP | 1 | 727 | Risk Ratio (M‐H, Fixed, 95% CI) | 12.17 [7.42, 19.97] |
| 4.2 four cycles of escalated BEACOPP | 1 | 197 | Risk Ratio (M‐H, Fixed, 95% CI) | 7.41 [2.29, 23.95] |
| 4.3 two cycles of escalated BEACOPP | 1 | 1623 | Risk Ratio (M‐H, Fixed, 95% CI) | 179.86 [25.26, 1280.82] |
| 5 Subgrouped by length of follow‐up Show forest plot | 3 | 2547 | Risk Ratio (M‐H, Fixed, 95% CI) | 18.73 [12.17, 28.82] |
| Analysis 13.5  Comparison 13 Analysis of thrombocytopenia, Outcome 5 Subgrouped by length of follow‐up. | ||||
| 5.1 short term follow‐up (median length up to 5 years) | 2 | 1820 | Risk Ratio (M‐H, Fixed, 95% CI) | 50.43 [18.84, 134.96] |
| 5.2 long term follow‐up (median length 10 years) | 1 | 727 | Risk Ratio (M‐H, Fixed, 95% CI) | 12.17 [7.42, 19.97] |
| 6 Subgrouped by publication form Show forest plot | 3 | 2547 | Risk Ratio (M‐H, Fixed, 95% CI) | 18.73 [12.17, 28.82] |
| Analysis 13.6  Comparison 13 Analysis of thrombocytopenia, Outcome 6 Subgrouped by publication form. | ||||
| 6.1 full text publication | 2 | 924 | Risk Ratio (M‐H, Fixed, 95% CI) | 11.53 [7.30, 18.23] |
| 6.2 abstract publication | 1 | 1623 | Risk Ratio (M‐H, Fixed, 95% CI) | 179.86 [25.26, 1280.82] |
| 7 Subgrouped by type of results Show forest plot | 3 | 2547 | Risk Ratio (M‐H, Fixed, 95% CI) | 18.73 [12.17, 28.82] |
| Analysis 13.7  Comparison 13 Analysis of thrombocytopenia, Outcome 7 Subgrouped by type of results. | ||||
| 7.1 preliminary results | 1 | 1623 | Risk Ratio (M‐H, Fixed, 95% CI) | 179.86 [25.26, 1280.82] |
| 7.2 mature results | 2 | 924 | Risk Ratio (M‐H, Fixed, 95% CI) | 11.53 [7.30, 18.23] |
| Outcome or subgroup title | No. of studies | No. of participants | Statistical method | Effect size |
| 1 Alopecia Show forest plot | 3 | 2547 | Risk Ratio (M‐H, Fixed, 95% CI) | 1.97 [1.77, 2.19] |
| Analysis 14.1  Comparison 14 Analysis of alopecia, Outcome 1 Alopecia. | ||||
| 2 Subgrouped by stage of disease Show forest plot | 3 | 2547 | Risk Ratio (M‐H, Fixed, 95% CI) | 1.97 [1.77, 2.19] |
| Analysis 14.2  Comparison 14 Analysis of alopecia, Outcome 2 Subgrouped by stage of disease. | ||||
| 2.1 early unfavourable stage | 1 | 1623 | Risk Ratio (M‐H, Fixed, 95% CI) | 2.00 [1.74, 2.31] |
| 2.2 advanced stage | 2 | 924 | Risk Ratio (M‐H, Fixed, 95% CI) | 1.93 [1.65, 2.26] |
| 3 Subgrouped by treatment Show forest plot | 3 | 2547 | Risk Ratio (M‐H, Fixed, 95% CI) | 1.97 [1.77, 2.19] |
| Analysis 14.3  Comparison 14 Analysis of alopecia, Outcome 3 Subgrouped by treatment. | ||||
| 3.1 only ABVD regimen | 2 | 1820 | Risk Ratio (M‐H, Fixed, 95% CI) | 1.85 [1.62, 2.12] |
| 3.2 ABVD including regimen | 1 | 727 | Risk Ratio (M‐H, Fixed, 95% CI) | 2.19 [1.85, 2.59] |
| 4 Subgrouped by number of cycles of escalated BEACOPP Show forest plot | 3 | 2547 | Risk Ratio (M‐H, Fixed, 95% CI) | 1.97 [1.77, 2.19] |
| Analysis 14.4  Comparison 14 Analysis of alopecia, Outcome 4 Subgrouped by number of cycles of escalated BEACOPP. | ||||
| 4.1 eight cycles of escalated BEACOPP | 1 | 727 | Risk Ratio (M‐H, Fixed, 95% CI) | 2.19 [1.85, 2.59] |
| 4.2 four cycles of escalated BEACOPP | 1 | 197 | Risk Ratio (M‐H, Fixed, 95% CI) | 0.91 [0.59, 1.40] |
| 4.3 two cycles of escalated BEACOPP | 1 | 1623 | Risk Ratio (M‐H, Fixed, 95% CI) | 2.00 [1.74, 2.31] |
| 5 Subgrouped by length of follow‐up Show forest plot | 3 | 2547 | Risk Ratio (M‐H, Fixed, 95% CI) | 1.97 [1.77, 2.19] |
| Analysis 14.5  Comparison 14 Analysis of alopecia, Outcome 5 Subgrouped by length of follow‐up. | ||||
| 5.1 short term follow‐up (median length up to 5 years) | 2 | 1820 | Risk Ratio (M‐H, Fixed, 95% CI) | 1.85 [1.62, 2.12] |
| 5.2 long term follow‐up (median length 10 years) | 1 | 727 | Risk Ratio (M‐H, Fixed, 95% CI) | 2.19 [1.85, 2.59] |
| 6 Subgrouped by publication form Show forest plot | 3 | 2547 | Risk Ratio (M‐H, Fixed, 95% CI) | 1.97 [1.77, 2.19] |
| Analysis 14.6  Comparison 14 Analysis of alopecia, Outcome 6 Subgrouped by publication form. | ||||
| 6.1 full text publication | 2 | 924 | Risk Ratio (M‐H, Fixed, 95% CI) | 1.93 [1.65, 2.26] |
| 6.2 abstract publication | 1 | 1623 | Risk Ratio (M‐H, Fixed, 95% CI) | 2.00 [1.74, 2.31] |
| 7 Subgrouped by type of results Show forest plot | 3 | 2547 | Risk Ratio (M‐H, Fixed, 95% CI) | 1.97 [1.77, 2.19] |
| Analysis 14.7  Comparison 14 Analysis of alopecia, Outcome 7 Subgrouped by type of results. | ||||
| 7.1 preliminary results | 1 | 1623 | Risk Ratio (M‐H, Fixed, 95% CI) | 2.00 [1.74, 2.31] |
| 7.2 mature results | 2 | 924 | Risk Ratio (M‐H, Fixed, 95% CI) | 1.93 [1.65, 2.26] |
| Outcome or subgroup title | No. of studies | No. of participants | Statistical method | Effect size |
| 1 Constipation Show forest plot | 2 | 923 | Risk Ratio (M‐H, Fixed, 95% CI) | 1.19 [0.56, 2.55] |
| Analysis 15.1  Comparison 15 Analysis of constipation, Outcome 1 Constipation. | ||||
| Outcome or subgroup title | No. of studies | No. of participants | Statistical method | Effect size |
| 1 Mucositis Show forest plot | 2 | 924 | Risk Ratio (M‐H, Fixed, 95% CI) | 6.32 [2.25, 17.75] |
| Analysis 16.1  Comparison 16 Analysis of mucositis, Outcome 1 Mucositis. | ||||
| Outcome or subgroup title | No. of studies | No. of participants | Statistical method | Effect size |
| 1 Nausea/vomiting Show forest plot | 2 | 924 | Risk Ratio (M‐H, Fixed, 95% CI) | 0.94 [0.71, 1.25] |
| Analysis 17.1  Comparison 17 Analysis of nausea/vomiting, Outcome 1 Nausea/vomiting. | ||||
| Outcome or subgroup title | No. of studies | No. of participants | Statistical method | Effect size |
| 1 Neurologic Show forest plot | 2 | 924 | Risk Ratio (M‐H, Fixed, 95% CI) | 1.14 [0.55, 2.35] |
| Analysis 18.1  Comparison 18 Analysis of neurologic, Outcome 1 Neurologic. | ||||
| Outcome or subgroup title | No. of studies | No. of participants | Statistical method | Effect size |
| 1 Pain Show forest plot | 2 | 924 | Risk Ratio (M‐H, Fixed, 95% CI) | 4.88 [2.04, 11.66] |
| Analysis 19.1  Comparison 19 Analysis of pain, Outcome 1 Pain. | ||||
| Outcome or subgroup title | No. of studies | No. of participants | Statistical method | Effect size |
| 1 Respiratory Show forest plot | 1 | 726 | Risk Ratio (M‐H, Fixed, 95% CI) | 2.12 [0.80, 5.61] |
| Analysis 20.1  Comparison 20 Analysis of respiratory, Outcome 1 Respiratory. | ||||
| Outcome or subgroup title | No. of studies | No. of participants | Statistical method | Effect size |
| 1 Skin Show forest plot | 1 | 726 | Risk Ratio (M‐H, Fixed, 95% CI) | 2.60 [0.76, 8.98] |
| Analysis 21.1  Comparison 21 Analysis of skin, Outcome 1 Skin. | ||||

Study flow diagram.

Forest plot of comparison: 1 Analysis of Overall Survival, outcome: 1.1 OS ‐ all ‐ same recruitment period between the 2 arms (HD9).

Forest plot of comparison: 2 Analysis of Progression Free Survival, outcome: 2.1 PFS ‐ all ‐ same recruitment period between the 2 arms (HD9).
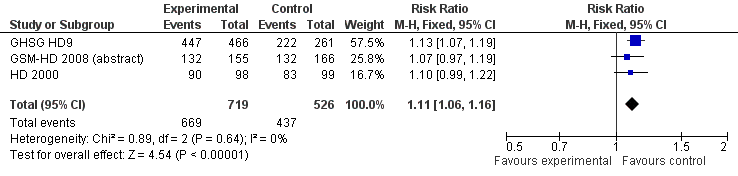
Forest plot of comparison: 3 Analysis of complete response (CR) rate, outcome: 3.1 CR.

Comparison 1 Analysis overall survival, Outcome 1 OS ‐ all ‐ same recruitment period between the 2 arms (HD9).

Comparison 1 Analysis overall survival, Outcome 2 OS subgrouped by stage of disease.
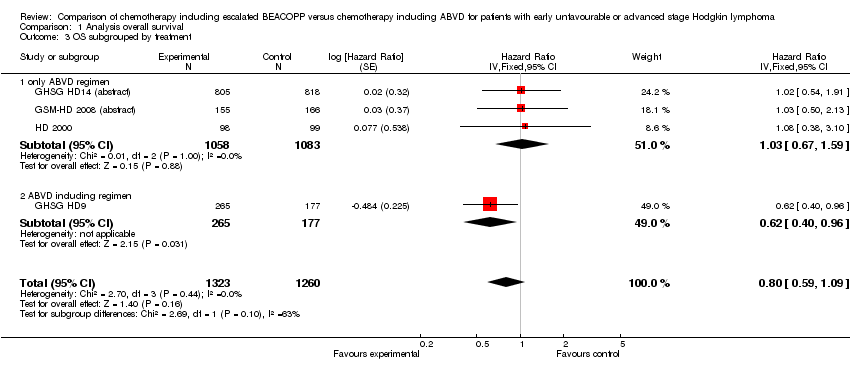
Comparison 1 Analysis overall survival, Outcome 3 OS subgrouped by treatment.

Comparison 1 Analysis overall survival, Outcome 4 OS subgrouped by number of cycles of escalated BEACOPP.

Comparison 1 Analysis overall survival, Outcome 5 OS subgrouped by length of follow‐up.
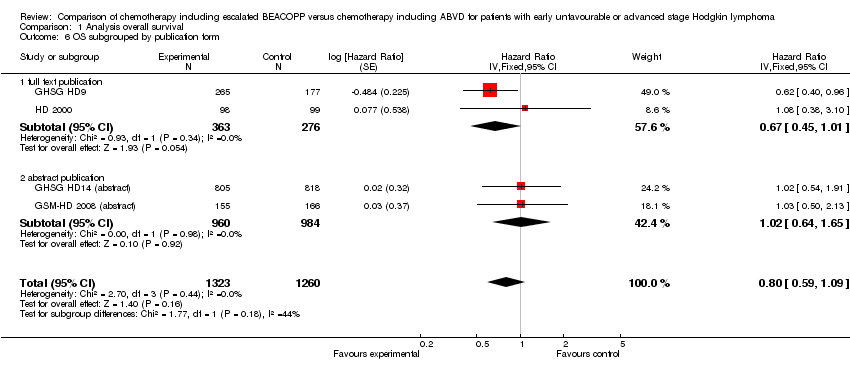
Comparison 1 Analysis overall survival, Outcome 6 OS subgrouped by publication form.

Comparison 1 Analysis overall survival, Outcome 7 OS subgrouped by type of results.

Comparison 1 Analysis overall survival, Outcome 8 OS ‐ all recruited patients (HD9) with potential risk of bias due to different time periods of recruitment.

Comparison 2 Analysis of progression‐free survival (PFS), Outcome 1 PFS ‐ all ‐ same recruitment period between the 2 arms (HD9).

Comparison 2 Analysis of progression‐free survival (PFS), Outcome 2 PFS subgrouped by stage of disease.

Comparison 2 Analysis of progression‐free survival (PFS), Outcome 3 PFS subgrouped by treatment.

Comparison 2 Analysis of progression‐free survival (PFS), Outcome 4 PFS subgrouped by number of cycles of escalated BEACOPP.
Comparison 2 Analysis of progression‐free survival (PFS), Outcome 5 PFS subgrouped by length of follow‐up.
Comparison 2 Analysis of progression‐free survival (PFS), Outcome 6 PFS subgrouped by publication form.
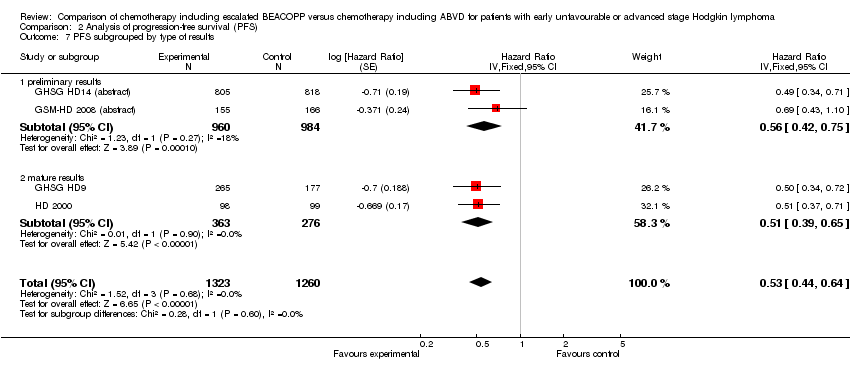
Comparison 2 Analysis of progression‐free survival (PFS), Outcome 7 PFS subgrouped by type of results.
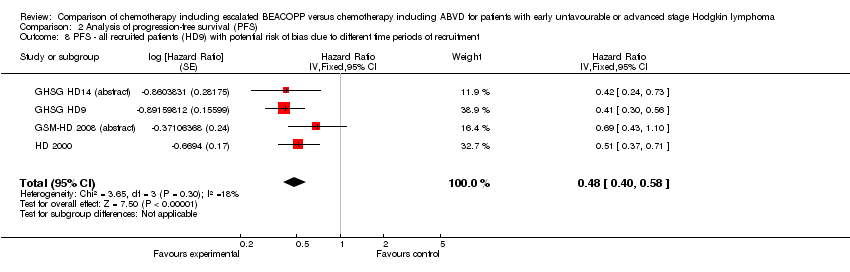
Comparison 2 Analysis of progression‐free survival (PFS), Outcome 8 PFS ‐ all recruited patients (HD9) with potential risk of bias due to different time periods of recruitment.

Comparison 3 Analysis of complete response (CR) rate, Outcome 1 CR.

Comparison 3 Analysis of complete response (CR) rate, Outcome 2 CR subgrouped by treatment.

Comparison 3 Analysis of complete response (CR) rate, Outcome 3 CR subgrouped by number of cycles of escalated BEACOPP.
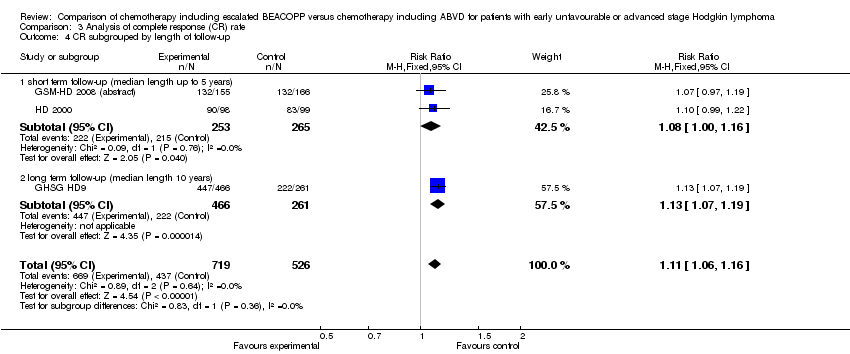
Comparison 3 Analysis of complete response (CR) rate, Outcome 4 CR subgrouped by length of follow‐up.

Comparison 3 Analysis of complete response (CR) rate, Outcome 5 CR subgrouped by publication form.

Comparison 4 Analysis of freedom from first progression, Outcome 1 Freedom from first progression.
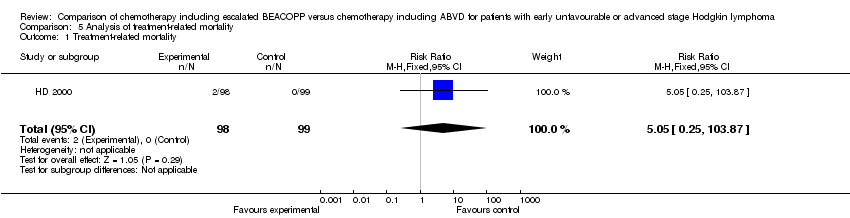
Comparison 5 Analysis of treatment‐related mortality, Outcome 1 Treatment‐related mortality.

Comparison 6 Analysis of secondary malignancies, Outcome 1 Secondary malignancies.

Comparison 6 Analysis of secondary malignancies, Outcome 2 Secondary malignancies subgrouped by stage of disease.
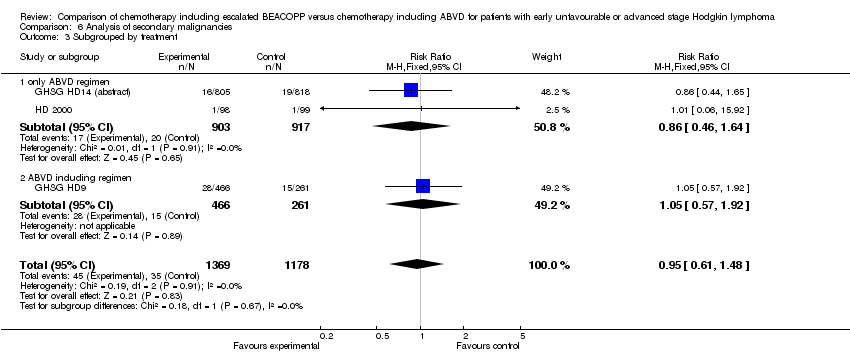
Comparison 6 Analysis of secondary malignancies, Outcome 3 Subgrouped by treatment.

Comparison 6 Analysis of secondary malignancies, Outcome 4 Subgrouped by number of cycles of escalated BEACOPP.

Comparison 6 Analysis of secondary malignancies, Outcome 5 Subgrouped by length of follow‐up.
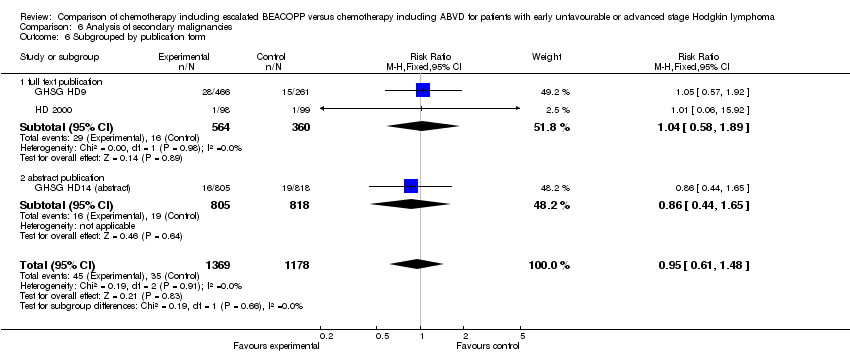
Comparison 6 Analysis of secondary malignancies, Outcome 6 Subgrouped by publication form.

Comparison 6 Analysis of secondary malignancies, Outcome 7 Subgrouped by type of results.
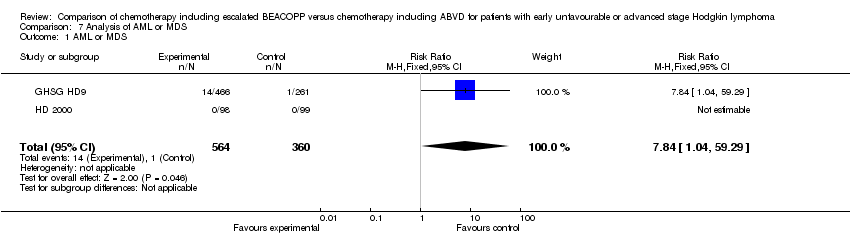
Comparison 7 Analysis of AML or MDS, Outcome 1 AML or MDS.

Comparison 8 Analysis of fertility, Outcome 1 Secondary amenorrhoea.

Comparison 9 Analysis of anaemia, Outcome 1 Anaemia.
Comparison 9 Analysis of anaemia, Outcome 2 Subgrouped by stage of disease.
Comparison 9 Analysis of anaemia, Outcome 3 Subgrouped by treatment.

Comparison 9 Analysis of anaemia, Outcome 4 Subgrouped by number of cycles of escalated BEACOPP.
Comparison 9 Analysis of anaemia, Outcome 5 Subgrouped by length of follow‐up.

Comparison 9 Analysis of anaemia, Outcome 6 Subgrouped by publication form.

Comparison 9 Analysis of anaemia, Outcome 7 Subgrouped by type of results.

Comparison 10 Analysis of infection, Outcome 1 Infection.

Comparison 10 Analysis of infection, Outcome 2 Subgrouped by stage of disease.

Comparison 10 Analysis of infection, Outcome 3 Subgrouped by treatment.
Comparison 10 Analysis of infection, Outcome 4 Subgrouped by number of cycles of escalated BEACOPP.
Comparison 10 Analysis of infection, Outcome 5 Subgrouped by length of follow‐up.
Comparison 10 Analysis of infection, Outcome 6 Subgrouped by publication form.
Comparison 10 Analysis of infection, Outcome 7 Subgrouped by type of results.
Comparison 11 Analysis of leucopenia, Outcome 1 Leucopenia.
Comparison 11 Analysis of leucopenia, Outcome 2 Subgrouped by stage of disease.

Comparison 11 Analysis of leucopenia, Outcome 3 Subgrouped by treatment.

Comparison 11 Analysis of leucopenia, Outcome 4 Subgrouped by number of cycles of escalated BEACOPP.
Comparison 11 Analysis of leucopenia, Outcome 5 Subgrouped by length of follow‐up.
Comparison 11 Analysis of leucopenia, Outcome 6 Subgrouped by publication form.

Comparison 11 Analysis of leucopenia, Outcome 7 Subgrouped by type of results.

Comparison 12 Analysis of neutropenia, Outcome 1 Neutropenia.

Comparison 13 Analysis of thrombocytopenia, Outcome 1 Thrombocytopenia.
Comparison 13 Analysis of thrombocytopenia, Outcome 2 Subgrouped by stage of disease.

Comparison 13 Analysis of thrombocytopenia, Outcome 3 Subgrouped by treatment.

Comparison 13 Analysis of thrombocytopenia, Outcome 4 Subgrouped by number of cycles of escalated BEACOPP.

Comparison 13 Analysis of thrombocytopenia, Outcome 5 Subgrouped by length of follow‐up.

Comparison 13 Analysis of thrombocytopenia, Outcome 6 Subgrouped by publication form.

Comparison 13 Analysis of thrombocytopenia, Outcome 7 Subgrouped by type of results.
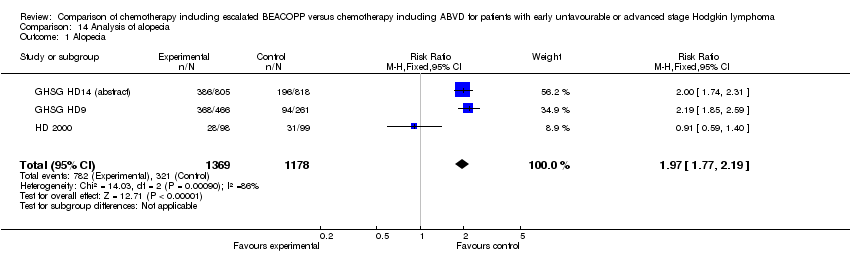
Comparison 14 Analysis of alopecia, Outcome 1 Alopecia.
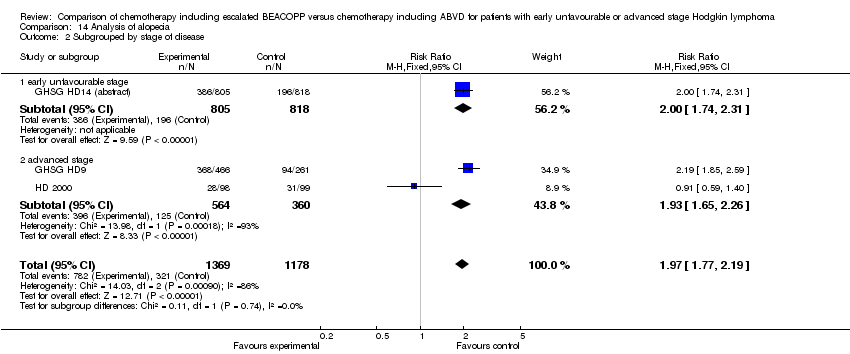
Comparison 14 Analysis of alopecia, Outcome 2 Subgrouped by stage of disease.
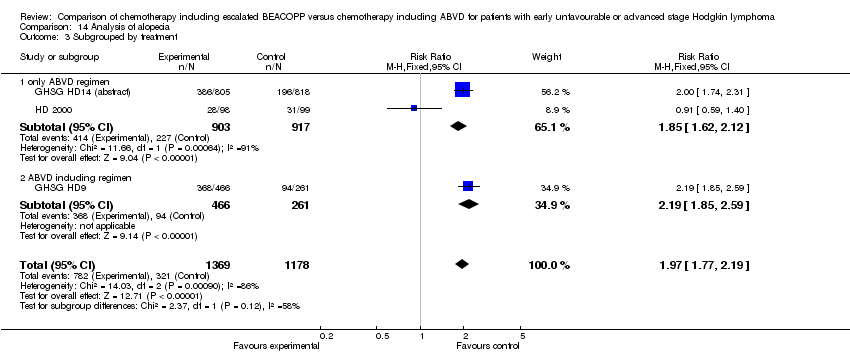
Comparison 14 Analysis of alopecia, Outcome 3 Subgrouped by treatment.

Comparison 14 Analysis of alopecia, Outcome 4 Subgrouped by number of cycles of escalated BEACOPP.

Comparison 14 Analysis of alopecia, Outcome 5 Subgrouped by length of follow‐up.
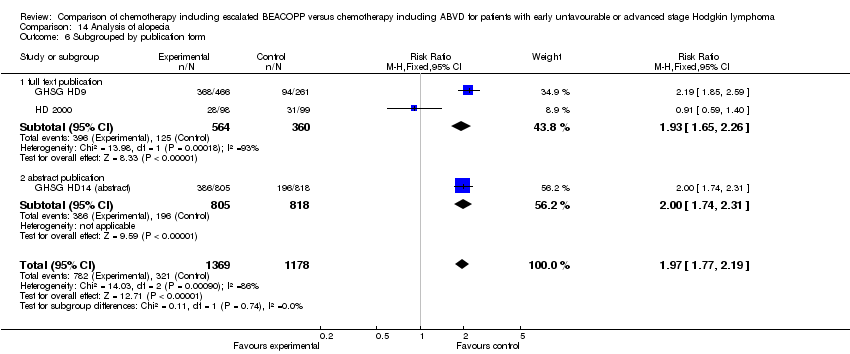
Comparison 14 Analysis of alopecia, Outcome 6 Subgrouped by publication form.

Comparison 14 Analysis of alopecia, Outcome 7 Subgrouped by type of results.

Comparison 15 Analysis of constipation, Outcome 1 Constipation.
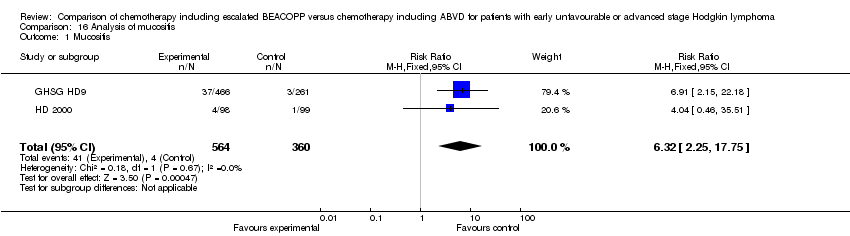
Comparison 16 Analysis of mucositis, Outcome 1 Mucositis.

Comparison 17 Analysis of nausea/vomiting, Outcome 1 Nausea/vomiting.

Comparison 18 Analysis of neurologic, Outcome 1 Neurologic.
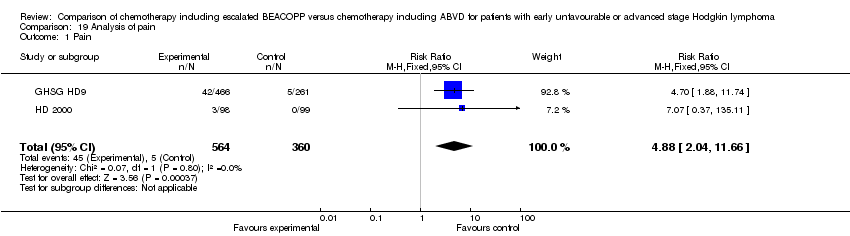
Comparison 19 Analysis of pain, Outcome 1 Pain.
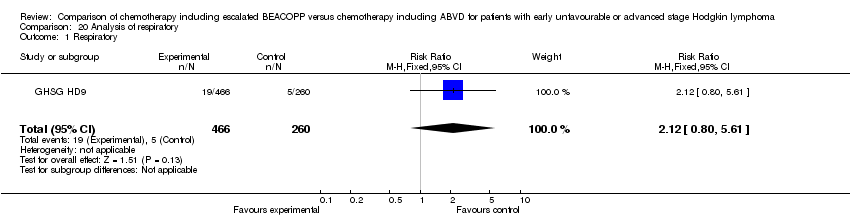
Comparison 20 Analysis of respiratory, Outcome 1 Respiratory.

Comparison 21 Analysis of skin, Outcome 1 Skin.
| Chemotherapy including escalated BEACOPP compared with chemotherapy including ABVD for patients with early unfavourable or advanced stage Hodgkin lymphoma | ||||||
| Patient or population: patients with early unfavourable or advanced stage Hodgkin lymphoma Intervention: chemotherapy including escalated BEACOPP Comparison: chemotherapy including ABVD | ||||||
| Outcomes | Illustrative comparative risks* (95% CI) | Relative effect | No of Participants | Quality of the evidence | Comments | |
| Assumed risk | Corresponding risk | |||||
| ABVD | escalated BEACOPP | |||||
| OS | Low risk population1 | HR 0.80 [0.59 to 1.09] | 2586 | +++O | ||
| 100 deaths per 1000 | 81 per 1000 | |||||
| High risk population2 | ||||||
| 250 deaths per 1000 | 206 per 1000 | |||||
| PFS | Low risk population3 | HR 0.53 [0.44 to 0.64] | 2586 | +++O | ||
| 100 progressions or relapses per 1000 | 54 per 1000 | |||||
| High risk population2 | ||||||
| 330 progressions or relapses per 1000 | 191 per 1000 | |||||
| CR rate | High risk population2 | RR 1.11 [1.06 to 1.16] | 1245 | ++++ | ||
| 831 complete responses per 1000 | 922 per 1000 | |||||
| Adverse events WHO grade III or IV | See comment | See comment | See comment | 2547 | +++O6 | Escalated BEACOPP regimens cause more haematological toxicities, infections, alopecia, mucositis and pain. No differences were found for constipation, nausea, neurologic toxicity. |
| Incidence of secondary malignancies | Low risk population2 | RR 0.95 (0.61 to 1.48) | 2547 | ++OO | As most of the trials had a median observation of less than 10 years, sufficient long term information on secondary malignancies cannot be expected. | |
| 2 per 1000 | 2 per 1000 (2 to 2) | |||||
| High risk population2 | ||||||
| 44 per 1000 | 42 per 1000 | |||||
| Incidence of infertility | 375 per 1000 | 514 per 1000 (311 to 847) | RR 1.37 [0.83 to 2.26] | 106 | +OOO | The subset of only 106 out of 608 eligible women of the HD9 were available for analyses regarding infertility. Reasons for availability are unknown and might have introduced bias in the results. |
| Treatment related mortality | See comment | See comment | RR 5.05 (0.25 to 103.87) | 197 | +OOO | No participant died in the control group and 2 died in the intervention group of the only study that reported this outcome. |
| *The basis for the assumed risk (e.g. the median control group risk across studies) is provided in footnotes. The corresponding risk (and its 95% confidence interval) is based on the assumed risk in the comparison group and the relative effect of the intervention (and its 95% CI). | ||||||
| GRADE Working Group grades of evidence | ||||||
| 1The risk for the "low risk population" (i.e. patients with early unfavourable HL) was taken from the GHSG HD8 trial, because the HD14 trial did not provide sufficient information regarding the control risk. 2The risk for the "high risk population" (i.e. patients with advanced stage of HL) was approximately the risk of the GHSG HD9 trial. 3The risk for the "low risk population" (i.e. patients with early unfavourable HL) was taken from the GHSG HD14 trial. 4 The median follow‐up varied between the trials. Longer follow‐ups and the inclusion of the EORTC 20012 trial will lead to a more precise estimate of the effect. This uncertainty causes the downgrading here. 5The definition of how to assess progression of disease varied between the trials. These heterogeneous definitions lead to an imprecise estimate of the effect that causes the downgrading here. 6So far two of the four trials reported results regarding adverse effects. The inclusion of further trials might lead to a more precise estimate of the effect. This uncertainty causes the downgrading here. 7 So far two of the four trials reported results regarding secondary malignancies. Furthermore, as most of the trials had a median observation of less than 10 years, sufficient long term information on secondary malignancies cannot be expected. The inclusion of further trials and results of longer follow‐up might lead to a more precise estimate of the effect. This uncertainty causes the downgrading here. 8 So far only 106 patients of the HD9 were analysed regarding infertility. The inclusion of further trials will lead to a more precise estimate of the effect.This uncertainty causes the downgrading here. 9 So far one of the four trials reported results regarding treatment‐related mortality. The inclusion of further trials will lead to a more precise estimate of the effect.This uncertainty causes the downgrading here. | ||||||
| Outcome or subgroup title | No. of studies | No. of participants | Statistical method | Effect size |
| 1 OS ‐ all ‐ same recruitment period between the 2 arms (HD9) Show forest plot | 4 | 2583 | Hazard Ratio (Fixed, 95% CI) | 0.80 [0.59, 1.09] |
| 2 OS subgrouped by stage of disease Show forest plot | 4 | 2583 | Hazard Ratio (Fixed, 95% CI) | 0.80 [0.59, 1.09] |
| 2.1 early unfavourable stage | 1 | 1623 | Hazard Ratio (Fixed, 95% CI) | 1.02 [0.54, 1.91] |
| 2.2 advanced stage | 3 | 960 | Hazard Ratio (Fixed, 95% CI) | 0.74 [0.52, 1.06] |
| 3 OS subgrouped by treatment Show forest plot | 4 | 2583 | Hazard Ratio (Fixed, 95% CI) | 0.80 [0.59, 1.09] |
| 3.1 only ABVD regimen | 3 | 2141 | Hazard Ratio (Fixed, 95% CI) | 1.03 [0.67, 1.59] |
| 3.2 ABVD including regimen | 1 | 442 | Hazard Ratio (Fixed, 95% CI) | 0.62 [0.40, 0.96] |
| 4 OS subgrouped by number of cycles of escalated BEACOPP Show forest plot | 4 | 2583 | Hazard Ratio (Fixed, 95% CI) | 0.80 [0.59, 1.09] |
| 4.1 eight cycles of escalated BEACOPP | 1 | 442 | Hazard Ratio (Fixed, 95% CI) | 0.62 [0.40, 0.96] |
| 4.2 four cycles of escalated BEACOPP | 2 | 518 | Hazard Ratio (Fixed, 95% CI) | 1.05 [0.58, 1.90] |
| 4.3 two cycles of escalated BEACOPP | 1 | 1623 | Hazard Ratio (Fixed, 95% CI) | 1.02 [0.54, 1.91] |
| 5 OS subgrouped by length of follow‐up Show forest plot | 4 | 2583 | Hazard Ratio (Fixed, 95% CI) | 0.80 [0.59, 1.09] |
| 5.1 short term follow‐up (median length up to 5 years) | 3 | 2141 | Hazard Ratio (Fixed, 95% CI) | 1.03 [0.67, 1.59] |
| 5.2 long term follow‐up (median length 10 years) | 1 | 442 | Hazard Ratio (Fixed, 95% CI) | 0.62 [0.40, 0.96] |
| 6 OS subgrouped by publication form Show forest plot | 4 | 2583 | Hazard Ratio (Fixed, 95% CI) | 0.80 [0.59, 1.09] |
| 6.1 full text publication | 2 | 639 | Hazard Ratio (Fixed, 95% CI) | 0.67 [0.45, 1.01] |
| 6.2 abstract publication | 2 | 1944 | Hazard Ratio (Fixed, 95% CI) | 1.02 [0.64, 1.65] |
| 7 OS subgrouped by type of results Show forest plot | 4 | 2583 | Hazard Ratio (Fixed, 95% CI) | 0.80 [0.59, 1.09] |
| 7.1 preliminary results | 2 | 1944 | Hazard Ratio (Fixed, 95% CI) | 1.02 [0.64, 1.65] |
| 7.2 mature results | 2 | 639 | Hazard Ratio (Fixed, 95% CI) | 0.67 [0.45, 1.01] |
| 8 OS ‐ all recruited patients (HD9) with potential risk of bias due to different time periods of recruitment Show forest plot | 4 | Hazard Ratio (Fixed, 95% CI) | 0.66 [0.50, 0.88] | |
| Outcome or subgroup title | No. of studies | No. of participants | Statistical method | Effect size |
| 1 PFS ‐ all ‐ same recruitment period between the 2 arms (HD9) Show forest plot | 4 | 2583 | Hazard Ratio (Fixed, 95% CI) | 0.53 [0.44, 0.64] |
| 2 PFS subgrouped by stage of disease Show forest plot | 4 | 2583 | Hazard Ratio (Fixed, 95% CI) | 0.53 [0.44, 0.64] |
| 2.1 early unfavourable stage | 1 | 1623 | Hazard Ratio (Fixed, 95% CI) | 0.49 [0.34, 0.71] |
| 2.2 advanced stage | 3 | 960 | Hazard Ratio (Fixed, 95% CI) | 0.54 [0.43, 0.67] |
| 3 PFS subgrouped by treatment Show forest plot | 4 | 2583 | Hazard Ratio (Fixed, 95% CI) | 0.53 [0.44, 0.64] |
| 3.1 only ABVD regimen | 3 | 2141 | Hazard Ratio (Fixed, 95% CI) | 0.54 [0.43, 0.67] |
| 3.2 ABVD including regimen | 1 | 442 | Hazard Ratio (Fixed, 95% CI) | 0.50 [0.34, 0.72] |
| 4 PFS subgrouped by number of cycles of escalated BEACOPP Show forest plot | 4 | 2583 | Hazard Ratio (Fixed, 95% CI) | 0.53 [0.44, 0.64] |
| 4.1 eight cycles of escalated BEACOPP | 1 | 442 | Hazard Ratio (Fixed, 95% CI) | 0.50 [0.34, 0.72] |
| 4.2 four cycles of escalated BEACOPP | 2 | 518 | Hazard Ratio (Fixed, 95% CI) | 0.57 [0.43, 0.74] |
| 4.3 two cycles of escalated BEACOPP | 1 | 1623 | Hazard Ratio (Fixed, 95% CI) | 0.49 [0.34, 0.71] |
| 5 PFS subgrouped by length of follow‐up Show forest plot | 4 | 2583 | Hazard Ratio (Fixed, 95% CI) | 0.53 [0.44, 0.64] |
| 5.1 short term follow‐up (median length up to 5 years) | 3 | 2141 | Hazard Ratio (Fixed, 95% CI) | 0.54 [0.43, 0.67] |
| 5.2 long term follow‐up (median length 10 years) | 1 | 442 | Hazard Ratio (Fixed, 95% CI) | 0.50 [0.34, 0.72] |
| 6 PFS subgrouped by publication form Show forest plot | 4 | 2583 | Hazard Ratio (Fixed, 95% CI) | 0.53 [0.44, 0.64] |
| 6.1 full text publication | 2 | 639 | Hazard Ratio (Fixed, 95% CI) | 0.51 [0.39, 0.65] |
| 6.2 abstract publication | 2 | 1944 | Hazard Ratio (Fixed, 95% CI) | 0.56 [0.42, 0.75] |
| 7 PFS subgrouped by type of results Show forest plot | 4 | 2583 | Hazard Ratio (Fixed, 95% CI) | 0.53 [0.44, 0.64] |
| 7.1 preliminary results | 2 | 1944 | Hazard Ratio (Fixed, 95% CI) | 0.56 [0.42, 0.75] |
| 7.2 mature results | 2 | 639 | Hazard Ratio (Fixed, 95% CI) | 0.51 [0.39, 0.65] |
| 8 PFS ‐ all recruited patients (HD9) with potential risk of bias due to different time periods of recruitment Show forest plot | 4 | Hazard Ratio (Fixed, 95% CI) | 0.48 [0.40, 0.58] | |
| Outcome or subgroup title | No. of studies | No. of participants | Statistical method | Effect size |
| 1 CR Show forest plot | 3 | 1245 | Risk Ratio (M‐H, Fixed, 95% CI) | 1.11 [1.06, 1.16] |
| 2 CR subgrouped by treatment Show forest plot | 3 | 1245 | Risk Ratio (M‐H, Fixed, 95% CI) | 1.11 [1.06, 1.16] |
| 2.1 only ABVD regimen | 2 | 518 | Risk Ratio (M‐H, Fixed, 95% CI) | 1.08 [1.00, 1.16] |
| 2.2 ABVD including regimen | 1 | 727 | Risk Ratio (M‐H, Fixed, 95% CI) | 1.13 [1.07, 1.19] |
| 3 CR subgrouped by number of cycles of escalated BEACOPP Show forest plot | 3 | 1245 | Risk Ratio (M‐H, Fixed, 95% CI) | 1.11 [1.06, 1.16] |
| 3.1 eight cycles of escalated BEACOPP | 1 | 727 | Risk Ratio (M‐H, Fixed, 95% CI) | 1.13 [1.07, 1.19] |
| 3.2 four cycles of escalated BEACOPP | 2 | 518 | Risk Ratio (M‐H, Fixed, 95% CI) | 1.08 [1.00, 1.16] |
| 4 CR subgrouped by length of follow‐up Show forest plot | 3 | 1245 | Risk Ratio (M‐H, Fixed, 95% CI) | 1.11 [1.06, 1.16] |
| 4.1 short term follow‐up (median length up to 5 years) | 2 | 518 | Risk Ratio (M‐H, Fixed, 95% CI) | 1.08 [1.00, 1.16] |
| 4.2 long term follow‐up (median length 10 years) | 1 | 727 | Risk Ratio (M‐H, Fixed, 95% CI) | 1.13 [1.07, 1.19] |
| 5 CR subgrouped by publication form Show forest plot | 3 | 1245 | Risk Ratio (M‐H, Fixed, 95% CI) | 1.11 [1.06, 1.16] |
| 5.1 full text publication | 2 | 924 | Risk Ratio (M‐H, Fixed, 95% CI) | 1.12 [1.07, 1.18] |
| 5.2 abstract publication | 1 | 321 | Risk Ratio (M‐H, Fixed, 95% CI) | 1.07 [0.97, 1.19] |
| Outcome or subgroup title | No. of studies | No. of participants | Statistical method | Effect size |
| 1 Freedom from first progression Show forest plot | 1 | 321 | Hazard Ratio (Fixed, 95% CI) | 0.51 [0.31, 0.85] |
| Outcome or subgroup title | No. of studies | No. of participants | Statistical method | Effect size |
| 1 Treatment‐related mortality Show forest plot | 1 | 197 | Risk Ratio (M‐H, Fixed, 95% CI) | 5.05 [0.25, 103.87] |
| Outcome or subgroup title | No. of studies | No. of participants | Statistical method | Effect size |
| 1 Secondary malignancies Show forest plot | 3 | 2547 | Risk Ratio (M‐H, Fixed, 95% CI) | 0.95 [0.61, 1.48] |
| 2 Secondary malignancies subgrouped by stage of disease Show forest plot | 3 | 2547 | Risk Ratio (M‐H, Fixed, 95% CI) | 0.95 [0.61, 1.48] |
| 2.1 early unfavourable stage | 1 | 1623 | Risk Ratio (M‐H, Fixed, 95% CI) | 0.86 [0.44, 1.65] |
| 2.2 advanced stage | 2 | 924 | Risk Ratio (M‐H, Fixed, 95% CI) | 1.04 [0.58, 1.89] |
| 3 Subgrouped by treatment Show forest plot | 3 | 2547 | Risk Ratio (M‐H, Fixed, 95% CI) | 0.95 [0.61, 1.48] |
| 3.1 only ABVD regimen | 2 | 1820 | Risk Ratio (M‐H, Fixed, 95% CI) | 0.86 [0.46, 1.64] |
| 3.2 ABVD including regimen | 1 | 727 | Risk Ratio (M‐H, Fixed, 95% CI) | 1.05 [0.57, 1.92] |
| 4 Subgrouped by number of cycles of escalated BEACOPP Show forest plot | 3 | 2547 | Risk Ratio (M‐H, Fixed, 95% CI) | 0.95 [0.61, 1.48] |
| 4.1 eight cycles of escalated BEACOPP | 1 | 727 | Risk Ratio (M‐H, Fixed, 95% CI) | 1.05 [0.57, 1.92] |
| 4.2 four cycles of escalated BEACOPP | 1 | 197 | Risk Ratio (M‐H, Fixed, 95% CI) | 1.01 [0.06, 15.92] |
| 4.3 two cycles of escalated BEACOPP | 1 | 1623 | Risk Ratio (M‐H, Fixed, 95% CI) | 0.86 [0.44, 1.65] |
| 5 Subgrouped by length of follow‐up Show forest plot | 3 | 2547 | Risk Ratio (M‐H, Fixed, 95% CI) | 0.95 [0.61, 1.48] |
| 5.1 short term follow‐up (median length up to 5 years) | 2 | 1820 | Risk Ratio (M‐H, Fixed, 95% CI) | 0.86 [0.46, 1.64] |
| 5.2 long term follow‐up (median length 10 years) | 1 | 727 | Risk Ratio (M‐H, Fixed, 95% CI) | 1.05 [0.57, 1.92] |
| 6 Subgrouped by publication form Show forest plot | 3 | 2547 | Risk Ratio (M‐H, Fixed, 95% CI) | 0.95 [0.61, 1.48] |
| 6.1 full text publication | 2 | 924 | Risk Ratio (M‐H, Fixed, 95% CI) | 1.04 [0.58, 1.89] |
| 6.2 abstract publication | 1 | 1623 | Risk Ratio (M‐H, Fixed, 95% CI) | 0.86 [0.44, 1.65] |
| 7 Subgrouped by type of results Show forest plot | 3 | 2547 | Risk Ratio (M‐H, Fixed, 95% CI) | 0.95 [0.61, 1.48] |
| 7.1 preliminary results | 1 | 1623 | Risk Ratio (M‐H, Fixed, 95% CI) | 0.86 [0.44, 1.65] |
| 7.2 mature results | 2 | 924 | Risk Ratio (M‐H, Fixed, 95% CI) | 1.04 [0.58, 1.89] |
| Outcome or subgroup title | No. of studies | No. of participants | Statistical method | Effect size |
| 1 AML or MDS Show forest plot | 2 | 924 | Risk Ratio (M‐H, Fixed, 95% CI) | 7.84 [1.04, 59.29] |
| Outcome or subgroup title | No. of studies | No. of participants | Statistical method | Effect size |
| 1 Secondary amenorrhoea Show forest plot | 1 | 106 | Risk Ratio (M‐H, Fixed, 95% CI) | 1.37 [0.83, 2.26] |
| Outcome or subgroup title | No. of studies | No. of participants | Statistical method | Effect size |
| 1 Anaemia Show forest plot | 3 | 2547 | Risk Ratio (M‐H, Fixed, 95% CI) | 10.47 [7.06, 15.54] |
| 2 Subgrouped by stage of disease Show forest plot | 3 | 2547 | Risk Ratio (M‐H, Fixed, 95% CI) | 10.47 [7.06, 15.54] |
| 2.1 early unfavourable stage | 1 | 1623 | Risk Ratio (M‐H, Fixed, 95% CI) | 9.15 [4.43, 18.86] |
| 2.2 advanced stage | 2 | 924 | Risk Ratio (M‐H, Fixed, 95% CI) | 10.96 [6.86, 17.51] |
| 3 Subgrouped by treatment Show forest plot | 3 | 2547 | Risk Ratio (M‐H, Fixed, 95% CI) | 10.47 [7.06, 15.54] |
| 3.1 only ABVD regimen | 2 | 1820 | Risk Ratio (M‐H, Fixed, 95% CI) | 6.87 [3.87, 12.18] |
| 3.2 ABVD including regimen | 1 | 727 | Risk Ratio (M‐H, Fixed, 95% CI) | 13.27 [7.78, 22.63] |
| 4 Subgrouped by number of cycles of escalated BEACOPP Show forest plot | 3 | 2547 | Risk Ratio (M‐H, Fixed, 95% CI) | 10.47 [7.06, 15.54] |
| 4.1 eight cycles of escalated BEACOPP | 1 | 727 | Risk Ratio (M‐H, Fixed, 95% CI) | 13.27 [7.78, 22.63] |
| 4.2 four cycles of escalated BEACOPP | 1 | 197 | Risk Ratio (M‐H, Fixed, 95% CI) | 3.23 [1.23, 8.48] |
| 4.3 two cycles of escalated BEACOPP | 1 | 1623 | Risk Ratio (M‐H, Fixed, 95% CI) | 9.15 [4.43, 18.86] |
| 5 Subgrouped by length of follow‐up Show forest plot | 3 | 2547 | Risk Ratio (M‐H, Fixed, 95% CI) | 10.47 [7.06, 15.54] |
| 5.1 short term follow‐up (median length up to 5 years) | 2 | 1820 | Risk Ratio (M‐H, Fixed, 95% CI) | 6.87 [3.87, 12.18] |
| 5.2 long term follow‐up (median length 10 years) | 1 | 727 | Risk Ratio (M‐H, Fixed, 95% CI) | 13.27 [7.78, 22.63] |
| 6 Subgrouped by publication form Show forest plot | 3 | 2547 | Risk Ratio (M‐H, Fixed, 95% CI) | 10.47 [7.06, 15.54] |
| 6.1 full text publication | 2 | 924 | Risk Ratio (M‐H, Fixed, 95% CI) | 10.96 [6.86, 17.51] |
| 6.2 abstract publication | 1 | 1623 | Risk Ratio (M‐H, Fixed, 95% CI) | 9.15 [4.43, 18.86] |
| 7 Subgrouped by type of results Show forest plot | 3 | 2547 | Risk Ratio (M‐H, Fixed, 95% CI) | 10.47 [7.06, 15.54] |
| 7.1 preliminary results | 1 | 1623 | Risk Ratio (M‐H, Fixed, 95% CI) | 9.15 [4.43, 18.86] |
| 7.2 mature results | 2 | 924 | Risk Ratio (M‐H, Fixed, 95% CI) | 10.96 [6.86, 17.51] |
| Outcome or subgroup title | No. of studies | No. of participants | Statistical method | Effect size |
| 1 Infection Show forest plot | 3 | 2547 | Risk Ratio (M‐H, Fixed, 95% CI) | 3.67 [2.57, 5.24] |
| 2 Subgrouped by stage of disease Show forest plot | 3 | 2547 | Risk Ratio (M‐H, Fixed, 95% CI) | 3.67 [2.57, 5.24] |
| 2.1 early unfavourable stage | 1 | 1623 | Risk Ratio (M‐H, Fixed, 95% CI) | 2.14 [1.38, 3.32] |
| 2.2 advanced stage | 2 | 924 | Risk Ratio (M‐H, Fixed, 95% CI) | 7.13 [3.78, 13.45] |
| 3 Subgrouped by treatment Show forest plot | 3 | 2547 | Risk Ratio (M‐H, Fixed, 95% CI) | 3.67 [2.57, 5.24] |
| 3.1 only ABVD regimen | 2 | 1820 | Risk Ratio (M‐H, Fixed, 95% CI) | 2.47 [1.63, 3.74] |
| 3.2 ABVD including regimen | 1 | 727 | Risk Ratio (M‐H, Fixed, 95% CI) | 7.14 [3.53, 14.43] |
| 4 Subgrouped by number of cycles of escalated BEACOPP Show forest plot | 3 | 2547 | Risk Ratio (M‐H, Fixed, 95% CI) | 3.67 [2.57, 5.24] |
| 4.1 eight cycles of escalated BEACOPP | 1 | 727 | Risk Ratio (M‐H, Fixed, 95% CI) | 7.14 [3.53, 14.43] |
| 4.2 four cycles of escalated BEACOPP | 1 | 197 | Risk Ratio (M‐H, Fixed, 95% CI) | 7.07 [1.65, 30.30] |
| 4.3 two cycles of escalated BEACOPP | 1 | 1623 | Risk Ratio (M‐H, Fixed, 95% CI) | 2.14 [1.38, 3.32] |
| 5 Subgrouped by length of follow‐up Show forest plot | 3 | 2547 | Risk Ratio (M‐H, Fixed, 95% CI) | 3.67 [2.57, 5.24] |
| 5.1 short term follow‐up (median length up to 5 years) | 2 | 1820 | Risk Ratio (M‐H, Fixed, 95% CI) | 2.47 [1.63, 3.74] |
| 5.2 long term follow‐up (median length 10 years) | 1 | 727 | Risk Ratio (M‐H, Fixed, 95% CI) | 7.14 [3.53, 14.43] |
| 6 Subgrouped by publication form Show forest plot | 3 | 2547 | Risk Ratio (M‐H, Fixed, 95% CI) | 3.67 [2.57, 5.24] |
| 6.1 full text publication | 2 | 924 | Risk Ratio (M‐H, Fixed, 95% CI) | 7.13 [3.78, 13.45] |
| 6.2 abstract publication | 1 | 1623 | Risk Ratio (M‐H, Fixed, 95% CI) | 2.14 [1.38, 3.32] |
| 7 Subgrouped by type of results Show forest plot | 3 | 2547 | Risk Ratio (M‐H, Fixed, 95% CI) | 3.67 [2.57, 5.24] |
| 7.1 preliminary results | 1 | 1623 | Risk Ratio (M‐H, Fixed, 95% CI) | 2.14 [1.38, 3.32] |
| 7.2 mature results | 2 | 924 | Risk Ratio (M‐H, Fixed, 95% CI) | 7.13 [3.78, 13.45] |
| Outcome or subgroup title | No. of studies | No. of participants | Statistical method | Effect size |
| 1 Leucopenia Show forest plot | 3 | 2547 | Risk Ratio (M‐H, Fixed, 95% CI) | 2.26 [2.09, 2.44] |
| 2 Subgrouped by stage of disease Show forest plot | 3 | 2547 | Risk Ratio (M‐H, Fixed, 95% CI) | 2.27 [2.10, 2.45] |
| 2.1 early unfavourable stage | 1 | 1623 | Risk Ratio (M‐H, Fixed, 95% CI) | 3.30 [2.90, 3.74] |
| 2.2 advanced stage | 2 | 924 | Risk Ratio (M‐H, Fixed, 95% CI) | 1.49 [1.37, 1.62] |
| 3 Subgrouped by treatment Show forest plot | 3 | 2547 | Risk Ratio (M‐H, Fixed, 95% CI) | 2.27 [2.10, 2.45] |
| 3.1 only ABVD regimen | 2 | 1820 | Risk Ratio (M‐H, Fixed, 95% CI) | 3.22 [2.86, 3.64] |
| 3.2 ABVD including regimen | 1 | 727 | Risk Ratio (M‐H, Fixed, 95% CI) | 1.39 [1.28, 1.50] |
| 4 Subgrouped by number of cycles of escalated BEACOPP Show forest plot | 3 | 2547 | Risk Ratio (M‐H, Fixed, 95% CI) | 2.27 [2.10, 2.45] |
| 4.1 eight cycles of escalated BEACOPP | 1 | 727 | Risk Ratio (M‐H, Fixed, 95% CI) | 1.39 [1.28, 1.50] |
| 4.2 two cycles of escalated BEACOPP | 1 | 197 | Risk Ratio (M‐H, Fixed, 95% CI) | 2.57 [1.71, 3.86] |
| 4.3 two cycles of escalated BEACOPP | 1 | 1623 | Risk Ratio (M‐H, Fixed, 95% CI) | 3.30 [2.90, 3.74] |
| 5 Subgrouped by length of follow‐up Show forest plot | 3 | 2547 | Risk Ratio (M‐H, Fixed, 95% CI) | 2.27 [2.10, 2.45] |
| 5.1 short term follow‐up (median length up to 5 years) | 2 | 1820 | Risk Ratio (M‐H, Fixed, 95% CI) | 3.22 [2.86, 3.64] |
| 5.2 long term follow‐up (median length 10 years) | 1 | 727 | Risk Ratio (M‐H, Fixed, 95% CI) | 1.39 [1.28, 1.50] |
| 6 Subgrouped by publication form Show forest plot | 3 | 2547 | Risk Ratio (M‐H, Fixed, 95% CI) | 2.27 [2.10, 2.45] |
| 6.1 full text publication | 2 | 924 | Risk Ratio (M‐H, Fixed, 95% CI) | 1.49 [1.37, 1.62] |
| 6.2 abstract publication | 1 | 1623 | Risk Ratio (M‐H, Fixed, 95% CI) | 3.30 [2.90, 3.74] |
| 7 Subgrouped by type of results Show forest plot | 3 | 2547 | Risk Ratio (M‐H, Fixed, 95% CI) | 2.27 [2.10, 2.45] |
| 7.1 preliminary results | 1 | 1623 | Risk Ratio (M‐H, Fixed, 95% CI) | 3.30 [2.90, 3.74] |
| 7.2 mature results | 2 | 924 | Risk Ratio (M‐H, Fixed, 95% CI) | 1.49 [1.37, 1.62] |
| Outcome or subgroup title | No. of studies | No. of participants | Statistical method | Effect size |
| 1 Neutropenia Show forest plot | 1 | 197 | Risk Ratio (M‐H, Fixed, 95% CI) | 1.57 [1.13, 2.19] |
| Outcome or subgroup title | No. of studies | No. of participants | Statistical method | Effect size |
| 1 Thrombocytopenia Show forest plot | 3 | 2547 | Risk Ratio (M‐H, Fixed, 95% CI) | 18.73 [12.17, 28.82] |
| 2 Subgrouped by stage of disease Show forest plot | 3 | 2547 | Risk Ratio (M‐H, Fixed, 95% CI) | 18.73 [12.17, 28.82] |
| 2.1 early unfavourable stage | 1 | 1623 | Risk Ratio (M‐H, Fixed, 95% CI) | 179.86 [25.26, 1280.82] |
| 2.2 advanced stage | 2 | 924 | Risk Ratio (M‐H, Fixed, 95% CI) | 11.53 [7.30, 18.23] |
| 3 Subgrouped by treatment Show forest plot | 3 | 2547 | Risk Ratio (M‐H, Fixed, 95% CI) | 18.73 [12.17, 28.82] |
| 3.1 only ABVD regimen | 2 | 1820 | Risk Ratio (M‐H, Fixed, 95% CI) | 50.43 [18.84, 134.96] |
| 3.2 ABVD including regimen | 1 | 727 | Risk Ratio (M‐H, Fixed, 95% CI) | 12.17 [7.42, 19.97] |
| 4 Subgrouped by number of cycles of escalated BEACOPP Show forest plot | 3 | 2547 | Risk Ratio (M‐H, Fixed, 95% CI) | 18.73 [12.17, 28.82] |
| 4.1 eight cycles of escalated BEACOPP | 1 | 727 | Risk Ratio (M‐H, Fixed, 95% CI) | 12.17 [7.42, 19.97] |
| 4.2 four cycles of escalated BEACOPP | 1 | 197 | Risk Ratio (M‐H, Fixed, 95% CI) | 7.41 [2.29, 23.95] |
| 4.3 two cycles of escalated BEACOPP | 1 | 1623 | Risk Ratio (M‐H, Fixed, 95% CI) | 179.86 [25.26, 1280.82] |
| 5 Subgrouped by length of follow‐up Show forest plot | 3 | 2547 | Risk Ratio (M‐H, Fixed, 95% CI) | 18.73 [12.17, 28.82] |
| 5.1 short term follow‐up (median length up to 5 years) | 2 | 1820 | Risk Ratio (M‐H, Fixed, 95% CI) | 50.43 [18.84, 134.96] |
| 5.2 long term follow‐up (median length 10 years) | 1 | 727 | Risk Ratio (M‐H, Fixed, 95% CI) | 12.17 [7.42, 19.97] |
| 6 Subgrouped by publication form Show forest plot | 3 | 2547 | Risk Ratio (M‐H, Fixed, 95% CI) | 18.73 [12.17, 28.82] |
| 6.1 full text publication | 2 | 924 | Risk Ratio (M‐H, Fixed, 95% CI) | 11.53 [7.30, 18.23] |
| 6.2 abstract publication | 1 | 1623 | Risk Ratio (M‐H, Fixed, 95% CI) | 179.86 [25.26, 1280.82] |
| 7 Subgrouped by type of results Show forest plot | 3 | 2547 | Risk Ratio (M‐H, Fixed, 95% CI) | 18.73 [12.17, 28.82] |
| 7.1 preliminary results | 1 | 1623 | Risk Ratio (M‐H, Fixed, 95% CI) | 179.86 [25.26, 1280.82] |
| 7.2 mature results | 2 | 924 | Risk Ratio (M‐H, Fixed, 95% CI) | 11.53 [7.30, 18.23] |
| Outcome or subgroup title | No. of studies | No. of participants | Statistical method | Effect size |
| 1 Alopecia Show forest plot | 3 | 2547 | Risk Ratio (M‐H, Fixed, 95% CI) | 1.97 [1.77, 2.19] |
| 2 Subgrouped by stage of disease Show forest plot | 3 | 2547 | Risk Ratio (M‐H, Fixed, 95% CI) | 1.97 [1.77, 2.19] |
| 2.1 early unfavourable stage | 1 | 1623 | Risk Ratio (M‐H, Fixed, 95% CI) | 2.00 [1.74, 2.31] |
| 2.2 advanced stage | 2 | 924 | Risk Ratio (M‐H, Fixed, 95% CI) | 1.93 [1.65, 2.26] |
| 3 Subgrouped by treatment Show forest plot | 3 | 2547 | Risk Ratio (M‐H, Fixed, 95% CI) | 1.97 [1.77, 2.19] |
| 3.1 only ABVD regimen | 2 | 1820 | Risk Ratio (M‐H, Fixed, 95% CI) | 1.85 [1.62, 2.12] |
| 3.2 ABVD including regimen | 1 | 727 | Risk Ratio (M‐H, Fixed, 95% CI) | 2.19 [1.85, 2.59] |
| 4 Subgrouped by number of cycles of escalated BEACOPP Show forest plot | 3 | 2547 | Risk Ratio (M‐H, Fixed, 95% CI) | 1.97 [1.77, 2.19] |
| 4.1 eight cycles of escalated BEACOPP | 1 | 727 | Risk Ratio (M‐H, Fixed, 95% CI) | 2.19 [1.85, 2.59] |
| 4.2 four cycles of escalated BEACOPP | 1 | 197 | Risk Ratio (M‐H, Fixed, 95% CI) | 0.91 [0.59, 1.40] |
| 4.3 two cycles of escalated BEACOPP | 1 | 1623 | Risk Ratio (M‐H, Fixed, 95% CI) | 2.00 [1.74, 2.31] |
| 5 Subgrouped by length of follow‐up Show forest plot | 3 | 2547 | Risk Ratio (M‐H, Fixed, 95% CI) | 1.97 [1.77, 2.19] |
| 5.1 short term follow‐up (median length up to 5 years) | 2 | 1820 | Risk Ratio (M‐H, Fixed, 95% CI) | 1.85 [1.62, 2.12] |
| 5.2 long term follow‐up (median length 10 years) | 1 | 727 | Risk Ratio (M‐H, Fixed, 95% CI) | 2.19 [1.85, 2.59] |
| 6 Subgrouped by publication form Show forest plot | 3 | 2547 | Risk Ratio (M‐H, Fixed, 95% CI) | 1.97 [1.77, 2.19] |
| 6.1 full text publication | 2 | 924 | Risk Ratio (M‐H, Fixed, 95% CI) | 1.93 [1.65, 2.26] |
| 6.2 abstract publication | 1 | 1623 | Risk Ratio (M‐H, Fixed, 95% CI) | 2.00 [1.74, 2.31] |
| 7 Subgrouped by type of results Show forest plot | 3 | 2547 | Risk Ratio (M‐H, Fixed, 95% CI) | 1.97 [1.77, 2.19] |
| 7.1 preliminary results | 1 | 1623 | Risk Ratio (M‐H, Fixed, 95% CI) | 2.00 [1.74, 2.31] |
| 7.2 mature results | 2 | 924 | Risk Ratio (M‐H, Fixed, 95% CI) | 1.93 [1.65, 2.26] |
| Outcome or subgroup title | No. of studies | No. of participants | Statistical method | Effect size |
| 1 Constipation Show forest plot | 2 | 923 | Risk Ratio (M‐H, Fixed, 95% CI) | 1.19 [0.56, 2.55] |
| Outcome or subgroup title | No. of studies | No. of participants | Statistical method | Effect size |
| 1 Mucositis Show forest plot | 2 | 924 | Risk Ratio (M‐H, Fixed, 95% CI) | 6.32 [2.25, 17.75] |
| Outcome or subgroup title | No. of studies | No. of participants | Statistical method | Effect size |
| 1 Nausea/vomiting Show forest plot | 2 | 924 | Risk Ratio (M‐H, Fixed, 95% CI) | 0.94 [0.71, 1.25] |
| Outcome or subgroup title | No. of studies | No. of participants | Statistical method | Effect size |
| 1 Neurologic Show forest plot | 2 | 924 | Risk Ratio (M‐H, Fixed, 95% CI) | 1.14 [0.55, 2.35] |
| Outcome or subgroup title | No. of studies | No. of participants | Statistical method | Effect size |
| 1 Pain Show forest plot | 2 | 924 | Risk Ratio (M‐H, Fixed, 95% CI) | 4.88 [2.04, 11.66] |
| Outcome or subgroup title | No. of studies | No. of participants | Statistical method | Effect size |
| 1 Respiratory Show forest plot | 1 | 726 | Risk Ratio (M‐H, Fixed, 95% CI) | 2.12 [0.80, 5.61] |
| Outcome or subgroup title | No. of studies | No. of participants | Statistical method | Effect size |
| 1 Skin Show forest plot | 1 | 726 | Risk Ratio (M‐H, Fixed, 95% CI) | 2.60 [0.76, 8.98] |