Prescripción de apoyo nutricional hipocalórico para adultos en estado grave
Información
- DOI:
- https://doi.org/10.1002/14651858.CD007867.pub2Copiar DOI

- Base de datos:
-
- Cochrane Database of Systematic Reviews
- Versión publicada:
-
- 04 junio 2018see what's new
- Tipo:
-
- Intervention
- Etapa:
-
- Review
- Grupo Editorial Cochrane:
-
Grupo Cochrane de Atención crítica y de emergencia
- Copyright:
-
- Copyright © 2018 The Cochrane Collaboration. Published by John Wiley & Sons, Ltd.
Cifras del artículo
Altmetric:
Citado por:
Autores
Contributions of authors
Conception, design and coordination of the review: Mario I Perman (MP)
Design of search strategies: Virginia Garrote (VG), MP, Agustín Ciapponi (ACi)
Searching: VG, MP
Manual searches: Cecilia Loudet (CL), Adriana Crivelli (ACr), VG and MP.
Screening search results: MP, CL, ACr.
Organizing retrieval of papers: VG, MP.
Obtaining copies of trials: MP, ACr, CL, GP, VG
Screening retrieved paper against inclusion criteria: MP, CL, ACr, GP.
Selection of trials to include: MP, CL, ACr, GP.
Appraising quality of papers: GP, CL, AC, Juan Franco (JF).
Extracting data from trials: MP, CL, ACr.
Meta‐regression in STATA 14.1 AC
Writing to authors of papers for additional information: MP.
Data management for the review
Entering data into RevMan: MP, GP, ACi.
Analysis of data: MP, ACi, GP, CL, ACr, JF.
Interpretation of data: MP, GP, ACi, CL, JF.
Providing a methodological perspective: ACi, JF.
Providing a clinical perspective: MP, GP, ACi, CL.
Writing the review: MP, ACi, GP, CL, JF.
Update of the review: MP.
Sources of support
Internal sources
-
None, Argentina.
External sources
-
None, Argentina.
Declarations of interest
Mario I Perman received honoraria from laboratory Fresenius‐Kabi S.A (Buenos Aires‐Argentina) for doing educational activities in the field of parenteral nutrition in different clinical settings. He has not received any type of financial support from Fresenius‐Kabi S.A. for doing or writing this Cochrane review.
Agustín Ciapponi: none declared.
Cecilia Loudet: none declared.
Adriana Crivelli: none declared.
Virginia Garrote: none declared.
Gastón Perman: none declared.
Juan VA Franco: none declared.
Acknowledgements
During the prepublication editorial process, the protocol has been commented on by a content editor and two peer reviewers (who are external to the editorial team), members of the Cochrane Consumer network’s international panel of consumers and the Anaesthesia Group’s Information Specialist. For that, we thank Martha Delgado, Khursheed Jeejeebhoy, Alison Avenell, Anne E. Fonfa and Janet Wale. We are especially grateful to Jane Cracknell for her help and patience during the protocol development (Perman 2009), and publication process, to Karen Hovhannisyan and Daniel Comandé for their help with the search strategies and obtaining copies of trials, and to Marit Johansen for the SciSearch information.
We also thank Kursheed Jeejeebhoy, Mette Berger, Roland Dickerson, José F. Patiño, Ewald Schlotzer (Fresenius‐Kabi AG, Germany); Rolf Franke and Ute Brauer (B Braun Melsungen AG, Germany) for their help in suggesting potential studies to be considered, and to the first authors of several trials for giving all the information requested to complete the data for this review: Christine Ahrens sent information on length of ICU and hospital stay and on mechanical ventilation expressed as mean and standard deviation (Ahrens 2005); Sirak Petros completed the data of their initially unpublished but finished pilot study (Petros 2016); Todd Rice, for his own study (Rice 2011) and on behalf of the ARDS Network (NHLBI 2012) gave us important additional information and interpretation of results of both trials; Saúl Rugeles (Rugeles 2013), sent the final version of the trial before it was published and also additional information about participants with hyperglycaemia and to estimate the risks of bias. He also sent us in advance the full paper of his second trial (Rugeles 2016), with some additional information; Yaseen Arabi (Arabi 2015) sent us means and standard deviations of several outcomes; Eric Charles (Charles 2014) sent us the mean and standard deviation value of length of mechanical ventilation and additional information to complete the 'Risk of bias' table.
During the preparation of the final manuscript, we received several comments and advice. We would like to thank Rodrigo Cavallazzi (content editor) and Harald Herkner (content and co‐ordinating editor), Nathan Pace (statistical editor), Bill Simpson, Khursheed Jeejeebhoy, Thomas Bongers (peer reviewers), Janet Wale (consumer editor) and Daren Heyland for their help and editorial advice during the preparation of this systematic review. Once more, we also want to express our special gratitude to Jane Cracknell (Managing Editor) for her help during the editorial process and to Nathan Pace (statistical editor) for his advice about how to perform and report several statistical results.
Version history
| Published | Title | Stage | Authors | Version |
| 2018 Jun 04 | Prescribed hypocaloric nutrition support for critically‐ill adults | Review | Mario I Perman, Agustín Ciapponi, Juan VA Franco, Cecilia Loudet, Adriana Crivelli, Virginia Garrote, Gastón Perman | |
| 2009 Jul 08 | Prescribed hypocaloric nutrition support for critically ill adults | Protocol | Mario I Perman, Agustín Ciapponi, Adriana Crivelli, Virginia Garrote, Cecilia Loudet, Gastón Perman | |
Differences between protocol and review
Background section
-
The original Background section contained a single description without subheadings. We updated the references and divided them into level two subheadings according to the Cochrane Handbook for Systematic Reviews of Interventions recommendations (Higgins 2011).
Objectives and outcomes
-
Modifications in order to comply with the latest MECIR standards (Higgins 2016): we modified the wording of the objectives in order to comply with Standard R5 and R22; we provided additional detail for the definition of outcomes in order to comply with Standard R32; we provided detail on the GRADE methods in order to comply with Standard C23 and R98; we provided detail on subgroup analysis (Standard R52)
-
In order to have only three primary outcomes (according to Higgins 2011), we changed the order of the primary and secondary outcomes stated in the protocol (Perman 2009), while maintaining all the predefined ones. The primary outcomes for this review were: mortality (in hospital, in lCU and at 30 days); length of stay (in hospital and in ICU) and infectious complications. The secondary outcomes we were able to evaluate were: length of mechanical ventilation, non‐infectious complications, carbohydrate metabolic outcomes (hyperglycaemia, hypoglycaemia), protein metabolic outcomes (nitrogen balance). However, we include seven outcomes in the 'Summary of findings' table. These main outcomes were considered for the subgroup analysis.
Criteria for inclusion of studies
-
We provided further detail on the inclusion criteria for the Types of interventions that initially was broadly defined as " 1) normo‐ or hypercaloric NS: equal or more than the measured REE or 25 kcal/kg/day (with the same characteristics as above); or 2) no nutrition support at all: fasting or dextrose solutions". We added "We evaluated results of trials designed to compare prescribed hypocaloric enteral or parenteral nutrition support (or permissive underfeeding) with standard nutrition support, or with no nutrition, even if those trials did not reach their caloric goals in the intervention or control groups (intention‐to treat analysis). We did not include trials that planned to provide full nutrition support but resulted in unintended hypocaloric provision (for any reason)."
Search methods
In Electronic searches we made some changes: we applied the trial filter for therapy, maximizing sensitivity developed by HIRU (Health Information Research Unit at McMaster University: hiru.mcmaster.ca/hiru/HIRU_Hedges_EMBASE_Strategies.aspx. We consulted the following trial registries: ClinicalTrials.Gov: clinicaltrials.gov/ct2/home; International Clinical Trials Registry Platform (WHO): apps.who.int/trialsearch/); and ISRCTN Registry: www.isrctn.com/. The LILACS strategy was improved (Appendix 4). We did not perform ISI SciSearch due to lack of access to the database. We did not contact relevant societies to identify abstracts, since we checked the conference proceedings of those societies directly.
Data collection and analysis
-
We updated the sections Selection of studies, Data extraction and management, Assessment of risk of bias in included studies according to the latest MECIR standards (2016) and Cochrane Handbook for Systematic Reviews of Interventions (Higgins 2011). They were initially in different subheadings and now use the current recommended subheadings.
-
We added the sections Measures of treatment effect, Unit of analysis issues, Dealing with missing data and Assessment of reporting biases that were not present in the original protocol.
-
We constructed the section Assessment of heterogeneity and Data synthesis with the information present in "Analysis" in the original protocol.
-
We modified the sections Assessment of heterogeneity and Data synthesis, to adjust the cut‐off points to classify and report heterogeneity according to Higgins 2011 (Section 9.5.2).
-
We added a section for the methods used to develop the 'Summary of findings' table using the GRADE approach (see Sensitivity analysis).
Methods not implemented
-
Several outcomes stated in the protocol were not reported in the trials; for this reason we were not able to conduct some predefined subgroup analyses. We did a subgroup analysis not prespecified in the protocol to assess the effect of the route of nutrition support (enteral or parenteral). We considered this to be relevant after the search strategy was performed, but before we had conducted any analysis.
Post hoc analysis
-
After collecting the data about the calories received by both groups of participants in the included studies, and before the analysis of results, we decided to perform the subgroup analysis of the amount of calories received according to the following categories: very hypocaloric, hypocaloric, normocaloric and hypercaloric.
-
We performed two sensitivity analyses not previously stated in the protocol. In one of them we excluded three studies (Ibrahim 2002; NHLBI 2012; Rice 2011) with a different primary goal: they evaluated early initiation of low‐dose enteral nutrition (hypocaloric trophic feeding) against full enteral dose from the beginning (normocaloric standard feeding). In the other sensitivity analysis, we excluded a study (Battistella 1997), primarily designed to compare parenteral nutrition without the administration of intravenous lipid emulsion (hypocaloric) and with lipids (normocaloric).
-
When we found high levels of clinical and statistical heterogeneity, we performed a non‐prespecified meta‐regression using STATA 13.1 to explore the effect of several covariates on the main outcomes (Appendix 5).
Change in authorship
-
Juan VA Franco has joined the review team.
Keywords
MeSH
Medical Subject Headings (MeSH) Keywords
Medical Subject Headings Check Words
Adult; Humans;
PICO

Updated study flow diagram, 20 June 2017
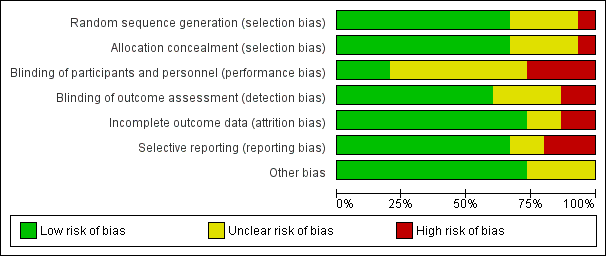
Risk of bias graph: review authors' judgements about each risk of bias domain presented as percentages across all included studies.

Risk of bias summary: review authors' judgements about each risk of bias domain for each included study. Red colour represents high risk of bias; green, low risk of bias; and yellow, unclear risk of bias.

Funnel plot of comparison: 1 Hypocaloric nutrition (intervention) vs. Control, outcome: 1.1 Mortality in hospital.
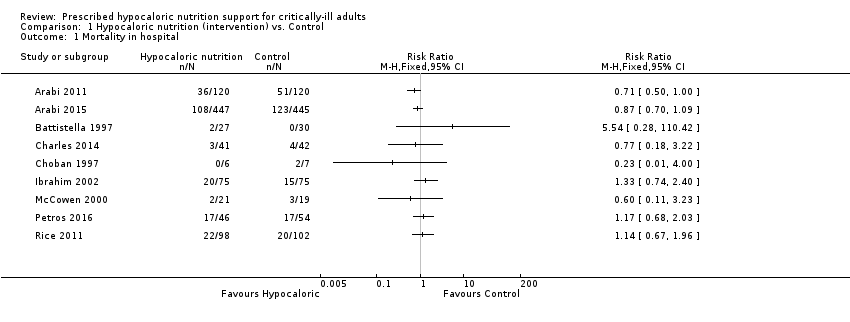
Comparison 1 Hypocaloric nutrition (intervention) vs. Control, Outcome 1 Mortality in hospital.
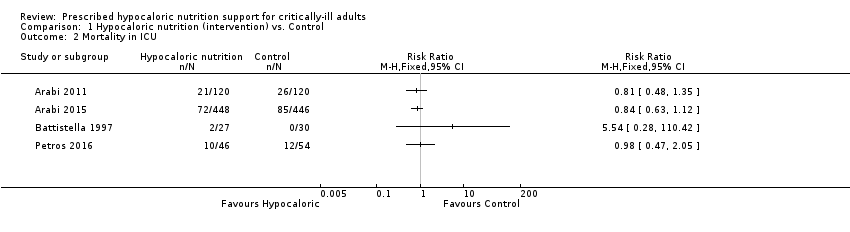
Comparison 1 Hypocaloric nutrition (intervention) vs. Control, Outcome 2 Mortality in ICU.
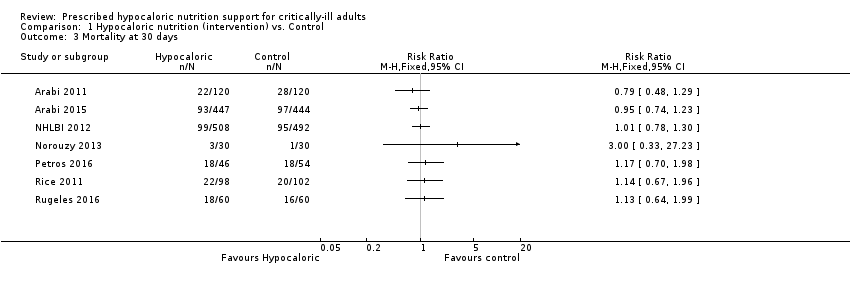
Comparison 1 Hypocaloric nutrition (intervention) vs. Control, Outcome 3 Mortality at 30 days.
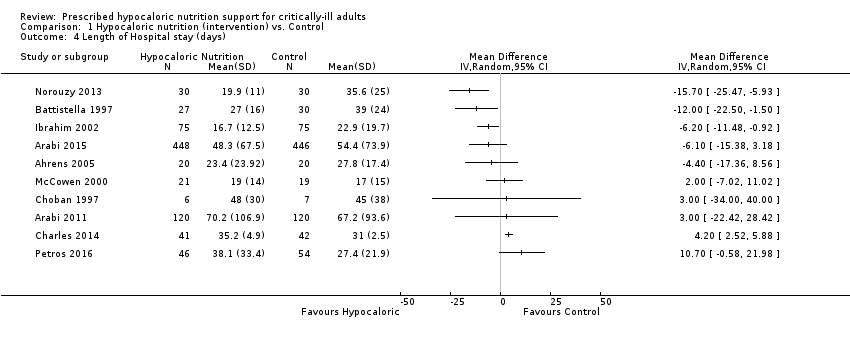
Comparison 1 Hypocaloric nutrition (intervention) vs. Control, Outcome 4 Length of Hospital stay (days).
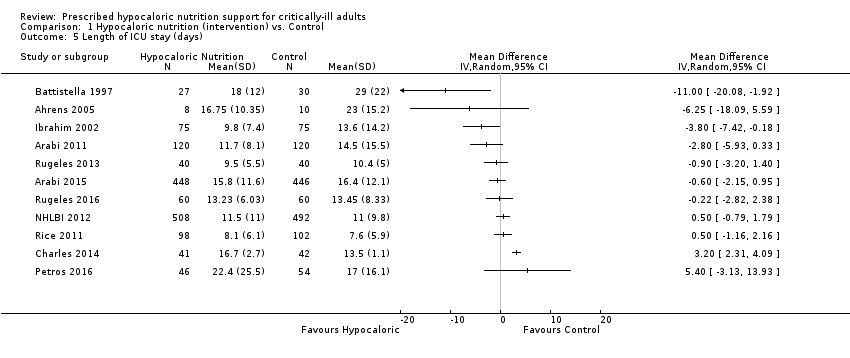
Comparison 1 Hypocaloric nutrition (intervention) vs. Control, Outcome 5 Length of ICU stay (days).

Comparison 1 Hypocaloric nutrition (intervention) vs. Control, Outcome 6 Infectious complications.

Comparison 1 Hypocaloric nutrition (intervention) vs. Control, Outcome 7 Length of mechanical ventilation (days).
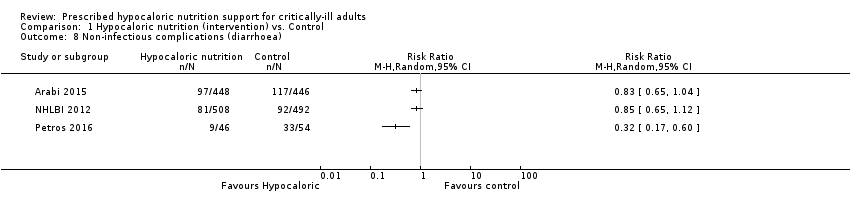
Comparison 1 Hypocaloric nutrition (intervention) vs. Control, Outcome 8 Non‐infectious complications (diarrhoea).

Comparison 1 Hypocaloric nutrition (intervention) vs. Control, Outcome 9 Hyperglycaemia.
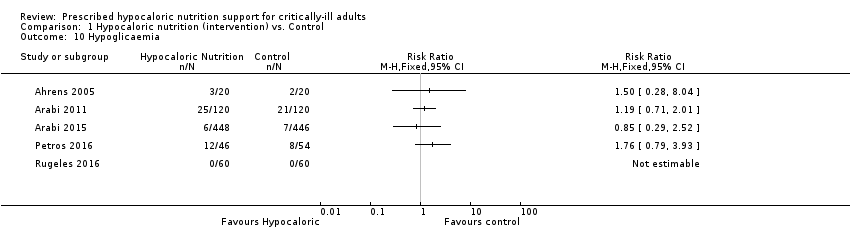
Comparison 1 Hypocaloric nutrition (intervention) vs. Control, Outcome 10 Hypoglicaemia.

Comparison 1 Hypocaloric nutrition (intervention) vs. Control, Outcome 11 Nitrogen balance (g/day).
| Hypocaloric nutrition compared to control for critically‐ill adults | |||
| Patient or population: critically‐ill adults Comparison: control nutritional support with a higher caloric intake than the 'intervention' group | |||
| Outcomes | Effect estimate (range of results of individual studies) | N of Participants | Quality of the evidence |
| Mortality in hospital: death occurring during the hospital stay | Range of risk ratios from 0.23 to 5.54a | 1775 (9 studies) | ⊕⊕⊝⊝ |
| Mortality in ICU: death occurred during the ICU stay | Range of risk ratios from 0.81 to 5.54a | 1291 | ⊕⊕⊝⊝ |
| Mortality at 30 days: 28 to 30 days all‐cause mortality | Range of risk ratios from 0.79 to 3.00a | 2611 | ⊕⊕⊝⊝ |
| Length of hospital stay: days stayed in the hospital | Range of length of hospital stay from 15.70 days lower to 10.70 days highera | 1677 | ⊕⊝⊝⊝ |
| Length of ICU stay: days stayed in the ICU | Range of length of ICU stay from 11.00 days lower to 5.40 days highera | 2942 | ⊕⊝⊝⊝ |
| Infectious complications: events of any type of infectious complications occurred during the hospital stay, registered by the study authors according to their diagnostic criteria of infections. | Range of risk ratios from 0.54 to 2.54a | 2804 | ⊕⊝⊝⊝ |
| Length of mechanical ventilation: days on mechanical ventilation during ICU stay | Range of mean differences: 13.20 days lower to 8.36 days highera | 3000 (12 studies) | ⊕⊝⊝⊝ |
| GRADE Working Group grades of evidence | |||
| aResults were not combined due to clinical heterogeneity. | |||
| Study ID | Type of participants Primary outcomes | Arm | Number of ICU participants | APACHE II score mean ± SD | Route (enteral or parenteral) | Duration of PN or EN (days) | Mechanical ventilation (% of participants) | ICU mortality % | Hospital mortality % |
| Surgical participants with PN requirement Incidence/severity hyperglycaemia and insulin received by the participants | Hypoc. | 8 (other 12 non‐ICU) | 20 ± 9 | Parenteral | 6 (4 to 10) | 100 | Not reported | Not reported | |
| Control | 10 (other 10 non‐ICU) | 19 ± 11 | 7 (5 to 10) | 80 | |||||
| Medical (mainly) and surgical participants with EN. 2 x 2 factorial trial with Intensive Insuline therapy 28 days all‐cause mortality | Hypoc. | 120 | 25 ± 8 | Enteral | Not reported | 99 | 18 | 30 | |
| Control | 120 | 25 ± 8 | 99 | 22 | 43 | ||||
| Critically‐ill participants (75% medical) 90‐day all‐cause mortality | Hypoc. | 448 | 21 ± 7.9 | Enteral | 9.1 ± 4.6 | 97.3 | 16.1 | 24.2 | |
| Control | 446 | 21 ± 8.2 | 9.4 ± 4.4 | 96.2 | 19.1 | 27.6 | |||
| Trauma participants with PN requirement Length of hospital stay, length of stay in the ICU, number of days on mechanical ventilation and infectious complications. | Hypoc. | 27 | 22 ± 5 | Parenteral | 10 | Not reported | 7.4 | Not reported | |
| Control | 30 | 23 ± 6 | 10 | 0 | |||||
| Critically‐ill surgical participants Hospital‐acquired infection | Hypoc. | 41 | 16.6 ± 0.9 | Enteral & parenteral | 12.6 ± 2.8 | 68 | N/A | 7.3 | |
| Control | 42 | 17.3 ± 0.8 | 10.4 ± 1.1 | 57 | N/A | 9.5 | |||
| Obese participants with PN requirement. Predominantly surgical diseases Achievement of nitrogen balance | Hypoc. | 6 (other 10 non‐ICU) | 13 ± 5 | Parenteral | 10 ± 3 | Not reported | Not reported | 0 | |
| Control | 7 (other 7 non‐ICU) | 15 ± 5 | 11 ± 2 | 28.6 | |||||
| Medical ICU participants with EN Incidence of ventilator‐associated pneumonia | Hypoc. | 75 | 26 ± 8 | Enteral | 5 ± 6 | 100 | Not reported | 27 | |
| Control | 75 | 25 ± 8 | 10 ± 12 | 100 | 20 | ||||
| Participants with predominantly surgical diseases requiring PN Glycaemic control and Infections | Hypoc. | 21 | not reported | Parenteral | ≥ 5 | 50 | 10 | Not reported | |
| Control | 19 | not reported | ≥ 5 | 33 | 16 | ||||
| Acute lung injury predominantly due to medical diseases (61% and 63% of participants) with EN Ventilator‐free days at study day 28 | Hypoc. | 508 | APACHE III 92 ± 28 | Enteral | 6 | 100 | Not reported | 22.4 | |
| Control | 492 | APACHE III 90 ± 27 | Enteral | 6 | 100 | 19.6 | |||
| Critically‐ill head trauma participants 28 days of all‐cause mortality | Hypoc. | 30 | Not reported | Enteral | 7 | Not reported | Not reported | 10.7a | |
| Control | 30 | 7 | 3.8a | ||||||
| Medical ICU with EN and/or PN requirement Glycaemic control and mortality | Hypoc. | 46 | 31 ± 9 | Enteral & parenteral | 7 | not reported | 22 | 37 | |
| Control | 54 | 28 ± 8 | 7 | 22 | 31 | ||||
| Acute lung injury, predominantly due to medical diseases with EN Ventilator‐free days at study day 28 | Hypoc. | 98 | 27 ± 8 | Enteral | 6 ± 4 | 100 | Not reported | 22 | |
| Control | 102 | 27 ± 7 | 5 ± 3 | 100 | 20 | ||||
| Medical ICU participants with EN requirement Change in SOFA score at 48 hours | Hypoc. | 40 | 14 ± 5 | Enteral | 7 | Not reported | Not reported | Not reported | |
| Control | 40 | 15 ± 6 | |||||||
| Medical ICU participants with EN requirement Change in SOFA score at 48 hours | Hypoc. | 60 | 13.5 ± 6.4 | Enteral | 7 | Not reported | Not reported | 30a | |
| Control | 60 | 13.7 ± 6.8 | 27a | ||||||
| Septic, mechanically ventilated critically‐ill participants 28‐day mortality | Hypocal. | Total sample of 74 participants | Total sample 22 ± 4 | Enteral | Not reported | Not reported | Not reported | Not reported | |
| Control | |||||||||
| a28‐day mortality. EN = Enteral nutrition; ICU = Intensive Care Unit; N/A: not available; PN = Parenteral nutrition; SOFA = Sequential Organ Failure Assessment | |||||||||
| Studies | How data was reported | Hypocaloric (intervention) group | Control group | Calories received by the "hypocaloric" intervention group (kcal/kg/day) | Calories received by the "normocaloric" control group (kcal/kg/day) | Categories denominated by the calories really received in the intervention and the control groups a |
| Total calories/kg/day (median (IQ))b | 26.6 (26.2 to 27.5) | 37 (36.0 to 38.4) | 26.60 (median) | 37.00 (median) | Normocaloric vs hypercaloric | |
| Protein g/kg/day (mean± SD) | 1.61 ± 0.13 | 1.53 ± 0.26 | ||||
| Calories/day (mean ± SD) | 1066.6 ± 306.1 | 1251.7 ± 432.5 | 13.85 | 16.40 | Hypocaloric vs hypocaloric | |
| Protein g/day (mean ± SD) | 47.5 ± 21.2 | 43.6 ± 18.9 | ||||
| Calories/day (mean ± SD) | 835 ± 297 | 1299 ± 2470 | 10.56 | 16.04 | Hypocaloric vs hypocaloric | |
| Protein g/day (mean ± SD) | 57 ± 24 | 59 ± 25 | ||||
| Calories/kg ideal body weight/day (mean ± SD) | 27.4 ± 2 | 34.4 ± 2 | 27.4 (of ideal body weight) | 34.4 (of ideal body weight) | Normocaloric vs. normocaloric | |
| Protein g/kg ideal body weight/day (mean± SD) | 1.6 ± 0.1 | 1.6 ± 0.2 | ||||
| Calories/kg/day (mean ± SD) | 12.3 ± 0.7 | 17.1 ± 1.1 | 12 | 17 | Hypocaloric vs hypocaloric | |
| Protein g/kg/day (mean ± SD) | 1.1 ± 0.1 | 1.1 ± 0.1 | ||||
| Kcal/kg actual body weight/day (mean ± SD) Kcal/kg ideal body weight/day (mean ± SD) | 8.6 ± 2.39 13.88 ± 2.87 | 17.45 ± 4.06 27.99 ± 3.83 | 14.00 (of ideal body weight) | 28.00 (of ideal body weight) | Hypocaloric vs normocaloric | |
| Protein g/kg actual body weight/day (mean ± SD) Protein g/kg ideal body weight/day (mean ± SD) | 1.2 ± 0.2 2.0 ± 0.1 | 1.2 ± 1.2 2.0 ± 0.1 | ||||
| Calories/day (mean ± SD) | 126 ± 115 | 474 ± 400 | 1.53 | 5.81 | Very hypocaloric vs very hypocaloric | |
| Proteins g/day (mean) (mean ± SD) | 5.3 ± 5.3 | 18.7 ± 15.4 | ||||
| Calories/kg/day (mean ± SD) | 14 ± 3 | 18 ± 4 | 14.30 | 18.40 | Hypocaloric vs hypocaloric | |
| Proteins g/kg/day (mean ± SD) | 1.1 ± 0.2 | 1.3 ± 0.2 | ||||
| Calories/day (mean ± SD) | 399 ± 225 | 1365 ± 596 | 4.64 (estimated by kcal/day divided by weight from the baseline table) | 15.69 (estimated by kcal/day divided by weight from the baseline table) | Very hypocaloric vs hypocaloric | |
| Proteins: information not collected | ‐ | ‐ | ||||
| Calories/kg/day (mean ± SD) | Not reported | Not reported | N/A | N/A | N/A | |
| Protein g/kg/day (mean ± SD) | Not reported | Not reported | ||||
| Calories/kg/day (mean ± SD) | 11.3 ± 3.1 | 19.7 ± 5.7 | 11.30 | 19.70 | Hypocaloric vs hypocaloric | |
| Protein | Data not reported | Data not reported | ||||
| Calories/day (mean ± SD of study days 1 to 5) | 300 ± 149 | 1418 ± 686 | 3.60 | 17.31 | Very hypocaloric vs hypocaloric | |
| Proteins g/day (mean ± SD of study days 1 to 5) | 10.9 ± 6.8 | 54.4 ± 33.2 | ||||
| Calories/kg/day (mean ± SD) | 12 ± 3.9 | 14 ± 6.2 | 12.00 | 14.00 | Hypocaloric vs hypocaloric | |
| Protein g/kg/day (mean ± SD) | 1.4 ± 0.44 | 0.76 ± 0.32 | ||||
| Total calories/kg ideal body weight/day (mean ± SD) | 12.6 ± 3.4 | 20.5 ± 5.1 | 13 | 21 | Hypocaloric vs hypocaloric | |
| Protein g/kgIBW/day (mean ± SD) | 1.4 ± 0.4 | 1.4 ± 0.3 | ||||
| Calories/day (mean ± SD) | 962 ± 314 | 1308 ± 513 | Not reported Estimatedc 16.63 kcal/kg/day | Not reported Estimatedc 22.62 kcal/kg/day | Estimatedc Hypocaloric vs normocaloric | |
| Protein g/day (mean ± SD) | 57 ± 24 | 59 ± 25 | Not reported Estimatedc 0.99 g/kg/day | Not reported Estimatedc 1.02 g/kg/day | ||
| aCategories denominated by the amount of calories really received by both study groups, according to the following: very hypocaloric = < 10 kcal/kg/day; hypocaloric = ≥ 10 to < 25 kcal/kg/day; normocaloric = ≥ 25 to < 35 kcal/kg/day; hypercaloric = ≥ 35 kcal/kg/day. BMI = Body Mass Index; g = gram; ICU = Intensive Care Unit; kcal = kilocalories; N/A: not available; SD = standard deviation; vs = versus | ||||||
| Study | Difference in calories between groups (kcal/kg/day) | Hospital mortality (%) IG vs CG | ICU mortality (%) IG vs CG | Mortality at 30 days (%) IG vs CG | Infectious complications (%) IG vs CG | Length of hospital stay (days)a IG vs CG | ICU length of stay (days)a IG vs CG | Length of mechanical ventilation (days)a IG vs CG | Categories denominated by the calories really received in the intervention and the control groupsb |
| 2.00 | N/A | N/A | N/A | N/A | N/A | 9.5 vs 10.4 | 8.5 vs 9.7 | Hypocaloric vs hypocaloric | |
| 2.55 | 30% vs 42.5% | 17.5% vs 21.7% | 18.3% vs 23.3% | 44.2% vs 46.7% | 70.2 vs 67.2 | 11.7 vs 14.5 | 10.6 vs 13.2 | Hypocaloric vs hypocaloric | |
| 4.10 | 9.5% vs 15.8% | N/A | N/A | 28.6% vs 52.6% | 19 vs 17 | N/A | N/A | Hypocaloric vs hypocaloric | |
| 4.28 | 26.7% vs 20% | N/A | N/A | 30.7% vs 49.3% | 16.7 vs 22.9 | 9.8 vs 13.6 | 8.1 vs 12.9 | Very hypocaloric vs very hypocaloric | |
| 5.00 | 7.3% vs 9.5% | N/A | N/A | 56.1% vs 57.1% | 35.2 vs 31 | 16.7 vs 13.6 | 10.8 vs 8.3 | Hypocaloric vs hypocaloric | |
| 5.48 | 24.2% vs 27.6% | 16.1% vs 19.1% | 20.8% vs 21.8% | 35.9% vs 37.9% | 48.3 vs 54.4 | 15.8 vs 16.4 | 11.3 vs 13.5 | Hypocaloric vs hypocaloric | |
| 7.00 | 7.4% vs 0% | 7.4% vs 0% | N/A | 48.2% vs 73.3% | 27 vs 39 | 18 vs 29 | 15 vs 27 | Normocaloric vs normocaloric | |
| 7.90 | N/A | N/A | 30% vs 26.7% | N/A | N/A | 13.2 vs 13.5 | 10.8 vs 10.8 | Hypocaloric vs hypocaloric | |
| 8.40 | 37% vs 31.5% | 21.7% vs 22.2% | 39.1% vs 33.3% | 28.3% vs 11.1% | 38.1 vs 27.4 | 22.4 vs 17 | 20.7 vs 12.4 | Hypocaloric vs hypocaloric | |
| 10.40 | N/A | N/A | N/A | 25% vs 10% | 23.4 vs 27.8 | 16.8 vs 23 | 11.1 vs 20.3 | Normocaloric vs hypercaloric | |
| 11.05 | N/A | N/A | 19.5% vs 19.3% | 18.9% vs 16.1% | N/A | 11.5 vs 11 | 10.5 vs 10.2 | Very hypocaloric vs hypocaloric | |
| 13.71 | 22.4% vs 19.6% | N/A | 22.4% vs 19.6% | 30.6% vs 32.4% | N/A | 8.1 vs 7.6 | 5.7 vs 6.2 | Very hypocaloric vs hypocaloric | |
| 14.00 | 0% vs 29% | N/A | N/A | N/A | 48 vs 45 | N/A | N/A | Hypocaloric vs normocaloric | |
| N/A | N/A | N/A | 10% vs 3.3% | N/A | 19.9 vs 35.6 | N/A | 4.7 vs 17.9 | N/A | |
| N/A | N/A | N/A | 18.4% vs 28.9% | N/A | N/A | N/A | N/A | Hypocaloric vs normocaloric | |
| aLengths of hospital, ICU stays and of mechanical ventilation presented in mean days. IG = Intervention Group; CG = Control Group; N/A = Not available; vs = versus | |||||||||
| Subgroup | N participants (n studies) | Subgroup testing |
| 1. Nutrition status | ||
| 1.1. Length of hospital stay | ||
| Obese | 13 (1 RCT) | I2 = 0%, P = 0.76 |
| General | 1664 (9 RCTs) | |
| 2. Route of nutrition support | ||
| 2.1. Length of hospital stay | ||
| Parenteral | 150 (4 RCTs) | I2 = 0%, P = 0.72 |
| Enteral | 1725 (6 RCTs) | |
| 2.2. Length of ICU stay | ||
| Parenteral | 75 (2 RCTs) | I2 = 83.3%, P < 0.01 |
| Enteral | 2867 (9 RCTs) | |
| 2.3. Infectious complications | ||
| Parenteral | 137 (3 RCTs) | I2 = 0%, P = 0.35 |
| Enteral | 2667 (7 RCTs) | |
| 2.4. Length of mechanical ventilation | ||
| Parenteral | 73 (2 RCTs) | I2 = 85.4%, P < 0.01 |
| Enteral | 2927 (10 RCTs) | |
| 3. Type of participant | ||
| 3.1. Length of hospital stay | ||
| Surgical participants | 223 (5 RCTs) | I2 = 0%, P = 0.55 |
| Medical participants | 1354 (5 RCTs) | |
| 3.2. Length of ICU stay | ||
| Surgical participants | 158 (3 RCTs) | I2 = 0%, P = 0.52 |
| Medical participants | 2784 (8 RCTs) | |
| 3.3. Infectious complications | ||
| Surgical participants | 220 (4 RCTs) | I2 = 0%, P = 0.45 |
| Medical participants | 2584 (6 RCTs) | |
| 3.4. Length of mechanical ventilation | ||
| Surgical participants | 156 (3 RCTs) | I2 = 0%, P = 0.45 |
| Medical participants | 2854 (9 RCTs) | |
| 4. Amount of calories received by each study group | ||
| 4.1. Length of hospital stay | ||
| Normo‐hypercaloric | 97 (2 RCTs) | I2 = 84.1%, P < 0.01 |
| Hypocaloric | 1370 (6 RCT) | |
| Very hypocaloric | 150 ( RCT) | |
| 4.2. Length of ICU stay | ||
| Normo‐hypercaloric | 75 (2 RCTs) | I2 = 0%, P = 0.42 |
| Hypocaloric | 1517 (6 RCTs) | |
| Very hypocaloric | 1350 (3 RCTs) | |
| 4.3. Infectious complications | ||
| Normo‐hypercaloric | 97 (2 RCTs) | I2 = 0%, P = 0.94 |
| Hypocaloric | 1357 (5 RCTs) | |
| Very hypocaloric | 1350 (3 RCTs) | |
| 4.4. Length of mechanical ventilation | ||
| Normo‐hypercaloric | 73 (2 RCTs) | I2 = 73.1%, P = 0.02 |
| Hypocaloric | 1517 (6 RCTs) | |
| Very hypocaloric | 1350 (3 RCTs) | |
| RCT = randomized controlled trial; ICU = Intensive care unit | ||
| Outcome or subgroup title | No. of studies | No. of participants | Statistical method | Effect size |
| 1 Mortality in hospital Show forest plot | 9 | Risk Ratio (M‐H, Fixed, 95% CI) | Totals not selected | |
| 2 Mortality in ICU Show forest plot | 4 | Risk Ratio (M‐H, Fixed, 95% CI) | Totals not selected | |
| 3 Mortality at 30 days Show forest plot | 7 | Risk Ratio (M‐H, Fixed, 95% CI) | Totals not selected | |
| 4 Length of Hospital stay (days) Show forest plot | 10 | Mean Difference (IV, Random, 95% CI) | Totals not selected | |
| 5 Length of ICU stay (days) Show forest plot | 11 | Mean Difference (IV, Random, 95% CI) | Totals not selected | |
| 6 Infectious complications Show forest plot | 10 | Risk Ratio (M‐H, Random, 95% CI) | Totals not selected | |
| 7 Length of mechanical ventilation (days) Show forest plot | 12 | Mean Difference (IV, Random, 95% CI) | Totals not selected | |
| 8 Non‐infectious complications (diarrhoea) Show forest plot | 3 | Risk Ratio (M‐H, Random, 95% CI) | Totals not selected | |
| 9 Hyperglycaemia Show forest plot | 6 | Risk Ratio (M‐H, Random, 95% CI) | Totals not selected | |
| 10 Hypoglicaemia Show forest plot | 5 | Risk Ratio (M‐H, Fixed, 95% CI) | Totals not selected | |
| 11 Nitrogen balance (g/day) Show forest plot | 3 | Mean Difference (IV, Random, 95% CI) | Totals not selected | |