Prescripción de apoyo nutricional hipocalórico para adultos en estado grave
Resumen
Antecedentes
Hay controversias acerca de la cantidad de calorías y el tipo de apoyo nutricional que se les deben administrar a los pacientes en estado grave. Varios autores preconizan los posibles efectos beneficiosos del apoyo nutricional hipocalórico, pero la evidencia no es concluyente.
Objetivos
Evaluar los efectos del apoyo nutricional hipocalórico prescrito en comparación con el apoyo nutricional estándar en pacientes adultos en estado grave
Métodos de búsqueda
Se hicieron búsquedas en el Registro Cochrane Central de Ensayos Controlados (Cochrane Central Register of Controlled Trials) (CENTRAL, Cochrane Library), MEDLINE, Embase y en LILACS (desde su inicio hasta 20 junio 2017) con una estrategia específica para cada base de datos. También se evaluaron tres sitios web, las actas de congresos y las listas de referencias, además se estableció contacto con líderes en el campo y con la industria farmacéutica para identificar estudios no detectados/no publicados. No hubo restricciones de fecha, idioma o estado de publicación.
Criterios de selección
Se incluyeron los ensayos controlados aleatorios y cuasialeatorios que compararon el apoyo nutricional hipocalórico con el apoyo nutricional normo o hipercalórico o con ningún apoyo nutricional (p.ej. ayuno) en pacientes adultos hospitalizados en unidades de cuidados intensivos (UCI).
Obtención y análisis de los datos
Se utilizaron los procedimientos metodológicos estándar previstos por Cochrane. Se realizaron metanálisis de los datos de las comparaciones en las que la heterogeneidad clínica fue baja. Se realizaron análisis preespecificados de subgrupos y de sensibilidad, así como análisis post hoc, incluida la metarregresión. Los resultados primarios fueron: mortalidad (muerte ocurrida durante la estancia en la UCI y hospitalaria, o la mortalidad por todas las causas a los 28 a 30 días); duración de la estancia hospitalaria (días en la UCI y en el hospital); y complicaciones infecciosas. Los resultados secundarios incluyeron: duración de la ventilación mecánica. Se evaluó la calidad de la evidencia con GRADE.
Resultados principales
Se identificaron 15 ensayos con 3129 participantes en UCI de hospitales asociados a universidades de los EE.UU., Colombia, Arabia Saudita, Canadá, Grecia, Alemania e Irán. Existen dos estudios en curso. Los participantes presentaban afecciones médicas y quirúrgicas, con diversos criterios de inclusión. Cuatro estudios utilizaron nutrición parenteral y nueve estudios utilizaron solamente nutrición enteral; no estuvo claro si los dos estudios restantes utilizaron nutrición parenteral. La mayoría de los estudios no pudieron lograr las metas calóricas propuestas, lo que dio lugar a diferencias pequeñas en las calorías administradas entre los grupos de intervención y control. La mayoría de los estudios fueron financiados por el gobierno de los Estados Unidos u organizaciones no gubernamentales, pero tres estudios recibieron financiación de la industria. Cinco estudios no especificaron sus fuentes de financiación.
Los estudios incluidos presentaron heterogeneidad clínica y estadística importante. Esta heterogeneidad no permitió informar las estimaciones agrupadas de los resultados primarios y secundarios, por lo que se describen de manera narrativa.
Cuando el apoyo nutricional hipocalórico se comparó con el apoyo nutricional control en la mortalidad hospitalaria (nueve estudios, 1775 participantes), los cocientes de riesgos variaron de 0,23 a 5,54; para la mortalidad en la UCI (cuatro estudios, 1291 participantes) los cocientes de riesgos variaron de 0,81 a 5,54; y para la mortalidad a los 30 días (siete estudios, 2611 participantes) los cocientes de riesgos variaron de 0,79 a 3,00. En su mayoría estas estimaciones incluyeron el valor nulo. La calidad de la evidencia fue muy baja debido al riesgo incierto o alto de sesgo, la inconsistencia y la imprecisión.
Los pacientes que recibieron apoyo nutricional hipocalórico en comparación con apoyo nutricional control tuvieron un intervalo de duración promedio de la estancia hospitalaria de 15,70 días menos a 10,70 días más (diez estudios, 1677 participantes), un intervalo de estancia hospitalaria promedio en la UCI de 11,00 días menos a 5,40 días más (11 estudios, 2942 participantes) y un intervalo de duración promedio de la ventilación mecánica de 13,20 días menos a 8,36 días más (12 estudios, 3000 participantes). La calidad de la evidencia para este resultado fue muy baja debido al riesgo incierto o alto de sesgo en la mayoría de los estudios, la inconsistencia y la imprecisión.
Los cocientes de riesgos para las complicaciones infecciosas (diez estudios, 2804 participantes) de cada estudio individual variaron de 0,54 a 2,54. La calidad de la evidencia para este resultado fue muy baja debido a riesgo incierto o alto de sesgo, inconsistencia e imprecisión
No fue posible explicar las causas de la heterogeneidad observada mediante los análisis de subgrupos ni de sensibilidad, como tampoco mediante la metarregresión.
Conclusiones de los autores
Los estudios incluidos tuvieron heterogeneidad clínica significativa. Se encontró evidencia de muy baja calidad acerca de los efectos del apoyo nutricional hipocalórico prescrito sobre la mortalidad hospitalaria, en la UCI y a los 30 días, así como sobre la duración de la estancia hospitalaria y en la UCI, las complicaciones infecciosas y la duración de la ventilación mecánica. No hay certeza acerca de los efectos de la prescripción de alimentación hipocalórica en estos resultados, ya que el intervalo de las estimaciones incluye los efectos beneficiosos y perjudiciales.
Debido a estas limitaciones, los resultados se deben interpretar con precaución en el campo clínico, si se considera que no está claro el equilibrio entre los riesgos y los efectos perjudiciales de esta intervención. Los estudios de investigación futuros que aborden la heterogeneidad clínica de los participantes y las intervenciones, las limitaciones de los estudios y el tamaño de la muestra, podrían aclarar los efectos de esta intervención.
PICOs
Resumen en términos sencillos
¿La prescripción de apoyo nutricional con bajas calorías (hipocalórico) mejora la recuperación de los pacientes adultos en estado grave?
Pregunta de la revisión
¿La nutrición con bajas calorías administrada en el estómago o el intestino delgado (enteral), o en una vena (parenteral) mejora los resultados clínicos en los pacientes adultos en estado grave ingresados en una unidad de cuidados intensivos (UCI), en comparación con el apoyo nutricional con calorías estándar?
Los resultados principales fueron la muerte (hospitalaria, en la UCI y a los 30 días); la duración de la estancia hospitalaria y en la UCI; las complicaciones infecciosas y el período de tiempo en el que el paciente recibió ventilación mecánica (una máquina utilizada en la UCI para ayudar a que el paciente respire).
Antecedentes
Los pacientes en estado grave presentan importantes cambios metabólicos (en los que un producto químico se transforma mediante una serie de pasos en otro producto químico) durante las lesiones o la sepsis (una afección potencialmente mortal en la que la respuesta del cuerpo a la infección causa lesiones a sus propios órganos). Estos pacientes reciben apoyo nutricional para prevenir o disminuir algunos efectos adversos. Sin embargo, la sobrealimentación y la inanición pueden ser perjudiciales.
Actualmente no hay acuerdo acerca de la cantidad de calorías que se les deben administrar a estos pacientes en estado grave. La alimentación calórica normal proporciona las necesidades calóricas calculadas. La alimentación hipocalórica proporciona una cantidad intencionalmente menor de calorías.
Características de los estudios
Se incluyeron 15 ensayos con 3129 participantes con afecciones quirúrgicas o médicas en la UCI de hospitales universitarios. Cuatro estudios utilizaron la nutrición parenteral y nueve estudios utilizaron solamente la nutrición enteral. En los dos estudios restantes la vía no estuvo clara. Aunque los estudios planificaron administrar diferentes cantidades de calorías en los grupos experimental y control, la diferencia real en las calorías fue pequeña. La mayoría de los estudios fueron financiados por el gobierno de los Estados Unidos u organizaciones no gubernamentales, pero tres estudios recibieron financiación de la industria. Cinco estudios no describieron su financiación.
Resultados clave
Las diferencias en el tipo de nutrición y el tipo de participantes entre los estudios no permitieron combinar los resultados de los estudios, por lo que los diferentes resultados entre los estudios individuales se informan de manera descriptiva.
El número de muertes hospitalarias, en la UCI y a los 30 días en los que recibieron nutrición con bajas calorías fue similar a los del grupo control. La duración de la estancia hospitalaria y en la UCI, así como la duración de la ventilación mecánica, variaron entre los estudios, en ocasiones fue más corta y en ocasiones fue más larga en comparación con el grupo control. El número de infecciones también varió entre los estudios. Se intentó analizar los subgrupos de participantes para aclarar esta variación, pero los resultados no fueron consistentes.
Calidad de la evidencia
La calidad general de la evidencia para cada resultado según la clasificación GRADE varió de muy baja a baja. Lo anterior se debió a los problemas en el diseño y la realización de los estudios, la variación en los resultados de los estudios (inconsistencia entre los estudios) y la amplia variedad de resultados posibles (imprecisión).
Conclusiones de los autores
Summary of findings
| Hypocaloric nutrition compared to control for critically‐ill adults | |||
| Patient or population: critically‐ill adults Comparison: control nutritional support with a higher caloric intake than the 'intervention' group | |||
| Outcomes | Effect estimate (range of results of individual studies) | N of Participants | Quality of the evidence |
| Mortality in hospital: death occurring during the hospital stay | Range of risk ratios from 0.23 to 5.54a | 1775 (9 studies) | ⊕⊕⊝⊝ |
| Mortality in ICU: death occurred during the ICU stay | Range of risk ratios from 0.81 to 5.54a | 1291 | ⊕⊕⊝⊝ |
| Mortality at 30 days: 28 to 30 days all‐cause mortality | Range of risk ratios from 0.79 to 3.00a | 2611 | ⊕⊕⊝⊝ |
| Length of hospital stay: days stayed in the hospital | Range of length of hospital stay from 15.70 days lower to 10.70 days highera | 1677 | ⊕⊝⊝⊝ |
| Length of ICU stay: days stayed in the ICU | Range of length of ICU stay from 11.00 days lower to 5.40 days highera | 2942 | ⊕⊝⊝⊝ |
| Infectious complications: events of any type of infectious complications occurred during the hospital stay, registered by the study authors according to their diagnostic criteria of infections. | Range of risk ratios from 0.54 to 2.54a | 2804 | ⊕⊝⊝⊝ |
| Length of mechanical ventilation: days on mechanical ventilation during ICU stay | Range of mean differences: 13.20 days lower to 8.36 days highera | 3000 (12 studies) | ⊕⊝⊝⊝ |
| GRADE Working Group grades of evidence | |||
| aResults were not combined due to clinical heterogeneity. | |||
Antecedentes
Descripción de la afección
La mayoría de los pacientes en estado grave tratados por lesiones o sepsis tienen algún grado de hipermetabolismo e hipercatabolismo y no son capaces de alimentarse por sí mismos. Por estas razones se ha recomendado proporcionarles apoyo nutricional mediante vías enterales o parenterales para prevenir o disminuir la reducción de las reservas proteicas y calóricas; mejorar la síntesis proteica; y evitar deficiencias en los nutrientes esenciales y semiesenciales (Cerra 1997). Sin embargo, hay varios aspectos del apoyo nutricional para los pacientes en estado grave que aún están en discusión, como: el momento en el que iniciar el apoyo nutricional; la vía (enteral, parenteral o combinada); los requerimientos calóricos y proteicos; la cantidad y el tipo de proteínas a administrar; la composición de los lípidos; la administración de suplementos de algunos aminoácidos y micronutrientes; y la aparición y el tipo de algunas complicaciones. Varios de estos temas se trataron recientemente (Berger 2012; Biolo 2002; Bost 2014; Heyland 2003; Kreymann 2006;Preiser 2015; Wischmeyer 2012; Wischmeyer 2013), y algunos están incluidos en revisiones Cochrane en pacientes adultos (Alkhawaja 2015; Allingstrup 2015; Fuentes Padilla 2016; Lewis 2016; Tao 2014), y niños(Joffe 2016), así como en un protocolo Cochrane (Dushianthan 2016). La actual revisión se centra en el debate sobre la prescripción de alimentación hipocalórica versus normocalórica para el apoyo nutricional en los pacientes adultos en estado grave.
Durante los años setenta, el objetivo propuesto para el apoyo nutricional era proporcionar calorías suficientes para equilibrar el aumento del gasto energético medido en reposo (hipermetabolismo) y prevenir la reducción proteica. Como la calorimetría indirecta (valor de referencia [gold standard]) no está disponible en la mayoría de las unidades de cuidados intensivos (UCI) o no es posible realizarla en ciertos pacientes, es habitual calcular los requerimientos calóricos diarios mediante fórmulas. Durante años la utilizada con mayor frecuencia fue la ecuación de Long (gasto metabólico en reposo calculado por la ecuación de Benedict‐Harris, con el agregado de un factor de lesión y un factor de actividad; Long 1979). A menudo este enfoque da lugar a la sobrestimación de los requerimientos calóricos (en comparación con los valores obtenidos por calorimetría indirecta), principalmente en los pacientes ventilados y sedados (McClave 1992). También indujo un grado de sobrealimentación con el apoyo nutricional, que se asoció con varias complicaciones metabólicas (Klein 1998) como hipertrigliceridemia, aumento de la producción de CO2, esteatosis hepática e hiperglucemia, que también fue un factor independiente para el aumento de la mortalidad en los pacientes en estado grave (Badawi 2012; Krinsley 2003).
En la actualidad, se sabe que los requerimientos calóricos para el apoyo nutricional de un paciente en estado grave podrían ser diferentes del gasto energético total o en reposo calculado (Reid 2004). Se debe tener en cuenta la variabilidad debido a varios factores: presencia de lesión o sepsis (tipo, gravedad y respuesta metabólica del huésped) (Hoffer 2003); período de tiempo de la enfermedad o tiempo transcurrido en la UCI (Monk 1996; Uehara 1999); atención y tratamientos actuales en las UCI (Boulanger 1994); estado nutricional o masa magra (Zauner 2006); complicaciones y algunos factores asociados con los estados mórbidos (Magnuson 2011; Stahel 2010), y comorbilidades. Esta variabilidad contribuye a la dificultad para calcular las necesidades energéticas para el apoyo nutricional de estos pacientes (Frankenfield 2011). El uso de ecuaciones predictivas (Cooney 2012) podría ser una de las causas de la subalimentación o sobrealimentación en algunos pacientes en estado grave (Reid 2006).
Hay consenso acerca de algunos aspectos de los requerimientos calóricos y proteicos para el apoyo nutricional de los pacientes ventilados en estado grave:
a) el grado de hipermetabolismo debido a lesión o sepsis es menor que el informado al comienzo de los años setenta (Liggett 1990), en particular durante los primeros días en la UCI (Biolo 2002; Heyland 2003; Kreymann 2006);
b) el equilibrio energético positivo o neutro no logró disminuir la tasa catabólica proteica ni la pérdida de nitrógeno y no evitó el equilibrio negativo de nitrógeno ni la reducción proteica (Frankenfield 1997; Plank 2003);
c) el equilibrio energético positivo se asocia con mayor masa grasa, sin cambios en la masa magra corporal (Hart 2002; Streat 1987);
d) el determinante principal de un equilibrio de nitrógeno positivo, o menos negativo, durante el apoyo nutricional parece ser la ingesta de nitrógeno (Iapichino 1984; Weijs 2013);
e) el apoyo nutricional no modificó la tasa de catabolismo proteico, pero pudo preservar en alguna medida la pérdida de nitrógeno (menos equilibrio de nitrógeno negativo) al promover la síntesis proteica en todo el cuerpo, con una ingesta proteica de hasta 1,5 g/kg/día (Shaw 1987).
Las guías clínicas conocidas para el apoyo nutricional de los pacientes en estado grave (ASPEN / SCCM guidelines 2016; ASPEN / SCCM guidelines 2009; ESPEN guidelines 2009) en ocasiones difieren entre ellas y en la bibliografía hay debates abiertos. Por ejemplo, cuándo y cómo iniciar el apoyo nutricional; cuándo empezar la administración de lípidos por vía parenteral y el tipo de lípidos a utilizar; la función y el momento de la nutrición parenteral suplementaria; la cantidad de proteínas o el cociente calorías no proteicas/nitrógeno a prescribir; la dosis y el tipo de oligoelementos y vitaminas antioxidantes suplementarios; la mejor manera de calcular los requerimientos calóricos; si se debe optimizar la provisión calórica para prevenir el déficit calórico durante los primeros días en la UCI y disminuir las complicaciones iniciales o tardías asociadas con la desnutrición (Dvir 2006; Heidegger 2013; Rubinson 2004; Wischmeyer 2013), o si es mejor administrar la nutrición hipocalórica durante los primeros días de respuesta inflamatoria (y cambios metabólicos) intensa inducida por la lesión o la sepsis (Berger 2007; Berger 2012; Casaer 2014; Cooney 2012; Dickerson 2011; Kreymann 2012; Singer 2010; Weijs 2013; Wischmeyer 2012). Esta revisión se centra solamente en los resultados clínicos de la administración de apoyo nutricional hipocalórico en comparación con la nutrición normocalórica en pacientes adultos en estado grave.
Descripción de la intervención
Hace más de 20 años Zaloga 1994 propuso un período corto de restricción dietética durante los primeros días de una lesión aguda o sepsis, llamada originalmente "subalimentación permisiva", y un "apoyo nutricional hipocalórico" posterior (Patiño 1999). La provisión de apoyo nutricional hipocalórico con alto contenido proteico se utilizó con éxito en un grupo de pacientes obesos estresados (Dickerson 1986). Este enfoque se examinó inicialmente (Kushner 2011), por indicación de un grupo de expertos, en pacientes en estado grave (McClave 2011) y se recomendó en algunas guías clínicas (ASPEN guidelines 2013; ASPEN / SCCM guidelines 2016). La administración de apoyo nutricional hipocalórico en los pacientes en estado grave, principalmente durante los primeros días de estancia en la UCI, se ha mencionado con frecuencia en la bibliografía; se han informado cierta evidencia, así como opiniones, en varias revisiones narrativas (Boitano 2006; Berger 2007; Jeejeebhoy 2004; Malone 2007; Stapleton 2007).
De qué manera podría funcionar la intervención
Los pacientes en estado grave que presentan importantes cambios metabólicos durante la fase aguda de la respuesta inflamatoria sistémica inducida por lesión o sepsis se podrían beneficiar de este enfoque. Lo anterior se puede explicar porque: se evitan los efectos nocivos conocidos de la sobrealimentación o las consecuencias de la inanición; se reducen los trastornos metabólicos, especialmente la hiperglucemia, así como el nivel de citoquinas inflamatorias. En ciertos modelos animales, la nutrición hipocalórica durante el estrés agudo pareció reducir la morbilidad y la mortalidad. Lo anterior también podría ser posible en los pacientes en estado grave, pero los datos disponibles acerca de los posibles efectos beneficiosos de la alimentación hipocalórica no son concluyentes. Por el contrario, hay cierta evidencia de que la subalimentación se podría asociar con complicaciones y resultados peores para los pacientes en estado grave (Dvir 2006; Villet 2005), y que el efecto del apoyo nutricional hipocalórico podría ser diferente en los pacientes desnutridos y en los bien alimentados (Braunschweig 2001). Actualmente también se discute la posible función de la autofagia inducida por inanición (Marik 2016a).
Por qué es importante realizar esta revisión
Hasta el momento no existe evidencia concluyente acerca de cuántas calorías se les deben administrar a los pacientes en estado grave para mejorar los resultados y disminuir las complicaciones. Sin embargo, en la actualidad se sabe con certeza que los requerimientos calóricos son mucho menores que los propuestos en los años setenta u ochenta (Krishnan 2003; Rubinson 2004). En la actualidad, en varios países hay especialistas en cuidados intensivos o en apoyo nutricional que les proporcionan apoyo nutricional hipocalórico a la mayoría de los pacientes en estado grave durante los primeros días de la enfermedad, o que aceptan la administración de una cantidad menor de nutrición enteral que la prescrita (menos calorías que las calculadas) para sus pacientes. Lo anterior se basa más en la evidencia observacional o las opiniones de expertos que en los datos científicos.
Varios autores consideran que es importante optimizar la provisión de energía, y focalizarse en los requerimientos medidos o calculados, para evitar déficit calóricos ("deuda calórica") durante los primeros días de estancia en la UCI (Faysy 2008; Singer 2010; Singer 2011; Wischmeyer 2013; Wischmeyer 2015), o, lo que es aún más importante, focalizarse también en el suministro proteico (Weijs 2012; Weijs 2014; Hoffer 2012; Nicolo 2016), o proporcionar algunas proteínas complementarias (Alberda 2009).
Debido a estas preguntas sin respuesta, a los datos contradictorios y a sus diferentes interpretaciones, es necesario realizar revisiones sistemáticas de cada tema debatible y analizar la importancia clínica de cada enfoque nutricional. Por lo tanto, esta revisión sistemática se realizó para explorar los efectos de la nutrición hipocalórica enteral o parenteral prescrita sobre los resultados clínicos y metabólicos de los pacientes adultos en estado grave.
Objetivos
Evaluar los efectos del apoyo nutricional hipocalórico prescrito en comparación con el apoyo nutricional estándar en los pacientes adultos en estado grave.
Métodos
Criterios de inclusión de estudios para esta revisión
Tipos de estudios
Se incluyeron ensayos controlados aleatorios y cuasialeatorios. Se consideró la inclusión de ensayos controlados cuasialeatorios para ampliar la evidencia acerca de la eficacia y la seguridad del apoyo nutricional hipocalórico (Schneider 2007; Shadish 2002).
Tipos de participantes
Se incluyeron todos los participantes adultos (con 18 años de edad en adelante) hospitalizados por diferentes enfermedades y con diferente gravedad en unidades de cuidados intensivos (UCI) médicas, quirúrgicas o específicas de la enfermedad (quemaduras, traumatismo, neurológicas, etc.) y que requerían cualquier tipo de apoyo nutricional.
Criterios de exclusión: ninguno.
Tipos de intervenciones
La intervención experimental evaluada fue: apoyo nutricional hipocalórico con menos calorías totales que el gasto energético en reposo (GER) medido por calorimetría indirecta o, si no se midió, menor de 25 kcal/kg/día. Lo anterior podría hacerse a través de dosis restringidas de carbohidratos o lípidos, o ambos, con una dosis de proteínas normal o mayor. La intervención control fue:
-
Apoyo nutricional normo o hipercalórico: igual o mayor del GER medido o de 25 kcal/kg/día (con las mismas características que como se describió anteriormente); o
-
Ningún apoyo nutricional: ayuno o soluciones de dextrosa.
Se evaluaron los resultados de los ensayos diseñados para comparar el apoyo nutricional hipocalórico enteral o parenteral prescrito (o subalimentación permisiva) con el apoyo nutricional estándar, o sin nutrición, aunque dichos ensayos no alcanzaran sus metas calóricas en los grupos de intervención o control (análisis por intención de tratar). Además, no se incluyeron los ensayos que planificaron proporcionar apoyo nutricional total pero dieron lugar una provisión hipocalórica no intencional (por cualquier motivo).
Tipos de medida de resultado
Resultados primarios
Los resultados primarios fueron los siguientes resultados clínicos:
-
Mortalidad. Muerte que ocurrió durante la estancia en la UCI y en el hospital, o mortalidad por todas las causas a los 28 a 30 días.
-
Duración de la estancia. Días que permanecieron en la UCI y en el hospital.
-
Complicaciones infecciosas. Eventos de cualquier tipo de complicaciones infecciosas que ocurrieron durante la estancia hospitalaria, registrados por los autores de los estudios según sus criterios diagnósticos de infección.
Resultados secundarios
Los resultados secundarios fueron uno o más de los siguientes:
-
Duración de la ventilación mecánica. Días con ventilación mecánica en la estancia en la UCI.
-
Complicaciones no infecciosas. Eventos de cualquier complicación no infecciosa durante la estancia hospitalaria, posiblemente asociados con el estado nutricional o el apoyo nutricional, según los criterios de los autores de los estudios (por ejemplo: dehiscencia de la herida, úlceras de decúbito, etc.)
-
Resultados del metabolismo de los carbohidratos. Eventos de hiperglucemia (glucemia mayor de 150 mg/dl) durante la estancia en la UCI. Eventos de hipoglucemia (glucemia menor de 70 mg/dl) durante la estancia en la UCI.
-
Resultados del metabolismo de los lípidos. Eventos de hipertrigliceridemia (mayor de 200 mg/dl) o cualquier complicación metabólica de los lípidos asociada con el apoyo nutricional según los criterios de los autores de los estudios.
-
Resultados del metabolismo proteico. Equilibrio de nitrógeno (positivo o negativo en gramos/día) o cualquier complicación metabólica de las proteínas asociada con el apoyo nutricional según los criterios de los autores de los estudios.
-
Estado nutricional o afección clínica en el momento del alta de la UCI. Evaluación nutricional o funcional, realizada en el momento del alta de la UCI mediante cualquier método de evaluación utilizado por los autores de los estudios.
Métodos de búsqueda para la identificación de los estudios
Búsquedas electrónicas
We searched the Cochrane Central Register of Controlled Trials (CENTRAL) (Cochrane Library Issue 5, 2017); MEDLINE/Ovid (1946 to 20 June 2017); Embase (1980 to 20 June 2017), and LILACS (1992 to 20 June 2017). We developed a specific strategy for each database (see Appendix 1 for CENTRAL, Appendix 2 for MEDLINE, Appendix 3 for Embase and Appendix 4 for LILACS).
We combined the MEDLINE search strategy with the Cochrane Highly Sensitive Search Strategy phases one and two, as suggested in the Cochrane Handbook for Systematic Reviews of Interventions (Higgins 2011). The filter used to identify randomized controlled trials (RCTs) in the search strategy for MEDLINE was from Glanville 2006. For Embase we applied the trial filter for therapy maximizing sensitivity developed by Health Information Research Unit (HIRU) at McMaster University: hiru.mcmaster.ca/hiru/HIRU_Hedges_EMBASE_Strategies.aspx).
We did not apply restrictions by language or by publication status.
We also searched (up to 20 June 2017) for relevant ongoing trials in specific trial registries:
-
ClinicalTrials.Gov: clinicaltrials.gov/
-
International Clinical Trials Registry Platform: apps.who.int/trialsearch/
-
ISRCTN Registry: www.isrctn.com/
Búsqueda de otros recursos
We searched the Conference Proceedings of the annual congresses of the following four societies, as published in their respective journals, in order to find papers presented at different meetings:
-
American Society for Parenteral and Enteral Nutrition (ASPEN), through the Journal of Parenteral and Enteral Nutrition (1990 to 30 June 2017).
-
European Society for Clinical Nutrition and Metabolism (ESPEN), through the journal Clinical Nutrition (1990 to 30 June 2017).
-
Society of Critical Care Medicine (SCCM), through the journal Critical Care Medicine (1990 to 30 June 2017).
-
European Society of Intensive Care Medicine (ESICM), through the journal Intensive Care Medicine (1997 to 30 June 2017).
We also handsearched the original papers published in the following journals:
-
Journal of Parenteral and Enteral Nutrition (1990 to 30 June, 2017).
-
Clinical Nutrition (1990 to 30 June 2017).
-
Nutrition (1990 to 30 June 2017).
-
Nutrition Clinique et Métabolisme (1994 to 30 June 2017).
We also checked the reference list and citations of the relevant articles and reviews related to hypocaloric feeding and to caloric and protein requirements of critically‐ill people (1970 to 30 June 2017).
Correspondence
We contacted main authors of relevant trials and reviews to identify any additional studies, and relevant pharmaceutical companies for published and unpublished reports.
Obtención y análisis de los datos
Selección de los estudios
Three review authors (MP, ACr and CL) independently scanned the titles and abstracts of reports identified by electronic searching, manual searching, snowballing and by contacts with clinical experts and the pharmaceutical industry. We retrieved and evaluated potentially relevant studies, chosen by at least one review author, in full‐text versions. These review authors independently selected trials that met the inclusion criteria using a checklist designed in advance for that purpose. We resolved any disagreement through consultation with a fourth review author (GP). We rejected articles at the initial screening only if we could determine from the title and abstract that the study was not a report of a randomized or quasi‐randomized controlled trial; or that it did not address enteral and/or parenteral nutrition in critically‐ill adults. When we could not reject a study with certainty, we obtained the full text of the article for further evaluation.
Extracción y manejo de los datos
Two review authors (ACr and CL) independently extracted data using a standardized checklist. We registered it in the data extraction form. We resolved any disagreement through consultation with a third review author (MP).
Evaluación del riesgo de sesgo de los estudios incluidos
Two review authors (GP and CL) independently assessed risks of bias for each study using the criteria outlined in the Cochrane Handbook for Systematic Reviews of Interventions (Higgins 2011). We resolved any disagreement through discussion and consultation with a third assessor (ACi).
(1) Sequence generation (checking for possible selection bias)
We looked for the description of methods used in each included study to generate the allocation sequence, and assessed if they were adequate to produce comparable groups (unbiased selection). We classified methods as being at low, high or unclear risk of bias.
(2) Allocation concealment (checking for possible selection bias)
We looked for the description of methods used in each included study to conceal the allocation sequence and assessed if they were adequate to avoid the intervention allocation being foreseen or changed. We classified methods as being at low, high or unclear risk of bias.
(3) Blinding (checking for possible performance bias)
We looked for the description of methods used, if any, in each included study to blind study participants and personnel from knowledge of which intervention a participant received. We also considered partial blinding (e.g. where it had not been feasible to blind participants but outcome assessment was carried out without knowledge of group assignment). Where blinding was not possible we assessed whether the lack of blinding was likely to have introduced bias. We classified methods as being at low, high or unclear risk of bias.
We also assessed any information about whether the intended blinding was effective.
(4) Incomplete outcome data (checking for possible attrition bias through withdrawals, dropouts, protocol deviations)
We looked for the completeness of outcome data in each included study, for each main outcome, including attrition and exclusions from the analysis. We assessed whether attrition and exclusions were reported, the numbers included in the analysis at each stage (compared with the total randomized participants), reasons for attrition/exclusion, and any re‐inclusions in analyses. We classified methods as being at low, high or unclear risk of bias.
(5) Selective reporting bias
We assessed this by comparing the study protocol, when available, and all of the study's pre‐specified outcomes that are of interest in the review. We classified methods as being at low, high or unclear risk of bias.
(6) Other sources of bias
We looked for any important concerns about other possible sources of bias in each included study. For example, was there a potential source of bias related to the specific study design? Was the trial stopped early due to some data‐dependent process? Was there extreme baseline imbalance? Has the study been claimed to be fraudulent? Has the researcher gained sponsorship from agencies with a vested interest in the findings? We assessed whether each study was free of other problems that could put it at risk of bias. We classified methods as being at low, high or unclear risk of bias.
(7) Overall risk of bias
We made an explicit judgement about whether studies were at an overall high, low or unclear risk of bias, according to the following criteria: low risk if all six 'Risk of bias' domains were rated low for that study; unclear risk if at least one domain was rated at unclear risk; high risk if at least one domain was rated at high risk of bias.
We assessed the likely magnitude and direction of identified risks of bias, and whether we considered this could have a significant effect on the findings. We explored the impact of the level of bias through sensitivity analyses.
Medidas del efecto del tratamiento
For dichotomous outcomes we calculated risk ratios (RRs) and 95% confidence intervals (95% CIs). We calculated the mean difference (MD) for continuous outcomes measured using the same scales, or the standardized mean difference (SMD) if they used different scales.
Cuestiones relativas a la unidad de análisis
The unit of analysis was the participant in each trial arm. All included studies had a parallel‐group design, so there was no need for adjustment for a cluster or cross‐over design.
Manejo de los datos faltantes
We obtained missing data from study authors, if feasible, and performed intention‐to‐treat analyses if data were available; otherwise, we performed available‐case analyses. We investigated attrition rates, such as dropouts, losses to follow‐up and withdrawals, and we critically appraised issues of missing data. We did not impute missing data.
We contacted by email the first authors of the following included and ongoing trials:
-
Ahrens 2005. The first author sent the estimates of continuous outcomes as means and standard deviations for length of hospital and ICU stay and for length of mechanical ventilation.
-
Arabi 2015 The first author sent us the length of hospital and ICU stay and of mechanical ventilation in means and standard deviation.
-
Charles 2014 The first author sent us mean and standard deviation of days on mechanical ventilation, and additional information to complete the 'Risk of bias' table.
-
NHLBI 2012 and Rice 2011 The corresponding author sent us all the information required to render their data compatible, and also some additional unpublished results: length of hospital stay, ICU and mechanical ventilation in means and standard deviations, number of participants with infections and hyperglycaemic episodes, and amount of calories received by participants in both groups.
-
Ochoa 2017 We contacted the lead author. He replied that he would try to recover and send the requested study results, but we have not received them yet.
-
Petros 2016. The study was initially published only in abstract form. The first author sent us all the information we required from its finished but unpublished pilot study. The full paper of the pilot trial was recently published (Petros 2016).
-
Rugeles 2013 We initially identified the study before publication. The first author sent us the full paper ready to be published in advance of publication, and some additional considerations to better assess the risk of bias and the number of participants with hyperglycaemia.
-
Rugeles 2016 The first author sent us the full paper of this clinical trial before it was indexed in MEDLINE (It was registered in clinicaltrials.gov as NCT02577211). The second author gave us the means and standard deviations for length of ICU stay and of mechanical ventilation, and also some additional information to complete the 'Risk of bias' table.
-
Theodorakopoulou 2016 We did not received an answer to several questions about the abstract of the trial.
Evaluación de la heterogeneidad
In cases of statistical heterogeneity, i.e. a Chi2 test with a P value less than 0.10 or an I2 greater than 30% (Higgins 2002), we examined the potential causes of the heterogeneity by prespecified subgroup and sensitivity analyses. We followed the suggestions in Section 9.5.2 of the CochraneHandbook for Systematic Reviews of Interventions and interpreted and rated heterogeneity according to the I2 value as follows: 'not important' if 40% or less, 'moderate' with I2 between 30% and 60%, 'substantial' with I2 between 50% and 90%, and 'considerable' if I2 is higher than 75% (see Data synthesis section for levels of I2 that allowed us to report numerical results or not) (Higgins 2002).
We assessed clinical heterogeneity by considering different parameters of clinical practice. We considered the objectives and methodology of the trials, the type/severity of the participants (surgical, medical and others), and several aspects of the nutrition support, such as time to initiation, route, duration and amount of calories and protein received by the intervention and the control groups. The most important parameters of this pragmatic and subjective assessment were the amount of calories received by each group of participants, and the difference in calories received by the intervention and control groups. We defined clinical heterogeneity as 'low', 'moderate' or 'important', according to a clinical judgement about the possibility of comparing trials with small, moderate or important differences according to the above parameters.
Some of the parameters we used to define clinical heterogeneity were also used for subgroup and sensitivity analyses, to investigate the heterogeneity (Subgroup analysis and investigation of heterogeneity). In addition, where we identified important statistical or clinical heterogeneity we performed meta‐regression in order to explore the possible causes.
Evaluación de los sesgos de notificación
The search strategy included consultation with leaders in the field, the pharmaceutical industry, conference and congress proceedings and snowballing techniques to maximize the possibility of finding unpublished studies. We performed funnel plot analyses when eight or more studies were included in each outcome analysis.
Síntesis de los datos
We first reviewed the data from included studies qualitatively. Then, if possible, we combined them quantitatively by population, intervention and outcome, using Cochrane statistical software (Review Manager 2014). We based the quantitative analyses of outcomes on intention‐to‐treat (ITT) results.
In case of unimportant statistical heterogeneity between studies (I2 of 30% or less), we performed meta‐analyses using the fixed‐effect model. In case of I2 between 30% and 50%, we used a random‐effects model to produce more conservative confidence intervals. If the I2 was above 50%, we did not report pooled estimates of the meta‐analysis. In cases of important clinical heterogeneity we did not report pooled estimates of the meta‐analyses, even in the absence of statistical heterogeneity.
In the subgroup analyses we reported results using a random‐effects model if one or more of the subgroups had an I2 between 30% and 50%, for a more conservative analysis. If the total statistical heterogeneity test showed I2 above 50% or if the clinical heterogeneity was important, we did not report summary estimates of the meta‐analysis.
In all cases where it was not possible to perform or report total or subtotal analyses, we produced a short descriptive comment about the results of the studies for each outcome.
Análisis de subgrupos e investigación de la heterogeneidad
The prespecified possible causes of heterogeneity were the following:
-
Age: 18 to 65 years old, 66 to 75 years old, and more than 75 years old.
-
Primary disease of the participants: major surgery, trauma, sepsis, medical diseases.
-
Disease severity with or without organ failure: acute physiology and chronic health evaluation II (APACHE II); simplified acute physiology score II (SAPS II); sequential organ failure assessment (SOFA); multiple organ dysfunction score (MODS); logistic organ dysfunction system (LODS), other scores.
-
With or without comorbidities: assessed by the Charlson score or similar.
-
Nutrition status: obese, malnourished or well‐nourished.
-
Level of inflammation (by determination of plasma level of C reactive protein or other acute phase reactants) or hypermetabolism (by indirect calorimetry) or hypercatabolism (by measured or estimated total urinary nitrogen).
-
Amount of calories in the intervention group: low versus very low amount of calories.
After retrieval of studies, we acknowledged that there were important differences among them that we should consider in the assessment of clinical heterogeneity. We therefore added other non‐prespecified explorations of heterogeneity:
-
Subgroup analysis by route of nutrition support: enteral or parenteral nutrition.
-
Meta‐regressions (using STATA 14.1; Stata), to explore the effect of the following variables on the main outcomes: type of participants, the calories received, and the difference in calories received by the intervention and control groups.
To investigate differences between two or more subgroups we used the test for heterogeneity across subgroup results rather than across individual study results. We also calculated an I2 statistic for subgroup differences (Higgins 2011). We considered a P value less than 0.05 as statistically significant.
Análisis de sensibilidad
-
Trial design: we performed three prespecified sensitivity analyses: 1) excluding the quasi‐randomized trials: 2) excluding those studies with at least one high 'Risk of bias' criterion; and 3) in all the outcomes performed with the fixed‐effect model, we also conducted the analysis with the random‐effects model.
-
We undertook two more non‐prespecified sensitivity analyses, excluding trials with a primary goal different from prescribed hypocaloric enteral or parenteral nutrition.
'Summary of findings' table and GRADE
We present the overall quality of the evidence for selected outcomes using the GRADE approach (Schünemann 2011). This approach takes into account five criteria:
-
Risk of bias
-
Inconsistency
-
Imprecision
-
Directness
-
Publication bias
For each comparison, two review authors (JVAF, ACi) independently rated the quality of evidence for each outcome as 'high', 'moderate', 'low', or 'very low', using GRADEpro GDT software. We resolved any discrepancies by consensus, or, if needed, by arbitration by a third review author (MP).
We present the results for the comparison of hypocaloric nutrition versus control for the following outcomes:
-
Mortality in hospital
-
Mortality in ICU
-
Mortality at 30 days
-
Length of hospital stay (days)
-
Length of ICU stay (days)
-
Infectious complications
-
Length of mechanical ventilation (days)
Since meta‐analysis was not possible in most cases due to both statistical and clinical heterogeneity, we present the range of effect estimates of the individual studies along with the number of participants, number of included studies and confidence in the effect estimates (Guyatt 2011; Schünemann 2011).
Results
Description of studies
See Characteristics of included studies and Characteristics of excluded studies.
Results of the search
The search strategy from electronic databases, updated to 20 June 2017, retrieved 5055 records. We found four more studies by handsearching. One full paper was sent by the first author before it was indexed in MEDLINE (original reference in clinicaltrials.gov, with the identifier NCT02577211). After removing duplicates we screened the remaining 4880 records. After title and abstract evaluation, we eliminated 4840 records as irrelevant. We found two ongoing trials. We assessed 47 full‐text reports for eligibility and excluded 20 of them for different reasons (see Characteristics of excluded studies). We therefore included the remaining 15 studies (18 reports, Characteristics of included studies). See the updated flow diagram of the studies in Figure 1.
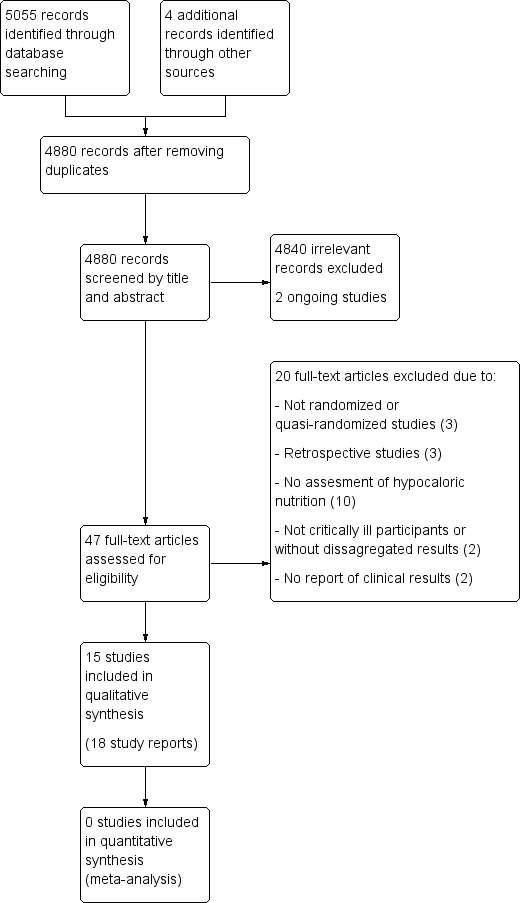
Updated study flow diagram, 20 June 2017
Included studies
Fifteen studies fulfilled the inclusion criteria (Ahrens 2005; Arabi 2011; Arabi 2015; Battistella 1997; Charles 2014; Choban 1997; Ibrahim 2002; McCowen 2000; NHLBI 2012; Norouzy 2013; Petros 2016; Rice 2011; Rugeles 2013; Rugeles 2016; Theodorakopoulou 2016). Two studies (Norouzy 2013; Theodorakopoulou 2016), were available as abstract only, so some of the study characteristics are missing.
Sample sizes
The total number of ICU participants included was 3129. The range of number of ICU participants included in the trials varied from 13 to 1000.
Setting
Eight included studies were performed in the USA, two in Colombia, one in Saudi Arabia and Canada, and one in each of the following countries: Saudi Arabia, Greece, Germany and Iran. Fourteen of the included studies were RCTs and one was a quasi‐randomized trial (Ibrahim 2002). The setting was mostly university‐associated hospitals.
Participants
Two studies (Ahrens 2005; Choban 1997), reported data of participants in the ICU and on a regular patient care floor. In those studies we only included the data of the ICU participants. The rest of the trials only included ICU participants. The type of ICU was reported in the studies as medical, medical‐surgical or trauma ICU, but after evaluating the reported diagnoses of the included participants, we considered only two categories: surgical participants in five trials (Ahrens 2005; Battistella 1997; Charles 2014; Choban 1997; McCowen 2000;), and medical participants in 10 trials (Arabi 2011; Arabi 2015, Ibrahim 2002; NHLBI 2012; Norouzy 2013; Petros 2016; Rice 2011; Rugeles 2013; Rugeles 2016; Theodorakopoulou 2016). Some inclusion criteria considered participants with specific conditions, such as hyperglycaemia (Arabi 20111), obesity (Choban 1997), sepsis (Theodorakopoulou 2016), or mechanical ventilation for at least 24 hours (Ibrahim 2002; Rice 2011). In four studies the participants received parenteral nutrition (Ahrens 2005; Battistella 1997; Choban 1997; McCowen 2000). Nine studies used only enteral nutrition (Arabi 2011; Arabi 2015; Ibrahim 2002; NHLBI 2012; Norouzy 2013; Rice 2011; Rugeles 2013; Rugeles 2016; Theodorakopoulou 2016). In two studies the indication was enteral nutrition, but if this was not possible they used parenteral nutrition (Petros 2016; Charles 2014), (see Table 1).
| Study ID | Type of participants Primary outcomes | Arm | Number of ICU participants | APACHE II score mean ± SD | Route (enteral or parenteral) | Duration of PN or EN (days) | Mechanical ventilation (% of participants) | ICU mortality % | Hospital mortality % |
| Surgical participants with PN requirement Incidence/severity hyperglycaemia and insulin received by the participants | Hypoc. | 8 (other 12 non‐ICU) | 20 ± 9 | Parenteral | 6 (4 to 10) | 100 | Not reported | Not reported | |
| Control | 10 (other 10 non‐ICU) | 19 ± 11 | 7 (5 to 10) | 80 | |||||
| Medical (mainly) and surgical participants with EN. 2 x 2 factorial trial with Intensive Insuline therapy 28 days all‐cause mortality | Hypoc. | 120 | 25 ± 8 | Enteral | Not reported | 99 | 18 | 30 | |
| Control | 120 | 25 ± 8 | 99 | 22 | 43 | ||||
| Critically‐ill participants (75% medical) 90‐day all‐cause mortality | Hypoc. | 448 | 21 ± 7.9 | Enteral | 9.1 ± 4.6 | 97.3 | 16.1 | 24.2 | |
| Control | 446 | 21 ± 8.2 | 9.4 ± 4.4 | 96.2 | 19.1 | 27.6 | |||
| Trauma participants with PN requirement Length of hospital stay, length of stay in the ICU, number of days on mechanical ventilation and infectious complications. | Hypoc. | 27 | 22 ± 5 | Parenteral | 10 | Not reported | 7.4 | Not reported | |
| Control | 30 | 23 ± 6 | 10 | 0 | |||||
| Critically‐ill surgical participants Hospital‐acquired infection | Hypoc. | 41 | 16.6 ± 0.9 | Enteral & parenteral | 12.6 ± 2.8 | 68 | N/A | 7.3 | |
| Control | 42 | 17.3 ± 0.8 | 10.4 ± 1.1 | 57 | N/A | 9.5 | |||
| Obese participants with PN requirement. Predominantly surgical diseases Achievement of nitrogen balance | Hypoc. | 6 (other 10 non‐ICU) | 13 ± 5 | Parenteral | 10 ± 3 | Not reported | Not reported | 0 | |
| Control | 7 (other 7 non‐ICU) | 15 ± 5 | 11 ± 2 | 28.6 | |||||
| Medical ICU participants with EN Incidence of ventilator‐associated pneumonia | Hypoc. | 75 | 26 ± 8 | Enteral | 5 ± 6 | 100 | Not reported | 27 | |
| Control | 75 | 25 ± 8 | 10 ± 12 | 100 | 20 | ||||
| Participants with predominantly surgical diseases requiring PN Glycaemic control and Infections | Hypoc. | 21 | not reported | Parenteral | ≥ 5 | 50 | 10 | Not reported | |
| Control | 19 | not reported | ≥ 5 | 33 | 16 | ||||
| Acute lung injury predominantly due to medical diseases (61% and 63% of participants) with EN Ventilator‐free days at study day 28 | Hypoc. | 508 | APACHE III 92 ± 28 | Enteral | 6 | 100 | Not reported | 22.4 | |
| Control | 492 | APACHE III 90 ± 27 | Enteral | 6 | 100 | 19.6 | |||
| Critically‐ill head trauma participants 28 days of all‐cause mortality | Hypoc. | 30 | Not reported | Enteral | 7 | Not reported | Not reported | 10.7a | |
| Control | 30 | 7 | 3.8a | ||||||
| Medical ICU with EN and/or PN requirement Glycaemic control and mortality | Hypoc. | 46 | 31 ± 9 | Enteral & parenteral | 7 | not reported | 22 | 37 | |
| Control | 54 | 28 ± 8 | 7 | 22 | 31 | ||||
| Acute lung injury, predominantly due to medical diseases with EN Ventilator‐free days at study day 28 | Hypoc. | 98 | 27 ± 8 | Enteral | 6 ± 4 | 100 | Not reported | 22 | |
| Control | 102 | 27 ± 7 | 5 ± 3 | 100 | 20 | ||||
| Medical ICU participants with EN requirement Change in SOFA score at 48 hours | Hypoc. | 40 | 14 ± 5 | Enteral | 7 | Not reported | Not reported | Not reported | |
| Control | 40 | 15 ± 6 | |||||||
| Medical ICU participants with EN requirement Change in SOFA score at 48 hours | Hypoc. | 60 | 13.5 ± 6.4 | Enteral | 7 | Not reported | Not reported | 30a | |
| Control | 60 | 13.7 ± 6.8 | 27a | ||||||
| Septic, mechanically ventilated critically‐ill participants 28‐day mortality | Hypocal. | Total sample of 74 participants | Total sample 22 ± 4 | Enteral | Not reported | Not reported | Not reported | Not reported | |
| Control |
a28‐day mortality.
EN = Enteral nutrition; ICU = Intensive Care Unit; N/A: not available; PN = Parenteral nutrition; SOFA = Sequential Organ Failure Assessment
Interventions and study design
All studies had a parallel‐group design, except for two (Arabi 2011; NHLBI 2012) which had a factorial design. These also evaluated, respectively, intensive insulin treatment versus standard insulin treatment, and a nutritional supplement containing omega‐3 fatty acids and antioxidants versus an isocaloric formula. The 15 included studies had a control group with prescribed normocaloric nutrition support. None of the included studies had fasting or only hydration as a comparator. See Table 1; Table 2. Most of the included studies did not achieve the proposed caloric target, with a difference in calories between the intervention and control groups in the range of 2 to 14 kcal/kg/day.
| Studies | How data was reported | Hypocaloric (intervention) group | Control group | Calories received by the "hypocaloric" intervention group (kcal/kg/day) | Calories received by the "normocaloric" control group (kcal/kg/day) | Categories denominated by the calories really received in the intervention and the control groups a |
| Total calories/kg/day (median (IQ))b | 26.6 (26.2 to 27.5) | 37 (36.0 to 38.4) | 26.60 (median) | 37.00 (median) | Normocaloric vs hypercaloric | |
| Protein g/kg/day (mean± SD) | 1.61 ± 0.13 | 1.53 ± 0.26 | ||||
| Calories/day (mean ± SD) | 1066.6 ± 306.1 | 1251.7 ± 432.5 | 13.85 | 16.40 | Hypocaloric vs hypocaloric | |
| Protein g/day (mean ± SD) | 47.5 ± 21.2 | 43.6 ± 18.9 | ||||
| Calories/day (mean ± SD) | 835 ± 297 | 1299 ± 2470 | 10.56 | 16.04 | Hypocaloric vs hypocaloric | |
| Protein g/day (mean ± SD) | 57 ± 24 | 59 ± 25 | ||||
| Calories/kg ideal body weight/day (mean ± SD) | 27.4 ± 2 | 34.4 ± 2 | 27.4 (of ideal body weight) | 34.4 (of ideal body weight) | Normocaloric vs. normocaloric | |
| Protein g/kg ideal body weight/day (mean± SD) | 1.6 ± 0.1 | 1.6 ± 0.2 | ||||
| Calories/kg/day (mean ± SD) | 12.3 ± 0.7 | 17.1 ± 1.1 | 12 | 17 | Hypocaloric vs hypocaloric | |
| Protein g/kg/day (mean ± SD) | 1.1 ± 0.1 | 1.1 ± 0.1 | ||||
| Kcal/kg actual body weight/day (mean ± SD) Kcal/kg ideal body weight/day (mean ± SD) | 8.6 ± 2.39 13.88 ± 2.87 | 17.45 ± 4.06 27.99 ± 3.83 | 14.00 (of ideal body weight) | 28.00 (of ideal body weight) | Hypocaloric vs normocaloric | |
| Protein g/kg actual body weight/day (mean ± SD) Protein g/kg ideal body weight/day (mean ± SD) | 1.2 ± 0.2 2.0 ± 0.1 | 1.2 ± 1.2 2.0 ± 0.1 | ||||
| Calories/day (mean ± SD) | 126 ± 115 | 474 ± 400 | 1.53 | 5.81 | Very hypocaloric vs very hypocaloric | |
| Proteins g/day (mean) (mean ± SD) | 5.3 ± 5.3 | 18.7 ± 15.4 | ||||
| Calories/kg/day (mean ± SD) | 14 ± 3 | 18 ± 4 | 14.30 | 18.40 | Hypocaloric vs hypocaloric | |
| Proteins g/kg/day (mean ± SD) | 1.1 ± 0.2 | 1.3 ± 0.2 | ||||
| Calories/day (mean ± SD) | 399 ± 225 | 1365 ± 596 | 4.64 (estimated by kcal/day divided by weight from the baseline table) | 15.69 (estimated by kcal/day divided by weight from the baseline table) | Very hypocaloric vs hypocaloric | |
| Proteins: information not collected | ‐ | ‐ | ||||
| Calories/kg/day (mean ± SD) | Not reported | Not reported | N/A | N/A | N/A | |
| Protein g/kg/day (mean ± SD) | Not reported | Not reported | ||||
| Calories/kg/day (mean ± SD) | 11.3 ± 3.1 | 19.7 ± 5.7 | 11.30 | 19.70 | Hypocaloric vs hypocaloric | |
| Protein | Data not reported | Data not reported | ||||
| Calories/day (mean ± SD of study days 1 to 5) | 300 ± 149 | 1418 ± 686 | 3.60 | 17.31 | Very hypocaloric vs hypocaloric | |
| Proteins g/day (mean ± SD of study days 1 to 5) | 10.9 ± 6.8 | 54.4 ± 33.2 | ||||
| Calories/kg/day (mean ± SD) | 12 ± 3.9 | 14 ± 6.2 | 12.00 | 14.00 | Hypocaloric vs hypocaloric | |
| Protein g/kg/day (mean ± SD) | 1.4 ± 0.44 | 0.76 ± 0.32 | ||||
| Total calories/kg ideal body weight/day (mean ± SD) | 12.6 ± 3.4 | 20.5 ± 5.1 | 13 | 21 | Hypocaloric vs hypocaloric | |
| Protein g/kgIBW/day (mean ± SD) | 1.4 ± 0.4 | 1.4 ± 0.3 | ||||
| Calories/day (mean ± SD) | 962 ± 314 | 1308 ± 513 | Not reported Estimatedc 16.63 kcal/kg/day | Not reported Estimatedc 22.62 kcal/kg/day | Estimatedc Hypocaloric vs normocaloric | |
| Protein g/day (mean ± SD) | 57 ± 24 | 59 ± 25 | Not reported Estimatedc 0.99 g/kg/day | Not reported Estimatedc 1.02 g/kg/day |
aCategories denominated by the amount of calories really received by both study groups, according to the following: very hypocaloric = < 10 kcal/kg/day; hypocaloric = ≥ 10 to < 25 kcal/kg/day; normocaloric = ≥ 25 to < 35 kcal/kg/day; hypercaloric = ≥ 35 kcal/kg/day.
bIQ: interquartile range ‐ Median total calories received by all 20 participants (ICU and non‐ICU participants) in each group (the total calories received by the 8 and 10 ICU participants in each group were not reported).
cNot reported in the abstract. The numbers are a crude estimation of kcal and grams of protein/kg/day from the whole sample data of height and BMI.
BMI = Body Mass Index; g = gram; ICU = Intensive Care Unit; kcal = kilocalories; N/A: not available; SD = standard deviation; vs = versus
Outcomes
For full details of the reported outcomes see Table 3 and Characteristics of included studies.
| Study | Difference in calories between groups (kcal/kg/day) | Hospital mortality (%) IG vs CG | ICU mortality (%) IG vs CG | Mortality at 30 days (%) IG vs CG | Infectious complications (%) IG vs CG | Length of hospital stay (days)a IG vs CG | ICU length of stay (days)a IG vs CG | Length of mechanical ventilation (days)a IG vs CG | Categories denominated by the calories really received in the intervention and the control groupsb |
| 2.00 | N/A | N/A | N/A | N/A | N/A | 9.5 vs 10.4 | 8.5 vs 9.7 | Hypocaloric vs hypocaloric | |
| 2.55 | 30% vs 42.5% | 17.5% vs 21.7% | 18.3% vs 23.3% | 44.2% vs 46.7% | 70.2 vs 67.2 | 11.7 vs 14.5 | 10.6 vs 13.2 | Hypocaloric vs hypocaloric | |
| 4.10 | 9.5% vs 15.8% | N/A | N/A | 28.6% vs 52.6% | 19 vs 17 | N/A | N/A | Hypocaloric vs hypocaloric | |
| 4.28 | 26.7% vs 20% | N/A | N/A | 30.7% vs 49.3% | 16.7 vs 22.9 | 9.8 vs 13.6 | 8.1 vs 12.9 | Very hypocaloric vs very hypocaloric | |
| 5.00 | 7.3% vs 9.5% | N/A | N/A | 56.1% vs 57.1% | 35.2 vs 31 | 16.7 vs 13.6 | 10.8 vs 8.3 | Hypocaloric vs hypocaloric | |
| 5.48 | 24.2% vs 27.6% | 16.1% vs 19.1% | 20.8% vs 21.8% | 35.9% vs 37.9% | 48.3 vs 54.4 | 15.8 vs 16.4 | 11.3 vs 13.5 | Hypocaloric vs hypocaloric | |
| 7.00 | 7.4% vs 0% | 7.4% vs 0% | N/A | 48.2% vs 73.3% | 27 vs 39 | 18 vs 29 | 15 vs 27 | Normocaloric vs normocaloric | |
| 7.90 | N/A | N/A | 30% vs 26.7% | N/A | N/A | 13.2 vs 13.5 | 10.8 vs 10.8 | Hypocaloric vs hypocaloric | |
| 8.40 | 37% vs 31.5% | 21.7% vs 22.2% | 39.1% vs 33.3% | 28.3% vs 11.1% | 38.1 vs 27.4 | 22.4 vs 17 | 20.7 vs 12.4 | Hypocaloric vs hypocaloric | |
| 10.40 | N/A | N/A | N/A | 25% vs 10% | 23.4 vs 27.8 | 16.8 vs 23 | 11.1 vs 20.3 | Normocaloric vs hypercaloric | |
| 11.05 | N/A | N/A | 19.5% vs 19.3% | 18.9% vs 16.1% | N/A | 11.5 vs 11 | 10.5 vs 10.2 | Very hypocaloric vs hypocaloric | |
| 13.71 | 22.4% vs 19.6% | N/A | 22.4% vs 19.6% | 30.6% vs 32.4% | N/A | 8.1 vs 7.6 | 5.7 vs 6.2 | Very hypocaloric vs hypocaloric | |
| 14.00 | 0% vs 29% | N/A | N/A | N/A | 48 vs 45 | N/A | N/A | Hypocaloric vs normocaloric | |
| N/A | N/A | N/A | 10% vs 3.3% | N/A | 19.9 vs 35.6 | N/A | 4.7 vs 17.9 | N/A | |
| N/A | N/A | N/A | 18.4% vs 28.9% | N/A | N/A | N/A | N/A | Hypocaloric vs normocaloric |
aLengths of hospital, ICU stays and of mechanical ventilation presented in mean days.
bCategories denominated by the amount of calories really received by both study groups, according to the following: very hypocaloric = < 10 kcal/kg/day; hypocaloric = ≥ 10 to < 25 kcal/kg/day; normocaloric = ≥ 25 to < 35 kcal/kg/day; hypercaloric = ≥ 35 kcal/kg/day.
IG = Intervention Group; CG = Control Group; N/A = Not available; vs = versus
Funding
Studies were funded by non‐governmental associations or foundations (Arabi 2015; Choban 1997; Ibrahim 2002), or by the US government (Battistella 1997; Charles 2014; NHLBI 2012; Rice 2011). Three studies received funding from the industry (Arabi 2011; Rugeles 2013; Rugeles 2016), and five studies did not specified their sources of funding (Ahrens 2005; McCowen 2000; Norouzy 2013; Petros 2016; Theodorakopoulou 2016).
Excluded studies
Out of the 47 full papers we initially assessed for eligibility, we finally excluded 20 for the following reasons:
-
Three were not randomized or quasi‐randomized controlled trials (Alberda 2009; Arabi 2010; Müller 1995).
-
Three were retrospective studies (Casadei 2006; Dickerson 2002; Lau 2010).
-
Ten studies did not assess hypocaloric nutrition (Desachy 2008; Dissanaike 2007; Doig 2013; Fiaccadori 2005; Garrel 1995; Mackenzie 2005; Moses 2009; Rodríguez 2005; Esterle 2010; Wewalka 2010).
-
Two studies did not include critically‐ill participants or only some of them without disaggregated results (Owais 2014; Schricker 2005).
-
Two studies did not report clinical results (Berg 2013; Iapichino 1990).
Refer to the Characteristics of excluded studies for further details.
Studies awaiting classification
There are no studies awaiting classification.
Ongoing studies
There are two ongoing studies.
We identified one study (NCT01665664) through clinical trial registries. It is set in Israel, and plans to include adult participants with mechanical ventilation and to compare hypocaloric nutrition to normocaloric nutrition. The study outcomes include all‐cause mortality, ICU mortality, hospital mortality, length of stay (hospital and ICU), length of mechanical ventilation, rate of infections, ventilator‐free days and rate of ventilator‐associated pneumonia. This study was last verified in 2012 in ClinicalTrials.gov and was "not recruiting". We were unsuccessful in contacting the study author.
We identified the second ongoing study in a conference proceeding (Ochoa 2017). This multicentre RCT includes adult, obese, critically‐ill and mechanically ventilated participants requiring enteral nutrition, and compares hypocaloric versus normocaloric enteral nutrition support. The study outcomes include events of hyperglycaemia and hypoglycaemia. Since the abstract included limited information about a preliminary interim analysis we contacted the study author for further information. This study is funded by Nestlé Health Science.
Refer to the Characteristics of ongoing studies
Risk of bias in included studies
We assessed seven domains of possible biases, according to prespecified criteria. Details for each included study are provided in their corresponding 'Risk of bias' table in the Characteristics of included studies. A graphical summary can be seen in Figure 2 and Figure 3 (showing overall percentages of risk level for each domain, and levels of risk of bias for each study, respectively).
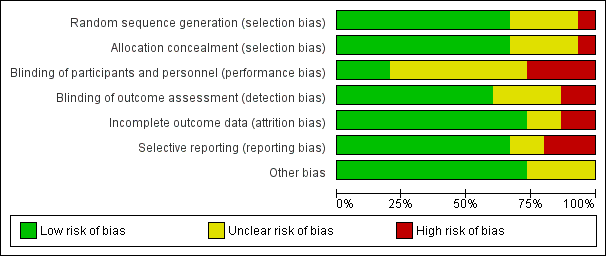
Risk of bias graph: review authors' judgements about each risk of bias domain presented as percentages across all included studies.

Risk of bias summary: review authors' judgements about each risk of bias domain for each included study. Red colour represents high risk of bias; green, low risk of bias; and yellow, unclear risk of bias.
Overall, only one study had low risk of bias in all the evaluated domains (Ahrens 2005). Six studies had at least one high 'Risk of bias' criterion (Arabi 2015; Charles 2014; Ibrahim 2002; McCowen 2000; Rugeles 2013; Rugeles 2016). The eight remaining studies had at least one unclear 'Risk of bias' criterion. In six of them (Arabi 2011; Battistella 1997, NHLBI 2012; Norouzy 2013; Petros 2016; Rice 2011), this was attributable to an unblinded study design. In these cases, although most outcomes were objective or well‐defined with low risk of detection bias, the descriptions of the processes of care by clinical personnel did not have enough detail to assess whether this could have led to a performance bias.
For publication bias, the funnel plots for the outcomes with at least eight trials did not show significant asymmetry.
Allocation
The random sequence generation and the allocation concealment were appropriately performed in 10 studies (Ahrens 2005; Arabi 2011; Arabi 2015; Charles 2014; Choban 1997; NHLBI 2012; Petros 2016; Rice 2011; Rugeles 2013; Rugeles 2016). One study was quasi‐randomized (Ibrahim 2002), and therefore had a high risk of bias. Four studies (Battistella 1997; McCowen 2000; Norouzy 2013; Theodorakopoulou 2016) did not clearly describe these processes, and we classified them as being at unclear risk of bias.
Blinding
Lack of blinding (open‐label or blinding only participants) was the main driver of the high or unclear risks of bias in most studies (Arabi 2011; Arabi 2015; Battistella 1997; Charles 2014; Ibrahim 2002; McCowen 2000; NHLBI 2012; Petros 2016; Rice 2011; Norouzy 2013; Rugeles 2016; Theodorakopoulou 2016). The inherent difficulty of blinding a nutrition support strategy in critically‐ill people explains the fact that 80% of the studies could not blind the healthcare personnel. Nevertheless, three studies managed to do it (Ahrens 2005; Choban 1997; Rugeles 2013).
Incomplete outcome data
Only two studies had a high risk of attrition bias (McCowen 2000; Rugeles 2013). They excluded participants because they did not fulfil the prespecified follow‐up criteria. Nevertheless, they should have reported all included participants in an intention‐to‐treat analysis. We classified two studies as being at unclear risk, due to a lack of information in these trials which were only published as conference abstracts (Norouzy 2013; Theodorakopoulou 2016). The other 11 studies reported outcomes for all included participants .
Selective reporting
Three studies had a high risk of reporting bias (Ibrahim 2002; McCowen 2000; Rugeles 2013). For Ibrahim 2002, some prespecified secondary outcomes (duration of mechanical ventilation, need for gastrostomy tube) were not reported. For McCowen 2000, "nitrogen balance was only measured in 12 participants (57%) in the hypocaloric and 10 (53%) of the control group, usually because of an error during collection". Rugeles 2013 did not report mortality. The authors justified this by explaining that they excluded participants who did not fulfil the 96 hours of enteral nutrition requirement. They therefore did not report mortality because this result would have been biased (they only measured mortality in participants who completed the 96 hours). A better approach would have been to perform an intention‐to‐treat analysis and also to report premature deaths. In Norouzy 2013 and Theodorakopoulou 2016, the information was not provided, so we classified them as being at unclear risk. We rated all the other studies at low risk of reporting bias.
Other potential sources of bias
Choban 1997 was partially funded by a corporation. Since we could not guarantee that this sponsorship had no material interest in the findings of the study, we classified it as being at unclear risk of bias.
The lack of detail in the description of the methods section of McCowen 2000 could not warrant a 'low risk' rating for Other sources of bias. We therefore classified it as being at unclear risk of bias. Due to the lack of information in the abstracts of Norouzy 2013 and Theodorakopoulou 2016 we also classified them as being at unclear risk of Other potential sources of bias.
Effects of interventions
The 15 included studies showed significant clinical heterogeneity between them, mainly related to the amount of calories provided to the intervention and control groups (Table 2), and also to some differences in trials methodology, the target participants and the feeding strategies. As stated in Assessment of heterogeneity and in Data synthesis, the degree of clinical or statistical heterogeneity precluded us from reporting the numerical summary results of the meta‐analysis for all the primary and secondary outcomes (Analysis 1.1 to Analysis 1.11). We used similar criteria to report the sensitivity or subgroup analyses.
When we could not report results due to clinical or statistical heterogeneity or both, we did a qualitative synthesis of the trial results. We also reported trial results of the included studies in tabular form: percentages and means of the hypocaloric and the control group of the seven main outcomes (Table 3).
Primary outcomes
1.1 Mortality in hospital
For this outcome we found nine relevant trials (1775 participants) (Arabi 2011; Arabi 2015; Battistella 1997; Charles 2014; Choban 1997; Ibrahim 2002; McCowen 2000; Petros 2016; Rice 2011). We found no statistical heterogeneity (I2 = 0%) but important clinical heterogeneity due to the differences in the underlying diagnoses of the medical or surgical ICU participants and the route/characteristics of administration of enteral or parenteral nutrition or both, but mainly to the wide differences in calories and protein received by the participants in the included trials (Table 1; Table 2). We therefore did not pool the point estimates in meta‐analysis (Analysis 1.1). There were 210 deaths in the 881 participants who received hypocaloric nutrition, and 235 deaths in the 894 participants who received the control intervention. All studies suffered from imprecision and their confidence intervals included the null value (Analysis 1.1). The central estimates of risk ratios for hospital mortality of each individual studies ranged from 0.23 to 5.54. When we excluded Battistella 1997, the range of risk ratio estimates was narrower, since this study has a more extreme estimate due to small sample size and zero events in the control group. The quality of the evidence for this outcome was very low, due to high risk of attrition bias, imprecision and inconsistency (wide variance of point estimates across studies) (Summary of findings table 1).
1.2 Mortality in the intensive care unit (ICU)
We found four relevant trials for this outcome (1291 participants) (Arabi 2011; Arabi 2015; Battistella 1997; Petros 2016). We found no statistical heterogeneity (I2 = 0%) but important clinical heterogeneity due to the type of participants, the nutrition methodology and the amount of calories received by the participants (Table 1; Table 2). We therefore have not pooled the point estimates (Analysis 1.2). There were 105 deaths in the 641 participants who received hypocaloric nutrition, and 123 deaths in the 650 participants who received the control intervention. All studies suffered from imprecision and their confidence intervals included the null value (Analysis 1.2). The central estimates of risk ratios for ICU mortality of each individual studies ranged from 0.81 to 5.54. When we excluded Battistella 1997, the range of risk ratio estimates was narrower, since this study has a more extreme estimate due to small sample size and zero events in the control group. The quality of the evidence for this outcome was very low, due to a high risk of attrition bias, imprecision and inconsistency (wide variance of point estimates across studies) (Summary of findings table 1).
1.3 Mortality at 30 days
For this outcome we found seven relevant trials (2611 participants) (Arabi 2011; Arabi 2015; NHLBI 2012; Norouzy 2013; Petros 2016; Rice 2011; Rugeles 2016). We found the abstract of an additional trial (Theodorakopoulou 2016), with mortality reported narratively for 38 participants. We found no statistical heterogeneity (I2 = 0%) but important clinical heterogeneity due to participants' diagnoses, type and characteristics of the nutrition support, the amount of calories and the differences in calories received by the participants of both groups in the analysed trials (Table 1; Table 2). We therefore did not pool the point estimates (Analysis 1.3). There were 275 deaths in the 1309 participants who received hypocaloric nutrition, and 275 deaths in the 1302 participants who received the control intervention. All studies suffered from imprecision and their confidence intervals included the null value (Analysis 1.3). The central estimates of risk ratios for mortality at 30 days of the individual studies ranged from 0.79 to 3.00. The quality of the evidence for this outcome was very low, due to a high risk of attrition bias, imprecision and inconsistency (wide variance of point estimates across studies) (Summary of findings table 1).
2. 1 Length of hospital stay (days)
We found 10 relevant trials for this outcome (1677 participants) (Ahrens 2005; Arabi 2011; Arabi 2015; Battistella 1997; Charles 2014; Choban 1997; Ibrahim 2002; McCowen 2000; Norouzy 2013; Petros 2016). We found considerable statistical heterogeneity (I2 = 78%) and important clinical heterogeneity due to differences in participants, nutrition methodology, and calories received by the participants of the intervention and control groups (Table 1; Table 2). We therefore did not pool the estimates (Analysis 1.4). Participants who received hypocaloric nutrition support had a mean length of stay of 15.70 days lower to 10.70 days higher compared to those with normocaloric nutrition support. The quality of the evidence for this outcome was very low, due to unclear or high risk of bias in most studies, inconsistency and imprecision (Summary of findings table 1).
2. 2 Length of ICU stay (days)
For this outcome we found 11 relevant trials (2942 participants) (Ahrens 2005; Arabi 2011; Arabi 2015; Battistella 1997; Charles 2014; Ibrahim 2002; NHLBI 2012; Petros 2016; Rice 2011; Rugeles 2013; Rugeles 2016). We found considerable statistical heterogeneity (I2 = 81%) and important clinical heterogeneity due to differences in the type of participants, nutrition methodology and the differences in total amount of calories and protein received by the participants, as well as the caloric difference between the groups in each trial ( Table 1; Table 2). We therefore have not pooled the effect estimates (Analysis 1.5). Participants who received hypocaloric nutrition support had a mean length of stay 11.00 days lower to 5.40 days higher compared to those with normocaloric nutrition support. The quality of the evidence for this outcome was very low, due to unclear or high risk of bias in most studies, inconsistency and imprecision (Summary of findings table 1).
3. Infectious complications. Events of any type of infectious complications occurring during the hospital stay, registered by the study authors according to their diagnostic criteria of infections
Ten studies reported this outcome (2804 participants) (Ahrens 2005; Arabi 2011; Arabi 2015; Battistella 1997; Charles 2014; Ibrahim 2002; McCowen 2000; NHLBI 2012; Petros 2016; Rice 2011). We found moderate statistical heterogeneity (I2 = 49%) and important clinical heterogeneity due to the type of participants, study methodology and amount of calories and protein received by the participants (Table 1; Table 2). We therefore have not pooled the estimates. There were 423 participants with infections in the 1404 participants who received hypocaloric nutrition, and 438 infections in the 1400 participants who received the control intervention. Most studies suffered from imprecision and their confidence intervals included the null value (Analysis 1.6). The range of the central estimate of risk ratios for infectious complications of the individual studies ranged from 0.54 to 2.54. The quality of the evidence for this outcome was very low, due to unclear or high risk of bias, inconsistency and imprecision (Summary of findings table 1).
Secondary outcomes
1. Length of mechanical ventilation. Days on mechanical ventilation during ICU stay
For this outcome we found 12 relevant trials (3000 participants) (Ahrens 2005; Arabi 2011; Arabi 2015; Battistella 1997; Charles 2014; Ibrahim 2002; NHLBI 2012; Norouzy 2013; Petros 2016; Rice 2011; Rugeles 2013; Rugeles 2016). We found substantial statistical heterogeneity (I2 = 69%) and important clinical heterogeneity due to the type of participants, nutrition methodology and the differences in the amount of calories and protein received by the participants, as well as the caloric difference between the groups in each trial (Table 1; Table 2). We therefore did not pool the effect estimates. Participants who received hypocaloric nutrition support had a mean length of mechanical ventilation of 13.20 days lower to 8.36 days higher compared with those with normocaloric nutrition support. The quality of the evidence for this outcome was very low, due to unclear or high risk of bias in most studies, inconsistency and imprecision (Analysis 1.7; summary of findings Table for the main comparison).
2. Non‐infectious complications. Events of any non‐infectious complication during the hospital stay, potentially associated with the nutrition status or the nutrition support, according to the criteria of the study authors (diarrhoea)
Three studies reported this outcome (1994 participants) (Arabi 2015; NHLBI 2012; Petros 2016). We found considerable statistical heterogeneity (I2 = 76%) and important clinical heterogeneity due to the type of participants, nutrition methodology and the differences in the amount of calories and protein received by the participants, as well as the caloric difference between the groups in each trial (Table 1, Table 2). We therefore did not pool the effect estimates. There were 187 participants with non‐infectious complications (diarrhoea) in the 1002 participants who received hypocaloric nutrition, and 242 participants with non‐infectious complications in the 992 participants who received the control intervention. Most studies suffered from imprecision and their confidence intervals included the null value. The range of the central estimate of risk ratios for non‐infectious complications of the individual studies ranged from 0.32 to 0.85. The quality of the evidence for this outcome was very low, due to unclear or high risk of bias, inconsistency and imprecision (Analysis 1.8).
3.1 Carbohydrate metabolic outcomes: hyperglycaemia (glycaemia higher than 150 mg/dl) during ICU stay
For this outcome we found six relevant trials (1380 participants) (Ahrens 2005; McCowen 2000; NHLBI 2012; Petros 2016; Rugeles 2013; Rugeles 2016). We found substantial statistical heterogeneity (I2 = 62%) with moderate clinical heterogeneity due to the type of participants, nutrition methodology and the differences in the amount of calories and protein received by the participants, as well as the caloric difference between the groups in each trial (Table 1; Table 2). We therefore did not pool the effect estimates. There were 205 participants who suffered hyperglycaemia in the 695 participants who received hypocaloric nutrition, and 279 participants who suffered hyperglycaemia in the 685 participants who received the control intervention. Most studies suffered from imprecision and their confidence intervals included the null value. The central estimate of risk ratios for hyperglycaemia of the individual studies ranged from 0.36 to 0.93. The quality of the evidence for this outcome was very low, due to unclear or high risk of bias, inconsistency and imprecision (Analysis 1.9).
3.2 Carbohydrate metabolic outcomes: events of hypoglycaemia (glycaemia lower than 70 mg/dl) during ICU stay
We found five relevant trials for this outcome (1394 participants) (Ahrens 2005; Arabi 2011; Arabi 2015; Petros 2016; Rugeles 2016). We found no statistical heterogeneity (I2 = 0%) but important clinical heterogeneity due to the type of participants, nutrition methodology and the differences in the amount of calories and protein received by the participants , as well as the caloric difference between the groups in each trial (Table 1; Table 2). We therefore did not pool the effect estimates. There were 46 participants who suffered hypoglycaemia in the 694 participants who received hypocaloric nutrition, and 38 participants who suffered hypoglycaemia in the 700 participants who received the control intervention. Most studies suffered from imprecision and their confidence intervals included the null value. The central estimate of risk ratios for hypoglycaemia of the individual studies ranged from 0.85 to 1.76. In Rugeles 2016, a risk ratio was not estimable due to no events in either group. The quality of the evidence for this outcome was low, due to unclear or high risk of bias and imprecision (Analysis 1.10).
4. Lipid metabolic outcomes. Events of hypertriglyceridaemia (higher than 200 mg/dl) or any lipid metabolic complication associated with the nutrition support according to the criteria of the study authors
None of the included trials reported this outcome
5. Protein metabolic outcomes: nitrogen balance
For this outcome we found three relevant trials (92 participants) (Battistella 1997; Choban 1997; McCowen 2000). We found substantial statistical heterogeneity (I2 = 72%) with moderate clinical heterogeneity due to the type of participants, nutrition methodology and the differences in the amount of calories and protein received by the participants, as well as the caloric difference between the groups in each trial (Table 1; Table 2). We therefore did not pool the effect estimates (Analysis 1.11). Participants who received hypocaloric nutrition support had a mean nitrogen balance of −7.70 g/day to +2.00 g/day compared to those with normocaloric nutrition support. The quality of the evidence for this outcome was very low, due to unclear or high risk of bias in most studies, inconsistency and imprecision (Analysis 1.11).
6. Nutrition status or clinical condition at ICU discharge. Nutrition or functional evaluation, made at the time of ICU discharge with any method of assessment used by the study authors.
None of the included trials reported this outcome
Subgroup analyses
We focused our subgroup analyses on the seven outcomes reported in summary of findings Table for the main comparison. Out of these seven outcomes only four had considerable statistical heterogeneity: length of hospital and ICU stay, infectious complications and length of mechanical ventilation. We explored sources of statistical heterogeneity and assessed whether meta‐analysis was possible, considering clinical heterogeneity in the predefined subgroups.
Due to insufficient information available, we were unable to perform subgroup analysis by: age, disease severity, presence of comorbidities, nutrition status (malnourished or well‐nourished), level of inflammation, hypermetabolism or hypercatabolism. It was only possible to perform prespecified subgroup analyses by: obesity status (as a condition of nutrition status), type of underlying medical condition (surgical or medical), amount of calories actually received by participants in the intervention and control groups. During the process of data extraction we realized that the included trials had several methodological differences between them. At this time (before any analysis of results), we decided to perform two additional analyses not prespecified in the protocol (Subgroup analysis and investigation of heterogeneity): subgroup analysis by route of nutrition support (enteral or parenteral) and meta‐regression (see below). The I2 values for these subgroup analyses are shown in Table 4. Most of the subgroup analyses were unable to explain the statistical heterogeneity of the results across studies:
| Subgroup | N participants (n studies) | Subgroup testing |
| 1. Nutrition status | ||
| 1.1. Length of hospital stay | ||
| Obese | 13 (1 RCT) | I2 = 0%, P = 0.76 |
| General | 1664 (9 RCTs) | |
| 2. Route of nutrition support | ||
| 2.1. Length of hospital stay | ||
| Parenteral | 150 (4 RCTs) | I2 = 0%, P = 0.72 |
| Enteral | 1725 (6 RCTs) | |
| 2.2. Length of ICU stay | ||
| Parenteral | 75 (2 RCTs) | I2 = 83.3%, P < 0.01 |
| Enteral | 2867 (9 RCTs) | |
| 2.3. Infectious complications | ||
| Parenteral | 137 (3 RCTs) | I2 = 0%, P = 0.35 |
| Enteral | 2667 (7 RCTs) | |
| 2.4. Length of mechanical ventilation | ||
| Parenteral | 73 (2 RCTs) | I2 = 85.4%, P < 0.01 |
| Enteral | 2927 (10 RCTs) | |
| 3. Type of participant | ||
| 3.1. Length of hospital stay | ||
| Surgical participants | 223 (5 RCTs) | I2 = 0%, P = 0.55 |
| Medical participants | 1354 (5 RCTs) | |
| 3.2. Length of ICU stay | ||
| Surgical participants | 158 (3 RCTs) | I2 = 0%, P = 0.52 |
| Medical participants | 2784 (8 RCTs) | |
| 3.3. Infectious complications | ||
| Surgical participants | 220 (4 RCTs) | I2 = 0%, P = 0.45 |
| Medical participants | 2584 (6 RCTs) | |
| 3.4. Length of mechanical ventilation | ||
| Surgical participants | 156 (3 RCTs) | I2 = 0%, P = 0.45 |
| Medical participants | 2854 (9 RCTs) | |
| 4. Amount of calories received by each study group | ||
| 4.1. Length of hospital stay | ||
| Normo‐hypercaloric | 97 (2 RCTs) | I2 = 84.1%, P < 0.01 |
| Hypocaloric | 1370 (6 RCT) | |
| Very hypocaloric | 150 ( RCT) | |
| 4.2. Length of ICU stay | ||
| Normo‐hypercaloric | 75 (2 RCTs) | I2 = 0%, P = 0.42 |
| Hypocaloric | 1517 (6 RCTs) | |
| Very hypocaloric | 1350 (3 RCTs) | |
| 4.3. Infectious complications | ||
| Normo‐hypercaloric | 97 (2 RCTs) | I2 = 0%, P = 0.94 |
| Hypocaloric | 1357 (5 RCTs) | |
| Very hypocaloric | 1350 (3 RCTs) | |
| 4.4. Length of mechanical ventilation | ||
| Normo‐hypercaloric | 73 (2 RCTs) | I2 = 73.1%, P = 0.02 |
| Hypocaloric | 1517 (6 RCTs) | |
| Very hypocaloric | 1350 (3 RCTs) | |
RCT = randomized controlled trial; ICU = Intensive care unit
-
In the subgroup analysis by nutrition status, limited to obesity, we did not observe subgroup differences in length of hospital stay.
-
In the subgroup analysis by route of nutrition support we found considerable subgroup differences in length of stay in ICU and in duration of mechanical ventilation.
-
In the subgroup analysis by the type of participant we did not find subgroup differences between the surgical or medical participants in any of the outcomes analysed
-
In the subgroup analysis by the amount of calories received by each study group we found considerable subgroup differences in length of hospital stay and in duration of mechanical ventilation.
Sensitivity analyses
-
Excluding quasi‐randomized trials. The sensitivity analysis after excluding the only quasi‐randomized trial (Ibrahim 2002) did not show major changes in the overall results for the outcomes of mortality in hospital, length of hospital stay, length of ICU stay and infectious complications. We only observed a change in the outcome of duration of mechanical ventilation. After excluding this trial, the statistically significant difference in favour of the hypocaloric group disappeared. However, this result should be interpreted with caution due to the substantial statistical heterogeneity (I2 = 69%) and important clinical heterogeneity.
-
Excluding trials with at least one high 'Risk of bias' criterion. The sensitivity analysis after excluding the six trials with at least one high 'Risk of bias' criterion ( Arabi 2015; Charles 2014; Ibrahim 2002; McCowen 2000; Rugeles 2013; Rugeles 2016) did not show major changes in the results of the primary and secondary outcomes analysed, nor in the subgroup analyses. We only observed some minor changes in the statistical heterogeneity of several subgroups analysed.
-
By fixed‐effect or random‐effects models. We analysed the primary and secondary outcomes by fixed‐effect or random‐effects models according to the value of I2, as stated in Data synthesis. In all the analyses where the pooled estimates were done with the fixed‐effect model, we conducted a sensitivity analysis with the random‐effects model to explore the robustness of results. No primary or secondary outcomes or subgroup analyses showed a major change in their statistical significance or heterogeneity.
-
By different primary goal of enteral nutrition trials. We performed a post hoc sensitivity analysis (see Sensitivity analysis), excluding the three studies (Ibrahim 2002; NHLBI 2012; Rice 2011) with a primary goal to assess the effects of early initiation of trophic (hypocaloric) enteral nutrition or standard (normocaloric) enteral feeding from the beginning. We did not find major differences in the primary or secondary outcomes, except for minor changes in two unreported outcomes due to the heterogeneity: length of mechanical ventilation and hyperglycaemia.
-
By different primary goal of parenteral nutrition trial. Another post hoc sensitivity analysis was the exclusion of the Battistella 1997 trial, because its primary goal was the evaluation of parenteral nutrition with or without lipids (equivalent to normocaloric or hypocaloric nutrition, respectively). After excluding this trial, we did not see major changes in the primary and secondary outcomes evaluated, with the exception of the length of mechanical ventilation: loss of statistical significance in favour of the hypocaloric group (result not reported due to the substantial statistical heterogeneity).
Meta‐regression
Considering that we found high levels of clinical and statistical heterogeneity, we performed non‐prespecified meta‐regressions using STATA 14.1 to explore the effect of covariates for which we had data (Table 2; Table 3):
-
Type of participants (medical or surgical participants)
-
The calories received in the hypocaloric group, based on the three aforementioned categories (see Subgroup analysis by the amount of calories received by each study group): normo‐hypercaloric, hypocaloric or very low hypocaloric.
-
The difference in calories received between study groups (control minus intervention groups).
We performed meta‐regression on the primary outcomes with results of nine or more trials: hospital mortality, infectious complications, hospital length of stay and ICU length of stay. We did not find significant results explaining sources of heterogeneity using this analysis. None of the analysed explanatory variables influenced the size of the intervention effect of the outcome variables. The details on the definition of variables, dataset and outcome measures are available in Appendix 5 and Appendix 6.
Table 3: In order to show some aspects of the heterogeneous results, in Table 3 we present crude results of the primary outcomes and of length of mechanical ventilation for the 15 included studies. The files of the table were ordered from top to bottom by the difference in the amount of calories receive by the control groups minus those received by the hypocaloric groups (second column from the left).
Assessment of reporting bias
We performed a funnel plot for the outcomes with more than eight included studies (Analysis 1.1; Analysis 1.4; Analysis 1.5; Analysis 1.6; Analysis 1.7). We did not see important asymmetries in the funnel plots, suggesting publication bias (we give one example in Figure 4).
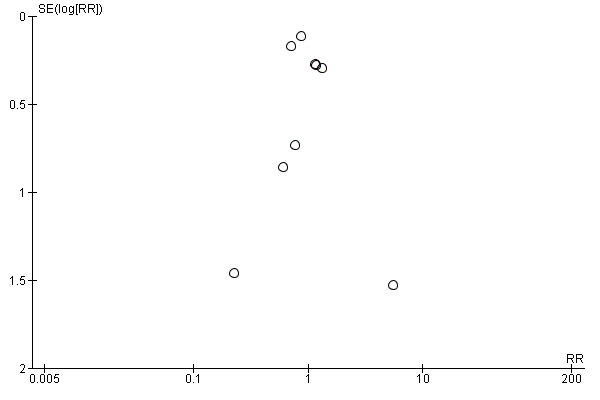
Funnel plot of comparison: 1 Hypocaloric nutrition (intervention) vs. Control, outcome: 1.1 Mortality in hospital.
Discusión
Resumen de los resultados principales
Se identificaron 15 ensayos con un total de 3129 pacientes en la UCI. Los ensayos incluidos tuvieron diferentes objetivos, características de los participantes y metodología para la administración del apoyo nutricional. La consecuencia de lo anterior fue una diversidad metodológica importante entre los ensayos incluidos (Tabla 1). Debido a la heterogeneidad clínica y estadística altas, no se informaron las estimaciones resumidas para los análisis de los resultados primarios y secundarios. De todas las causas de heterogeneidad clínica, las más relevantes que impidieron el informe de las estimaciones resumidas fueron la disparidad en la cantidad de calorías/proteínas recibidas por los grupos intervención y control, y la disparidad en las diferencias de las calorías recibidas entre los grupos de estudio en los ensayos incluidos (Tabla 2; Tabla 3). Por la misma razón, no se informaron las estimaciones totales de los análisis de subgrupos (ver Tabla 4).
En un análisis descriptivo de los resultados de los ensayos incluidos para los resultados principales (Ver Resumen de los hallazgos, tabla 1), fue posible resumir lo siguiente:
-
Se encontró evidencia de muy baja calidad para los resultados relacionados con la mortalidad (hospitalaria, en la UCI y a los 30 días), sin heterogeneidad estadística pero con heterogeneidad clínica importante. La mayoría de los estudios no encontraron diferencias en la incidencia de mortalidad entre los grupos de apoyo nutricional hipocalórico y control. Las razones para la disminución de la calificación de la evidencia fueron el riesgo incierto o alto de sesgo en los estudios incluidos, la inconsistencia y la imprecisión.
-
Se encontró evidencia de muy baja calidad para el resultado duración de la estancia hospitalaria y en la UCI, con heterogeneidad clínica y estadística. En los estudios más pequeños hubo una tendencia hacia una estancia hospitalaria más corta en los participantes del grupo hipocalórico, pero los resultados entre los estudios fueron inconsistentes, algunos a favor del apoyo nutricional hipocalórico y algunos a favor del control. Las razones para la disminución de la evidencia fueron el riesgo incierto o alto de sesgo en los estudios incluidos, la inconsistencia y la imprecisión.
-
Se encontró evidencia de muy baja calidad para el resultado complicaciones infecciosas, con heterogeneidad estadística moderada y clínica importante. Los resultados entre los estudios fueron inconsistentes, algunos a favor del apoyo nutricional hipocalórico y algunos a favor del control. Las razones para la disminución de la evidencia fueron el riesgo incierto o alto de sesgo en los estudios incluidos, la inconsistencia y la imprecisión.
-
Se encontró evidencia de muy baja calidad para el resultado duración de la ventilación mecánica, con heterogeneidad clínica y estadística. Los resultados entre los estudios fueron inconsistentes, algunos a favor del apoyo nutricional hipocalórico y algunos a favor del control. Las razones para la disminución de la evidencia fueron el riesgo incierto o alto de sesgo en los estudios incluidos, la inconsistencia y la imprecisión.
Otros resultados
-
Para la diarrea(complicaciones no infecciosas) la heterogeneidad estadística fue considerable y la heterogeneidad clínica importante. Las estimaciones centrales de los estudios individuales favorecieron al apoyo nutricional hipocalórico, pero la calidad de esta evidencia fue muy baja debido al riesgo incierto o alto de sesgo en los estudios incluidos, la inconsistencia y la imprecisión.
-
Para la hiperglucemia la heterogeneidad estadística fue significativa y la heterogeneidad clínica fue moderada. Las estimaciones centrales de los estudios individuales favorecieron al apoyo nutricional hipocalórico, pero la calidad de esta evidencia fue muy baja debido al riesgo incierto o alto de sesgo en los estudios incluidos, la inconsistencia y la imprecisión.
-
Para la hipoglucemia, la heterogeneidad clínica fue importante, pero no hubo heterogeneidad estadística. Los estudios individuales no encontraron diferencias de la incidencia de la hipoglucemia entre los grupos de apoyo nutricional hipocalórico y control, pero la calidad de esta evidencia fue baja debido al riesgo incierto o alto de sesgo en los estudios incluidos y la imprecisión.
-
Para el equilibrio de nitrógeno, la heterogeneidad estadística fue significativa y la heterogeneidad clínica fue moderada. Los resultados fueron inconsistentes, algunos a favor del apoyo nutricional hipocalórico y algunos a favor del control; la calidad de la evidencia fue muy baja debido a riesgo incierto o alto de sesgo en los estudios incluidos, la inconsistencia y la imprecisión.
No se encontraron datos para realizar varios de los análisis de subgrupos propuestos en el protocolo de la revisión. Se realizaron análisis de subgrupos de los resultados principales, pero no pudieron explicar de manera exhaustiva la heterogeneidad estadística (Ver Tabla 4).
En los tres análisis de sensibilidad preespecificados (con la exclusión del ensayo cuasialeatorio, los tres ensayos con al menos un dominio con alto "riesgo de sesgo"; o el cambio de los resultados del modelo de efectos fijos al modelo de efectos aleatorios) no se observaron cambios importantes en los resultados, ni en el análisis de sensibilidad post hoc que excluyó tres estudios con el objetivo principal de evaluar la nutrición enteral trófica hipocalórica versus la alimentación enteral estándar. En el otro análisis de sensibilidad post hoc que excluyó a Battistella 1997, en los resultados primarios y secundarios solo se observó la pérdida de una diferencia significativa, y no se informó la duración de la ventilación mecánica.
Como se estableció en los análisis de subgrupos y sensibilidad, Ahrens 2005 y Battistella 1997 tuvieron resultados muy diferentes en comparación con los otros estudios incluidos. En ambos ensayos, los grupos control recibieron una dosis calórica alta, una mediana total de 37 kcal/kg/día en Ahrens 2005 y un total de 34,4 kcal/kg de peso corporal/día en Battistella 1997. Además, en Ahrens 2005 los participantes control no solo recibieron nutrición parenteral hipercalórica sino también más dextrosa que la que actualmente se recomienda en los pacientes en estado grave (ASPEN / SCCM guidelines 2009; ESPEN guidelines 2009), con una mediana (intervalo intercuartil [IQ]) de 4,9 mg dextrosa/kg/min (4,79 a 5,07). (Los autores también informaron que la administración de dextrosa a más de 4 mg/kg/min fue una variable predictiva de hiperglucemia). Finalmente, también es importante recordar que Battistella 1997 comparó la nutrición parenteral con y sin emulsiones de lípidos. Por lo tanto, es difícil discriminar si los resultados observados se debieron a la cantidad de calorías administradas, a la no administración de emulsiones de lípidos derivadas de la soja en la nutrición parenteral, o a ambas.
Para evaluar las causas de la heterogeneidad o para formular hipótesis acerca de ellas, se realizó una metarregresión no preespecificada con las covariables disponibles para los resultados primarios de nueve o más ensayos. No se encontraron resultados significativos que explicaran las fuentes de heterogeneidad (Apéndice 5; Apéndice 6). Sin embargo, los resultados de la metarregresión se deben considerar con precaución debido al análisis de post hoc y al número limitado de estudios para el número de covariables en el modelo.
Compleción y aplicabilidad general de las pruebas
La estrategia de investigación fue exhaustiva e inclusiva. Debido a la escasez de la evidencia, se intentó incluir todos los ensayos posibles con el diseño y el objetivo de evaluar el apoyo nutricional hipocalórico versus el normocalórico en los pacientes en estado grave. Por esa razón también se incluyeron ensayos controlados cuasialeatorios, diferentes tipos de contextos de la UCI (médico, quirúrgico, mixto), tipos de participantes (edad, afección médica, etc.), vías de administración (enteral, parenteral o ambas), y también se consideraron los ensayos con un objetivo principal o una metodología diferentes para lograr la alimentación hipocalórica prescrita. Por lo tanto, se considera que los estudios incluidos representan un grupo completo de evidencia actualizada sobre el apoyo nutricional hipocalórico en pacientes adultos en estado grave.
No obstante, la amplitud del alcance se logró a expensas de la heterogeneidad clínica y estadística. Algunas de estas diferencias en los participantes, las intervenciones y los resultados de los ensayos incluidos se pueden observar en la Tabla 1 y la Tabla 2. Además, todos los estudios se realizaron en hospitales docentes o asociados a universidades, que son probablemente diferentes de otros contextos clínicos. Por lo tanto, es discutible si los resultados se podrían generalizar. La heterogeneidad clínica y estadística impidió una síntesis cuantitativa de todos los resultados y la mayoría de los análisis de subgrupos. En el campo clínico, los resultados se deben interpretar con precaución y considerar todos estos temas.
Cuando se analiza la cantidad de calorías que en realidad recibieron los grupos en cada ensayo (en muchos de ellos diferente de la preespecificada en los protocolos de los estudios), se encontró que la mayoría de los estudios incluidos no evaluaron realmente la administración de apoyo nutricional hipocalórico versus normocalórico, sino una amplia variedad de calorías administradas (Tabla 2). Además, la diferencia en las calorías recibidas por el grupo control menos el grupo de apoyo nutricional hipocalórico fue muy pequeña en algunos de los ensayos incluidos (Tabla 3). Ambos factores no solo contribuyeron a la heterogeneidad clínica, sino que también podrían haberse asociado con la falta de diferencias estadísticamente significativas (si es que hubo) entre los grupos de estudio.
La mayoría de los ensayos incluidos no analizaron la función de la administración proteica en la evaluación de los resultados. La cantidad de proteínas administrada en los grupos de intervención y control se informó en 12 ensayos: bastante diversa en tres de ellos, bastante similar en cuatro y más o menos la misma en los otros cinco (Tabla 2). Existe un consenso amplio en que los pacientes obesos en estado grave deben recibir alimentación hipocalórica hiperproteica (ASPEN / SCCM guidelines 2016; Choban 2013; Dickerson 1986), pero en la actualidad se debate acerca de la mejor dosis de proteínas para los pacientes no obesos: dosis mayores de proteínas parecieron asociarse con mejores resultados en los pacientes en estado grave (Dickerson 2012; Weijs 2012; Weijs 2013; Van Zanten 2016). Las diferentes cantidades de proteínas diarias administradas a los grupos de estudio en los ensayos incluidos se deben considerar otro componente de la heterogeneidad clínica.
Aunque estos resultados no encontraran evidencia concluyente definitiva a favor del apoyo nutricional hipocalórico, también es interesante señalar que no se encontró evidencia de alta calidad para los efectos perjudiciales. Lo anterior contrasta con dos estudios observacionales que informaron algunos resultados más deficientes o complicaciones clínicas cuando no se lograron ciertos niveles de calorías (Rubinson 2004; Villet 2005).
Calidad de la evidencia
Según GRADE, la calidad de la evidencia para los resultados primarios fue muy baja (ver Resumen de los hallazgos Tabla 1).
Seis de los 15 estudios incluidos presentaron uno o más criterios de "Riesgo de sesgo" alto y ocho estudios tuvieron uno o más criterios de "Riesgo de sesgo" incierto. Debido a la complejidad del apoyo nutricional en los pacientes en estado grave, el cegamiento del personal (la causa principal del alto riesgo de sesgo en esta revisión sistemática) es desafiante, aunque algunos lo pudieron implementar. Solo un ensayo incluido (Ahrens 2005) tuvo bajo riesgo de sesgo en todos los criterios predefinidos (Figura 3). La calidad de la evidencia según GRADE fue baja a muy baja para todos los resultados primarios.
Otra razón para la disminución de la calidad de la evidencia fue la inconsistencia. Se exploraron las características cualitativas que podrían explicar la inconsistencia, pero no fue posible identificarlas en los análisis de subgrupos (Tabla 4), los análisis de sensibilidad ni en la metarregresión. La inconsistencia también fue evidente en la amplia varianza de las estimaciones puntuales para la mortalidad.
La imprecisión afectó la calidad de todos los resultados principales, especialmente la mortalidad, debido al escaso número de eventos. Los intervalos de confianza fueron amplios y en la mayoría de los casos no fue posible mejorar la precisión al agrupar los resultados debido a la heterogeneidad clínica.
Para el sesgo de publicación, el gráfico en embudo para los resultados con al menos ocho ensayos no mostró asimetría significativa.
Sesgos potenciales en el proceso de revisión
Se siguieron los métodos del Manual Cochrane para las revisiones sistemáticas de intervenciones (Higgins 2011) para disminuir los sesgos en el proceso de revisión. Un bibliotecario experimentado definió la estrategia de búsqueda, que fue evaluada por otro experto independiente. La estrategia de búsqueda fue exhaustiva e incluyó la consulta con líderes de opinión, la industria farmacéutica, las actas de congresos y reuniones, así como el uso de técnicas de bola de nieve para aumentar las probabilidades de recuperar los estudios existentes publicados o no publicados. Tres autores de la revisión examinaron de manera independiente los ensayos, y también dos autores de la revisión independientes realizaron la extracción de los datos y la evaluación del riesgo de sesgo. Se resolvió cualquier desacuerdo mediante consulta con un tercer autor de la revisión.
Se siguieron de manera estricta los criterios de inclusión‐exclusión del protocolo (Perman 2009). Los ensayos incluidos no son homogéneos, con diferentes objetivos y metodologías. Las diferencias principales se relacionan con el tipo y las condiciones de los participantes y la metodología para la administración del apoyo nutricional (metas, momento de inicio, vía, estrategia de administración y calorías administradas, entre otros) (Tabla 1). Esta heterogeneidad clínica y metodológica agregó complejidad al análisis de los datos y la interpretación de los resultados. No fue posible informar las estimaciones agrupadas debido a la heterogeneidad clínica o estadística, o ambas.
Se reconoce que la multiplicidad de análisis de subgrupos y análisis post hoc podría haber producido resultados positivos falsos. Estos análisis post hoc se agregaron para explorar la heterogeneidad clínica encontrada en los estudios incluidos. Se intentó reducir el riesgo de resultados de positivos falsos limitando la exploración de los subgrupos a los resultados en que se encontró heterogeneidad estadística, como se había definido en el protocolo.
Acuerdos y desacuerdos con otros estudios o revisiones
Hay ocho revisiones y metanálisis sistemáticos anteriores, directa o indirectamente relacionados con el tema de esta revisión. Tienen finalidades similares, pero diferentes preguntas de revisión y criterios de inclusión.
La primera revisión (Jiang 2011) evaluó ensayos controlados aleatorios que compararon la nutrición parenteral hipocalórica (≤ 20 kcal/kg/día no proteicas) versus nutrición parenteral estándar o altamente energética (≥ 25 o > 30 kcal/kg/día no proteicas, respectivamente) en participantes quirúrgicos o con traumatismos. Según los criterios de inclusión‐exclusión, incluyeron cinco ensayos, dos de los cuales (Ahrens 2005; Battistella 1997) también se incluyeron en la presente revisión. Los otros tres estudios (en idioma chino) fueron ensayos de pacientes en el posoperatorio que no estaban en estado grave (según los títulos y un resumen de los estudios) (Jiang 2003; Mao 2015; Zhan 2007). Estos estudios informaron una reducción estadísticamente significativa de las complicaciones infecciosas y la duración de la estancia hospitalaria, con heterogeneidad moderada, en participantes quirúrgicos que recibieron nutrición parenteral hipocalórica. Esos resultados fueron más consistentes y menos heterogéneos cuando se excluyeron los ensayos con un tamaño pequeño de la muestra. Las calorías administradas a los participantes parecieron ser más homogéneas, pero los autores hicieron el análisis con las calorías no proteicas administradas. Si se agrega el contenido calórico a las proteínas administradas, el grupo de intervención recibió como promedio 24,0 kcal/kg/día en total (intervalo 20,5 a 27,0) y el grupo control 34,5 kcal/kg/día en total (intervalo 32,5 a 36,0). Lo anterior significa que el estudio comparó nutrición parenteral casi normocalórica versus normo a hipercalórica. Por lo tanto, los efectos favorables de la nutrición parenteral menos calórica sobre las complicaciones infecciosas y la duración de la estancia hospitalaria informada en este metanálisis se deben limitar a los participantes quirúrgicos que reciben nutrición parenteral con dosis calóricas mayores que las recomendadas. En los análisis de subgrupos de la presente revisión se observaron resultados similares con los análisis de Ahrens 2005 y Battistella 1997.
En 2015 el Canadian Critical Care Nutrition Clinical Practice Guidelines Committee actualizó las Canadian Clinical Practice Guidelines para el apoyo nutricional a los pacientes adultos en estado grave. Produjeron tres revisiones sistemáticas y metanálisis diferentes pero relacionados, con los siguientes títulos: Subalimentación deliberada: Alimentos tróficos versus Alimentos Completos (Canadian Guideline 3.3a 2015); Subalimentación deliberada: Nutrición enteral hipocalórica (Canadian Guideline 3.3b 2015); y Estrategias para Optimizar la Nutrición Parenteral y Disminuir los Riesgos: Dosis de NP (Canadian Guideline 10.1 2015). Este enfoque fue dirigido a las guías, pero también sirvió para disminuir la heterogeneidad clínica de los ensayos incluidos y la heterogeneidad estadística en algunos análisis.
Para la evaluación de la alimentación trófica (hipocalórica) versus completa (normocalórica) (Canadian Guideline 3.3a 2015), el grupo canadiense evaluó dos estudios, también incluidos en la presente revisión (NHLBI 2012; Rice 2011), pero no incluyó un ensayo cuasialeatorio con objetivos y metodología similares (Ibrahim 2002). El metanálisis no mostró diferencias estadísticas en la mortalidad ni en la neumonía asociada con el respirador entre los grupos de estudio. No presentaron los resultados duración de la estancia hospitalaria, de la estancia en la UCI ni de la ventilación mecánica, debido a la manera en la que se informaron los datos en los ensayos. Sin embargo, estos resultados se podrían analizar después de recibir la información del primer autor de cada ensayo. No se encontraron diferencias estadísticamente significativas entre los grupos de estudio.
Para actualizar la guía de 2015 Subalimentación deliberada: Nutrición enteral hipocalórica (Canadian Guideline 3.3b 2015), el Comité canadiense incluyó cuatro ensayos en el metanálisis. Los cuatro se incluyeron en la presente revisión (Arabi 2011; Arabi 2015; Charles 2014; Petros 2016). Encontraron que la nutrición enteral hipocalórica se asoció con una tendencia hacia la disminución de la mortalidad hospitalaria y en la UCI, así como con una reducción estadísticamente significativa de la duración de la ventilación mecánica. No encontraron diferencias significativas en las complicaciones infecciosas ni en la duración de la estancia hospitalaria y en la UCI. En el análisis de subgrupos de la nutrición enteral se evitó informar las estimaciones agrupadas de los seis resultados evaluados debido a la alta heterogeneidad clínica o estadística. Cuando en la presente revisión se hizo el mismo análisis que en el comité, los resultados fueron casi similares (algunas diferencias numéricas menores).
El grupo canadiense incluyó cuatro ensayos en los metanálisis de nutrición parenteral (Canadian Guideline 10.1 2015), que también se incluyeron en la presente revisión (Ahrens 2005; Battistella 1997; Choban 1997; McCowen 2000). (Incluyeron los resultados de un ensayo "Ahrens 2003 no publicado", que fueron los mismos del ensayo Ahrens 2005 incluido en esta revisión). No encontraron diferencias estadísticamente significativas entre los grupos de intervención y control para la mortalidad hospitalaria ni las complicaciones infecciosas. En el análisis de subgrupos de la nutrición parenteral de la presente revisión, se encontraron algunas diferencias numéricas menores con las guías canadienses en los mismos dos resultados, pero fueron esencialmente los mismos. También presentaron algunos resultados adicionales (análisis de sensibilidad y resultados de estudios individuales), pero no fueron significativos.
Otra revisión sistemática y metanálisis (Choi 2015), comparó el efecto de la nutrición enteral inicial con una dosis de subalimentación versus una dosis inicial de alimentación completa de nutrición enteral en pacientes adultos en estado grave. En esta revisión se incluyeron cuatro ensayos, tres de los cuales también se incluyeron en la presente revisión (Arabi 2011; NHLBI 2012; Rice 2011) y uno que se excluyó debido a que el objetivo primario fue diferente (Desachy 2008). No encontraron diferencias significativas en la mortalidad global ni en otros resultados clínicos entre los grupos de subalimentación y alimentación completa. En el análisis de subgrupos, el subgrupo de subalimentación que recibió 33,3% o más de los requerimientos calóricos estándar mostró una mortalidad global significativamente menor en comparación con el grupo con alimentación completa. Lo anterior no se observó en el subgrupo de subalimentación que recibió una dosis menor del 33,3% de la nutrición enteral. Lo anterior indica la posibilidad de que una nutrición enteral con subalimentación moderada, pero no una ingesta mínima, se podría asociar con un mejor pronóstico. No obstante, los ensayos incluidos indicaron heterogeneidad clínica, al igual que el análisis de subgrupos de nutrición enteral de la presente revisión, en el que no se observaron diferencias en la mortalidad hospitalaria.
El metanálisis Tian 2015 incluyó ocho ensayos aleatorios que administraron calorías significativamente diferentes por vía enteral. Se incluyeron cuatro de estos ensayos en la revisión (Arabi 2011; Charles 2014; NHLBI 2012; Rice 2011). Los autores no encontraron diferencias significativas entre los grupos con bajo y alto contenido energético en cuanto a la mortalidad; las complicaciones infecciosas; la neumonía; la intolerancia gastrointestinal ni duración de la estancia hospitalaria, de la estancia en la UCI y de la ventilación mecánica. En el análisis de subgrupos, los grupos de bajo contenido energético que recibieron entre el 33,3% y el 66,6% del objetivo calórico tuvieron una mortalidad significativamente menor en comparación con el grupo de alto contenido energético. En el análisis de subgrupos con diferentes cantidades de administración de proteínas los autores encontraron que la administración de alto contenido proteico (más de 0,85 g/kg/día) más alto contenido energético podría reducir la tasa de complicaciones infecciosas. En el análisis de subgrupos de la presente revisión con tres categorías de calorías administradas, no se encontraron resultados significativos, pero es necesario recordar los resultados de los metanálisis Choi 2015 y Tian 2015 para las dosis de calorías con nutrición enteral, así como las dosis de proteínas (Tian 2015).
La revisión sistemática y metanálisis Marik 2016b comparó nutrición enteral normocalórica (80% a 100% del gasto energético diario) con la nutrición enteral intencional hipocalórica, y dividió la comparación en dos estrategias diferentes: "subalimentación permisiva" (menos del 70% del gasto energético diario) y "trófica" (20% de la dosis durante la primera semana). Incluyó seis ensayos que también se incluyeron en la presente revisión, pero los analizaron por separado en el subgrupo "trófica" (NHLBI 2012; Arroz 2011) y "subalimentación permisiva" (Arabi 2011; Arabi 2015; Charles 2014; Petros 2016). En el metanálisis la heterogeneidad estadística fue baja y no se encontraron diferencias significativas entre los grupos de estudio en las complicaciones infecciosas, la duración de la estancia en la UCI, la mortalidad hospitalaria (solo una tendencia hacia una menor mortalidad en el subgrupo de subalimentación permisiva) ni los días sin ventilación. Según el protocolo, en la presente revisión se realizaron diferentes análisis de subgrupos y de sensibilidad, con resultados conceptualmente similares. Sin embargo, el enfoque de subgrupos se debe considerar en las revisiones sistemáticas futuras.
En una segunda revisión sistemática y metanálisis (Tian 2017), los autores incluyeron 11 estudios que compararon la nutrición enteral con bajo y alto contenido energético (en dos estudios también nutrición enteral más nutrición parenteral suplementaria), administrada a pacientes adultos también en estado grave pero sin desnutrición. También se incluyeron cinco de estos estudios (Arabi 2011; Arabi 2015; Charles 2014; NHLBI 2012; Rice 2011). En el metanálisis no se encontraron diferencias estadísticamente significativas entre los grupos con bajo y alto contenido energético en cuanto a la mortalidad, las complicaciones infecciosas, la neumonía, la duración de la estancia hospitalaria y en la UCI ni la duración de la ventilación mecánica. Se encontró significativamente menos intolerancia gastrointestinal en el grupo de bajo contenido energético. En el análisis de subgrupos para la mortalidad, se observó significativamente menos mortalidad en el grupo de bajo contenido energético pero solo dentro del intervalo del 33,3% al 66,6% de las calorías pretendidas. En otro análisis de subgrupos, la incidencia de complicaciones infecciosas fue significativamente menor en el grupo de alto contenido energético, pero solo cuando la nutrición enteral también proporcionó cantidades mayores de proteínas. Aunque se podría cuestionar la decisión de realizar el metanálisis con una heterogeneidad clínica alta, en los estudios futuros se debe considerar la función de la dosis nutricional enteral entre el 33,3% y el 66,6% del objetivo calórico y la cantidad de proteínas administradas.
Es importante recalcar que, según el protocolo de la presente revisión (Perman 2009), solo se incluyeron los ensayos que compararon cualquiera tipo de apoyo nutricional "prescrito" con diferentes grupos control de pacientes adultos en estado grave. Aunque hay varios informes en la bibliografía de los pacientes en estado grave que recibieron nutrición enteral hipocalórica debido a dificultades, intolerancia o complicaciones durante la administración (que ocurrieron en el 59% de los casos, según lo informado en la encuesta internacional realizada en 158 UCI por Cahill 2010), , no se incluyeron estudios que evaluaran este apoyo nutricional hipocalórico no intencional "no prescrito". No obstante, se señala que muchos ensayos incluidos en la presente revisión no pudieron alcanzar los objetivos calóricos preespecificados.
Se incluyeron tres estudios que evaluaron indirectamente la pregunta de revisión mediante la administración intencional de la alimentación enteral trófica (hipocalórica) durante los cinco primeros o seis días en la UCI versus la alimentación enteral completa (normocalórica) desde el comienzo de la estancia en la UCI (Ibrahim 2002; NHLBI 2012; Rice 2011). Para ser lo más inclusivos posible, también se incluyeron Battistella 1997 (el objetivo primario fue evaluar la nutrición parenteral con o sin emulsiones de soja‐lípidos). Es importante destacar que los resultados del último ensayo se podrían asociar con la nutrición parenteral menos calórica, con la falta de lípidos, o con una combinación de ambos factores (ASPEN 2012; Ren 2013). Cuando se hizo el análisis de sensibilidad con la exclusión de estos ensayos, solo se encontraron diferencias menores en los resultados.
No se incluyeron los estudios que evaluaron la nutrición enteral optimizada con nutrición parenteral suplementaria para alcanzar la "energía proyectada" (medida por calorimetría indirecta o calculada mediante fórmulas) para evitar las "deudas calóricas" (Heidegger 2013), o para evaluar cuándo iniciar la nutrición parenteral suplementaria (Doig 2013). Actualmente ambos temas están bajo debate.
Updated study flow diagram, 20 June 2017
Risk of bias graph: review authors' judgements about each risk of bias domain presented as percentages across all included studies.
Risk of bias summary: review authors' judgements about each risk of bias domain for each included study. Red colour represents high risk of bias; green, low risk of bias; and yellow, unclear risk of bias.
Funnel plot of comparison: 1 Hypocaloric nutrition (intervention) vs. Control, outcome: 1.1 Mortality in hospital.

Comparison 1 Hypocaloric nutrition (intervention) vs. Control, Outcome 1 Mortality in hospital.

Comparison 1 Hypocaloric nutrition (intervention) vs. Control, Outcome 2 Mortality in ICU.

Comparison 1 Hypocaloric nutrition (intervention) vs. Control, Outcome 3 Mortality at 30 days.

Comparison 1 Hypocaloric nutrition (intervention) vs. Control, Outcome 4 Length of Hospital stay (days).

Comparison 1 Hypocaloric nutrition (intervention) vs. Control, Outcome 5 Length of ICU stay (days).

Comparison 1 Hypocaloric nutrition (intervention) vs. Control, Outcome 6 Infectious complications.

Comparison 1 Hypocaloric nutrition (intervention) vs. Control, Outcome 7 Length of mechanical ventilation (days).

Comparison 1 Hypocaloric nutrition (intervention) vs. Control, Outcome 8 Non‐infectious complications (diarrhoea).

Comparison 1 Hypocaloric nutrition (intervention) vs. Control, Outcome 9 Hyperglycaemia.

Comparison 1 Hypocaloric nutrition (intervention) vs. Control, Outcome 10 Hypoglicaemia.

Comparison 1 Hypocaloric nutrition (intervention) vs. Control, Outcome 11 Nitrogen balance (g/day).
| Hypocaloric nutrition compared to control for critically‐ill adults | |||
| Patient or population: critically‐ill adults Comparison: control nutritional support with a higher caloric intake than the 'intervention' group | |||
| Outcomes | Effect estimate (range of results of individual studies) | N of Participants | Quality of the evidence |
| Mortality in hospital: death occurring during the hospital stay | Range of risk ratios from 0.23 to 5.54a | 1775 (9 studies) | ⊕⊕⊝⊝ |
| Mortality in ICU: death occurred during the ICU stay | Range of risk ratios from 0.81 to 5.54a | 1291 | ⊕⊕⊝⊝ |
| Mortality at 30 days: 28 to 30 days all‐cause mortality | Range of risk ratios from 0.79 to 3.00a | 2611 | ⊕⊕⊝⊝ |
| Length of hospital stay: days stayed in the hospital | Range of length of hospital stay from 15.70 days lower to 10.70 days highera | 1677 | ⊕⊝⊝⊝ |
| Length of ICU stay: days stayed in the ICU | Range of length of ICU stay from 11.00 days lower to 5.40 days highera | 2942 | ⊕⊝⊝⊝ |
| Infectious complications: events of any type of infectious complications occurred during the hospital stay, registered by the study authors according to their diagnostic criteria of infections. | Range of risk ratios from 0.54 to 2.54a | 2804 | ⊕⊝⊝⊝ |
| Length of mechanical ventilation: days on mechanical ventilation during ICU stay | Range of mean differences: 13.20 days lower to 8.36 days highera | 3000 (12 studies) | ⊕⊝⊝⊝ |
| GRADE Working Group grades of evidence | |||
| aResults were not combined due to clinical heterogeneity. | |||
| Study ID | Type of participants Primary outcomes | Arm | Number of ICU participants | APACHE II score mean ± SD | Route (enteral or parenteral) | Duration of PN or EN (days) | Mechanical ventilation (% of participants) | ICU mortality % | Hospital mortality % |
| Surgical participants with PN requirement Incidence/severity hyperglycaemia and insulin received by the participants | Hypoc. | 8 (other 12 non‐ICU) | 20 ± 9 | Parenteral | 6 (4 to 10) | 100 | Not reported | Not reported | |
| Control | 10 (other 10 non‐ICU) | 19 ± 11 | 7 (5 to 10) | 80 | |||||
| Medical (mainly) and surgical participants with EN. 2 x 2 factorial trial with Intensive Insuline therapy 28 days all‐cause mortality | Hypoc. | 120 | 25 ± 8 | Enteral | Not reported | 99 | 18 | 30 | |
| Control | 120 | 25 ± 8 | 99 | 22 | 43 | ||||
| Critically‐ill participants (75% medical) 90‐day all‐cause mortality | Hypoc. | 448 | 21 ± 7.9 | Enteral | 9.1 ± 4.6 | 97.3 | 16.1 | 24.2 | |
| Control | 446 | 21 ± 8.2 | 9.4 ± 4.4 | 96.2 | 19.1 | 27.6 | |||
| Trauma participants with PN requirement Length of hospital stay, length of stay in the ICU, number of days on mechanical ventilation and infectious complications. | Hypoc. | 27 | 22 ± 5 | Parenteral | 10 | Not reported | 7.4 | Not reported | |
| Control | 30 | 23 ± 6 | 10 | 0 | |||||
| Critically‐ill surgical participants Hospital‐acquired infection | Hypoc. | 41 | 16.6 ± 0.9 | Enteral & parenteral | 12.6 ± 2.8 | 68 | N/A | 7.3 | |
| Control | 42 | 17.3 ± 0.8 | 10.4 ± 1.1 | 57 | N/A | 9.5 | |||
| Obese participants with PN requirement. Predominantly surgical diseases Achievement of nitrogen balance | Hypoc. | 6 (other 10 non‐ICU) | 13 ± 5 | Parenteral | 10 ± 3 | Not reported | Not reported | 0 | |
| Control | 7 (other 7 non‐ICU) | 15 ± 5 | 11 ± 2 | 28.6 | |||||
| Medical ICU participants with EN Incidence of ventilator‐associated pneumonia | Hypoc. | 75 | 26 ± 8 | Enteral | 5 ± 6 | 100 | Not reported | 27 | |
| Control | 75 | 25 ± 8 | 10 ± 12 | 100 | 20 | ||||
| Participants with predominantly surgical diseases requiring PN Glycaemic control and Infections | Hypoc. | 21 | not reported | Parenteral | ≥ 5 | 50 | 10 | Not reported | |
| Control | 19 | not reported | ≥ 5 | 33 | 16 | ||||
| Acute lung injury predominantly due to medical diseases (61% and 63% of participants) with EN Ventilator‐free days at study day 28 | Hypoc. | 508 | APACHE III 92 ± 28 | Enteral | 6 | 100 | Not reported | 22.4 | |
| Control | 492 | APACHE III 90 ± 27 | Enteral | 6 | 100 | 19.6 | |||
| Critically‐ill head trauma participants 28 days of all‐cause mortality | Hypoc. | 30 | Not reported | Enteral | 7 | Not reported | Not reported | 10.7a | |
| Control | 30 | 7 | 3.8a | ||||||
| Medical ICU with EN and/or PN requirement Glycaemic control and mortality | Hypoc. | 46 | 31 ± 9 | Enteral & parenteral | 7 | not reported | 22 | 37 | |
| Control | 54 | 28 ± 8 | 7 | 22 | 31 | ||||
| Acute lung injury, predominantly due to medical diseases with EN Ventilator‐free days at study day 28 | Hypoc. | 98 | 27 ± 8 | Enteral | 6 ± 4 | 100 | Not reported | 22 | |
| Control | 102 | 27 ± 7 | 5 ± 3 | 100 | 20 | ||||
| Medical ICU participants with EN requirement Change in SOFA score at 48 hours | Hypoc. | 40 | 14 ± 5 | Enteral | 7 | Not reported | Not reported | Not reported | |
| Control | 40 | 15 ± 6 | |||||||
| Medical ICU participants with EN requirement Change in SOFA score at 48 hours | Hypoc. | 60 | 13.5 ± 6.4 | Enteral | 7 | Not reported | Not reported | 30a | |
| Control | 60 | 13.7 ± 6.8 | 27a | ||||||
| Septic, mechanically ventilated critically‐ill participants 28‐day mortality | Hypocal. | Total sample of 74 participants | Total sample 22 ± 4 | Enteral | Not reported | Not reported | Not reported | Not reported | |
| Control | |||||||||
| a28‐day mortality. EN = Enteral nutrition; ICU = Intensive Care Unit; N/A: not available; PN = Parenteral nutrition; SOFA = Sequential Organ Failure Assessment | |||||||||
| Studies | How data was reported | Hypocaloric (intervention) group | Control group | Calories received by the "hypocaloric" intervention group (kcal/kg/day) | Calories received by the "normocaloric" control group (kcal/kg/day) | Categories denominated by the calories really received in the intervention and the control groups a |
| Total calories/kg/day (median (IQ))b | 26.6 (26.2 to 27.5) | 37 (36.0 to 38.4) | 26.60 (median) | 37.00 (median) | Normocaloric vs hypercaloric | |
| Protein g/kg/day (mean± SD) | 1.61 ± 0.13 | 1.53 ± 0.26 | ||||
| Calories/day (mean ± SD) | 1066.6 ± 306.1 | 1251.7 ± 432.5 | 13.85 | 16.40 | Hypocaloric vs hypocaloric | |
| Protein g/day (mean ± SD) | 47.5 ± 21.2 | 43.6 ± 18.9 | ||||
| Calories/day (mean ± SD) | 835 ± 297 | 1299 ± 2470 | 10.56 | 16.04 | Hypocaloric vs hypocaloric | |
| Protein g/day (mean ± SD) | 57 ± 24 | 59 ± 25 | ||||
| Calories/kg ideal body weight/day (mean ± SD) | 27.4 ± 2 | 34.4 ± 2 | 27.4 (of ideal body weight) | 34.4 (of ideal body weight) | Normocaloric vs. normocaloric | |
| Protein g/kg ideal body weight/day (mean± SD) | 1.6 ± 0.1 | 1.6 ± 0.2 | ||||
| Calories/kg/day (mean ± SD) | 12.3 ± 0.7 | 17.1 ± 1.1 | 12 | 17 | Hypocaloric vs hypocaloric | |
| Protein g/kg/day (mean ± SD) | 1.1 ± 0.1 | 1.1 ± 0.1 | ||||
| Kcal/kg actual body weight/day (mean ± SD) Kcal/kg ideal body weight/day (mean ± SD) | 8.6 ± 2.39 13.88 ± 2.87 | 17.45 ± 4.06 27.99 ± 3.83 | 14.00 (of ideal body weight) | 28.00 (of ideal body weight) | Hypocaloric vs normocaloric | |
| Protein g/kg actual body weight/day (mean ± SD) Protein g/kg ideal body weight/day (mean ± SD) | 1.2 ± 0.2 2.0 ± 0.1 | 1.2 ± 1.2 2.0 ± 0.1 | ||||
| Calories/day (mean ± SD) | 126 ± 115 | 474 ± 400 | 1.53 | 5.81 | Very hypocaloric vs very hypocaloric | |
| Proteins g/day (mean) (mean ± SD) | 5.3 ± 5.3 | 18.7 ± 15.4 | ||||
| Calories/kg/day (mean ± SD) | 14 ± 3 | 18 ± 4 | 14.30 | 18.40 | Hypocaloric vs hypocaloric | |
| Proteins g/kg/day (mean ± SD) | 1.1 ± 0.2 | 1.3 ± 0.2 | ||||
| Calories/day (mean ± SD) | 399 ± 225 | 1365 ± 596 | 4.64 (estimated by kcal/day divided by weight from the baseline table) | 15.69 (estimated by kcal/day divided by weight from the baseline table) | Very hypocaloric vs hypocaloric | |
| Proteins: information not collected | ‐ | ‐ | ||||
| Calories/kg/day (mean ± SD) | Not reported | Not reported | N/A | N/A | N/A | |
| Protein g/kg/day (mean ± SD) | Not reported | Not reported | ||||
| Calories/kg/day (mean ± SD) | 11.3 ± 3.1 | 19.7 ± 5.7 | 11.30 | 19.70 | Hypocaloric vs hypocaloric | |
| Protein | Data not reported | Data not reported | ||||
| Calories/day (mean ± SD of study days 1 to 5) | 300 ± 149 | 1418 ± 686 | 3.60 | 17.31 | Very hypocaloric vs hypocaloric | |
| Proteins g/day (mean ± SD of study days 1 to 5) | 10.9 ± 6.8 | 54.4 ± 33.2 | ||||
| Calories/kg/day (mean ± SD) | 12 ± 3.9 | 14 ± 6.2 | 12.00 | 14.00 | Hypocaloric vs hypocaloric | |
| Protein g/kg/day (mean ± SD) | 1.4 ± 0.44 | 0.76 ± 0.32 | ||||
| Total calories/kg ideal body weight/day (mean ± SD) | 12.6 ± 3.4 | 20.5 ± 5.1 | 13 | 21 | Hypocaloric vs hypocaloric | |
| Protein g/kgIBW/day (mean ± SD) | 1.4 ± 0.4 | 1.4 ± 0.3 | ||||
| Calories/day (mean ± SD) | 962 ± 314 | 1308 ± 513 | Not reported Estimatedc 16.63 kcal/kg/day | Not reported Estimatedc 22.62 kcal/kg/day | Estimatedc Hypocaloric vs normocaloric | |
| Protein g/day (mean ± SD) | 57 ± 24 | 59 ± 25 | Not reported Estimatedc 0.99 g/kg/day | Not reported Estimatedc 1.02 g/kg/day | ||
| aCategories denominated by the amount of calories really received by both study groups, according to the following: very hypocaloric = < 10 kcal/kg/day; hypocaloric = ≥ 10 to < 25 kcal/kg/day; normocaloric = ≥ 25 to < 35 kcal/kg/day; hypercaloric = ≥ 35 kcal/kg/day. BMI = Body Mass Index; g = gram; ICU = Intensive Care Unit; kcal = kilocalories; N/A: not available; SD = standard deviation; vs = versus | ||||||
| Study | Difference in calories between groups (kcal/kg/day) | Hospital mortality (%) IG vs CG | ICU mortality (%) IG vs CG | Mortality at 30 days (%) IG vs CG | Infectious complications (%) IG vs CG | Length of hospital stay (days)a IG vs CG | ICU length of stay (days)a IG vs CG | Length of mechanical ventilation (days)a IG vs CG | Categories denominated by the calories really received in the intervention and the control groupsb |
| 2.00 | N/A | N/A | N/A | N/A | N/A | 9.5 vs 10.4 | 8.5 vs 9.7 | Hypocaloric vs hypocaloric | |
| 2.55 | 30% vs 42.5% | 17.5% vs 21.7% | 18.3% vs 23.3% | 44.2% vs 46.7% | 70.2 vs 67.2 | 11.7 vs 14.5 | 10.6 vs 13.2 | Hypocaloric vs hypocaloric | |
| 4.10 | 9.5% vs 15.8% | N/A | N/A | 28.6% vs 52.6% | 19 vs 17 | N/A | N/A | Hypocaloric vs hypocaloric | |
| 4.28 | 26.7% vs 20% | N/A | N/A | 30.7% vs 49.3% | 16.7 vs 22.9 | 9.8 vs 13.6 | 8.1 vs 12.9 | Very hypocaloric vs very hypocaloric | |
| 5.00 | 7.3% vs 9.5% | N/A | N/A | 56.1% vs 57.1% | 35.2 vs 31 | 16.7 vs 13.6 | 10.8 vs 8.3 | Hypocaloric vs hypocaloric | |
| 5.48 | 24.2% vs 27.6% | 16.1% vs 19.1% | 20.8% vs 21.8% | 35.9% vs 37.9% | 48.3 vs 54.4 | 15.8 vs 16.4 | 11.3 vs 13.5 | Hypocaloric vs hypocaloric | |
| 7.00 | 7.4% vs 0% | 7.4% vs 0% | N/A | 48.2% vs 73.3% | 27 vs 39 | 18 vs 29 | 15 vs 27 | Normocaloric vs normocaloric | |
| 7.90 | N/A | N/A | 30% vs 26.7% | N/A | N/A | 13.2 vs 13.5 | 10.8 vs 10.8 | Hypocaloric vs hypocaloric | |
| 8.40 | 37% vs 31.5% | 21.7% vs 22.2% | 39.1% vs 33.3% | 28.3% vs 11.1% | 38.1 vs 27.4 | 22.4 vs 17 | 20.7 vs 12.4 | Hypocaloric vs hypocaloric | |
| 10.40 | N/A | N/A | N/A | 25% vs 10% | 23.4 vs 27.8 | 16.8 vs 23 | 11.1 vs 20.3 | Normocaloric vs hypercaloric | |
| 11.05 | N/A | N/A | 19.5% vs 19.3% | 18.9% vs 16.1% | N/A | 11.5 vs 11 | 10.5 vs 10.2 | Very hypocaloric vs hypocaloric | |
| 13.71 | 22.4% vs 19.6% | N/A | 22.4% vs 19.6% | 30.6% vs 32.4% | N/A | 8.1 vs 7.6 | 5.7 vs 6.2 | Very hypocaloric vs hypocaloric | |
| 14.00 | 0% vs 29% | N/A | N/A | N/A | 48 vs 45 | N/A | N/A | Hypocaloric vs normocaloric | |
| N/A | N/A | N/A | 10% vs 3.3% | N/A | 19.9 vs 35.6 | N/A | 4.7 vs 17.9 | N/A | |
| N/A | N/A | N/A | 18.4% vs 28.9% | N/A | N/A | N/A | N/A | Hypocaloric vs normocaloric | |
| aLengths of hospital, ICU stays and of mechanical ventilation presented in mean days. IG = Intervention Group; CG = Control Group; N/A = Not available; vs = versus | |||||||||
| Subgroup | N participants (n studies) | Subgroup testing |
| 1. Nutrition status | ||
| 1.1. Length of hospital stay | ||
| Obese | 13 (1 RCT) | I2 = 0%, P = 0.76 |
| General | 1664 (9 RCTs) | |
| 2. Route of nutrition support | ||
| 2.1. Length of hospital stay | ||
| Parenteral | 150 (4 RCTs) | I2 = 0%, P = 0.72 |
| Enteral | 1725 (6 RCTs) | |
| 2.2. Length of ICU stay | ||
| Parenteral | 75 (2 RCTs) | I2 = 83.3%, P < 0.01 |
| Enteral | 2867 (9 RCTs) | |
| 2.3. Infectious complications | ||
| Parenteral | 137 (3 RCTs) | I2 = 0%, P = 0.35 |
| Enteral | 2667 (7 RCTs) | |
| 2.4. Length of mechanical ventilation | ||
| Parenteral | 73 (2 RCTs) | I2 = 85.4%, P < 0.01 |
| Enteral | 2927 (10 RCTs) | |
| 3. Type of participant | ||
| 3.1. Length of hospital stay | ||
| Surgical participants | 223 (5 RCTs) | I2 = 0%, P = 0.55 |
| Medical participants | 1354 (5 RCTs) | |
| 3.2. Length of ICU stay | ||
| Surgical participants | 158 (3 RCTs) | I2 = 0%, P = 0.52 |
| Medical participants | 2784 (8 RCTs) | |
| 3.3. Infectious complications | ||
| Surgical participants | 220 (4 RCTs) | I2 = 0%, P = 0.45 |
| Medical participants | 2584 (6 RCTs) | |
| 3.4. Length of mechanical ventilation | ||
| Surgical participants | 156 (3 RCTs) | I2 = 0%, P = 0.45 |
| Medical participants | 2854 (9 RCTs) | |
| 4. Amount of calories received by each study group | ||
| 4.1. Length of hospital stay | ||
| Normo‐hypercaloric | 97 (2 RCTs) | I2 = 84.1%, P < 0.01 |
| Hypocaloric | 1370 (6 RCT) | |
| Very hypocaloric | 150 ( RCT) | |
| 4.2. Length of ICU stay | ||
| Normo‐hypercaloric | 75 (2 RCTs) | I2 = 0%, P = 0.42 |
| Hypocaloric | 1517 (6 RCTs) | |
| Very hypocaloric | 1350 (3 RCTs) | |
| 4.3. Infectious complications | ||
| Normo‐hypercaloric | 97 (2 RCTs) | I2 = 0%, P = 0.94 |
| Hypocaloric | 1357 (5 RCTs) | |
| Very hypocaloric | 1350 (3 RCTs) | |
| 4.4. Length of mechanical ventilation | ||
| Normo‐hypercaloric | 73 (2 RCTs) | I2 = 73.1%, P = 0.02 |
| Hypocaloric | 1517 (6 RCTs) | |
| Very hypocaloric | 1350 (3 RCTs) | |
| RCT = randomized controlled trial; ICU = Intensive care unit | ||
| Outcome or subgroup title | No. of studies | No. of participants | Statistical method | Effect size |
| 1 Mortality in hospital Show forest plot | 9 | Risk Ratio (M‐H, Fixed, 95% CI) | Totals not selected | |
| 2 Mortality in ICU Show forest plot | 4 | Risk Ratio (M‐H, Fixed, 95% CI) | Totals not selected | |
| 3 Mortality at 30 days Show forest plot | 7 | Risk Ratio (M‐H, Fixed, 95% CI) | Totals not selected | |
| 4 Length of Hospital stay (days) Show forest plot | 10 | Mean Difference (IV, Random, 95% CI) | Totals not selected | |
| 5 Length of ICU stay (days) Show forest plot | 11 | Mean Difference (IV, Random, 95% CI) | Totals not selected | |
| 6 Infectious complications Show forest plot | 10 | Risk Ratio (M‐H, Random, 95% CI) | Totals not selected | |
| 7 Length of mechanical ventilation (days) Show forest plot | 12 | Mean Difference (IV, Random, 95% CI) | Totals not selected | |
| 8 Non‐infectious complications (diarrhoea) Show forest plot | 3 | Risk Ratio (M‐H, Random, 95% CI) | Totals not selected | |
| 9 Hyperglycaemia Show forest plot | 6 | Risk Ratio (M‐H, Random, 95% CI) | Totals not selected | |
| 10 Hypoglicaemia Show forest plot | 5 | Risk Ratio (M‐H, Fixed, 95% CI) | Totals not selected | |
| 11 Nitrogen balance (g/day) Show forest plot | 3 | Mean Difference (IV, Random, 95% CI) | Totals not selected | |