Prescripción de apoyo nutricional hipocalórico para adultos en estado grave
References
Referencias de los estudios incluidos en esta revisión
Referencias de los estudios excluidos de esta revisión
Referencias de los estudios en curso
Referencias adicionales
Referencias de otras versiones publicadas de esta revisión
Characteristics of studies
Characteristics of included studies [ordered by study ID]
Jump to:
| Methods | Study design: prospective, randomized controlled trial. Study dates: “study dates not available" Setting: level‐1 trauma centre. Department of Surgery, Detroit Receiving Hospital, Wayne State University, Detroit, Michigan Country: USA | |
| Participants | Inclusion criteria
Exclusion criteria
Sample size: calculated sample size of 26 participants to detect an absolute difference in glucose area under the curve of 50 mg hr/dl with 80% power (P = 0.05). 40 participants were randomized: 20 to each group. Only 18 were ICU participants (8 of the low caloric and 10 of the standard group). At baseline both groups were well matched, with exception of lower creatinine clearance in the standard group. Age (years mean ± SD) group 1: 45.3 ± 17.2; group 2: 53.1 ± 17.9 Sex (male, %) group 1: 75; group 2: 80 Most frequent admitting diagnosis (groups 1 and 2 respectively): pancreatitis 6 & 6, trauma 7 & 3, bowel obstruction 4 & 5. ICU participants (n). group 1: 8; S group 2: 10 APACHE II score (mean ± SD of participants in ICU). Group 1: 20.1 ± 9.1; Group 2: 18.6 ± 11.1 Mechanical ventilation (n). 8 participants in each group Baseline nutrition status No major differences between ideal and actual body weight in both groups Duration of parenteral nutrition (days; median (interquartile range)). group 1 6 (4 to 10); group 2 7 (5 to 10) | |
| Interventions | Group 1, low caloric parenteral nutrition (n = 20)
Group 2, standard parenteral nutrition (n = 20)
In both groups, parenteral nutrition was administered by a multiple‐bottle system. Lipids administration was standardized to 1000 kcal 3 times weekly. Proteins administered according the levels of estimated metabolic stress of the disease (mild 1.2 ‐ 1.4; moderate 1.5 ‐ 1.7; or severe 1.8 ‐ 2.2 gr/kg/day) | |
| Outcomes | Primary outcomes
Incidence of hyperglycaemia was calculated as the number of assessments of glycaemia ≥ 200 mg/dl divided by the total number of assessments Severity of hyperglycaemia was assessed by measuring the area under the curve Secondary outcomes
| |
| Funding sources | Not available | |
| Declarations of interest | The authors have no financial interests to disclose | |
| Notes | Total calories administered/kg (median (interquartile range)) were: 26.6 (26.2 to 27.5) and 37.0 (36.6 to 38.4); the amount of protein administered and the duration of PN therapy were similar. The first author sent the data of continuous outcomes expressed as mean and standard deviation. | |
| Risk of bias | ||
| Bias | Authors' judgement | Support for judgement |
| Random sequence generation (selection bias) | Low risk | Participants were randomly assigned by means of a computer‐generated random‐numbers |
| Allocation concealment (selection bias) | Low risk | Central allocation (pharmacist) |
| Blinding of participants and personnel (performance bias) | Low risk | Clinicians were blinded to which caloric group participants were randomized to, with the exception of the critical care pharmacist who calculated the formula. |
| Blinding of outcome assessment (detection bias) | Low risk | Clinicians were blinded to which caloric group participants were randomized to, with the exception of the critical care pharmacist who calculated the formula. |
| Incomplete outcome data (attrition bias) | Low risk | All outcomes: outcome data were available for all participants. |
| Selective reporting (reporting bias) | Low risk | All outcomes reported |
| Other bias | Low risk | No evidence of other bias |
| Methods | Study design: prospective, randomized controlled trial Study dates: April 2006 to January 2008 Setting: 1 tertiary care academic hospital Country: Saudi Arabia | |
| Participants | Inclusion criteria
Exclusion criteria
Sample size: authors estimated a relative difference of 50% in ICU mortality between participants receiving .90% of caloric requirements and those receiving 60% to70% of caloric requirements (28% compared with 14%). Quote: “on the basis of an estimated 28‐d mortality rate of 25%, a power of 0.8, and an α of 0.05, the number of subjects needed to show a reduction in mortality was 120 in each group.” Age (years): intervention group: 50.3 ± 21.3; Control group: 51.9 ± 22.1 Sex (male, %): intervention group: 71.1; Control group: 65 Primary disease of the participants Intervention; Control group Admission category (n (%)) Nonoperative 95 (79.2); 103 (85.8) Postoperative 25 (20.8); 17 (14.2) Traumatic brain injury 35 (29.2); 31 (25.8) Disease severity score: APACHE II Intervention group: 25.2 ± 7.5; Control group: 25.3 ± 8.2 Mechanical ventilation n (%) Intervention group: 119 (99.2); Control group: 119 (99.2) Comorbidities: not available Nutrition status: intervention group; Control group: Not available Level of inflammation: not available | |
| Interventions | Intervention Group 1 (n = 120)
Control Group 2 (n = 120)
Quote: “for both groups, caloric requirement was estimated by the dietitian using the Harris‐Benedict equations and adjusting for stress factors. The selection of formula was left to discretion of the attending physician as long as it satisfied the total caloric intake criteria and was not enriched with immunonutrients. Calculation of caloric intake took into account intravenous dextrose and propofol infusions.” Quote: “the patients were followed until discharge from the ICU, except if the patient tolerated oral feeding, had a do‐not‐resuscitate order written (after enrolment), or became brain dead (after enrolment). In the latter situations, the intervention was stopped but the outcome data were collected.” Co‐interventions Quote:“The protein requirement was calculated as 0.8–1.5 g/kg on the basis of patient condition and underlying diseases. To avoid protein malnutrition in the permissive underfeeding group, additional protein (Resource Beneprotein; Nestle Healthcare Nutrition Inc, Minneapolis, MN) was added to maintain the full protein requirement without affecting the assigned caloric intake.” | |
| Outcomes | Primary outcome
Secondary outcomes
How measured or definition and time point measured
Subgroups
| |
| Funding sources | Funded by King Abdulaziz City for Science and Technology (LG 10‐30). | |
| Declarations of interest | No potential conflict of interest relevant to this article was reported. | |
| Notes | As it was a 2 x 2 factorial trial, the enrolled participants were randomly assigned by using concealed envelops to 1 of the 4 study groups: 1‐permissive underfeeding with intensive insulin therapy (IIT), 2‐permissive underfeeding with conventional insulin therapy (CIT), 3‐target feeding with IIT, and 4‐target feeding with CIT. We grouped 1 and 2; 3 and 4. Blood glucose concentration target was 4.4 – 6.1 mmol/L (80 – 110 mg/dL) in the IIT group and 10 – 11.1 mmol/L (180 – 200 mg/dL) in the CIT group. The frequency of blood glucose monitoring increased to every 20 mins when blood glucose concentrations decreased to > 3.2 mmol/L (58 mg/dL) and reduced to every 2 – 4 hrs when measurements were stable. | |
| Risk of bias | ||
| Bias | Authors' judgement | Support for judgement |
| Random sequence generation (selection bias) | Low risk | On the basis of (quote:) "computer‐generated random permuted blocks" |
| Allocation concealment (selection bias) | Low risk | The enrolled participants were randomly assigned by using concealed envelopes. |
| Blinding of participants and personnel (performance bias) | Unclear risk | Unblinded study. Details on healthcare processes to be followed by personnel (e.g. co‐interventions) were not described in order to make an appropriate judgement on possible performance bias. |
| Blinding of outcome assessment (detection bias) | Low risk | Not blinded but main and secondary outcomes well‐defined. We judge that the outcome measurement was probably not influenced by lack of blinding. |
| Incomplete outcome data (attrition bias) | Low risk | All outcomes: outcome data were available for all participants. |
| Selective reporting (reporting bias) | Low risk | All outcomes reported |
| Other bias | Low risk | No evidence of other bias |
| Methods | Study design: prospective, randomized controlled trial Study dates: November 2009 to September 2014 Setting: 7 tertiary care centres Country: Saudi Arabia and Canada | |
| Participants | Inclusion criteria
Exclusion criteria
Sample size With 432 participants in each group; with an estimated 3% loss to follow‐up, the final calculated sample size was 892 participants. Permissive underfeeding would be associated with an absolute risk reduction in mortality of 8 percentage points. Assuming an estimated 90‐day mortality of 25% with standard feeding, they estimated that enrolment of 432 participants in each group would give the study 80% power. Age (years): intervention group: 50.2 ± 19.5; Control group: 50.9 ± 19.4 Sex (male, %): intervention group: 65.2; Control group: 63.2 Primary disease of the participants Intervention; Control group Medical no. (%) 336 (75.0); 335 (75.1) Surgical no. (%) 19 (4.2); 12 (2.7) Nonoperative trauma no. (%) 93 (20.8); 99 (22.2) Severe sepsis at admission no. (%) 159 (35.5); 133 (29.8) Traumatic brain injury no. (%) 55 (12.3); 63 (14.1) Disease severity score: APACHE II Intervention group: 21.0 ± 7.9; Control group: 21.0 ± 8.2 Mechanical ventilation no. (%) Intervention group: 436 (97.3); Control group: 429 (96.2) Comorbidities: not available Nutrition status: intervention group; Control group Albumin g/litre 28 ± 7; 28 ± 6 Prealbumin g/litre 0.15 ± 0.13; 0.14 ± 0.12 Transferrin g/litre 1.36 ± 0.49; 1.38 ± 0.50 24‐hour urinary nitrogen excretion mmol 284 ± 176; 303 ± 219 Level of inflammation : not available | |
| Interventions | Intervention Group (n = 448)
Control group (n = 446)
For both groups, the calculation of caloric requirements was using the Penn State equation for mechanically‐ventilated participants who had a BMI < 30 and using the 1992 Ireton‐Jones equation for mechanically‐ventilated participants who had a BMI of 30 or higher and for spontaneously‐breathing participants. Protein requirements were calculated at 1.2 to1.5 g per kilogram of body weight a day, in accordance with clinical practice guidelines. Co‐interventions Quote. "to ensure that enteral protein and volume delivery in the permissive‐underfeeding group would be similar to those in the standard‐feeding group, the permissive‐underfeeding group received additional protein (Beneprotein, Nestlé Nutrition) and normal saline or water at a dose of 2 ml per kilogram every 4 hours unless otherwise specified by the clinical team. The assigned intervention was continued for up to 14 days or until ICU discharge, initiation of oral feeding, death, or withholding of nutrition as part of palliation." The study protocol provided suggestions on the selection of enteral formulas on the basis of published guidelines; however, the decision was left to the clinical team. Study centres used their own insulin protocols, with a target blood glucose level of 4.4 to 10 mmol. | |
| Outcomes | Primary outcome
Secondary outcomes
Tertiary outcomes
How measured or definition and time point measured
Subgroups
| |
| Funding sources | Funded by the King Abdullah International Medical Research Center | |
| Declarations of interest | No potential conflict of interest relevant to this article was reported. | |
| Notes | The total caloric intake included calories from propofol, intravenous dextrose and parenteral nutrition. The author provided additional information about mean and standard deviation values of length of hospital and ICU stay and of mechanical ventilation. In 2017, the researchers published a subgroup analysis using a Nutrition Risk In Critically ill (NUTRIC) score. However these subgroup analyses did not contribute to our review objectives. | |
| Risk of bias | ||
| Bias | Authors' judgement | Support for judgement |
| Random sequence generation (selection bias) | Low risk | Quote: "the randomization list was computer‐generated" |
| Allocation concealment (selection bias) | Low risk | Quote: "enrolled patients were randomly assigned to the permissive‐underfeeding group or the standard‐feeding group with the use of opaque, sealed, sequentially numbered envelopes." |
| Blinding of participants and personnel (performance bias) | High risk | PermiT was a multicentre, pragmatic, open‐label international randomized clinical trial. |
| Blinding of outcome assessment (detection bias) | High risk | There was no blinding of outcome assessment. |
| Incomplete outcome data (attrition bias) | Low risk | All outcomes: outcome data were available for 445/448 and 440/446 participants in the intervention and control group respectively. |
| Selective reporting (reporting bias) | Low risk | Authors reported all protocol outcomes. |
| Other bias | Low risk | No evidence of other bias |
| Methods | Study design: prospective, randomized controlled trial Study dates: September 1992 to July 1994 Setting: Trauma surgery service. University of California, Davis, Medical Center Country: USA | |
| Participants | Inclusion criteria
Exclusion criteria
Sample size: 60 participants randomized, data analysed of 57 participants Age (years; mean ± SD). Group 1: 32 ± 9; Group 2: 33 ± 10 Sex (male, %). Group 1: 85%; Group 2: 80% Type of injury (blunt trauma %): Group 1: 85%; Group 2: 80% APACHE II score (mean ± SD). Group 1: 22 ± 5; Group 2: 23 ± 6 Injury severity score (mean ± SD). Group 1: 30 ± 9; Group 2: 27 ± 8 Nutrition status. On admission no participants weighted less than ideal body weight | |
| Interventions | Participants randomized at the 5th post‐injury day. 10 days study period with parenteral nutrition. No lipid group (Group 1) (n = 27)
Lipid group (Group 2) (n = 30)
| |
| Outcomes |
Outcomes evaluated after 10 days of parenteral nutrition Other outcomes
| |
| Funding sources | Study supported in part by National Institutes of Health Grant P30 DK‐35747 | |
| Declarations of interest | Not reported | |
| Notes | ||
| Risk of bias | ||
| Bias | Authors' judgement | Support for judgement |
| Random sequence generation (selection bias) | Unclear risk | Not described. |
| Allocation concealment (selection bias) | Unclear risk | Not described. |
| Blinding of participants and personnel (performance bias) | Unclear risk | Not described. |
| Blinding of outcome assessment (detection bias) | Unclear risk | Not described. |
| Incomplete outcome data (attrition bias) | Low risk | Reasonable explanation: quote: "Of the 60 patients enrolled, only 57 had data that could be analysed. One patient was ineligible for the study because he had been admitted for management of an entero‐cutaneous fistula that had resulted as a complication of a remote trauma and two patients died before being randomized (before the fifth post injury day)". |
| Selective reporting (reporting bias) | Low risk | All outcomes reported |
| Other bias | Low risk | No evidence of other bias. |
| Methods | Study design: prospective, randomized controlled trial Study dates: March 2008 to November 2011 Setting: Surgical/trauma ICU at a tertiary‐care hospital. Department of Surgery, University of Virginia Health System. Charlottesville, Virginia Country: USA | |
| Participants | Inclusion criteria
Exclusion criteria
Sample size: From 2892 admissions to the ICU 83 participants were enrolled and randomized: 41 to the hypocaloric group and 42 to the eucaloric group (detailed flow diagram given of the randomization, exclusion and study end) Age (years; mean ± SD). Hypocaloric group 50.4 ± 2.8; Eucaloric group 53.4 ± 2.7 Sex (male, %). Group 1: 58.3; Group 2: 73.8 Primary disease. Trauma admission (%). Group 1: 68.3; Group 2: 59.5. The other participants in the surgical ICU were abdominal, vascular, orthopaedic and liver transplant surgery. Disease severity, APACHE II score (mean ± SD) Group 1: 16.6 ± 0.9; Group 2: 17.3 ± 0.8 Mechanical‐ventilation dependence (%). Group 1: 68.3; Group 2: 57.1 Comorbidities. Diabetes mellitus and coronary artery disease (%). Group 1. 19.5 and 17.1 respectively; Group 2: 14.3 and 11.9 respectively Nutrition status BMI (kg/m2, mean ± SD). Group 1: 32.9 ± 2.0; Group 2: 28.1 ± 0.9 Risk of refeeding syndrome at admission (due to weigh loss, poor caloric intake or alcohol abuse) (%). Group 1: 31.7; Group 2: 54.8 Level of inflammation: not available | |
| Interventions | Group 1 hypocaloric (n = 41)
Group 2 eucaloric (n = 42)
Co‐interventions: the protein goal of the 2 groups was 1.5 grams protein/kg/day. If the participant’s actual weight was > 130% of ideal weight, adjusted weight was used. Participants with severe malnutrition not able to receive enteral nutrition were considered for parenteral nutrition, all others received enteral nutrition. In cases of enteral feeding intolerance, parenteral nutrition was started after 5 to 7 days. | |
| Outcomes | Primary outcome
Secondary outcomes
Subgroups
| |
| Funding sources | Supported by grant 5‐T32‐AI‐078875‐03 from the National Institute of Health, USA | |
| Declarations of interest | The authors stated that “No conflicts of interest were reported” | |
| Notes | Due to slow enrolment, the study was closed before the planned enrolment of 116 participants. Enteral nutrition was given initially. Participants were considered for parenteral nutrition if they were severely malnourished and could not receive enteral feeding, or in case of continuous intolerance of enteral nutrition lasting more than 5 to 7 days. The author provided additional information: mean and standard deviation of the length of mechanical ventilation and to complete the 'Risk of bias' table. | |
| Risk of bias | ||
| Bias | Authors' judgement | Support for judgement |
| Random sequence generation (selection bias) | Low risk | Participants were randomly allocated 1:1 by using a computer‐based random number generator |
| Allocation concealment (selection bias) | Low risk | Quote: "investigators were blinded to the preparation of the randomization envelopes, and the randomization assignment was determined by opening sequential opaque security envelopes containing the randomization assignment." |
| Blinding of participants and personnel (performance bias) | High risk | There was no blinding of participants or personnel. |
| Blinding of outcome assessment (detection bias) | Low risk | Outcome assessment was blinded (written information provided by the author). |
| Incomplete outcome data (attrition bias) | Low risk | All outcomes: outcome data were available for all participants. |
| Selective reporting (reporting bias) | Low risk | The study protocol is not available but it is clear that the published reports include all expected outcomes, including those that were prespecified. |
| Other bias | Low risk | No evidence of other bias |
| Methods | Study design: prospective, randomized controlled trial Study dates: Not stated Setting: participants referred to the Nutrition Support Service of the Ohio State University Hospital. Departments of Surgery and Medical Dietetics. College of Medicine. Ohio State University. Columbus, Ohio Country: USA | |
| Participants | Inclusion criteria
Exclusion criteria
Sample size: 30 participants, stratified according their hospitalization in ICU (n = 13) or regular floor (n = 17) (randomized with separate randomization tables) Age (years; mean ± SD; whole sample): Group 1: 52 ± 19; Group 2: 52 ± 15 Sex (male, %: whole sample): Group 1: 31.25; Group 2: 14.29 Primary disease of the participants, surgical diseases. 70% of the whole‐sample diagnosis were cancer with or without enterocutaneous fistulae and pancreatic disease. Nutrition status. Body weight/BMI (kg and kg/m2 respectively; mean ± SD; whole sample). Group 1: 97 ± 19 and 36 ± 5. Group 2: 90 ± 17 and 34 ± 6 Comorbidities. Diabetes type 1 and 2 (n of ICU participants) Group 1: 2 and 1; Group 2: 2 and 2 Disease severity score. APACHE II score at the time of enrolment (mean ± SD of the ICU participants). Group 1: 13 ± 5; Group 2: 15 ± 5 Level of inflammation Initial urinary urea nitrogen (grams/24 hours; mean ± SD of the ICU participants). Group 1: 10.1 ± 9.0; Group 2: 10.0 ± 4.2 Duration of PN (days; mean ± SD). Group 1: 10 ± 3; Group 2: 12 ± 2 | |
| Interventions | Group 1 hypocaloric PN (whole sample n = 16; n of ICU participants = 6) has 50% of the carbohydrate and lipid compared with the standard PN. Group 2 standard PN (whole sample n = 14; n of ICU participants = 7) Co‐interventions: both PN solutions were isonitrogenous, providing 2 grams of protein/kg ideal body weight/day, added with electrolytes, vitamins and trace elements, administered during ≤ 14 days or until they could receive enteral or oral feeding. | |
| Outcomes |
Time points reported
Subgroups
| |
| Funding sources | Supported by funds from the Bremer Foundation, Department of Surgery Medical Research Development Fund, and Surgical Research, Inc. | |
| Declarations of interest | Not available | |
| Notes | Both groups of participants in ICU had moderate severity of diseases by APACHE II scores, the initial urinary urea nitrogen and the mortality rate (15%). | |
| Risk of bias | ||
| Bias | Authors' judgement | Support for judgement |
| Random sequence generation (selection bias) | Low risk | Participants were then randomly assigned to receive either the control parenteral nutrition (PN) formula or the hypoenergetic PN formula by using separate randomization tables by the investigational pharmacist in the research pharmacy of the hospital. |
| Allocation concealment (selection bias) | Low risk | Participants randomly assigned to receive either the control PN formula or the hypoenergetic PN formula by using separate randomization tables (ICU or regular floor) by the research pharmacist of the hospital (Central allocation) |
| Blinding of participants and personnel (performance bias) | Low risk | All care providers as well as participants were blinded to the nutrient composition of the parenteral formulas. |
| Blinding of outcome assessment (detection bias) | Low risk | Double‐blinded. All care providers as well as participants were blinded to the nutrient composition of the parenteral formulas. |
| Incomplete outcome data (attrition bias) | Low risk | All outcomes: outcome data were available for all participants. |
| Selective reporting (reporting bias) | Low risk | Not clearly described research outcomes, although: (quote:) "this study was designed to determine whether a restricted energy parenteral formulation providing 2 gr protein/kg ideal body weight could be administered to acutely ill obese participants with the same degree of efficacy as a standard parenteral nutrition solution provided to a comparable group of patients". Participants located in the intensive care unit and those with diabetes mellitus were included in the study population to determine the efficacy of this treatment in critically‐ill participants and to assess the effect on glycaemic control in obese diabetic participants. Results were reported regarding this description and more detailed measurement methods described in the appropriate section. |
| Other bias | Unclear risk | Not clear if any bias could have been introduced by some of the funders |
| Methods | Study design: prospective, randomized controlled trial Study dates: May 1999 to December 2000 Setting: Medical ICU, Barnes‐Jewish Hospital, affiliated to Washington University School of Medicine. St. Louis, Missouri Country: USA. | |
| Participants | Inclusion criteria
Exclusion criteria
Sample size 189 consecutive participants were evaluated for enrolment, with 39 not included for different reasons, and 150 finally included and analysed. 75 participants were randomized to each study group. The estimated sample size for a significant reduction of the incidence of pneumonia (primary outcome) was 82 participants in each study group. Age (years, mean ± SD). Group 1: 59.1 ± 19.0; Group 2: 56.5 ± 15.6 Sex (% of male). Group 1: 46.7; Group 2: 37.3 Primary reason for ICU admission. Respiratory diseases (%). Group 1: 58.7; Group 2: 64.0 Disease severity: APACHE II score. Group 1: 25.6 ± 8.3; Group 2: 24.7 ± 8.4 PaO2/FiO2 (mean ± SD). Group 1: 204 ± 108; Group 2: 207 ± 126 Predicted mortality based on APACHE II score (%, mean ± SD). Group 1: 48.7 ± 24.9; Group 2: 49.6 ± 23.9 Process of care variables: with 2 exceptions, all of them had statistically non‐significant differences between the study groups: Duration of enteral nutrition and of mechanical ventilation (days, mean ± SD respectively). Group 1: 5.2 ± 5.9 and 8.1 ± 7.4; Group 2: 9.9 ± 12.3 and 12.9 ± 15.7 respectively. Comorbidities, nutrition status and level of inflammation: not reported | |
| Interventions | Group 1 late feeding‐hypocaloric (n = 75)
Group 2 early feeding‐normocaloric (n = 75)
Co‐interventions The goal for enteral nutrition daily requirements were defined as 25 kcal/kg ideal body weight/day and 1 to 1.3 grams of protein/kg ideal body weight/day. The enteral nutrition, with a polymeric iso‐osmolar formula, was administered in the stomach by bolus feeding, through an orogastric tube inserted on day 1 of mechanical ventilation. In case of 3 consecutive gastric residual volumes > 150 ml, a post‐pyloric enteral tube was inserted for continuous drop enteral nutrition. | |
| Outcomes | Primary outcome
Secondary outcomes
How measured or defined
Time of measurements
Subgroups
| |
| Funding sources | Supported in part by a grant from the Barnes‐Jewish‐Christian Health Care Innovations Program | |
| Declarations of interest | Information not available | |
| Notes | The total calories and protein received by the participants showed a statistically significant difference between the study groups, but participants in each group only received a percentage of the defined goals during the first 5 days of mechanical ventilation: in the hypocaloric group the participants received 7% of their estimated caloric requirements and 7.7% of the estimated protein requirements, and in the control group they received 27.9% and 26.9% respectively. | |
| Risk of bias | ||
| Bias | Authors' judgement | Support for judgement |
| Random sequence generation (selection bias) | High risk | The study allocated participants to treatment groups based on the date of their ICU admission using a quasi‐randomized design (odd/even‐numbered days). |
| Allocation concealment (selection bias) | High risk | The study allocated participants to treatment groups based on the date of their ICU admission using a quasi‐randomized design. |
| Blinding of participants and personnel (performance bias) | Unclear risk | Unblinded study. Details on healthcare processes to be followed by personnel (e.g. co‐interventions) were not described in order to make an appropriate judgement on possible performance bias. |
| Blinding of outcome assessment (detection bias) | Low risk | Not blinded but main and secondary outcomes well‐defined. We judge that the outcome measurement was probably not influenced by lack of blinding. |
| Incomplete outcome data (attrition bias) | Low risk | All outcomes: outcome data were available for all participants. |
| Selective reporting (reporting bias) | High risk | Some prespecified secondary outcomes (duration of mechanical ventilation, need for gastrostomy tube) not reported |
| Other bias | Low risk | No evidence of other bias |
| Methods | Study design: prospective, randomized, controlled non‐blinded trial Study dates: Not stated Setting: single‐centre, university‐affiliated teaching hospital with a dedicated total parenteral nutrition (TPN) service. Beth Israel Deaconess Medical Center and Harvard Medical School, Boston, Massachusetts Country: USA | |
| Participants | Inclusion criteria
Exclusion criteria
Sample size 48 participants were initially included, but 4 in each group were excluded from the analysis because of PN duration ≤ 4 days, leaving 21 participants in the hypocaloric group and 19 in the control group Age (years; mean ± SD). Group 1 hypocaloric: 57.5 ± 14.9; Group 2 control: 56.6 ± 20.4 Sex (% male): Group 1: 57; Group: 53 Primary disease of the participants. Mainly surgical participants with different types of complications. Major differences between groups: Group 1 acute pancreatitis and bowel surgery/postoperative ileus: n = 6 and 3 participants respectively; Group 2 n = 1 and 6 respectively. Mechanically‐ventilated participants (n). Hypocaloric group: 11; Control group: 6 Comorbidities. Diabetes (n). Group 1: 5 participants; Group 2: 2 participants. Obesity: 4 participants in each group Nutrition status. BMI (mean ± SD). Group 1: 27.6 ± 8.1; Group 2: 25.7 ± 6.2 | |
| Interventions | Group 1 hypocaloric (n = 21)
Group 2 control (n = 19)
Co‐interventions
| |
| Outcomes |
Time points of measurements
| |
| Funding sources | Not available | |
| Declarations of interest | Not available | |
| Notes | Due to a protocol violation, fat was given to 1 participant in the hypocaloric group. Some results associated with hospital rules to avoid iatrogenic hyperglycaemia by gradual increase of nutrients to avoid complications.The hypocaloric group also received less protein than the control group. More participants in the hypocaloric group had acute pancreatitis and mechanical ventilatory support than in the control group. The hypocaloric group received 14 ± 3 kcal/kg/day and the control group 18 ± 4 kcal/kg/day (also hypocaloric). The hypocaloric group not only received significantly fewer calories than the control group (due to fewer dextrose and fat calories), but also less protein (1.1 ± 0.2 versus 1.3 ± 0.2 in the control group). If the infection rate trend observed were to persist, they calculated the study would have required ˜174 participants to see a statistical difference between the 2 groups. | |
| Risk of bias | ||
| Bias | Authors' judgement | Support for judgement |
| Random sequence generation (selection bias) | Unclear risk | Not mentioned |
| Allocation concealment (selection bias) | Unclear risk | Not mentioned |
| Blinding of participants and personnel (performance bias) | High risk | No blinding: the standard group received parenteral nutrition as 3‐in‐1 bags, and the hypocaloric group received 1 litre of fat‐free parenteral nutrition. Outcomes could have been influenced by different performance of clinical personnel. |
| Blinding of outcome assessment (detection bias) | High risk | No blinding and not clearly‐defined and objective outcomes that would warrant a low risk of detection bias |
| Incomplete outcome data (attrition bias) | High risk | 4 participants in each group were excluded from the data analysis because of a TPN duration of ≤ 4 days (not prespecified exclusion criteria). |
| Selective reporting (reporting bias) | High risk | Nitrogen balance was only measured in 12 participants (57%) in the hypocaloric and 10 (53%) of the control group, usually because of an error during collection. |
| Other bias | Unclear risk | The lack of detail in the description of the Methods section could not warrant a low risk of other sources of bias. |
| Methods | Study design: prospective, randomized controlled trial Study dates: January 2008 to April 2011 Setting: 44 ICUs of the National Heart, Lung, and Blood Institute Acute Respiratory Distress Syndrome (ARDS) Clinical Trials Network Country: USA | |
| Participants | Inclusion criteria
Exclusion criteria
Sample size 500 participants for each arm, to detect a 2¼‐day difference in ventilator‐free days (VFDs), assuming a mean of 14 ± 10.5 VFDs. power: 91% α: 0.05 Age (years): intervention group: 52 ± 17; Control group: 52 ± 16 Sex (male, %): intervention group: 53; Control group: 49 Primary disease of the participants Diagnosis:% intervention group/% control group Medical ICU: 61; 63 Primary lung injury category % intervention group/control group Pneumonia 67; 63 Sepsis 16; 13 Aspiration 8; 11 Trauma 3; 4 Transfusion 1; 2 Disease severity score: APACHE III Intervention group: 92 ± 28; Control group: 90 ± 27 Mechanical ventilation 100% in each group (inclusion criterion) Comorbidities: % intervention group; % control group Diabetes: 27; 29 No other data available Nutrition status: not available Level of inflammation: not available | |
| Interventions | Intervention (trophic) Group 1 (n = 508)
Control Group 2 (n = 492)
Co‐interventions
| |
| Outcomes | Primary outcome
Secondary outcomes
How measured or definition
Subgroups
| |
| Funding sources | Supported by National Heart, Lung, and Blood Institute (NHLBI) contracts HHSN268200536165C and HHSN268200536179C | |
| Declarations of interest | Authors have not disclosed any potential conflicts of interest. | |
| Notes | The initial 272 participants were also simultaneously randomized to a separate trial (the OMEGA study) comparing a nutritional supplement containing omega‐3 fatty acids and antioxidants with an isocaloric, isovolemic control in a 2 x 2 factorial design. After the Data and Safety Monitoring Board stopped the OMEGA portion of the factorial design, participants randomized to the initial trophic‐feeding group received additional calories to compensate for the calories that had been received in the OMEGA study (240 ml volume a day). We asked the first author for some data not reported in the manuscript or reported differently. He gave us the data we used in the meta‐analysis for the following outcomes: 28‐day mortality, length of ICU stay (days from randomization to first ICU discharge); length of mechanical ventilation (ventilator days up to day 28); hyperglycaemia (participants with any on‐study glucose > 200 mg/dl); incidence of total infectious complications and of diarrhoea, and the amount of calories received by both groups of participants. The author also informed they did not have duplicate participants with the Rice 2011 study. | |
| Risk of bias | ||
| Bias | Authors' judgement | Support for judgement |
| Random sequence generation (selection bias) | Low risk | Participants were randomized by a web‐based randomization system, stratified by site and presence of shock at enrolment, to receive either trophic or full enteral feeding for the first 6 days of mechanical ventilation. |
| Allocation concealment (selection bias) | Low risk | Participants were randomized by a web‐based randomization system, stratified by site and presence of shock at enrolment, to receive either trophic or full enteral feeding for the first 6 days of mechanical ventilation. |
| Blinding of participants and personnel (performance bias) | Unclear risk | Unblinded study. Details on healthcare processes to be followed by personnel (e.g. co‐interventions) were not described in order to make an appropriate judgement on possible performance bias. |
| Blinding of outcome assessment (detection bias) | Low risk | Outcome assessment was not blinded but most outcomes were objective. |
| Incomplete outcome data (attrition bias) | Low risk | Only 1 participant lost, from the control group. All analyses were by intention‐to‐treat. |
| Selective reporting (reporting bias) | Low risk | All planned outcomes were reported. All analyses were by intention‐to‐treat. |
| Other bias | Low risk | No evidence of other bias |
| Methods | Study design: single‐centre double‐blind, randomized controlled trial Study dates: Not stated Setting: Nutrition and neurosurgery departments. Mashad University of Medical Sciences. Mashad Country: Islamic Republic of Iran | |
| Participants | Inclusion criteria
Exclusion criteria
Sample size 60 participants randomized Age: not reported Sex: not reported Primary disease: head trauma Disease severity: not reported Mechanical ventilation: number of participants not reported Comorbidities: not reported Nutrition status: not reported Level of inflammation: not reported | |
| Interventions | Group 1 permissive underfeeding (n = not reported )
Group 2 standard full calorie (n = not reported)
All participants received enteral nutrition | |
| Outcomes | Primary outcome
Secondary outcomes
No information about measures or definition of the outcomes The participants in the permissive‐underfeeding group received full enteral feeding after the 7th day of the study. No subgroups reported | |
| Funding sources | Not available | |
| Declarations of interest | None declared | |
| Notes | Available only in abstract form. Poster presentation in the 35th ESPEN Congress (Leipzig, Germany, August 2013) | |
| Risk of bias | ||
| Bias | Authors' judgement | Support for judgement |
| Random sequence generation (selection bias) | Unclear risk | Only mentioned in the abstract (quote:) "head trauma randomly assigned to a double‐blind randomized controlled clinical trial" |
| Allocation concealment (selection bias) | Unclear risk | Same as above |
| Blinding of participants and personnel (performance bias) | Unclear risk | Mentioned that was double‐blind, but did not report the methodology |
| Blinding of outcome assessment (detection bias) | Unclear risk | Mentioned that was double‐blind, but did not report the methodology |
| Incomplete outcome data (attrition bias) | Unclear risk | Not mentioned in the abstract |
| Selective reporting (reporting bias) | Unclear risk | Not mentioned in the abstract |
| Other bias | Unclear risk | Insuficient information to make judgement (abstract only) |
| Methods | Study design: prospective, randomized controlled trial Study dates: July 2008 to December 2010 Setting: 1 tertiary medical ICU Country: Germany | |
| Participants | Inclusion criteria
Exclusion criteria
Sample size: not available Age (years): intervention group: 67.6 ± 11.5; Control group: 64.3 ± 11.5 Sex (male, %): intervention group: 70; Control group: 63 Primary disease of the participants Diagnosis: % intervention group; % control group Sepsis: 25; 28 Acute cardiovascular dysfunction: 30; 46 Acute respiratory insufficiency: 22; 33 Other: 9; 11 Disease severity score: APACHE II Intervention group: 28.6 ± 6.5; Control group: 27.7 ± 8.4 Mechanical ventilation: not available Comorbidities: % intervention group; % control group Underlying chronic disease: None: 26; 43 Diabetes mellitus: 33; 20 Respiratory: 31; 22 Cardiovascular: 19; 20 Neuropsychiatric: 0; 20 Other: 9; 13 Nutrition status: not available Level of inflammation: not available | |
| Interventions | Intervention group 1 (n = 54)
Control group 2 (n = 46)
For both groups, energy expenditure was measured with an indirect calorimeter (Deltatrac II, Datex Ohmeda, Helsinki, Finland). If this was not possible, the Ireton‐Jones prediction equation was used. Co‐interventions Quote: “artificial nutrition support was started within 24 hours of ICU admission. Enteral feeding was favoured in every case if there was no sign of gastrointestinal intolerance (defined as gastric aspirate > 300 mL/d) and/or diarrhoea. Diarrhoea was defined as at least 3 watery bowel movements per day or continuous watery stool. In case of enteral feeding, the target energy supply was to be achieved on day 3 at the latest. A commercially available standard solution with a caloric concentration of 1 kcal/mL was used in every case. If at least 70% of the target caloric supply was considered not to be achieved on day 3 via the enteral route based on gastrointestinal tolerance and the consensus of the managing physicians together with members of the trial group, participants received supplementary parenteral nutrition. The expected deficit was calculated everyday during the morning hours by one of the study authors and supplementary PN prescribed as required. If enteral nutrition (EN) was to be interrupted for unforeseen reasons during the course of the day (diagnostic or therapeutic procedures), adjustment of the supply rate was carried out depending on clinical judgment as to whether an increased rate would be tolerated by the participant. In such cases, possible caloric deficits were not compensated with PN. Causes of the feeding interruptions were recorded if the interruption lasted at least an hour. The blood glucose level was monitored every 3 hours. The insulin dose was adjusted to a target blood glucose level of 6–8 mmol/L.” | |
| Outcomes | Primary end point
Secondary end points
| |
| Funding sources | None declared | |
| Declarations of interest | None declared | |
| Notes | Study originally published as a congress abstract with few results. The first author answered several questions, so some of the results originally included in the review came from the information provided by him. During the editorial process the study was published (Petros 2016). All the published data were the same as the first author had originally reported to us. | |
| Risk of bias | ||
| Bias | Authors' judgement | Support for judgement |
| Random sequence generation (selection bias) | Low risk | Electronic randomization list |
| Allocation concealment (selection bias) | Low risk | Quote: "yes, the allocation was concealed. The electronic randomization was managed by coauthors not directly involved in the management of the patients” (written information provided by the author) |
| Blinding of participants and personnel (performance bias) | Unclear risk | The study was single‐blinded (participants were blinded, the ICU personnel were not). Details on healthcare processes to be followed by personnel (e.g. co‐interventions) were not described in order to make an appropriate judgement on possible performance bias. |
| Blinding of outcome assessment (detection bias) | Low risk | Outcome assessment was not blinded but outcomes were objective (written information provided by the author). |
| Incomplete outcome data (attrition bias) | Low risk | All outcomes: outcome data were available for all participants (written information provided by the author) |
| Selective reporting (reporting bias) | Low risk | All outcome assessed were reported (written information provided by the author). |
| Other bias | Low risk | No evidence of other bias |
| Methods | Study design: prospective, randomized controlled trial Study dates: August 2003 to July 2009 Setting: 2 ICUs at a single academic centre Country: USA | |
| Participants | Inclusion criteria
Exclusion criteria
Sample size 94 participants were randomized in each arm. An independent sample t test, designed to demonstrate a 15% relative increase of 3.0 VFDs with 80% power and a 2‐sided P value of 0.05. The study enrolled 200 to allow for a 5% withdrawal rate and compensate for the single interim analysis. Age (years): intervention group: 53 ± 19; Control group: 53 ± 19 Sex (male, %): intervention group: 39.8; Control group: 46.1 Primary disease of the participants: 100% medical diagnosis Acute lung injury: 21; 20 Pneumonia: 15; 19 Altered mental status/neurologic: 14; 15 Sepsis: 10; 12 Overdose: 10; 7 Disease severity score: APACHE II Intervention group: 26.9 ± 8.1; Control group: 26.9 ± 6.6 Mechanical ventilation 100% in each group (inclusion criteria) Comorbidities:% intervention group/ % control group Hypertension 42; 37 Cardiac disease 24; 23 Diabetes 22; 23 Chronic renal insufficiency 18; 12 Chronic obstructive pulmonary disease 16; 18 Immunosuppression 14; 16 Peptic ulcer disease 4; 4 Gastroesophageal reflux 4; 4 Nutrition status : not available Albumin concentration (g/dL) 2.8± 0.6; 2.8± 0.7 Level of inflammation: not available | |
| Interventions | Group 1 (n = 98): trophic group
Group 2 (n = 102): control group
Co‐interventions For both groups, in participants who were extubated and then required re‐intubation, enteral nutrition was started and managed according to the study protocol through study day 28. Elevated gastric residual volumes (GRV) were defined as > 300 cc of gastric contents withdrawn from the gastric tube at one time. GRVs were checked every 6 hours while feeding rates were being increased to full‐energy rates and every 12 hours if the participant was receiving trophic rates or once full‐energy rate was achieved. Gastric residuals were only measured in participants with post‐pyloric feeding tubes if a separate gastric port on the feeding tube or separate gastric tube was in place. Since a single, isolated elevated GRV has been shown to be a poor predictor of enteral nutrition intolerance, feeding rates were not adjusted after a single elevated GRV. After the first episode of elevated GRV, 300 cc was replaced and the feeding rate was maintained. GRV was rechecked in 2 hours. If this recheck was also above 300 cc, feeds were held until GRV decreased below 300 cc and restarted at a rate of 25 cc/hr < the previous rate in the full‐energy group and at 10 cc/hr in the trophic group. | |
| Outcomes |
How measured or definition
Time points measured and time points reported
Subgroups
| |
| Funding sources | Supported, in part, by grants K23HL81431(TWR), P30DK058404 (TWR), and 1 UL1 RR024975 (TWR, GRB) from the National Institutes of Health (Bethesda, MD) | |
| Declarations of interest | Dr Rice, Dr Bernard, and Dr Wheeler received funding from the National Institutes of Health. The remaining authors have not disclosed any potential conflicts of interest. | |
| Notes | Variables were assessed by intention‐to‐treat analyses. Upon our request, the data for the following outcomes was provided by the first author: hospital and 28‐day mortality, length of mechanical ventilation, length of ICU stay and incidence of infectious complications. None of the participants included in this study was included in NHLBI 2012. | |
| Risk of bias | ||
| Bias | Authors' judgement | Support for judgement |
| Random sequence generation (selection bias) | Low risk | Permuted block scheme with a random block size of 2, 4 or 6 participants. |
| Allocation concealment (selection bias) | Low risk | Assignments were placed in consecutively‐numbered, opaque envelopes that were sealed before the start of the study by personnel not associated with the trial. |
| Blinding of participants and personnel (performance bias) | Unclear risk | Unblinded study. Details on healthcare processes to be followed by personnel (e.g. co‐interventions) were not described in order to make an appropriate judgement on possible performance bias. |
| Blinding of outcome assessment (detection bias) | Low risk | Open‐label study but most outcomes were objective. The number of ventilator‐free days to study day 28 was the primary efficacy measure. Secondary end points included 28‐day and hospital all‐cause mortality, organ‐failure‐free days, ICU‐free days, and hospital‐free days to study day 28. Only gastrointestinal intolerance and infections are more subjective. |
| Incomplete outcome data (attrition bias) | Low risk | All participants had complete follow‐up to death or hospital discharge. |
| Selective reporting (reporting bias) | Low risk | All outcomes reported |
| Other bias | Low risk | No evidence of other bias |
| Methods | Study design: prospective, randomized controlled trial Study dates: August 2011 to July 2012 Setting: 30‐bed ICU of a tertiary‐level university hospital Country: Colombia | |
| Participants | Inclusion criteria
Exclusion criteria
Sample size 80 participants: 40 participants in each group to detect an absolute difference in the SOFA score between the 2 measurements of 15% (8.0 expected total score and 1.2 for expected delta SOFA) and a SD between the difference of the means of 3.0. 80% power α error of 0.05 Age (years): intervention group: 53.3 (19.5); Control group: 55.7 (19.5) Sex (male, %): intervention group: 55; Control group: 60 Primary disease of the participants Reasons for admission‐ Intervention/Control group n (%) Respiratory disease 16 (40); 14 (35) CNS disorder 13 (33); 12 (30) Cardiac disease 2 (5); 4 (10) Gastrointestinal disease 0 (0); 3 (8) Other 9 (23); 7 (18) Disease severity score: APACHE II Intervention group: 13.9 ± 4.8; Control group: 15.1 ± 6.2 Mechanical ventilation no. (%) Not available Comorbidities: not available Nutrition status: not available Level of inflammation: not available | |
| Interventions | Intervention Group 1 (n = 40)
Control Group 2 (n = 40)
Co‐interventions "for both groups, it was used an enteral formula in continuous feeding. To reach the protein goal, the study group regimen was enriched with additional protein modules, based on soy protein diluted in water and administered in two daily boluses. Participants in the study group received hyperproteic regimen until day 7, if they needed any further enteral nutrition they were switched to standard nutritional regimen with a goal of 25 kcal/kg/day without protein boluses." | |
| Outcomes | Primary outcome
Secondary outcomes
Subgroups Not available | |
| Funding sources | This research was supported by an unrestricted grant from Lafrancol Colombia. | |
| Declarations of interest | No potential conflict of interest relevant to this article was reported. | |
| Notes | The first author sent us the final manuscript of the study before publication, and answered our questions about the average time of the participants on enteral nutrition, the standard deviation of the calories and proteins received by both groups, why they did not report mortality and the way they gave the protein supplements to achieve the double blinding. | |
| Risk of bias | ||
| Bias | Authors' judgement | Support for judgement |
| Random sequence generation (selection bias) | Low risk | Randomization was performed using dark sealed envelopes with computer‐generated random allocations. |
| Allocation concealment (selection bias) | Low risk | Randomization was performed using dark sealed envelopes with computer‐generated random allocations. |
| Blinding of participants and personnel (performance bias) | Low risk | Double‐blind clinical trial. Although one of the investigators was not blind: (quote:) "only one of the members of the team (JDR) knew patient allocation, prescribed the formulations, and supervised the administration of the regimens; but ICU staff, who decided on daily care patient, was blind to patient allocation". The authors, upon request, gave further explanations about how there was low risk of blinding being broken. |
| Blinding of outcome assessment (detection bias) | Low risk | Double‐blind clinical trial. Although one of the investigators was not blind (quote:) "only one of the members of the team (JDR) knew patient allocation, prescribed the formulations, and supervised the administration of the regimens; but ICU staff, who decided on daily care patient, was blind to patient allocation". The authors, upon request, gave further explanations about how there was low risk of blinding being broken. |
| Incomplete outcome data (attrition bias) | High risk | Quote: "only patients who completed 96 hours of follow‐up were considered for the analysis; patients who did not fulfil the follow‐up period were excluded, and the envelope was returned to the sequence for patient replacement, until completion of the sample size (40 in each group)". Although the inclusion criteria stated that "Study population consisted of adult patients (18 years or older) admitted in the ICU, who were expected to require enteral nutrition through nasoenteric tube for at least 96 hours.", having participants randomized, intervened, and then excluded if they did not have 96 hours of enteral feeding could lead to a high risk of selection bias. Especially if the primary endpoint was "change in SOFA score at 48 hours". The number of excluded participants was significant: "In total, 115 potential patients met the initial inclusion criteria for enrolment, but only 80 completed the follow‐up and were included in the per protocol analysis". |
| Selective reporting (reporting bias) | High risk | Mortality, a secondary outcome, was not reported. Nevertheless, upon request, the authors responded that given that they excluded participants that did not fulfil the 96 hours of enteral nutrition requirement, they did not report mortality because this result would have been biased (they only measured mortality in participants who completed the 96 hours). This is why they did not report it. This is correct, although the best thing would have been to perform an intention‐to‐treat analysis and also report premature deaths. |
| Other bias | Low risk | No evidence of other bias |
| Methods | Study design: prospective, randomized controlled trial Study dates: December 2013 to July 2015 Setting: 30‐bed ICU of a tertiary‐level university hospital Country: Colombia | |
| Participants | Inclusion criteria
Exclusion criteria
Sample size 60 participants in each group to detect a 15% (1.7 points) difference in SOFA at 48 hours between the 2 groups with an SD of 1.9 with a 2‐tailed t test. 80% power α error of 0.05 Age (years): intervention group: 53.8 ± 19.0; Control group: 51.8 ± 20.3 Sex (male, %): intervention group: 45; Control group: 55 Primary disease of the participants Reasons for admission‐ Intervention/Control group n (%) Cardiovascular 7 (12%); 7 (12%) Gastrointestinal 4 (7%); 6 (10%) Hematology 4 (7%); 1 (2%) Orthopaedics 0 (0%); 1 (2%) Respiratory 31 (52%); 22 (37%) Central nervous system 8 (13%); 18 (30%) Trauma 1 (2%); 1 (2%) Urology 1 (2%); 0 (0%) Other 4 (7%); 4 (7%) Disease severity score: APACHE II Intervention group: 13.5 ± 6.4; Control group: 13.7 ± 6.8 Mechanical ventilation no. (%) Not available Comorbidities: not available Nutrition status: intervention group; Control group Subjective global assessment nutritional status, n (%) b A 4 (7%); 4 (7%) B 36 (60%); 43 (72%) C 20 (33%); 13 (22%) Level of inflammation: not available | |
| Interventions | Intervention Group 1 (n = 60)
For both groups, ideal body weight was used to calculate caloric and protein requirements. A commercial enteral formula was adjusted to achieve caloric goals and was enriched with additional modules of whey and soy protein diluted in water, given in 3 or 4 daily boluses. All participants received allocated nutritional regimen until day 7. If further EN was necessary, all participants received normocaloric nutrition. Co‐interventions
| |
| Outcomes | Primary outcome
Secondary outcomes
Subgroups
| |
| Funding sources | This research was supported by an unrestricted grant from Lafrancol Colombia and Hospital Universitario San Ignacio. | |
| Declarations of interest | No potential conflict of interest relevant to this article was reported. | |
| Notes | The study sponsor (Lafrancol S.A) provided an unrestricted grant and was not involved in any of the stages of the study. The authors sent us the full paper of this clinical trial before it was indexed in MEDLINE (registered in clinicaltrials.gov with the Identifier: NCT02577211). They gave us the mean and SD values for length of ICU stay and of mechanical ventilation, and also some additional information to complete the 'Risk of bias' table. | |
| Risk of bias | ||
| Bias | Authors' judgement | Support for judgement |
| Random sequence generation (selection bias) | Low risk | Randomization was performed using dark sealed envelopes with computer‐generated random allocations. |
| Allocation concealment (selection bias) | Low risk | Randomization was performed using dark sealed envelopes with computer‐generated random allocations |
| Blinding of participants and personnel (performance bias) | High risk | The authors considered 1 limitation of the study could be lack of proper blinding of ICU staff. One investigator knew participant allocation and prescribed and supervised the administration of nutritional regimens after randomization. Participants and ICU staff deciding on the rest of medical care were blinded to participant allocation. Nutritional information and regimen formulation were not registered in clinical records, except for general information such as total liquids administered. |
| Blinding of outcome assessment (detection bias) | Unclear risk | It is not clear if outcome assessors were blinded to participant allocation. |
| Incomplete outcome data (attrition bias) | Low risk | All outcome data were reported for non‐excluded participants. |
| Selective reporting (reporting bias) | Low risk | All the outcomes were registered and reported (written information provided by the author) |
| Other bias | Low risk | No other bias (written information provided by the author) |
| Methods | Study design: prospective, randomized controlled trial Study dates: period of one year, but study dates not available Setting: single centre. ICU at Attikon University Hospital. Athens. Greece | |
| Participants | Inclusion criteria
Exclusion criteria
Sample size Total number of participants enrolled: 74 Age (years): whole group age of 68.4 ± 18.4 years Sex (male, %): 38 men included (100%) Primary disease of the participants: all participants met the consensus criteria for sepsis. Disease severity score: at entry overall APACHE II score 22 ± 4. etc. and SOFA score 8 ± 4 Mechanical ventilation: 100% of the participants were mechanically ventilated Comorbidities: not reported Nutrition status: non‐obese participants. Overall BMI ≈ 21.5 ± 3.4 kg/m2 | |
| Interventions | Permisive underfeeding group (n = not available )
Standar protocol feeding group (n = not available)
Same protein intake for both groups: 1.5 gr protein/kg/day Each participant monitored for 14 days | |
| Outcomes | Primary outcome
| |
| Funding sources | Not available. | |
| Declarations of interest | Not available | |
| Notes | This information was extracted from an abstract. We contacted Dr. Maria Theodorakoupoulou to request the missing data (including outcome data). | |
| Risk of bias | ||
| Bias | Authors' judgement | Support for judgement |
| Random sequence generation (selection bias) | Unclear risk | Insufficient information for judgement (abstract only) |
| Allocation concealment (selection bias) | Unclear risk | Insufficient information for judgement (abstract only) |
| Blinding of participants and personnel (performance bias) | Unclear risk | Insufficient information for judgement (abstract only) |
| Blinding of outcome assessment (detection bias) | Unclear risk | Insufficient information for judgement (abstract only) |
| Incomplete outcome data (attrition bias) | Unclear risk | Insufficient information for judgement (abstract only) |
| Selective reporting (reporting bias) | Unclear risk | Insufficient information for judgement (abstract only) |
| Other bias | Unclear risk | Insufficient information for judgement (abstract only) |
Abbreviations:
APACHE = acute physiology and chronic health evaluation; BMI = Body Mass Index ; CD = cluster of differentiation; CIT = conventional insulin therapy; dl = decilitre; EN = enteral nutrition; gr = gram; GRV = gastric residual volumes; hr = hour; ICU = intensive care unit; IIT = intensive insulin therapy; IVFE = Intravenous fat emulsion; kcal = kilocalories; kg = kilograms; mg = milligrams; NHLBI = National Heart, Lung, and Blood Institute; NNIS = National Nosocomial Infection Surveillance; OMEGA = OMEGA study (Rauch 2010); PN = parenteral nutrition; SD = standard deviation; SOFA = sequential organ failure assessment; TPN = total parenteral nutrition; UAB = unassisted breathing; VFD = ventilator‐free days
Characteristics of excluded studies [ordered by study ID]
Jump to:
| Study | Reason for exclusion |
| Non‐randomized or quasi‐randomized controlled trial. Observational cohort study to examine the relationship between the amount of energy and protein administered and clinical outcomes. | |
| Non‐randomized or quasi‐randomized controlled trial assessing hypocaloric nutrition versus control. It is a nested cohort study of participants enrolled in a randomized controlled clinical trial that compared intensive to conventional insulin therapy. The clinical outcomes were analysed according to tertiles of caloric administration. | |
| Study of whole‐body protein turnover with d5‐phenylalanine and 13C.leucine tracers. The only clinical parameter evaluated was nitrogen balance. | |
| Non‐randomized nor quasi‐randomized controlled trial. Retrospective study | |
| Not primarily hypocaloric nutrition support study; the goal was to evaluate caloric intake and tolerability of 2 early enteral nutrition protocols in which the optimal flow rate was introduced either immediately or gradually. | |
| Non‐randomized or quasi‐randomized controlled trial. Retrospective study | |
| Not hypocaloric nutrition support study. Not randomized clinical trial (cohort study) | |
| Multicentre, randomized, single‐blind clinical trial in critically‐ill adults with relative contraindications to early enteral nutrition. Random allocation to pragmatic standard care or early parenteral nutrition. The objective was different from prescribed hypocaloric nutrition (determine if early parenteral nutrition alters outcomes). No numerical data of calories administered to the groups (only in 1 figure). | |
| Hypocaloric nutrition support was not evaluated. Their goal was to evaluate if volume‐based enteral nutrition causes less caloric deficit than rate‐base feeding in critically‐ill ventilated participants. | |
| Not hypocaloric nutrition support trial. Open‐label, cross‐over trial in critically‐ill people with acute renal failure and renal replacement therapy, comparing iso‐nitrogenous parenteral nutrition providing 30 and 40 kcal/kg/day (normocaloric versus hypercaloric parenteral nutrition) | |
| Not hypocaloric nutrition support trial. They compared isocaloric enteral nutrition with less fat (but more carbohydrates) in people with burns. | |
| Non‐randomized or quasi‐randomized controlled trial assessing hypocaloric nutrition versus control. During 3 days, the participants received randomly 4 different types of parenteral nutrition (2 types of amino acids and 2 different doses of glucose). The authors only assessed metabolic outcomes (no clinical outcomes). | |
| Retrospective study to evaluate 3 different caloric regimes on the incidence of hyperglycaemia and hypoglycaemia in critically‐ill participants on intensive insulin treatment | |
| Not a prospective controlled trial of hypocaloric nutrition support. Prospective study to evaluate the proportion of participants meeting their caloric goals with the implementation of an evidence‐based enteral nutrition protocol. | |
| Hypocaloric nutrition support was not evaluated against normo‐ or hypercaloric feeding. Prospective controlled randomized trial realized exclusively in ventilated participants with acute organophosphate poisoning, to evaluate if enteral nutrition could be possible (due to the treatment with high dose of atropine) and had different clinical outcomes than the participants on intravenous fluids | |
| Not randomized trial to study the metabolic effects of different caloric regimens in medical participants with multiple organ failures. The participants received 7 parenteral nutrition regimens with different amounts of calories, carbohydrates, amino‐acids and lipids, for 12 hours each regimen. | |
| Single‐blinded randomized clinical trial of 50 consecutive participants requiring parenteral nutritional support; permissive underfeeding in participants requiring parenteral nutrition. Participants were randomized to receive either normocaloric or hypocaloric feeding (respectively 100% vs 60% of estimated requirements). The primary end point was septic complication and the secondary end points included the metabolic, physiological and clinical outcomes to the 2 feeding protocols. Only 26% (12 out of 46) of included participants were ICU participants and the results did not distinguish between ICU and non‐ICU participants. | |
| Hypocaloric nutrition support was not evaluated. They assess clinical results with 2 different calories/protein relationships. | |
| Not critically‐ill participants . Surgical participants (hemicolectomy, sigmoid colectomy) to assess if hypocaloric nutrition could induce anabolism in participants with perioperative epidural analgesia. | |
| Hypocaloric nutrition support was not evaluated. The aim of the study was the evaluation of 2 nutrition support programmes: isocalorically right from the beginning compared with a hypocaloric beginning (50% of the dose in the first day, 75% the second day and 100% from the third day): abstract with no results of the clinical outcomes. |
Abbreviations:
kcal = kilocalories; kg = kilograms
Characteristics of ongoing studies [ordered by study ID]
Jump to:
| Trial name or title | Hypocaloric vs full‐energy enteral feeding in critically ill patients guided by indirect calorimetry, a prospective, blinded, randomized controlled trial |
| Methods | Study design: randomized controlled double‐blind trial with measurement of REE by indirect calorimetry to establish the exact amount of calories to be delivered to the intervention and control groups |
| Participants | Inclusion criteria
Exclusion criteria
|
| Interventions | Group 1 hypocaloric feeding group
Full energy feeding group
|
| Outcomes | Primary outcomes
Secondary outcomes
|
| Starting date | September 2012 |
| Contact information | Arie Soroksky: [email protected] (Israel) |
| Notes | Unknown state of the trial up to the end of June 2016. The principal investigator did not answer a question about the state of the trial. Clinical trial record states: (quote:) "the recruitment status of this study is unknown. The completion date has passed and the status has not been verified in more than two years." "Verified August 2012 by Soroksky Arie, Wolfson Medical Center. Recruitment status was: not yet recruiting" |
| Trial name or title | Hypocaloric high‐protein enteral nutrition improves glucose management in critically ill patients |
| Methods | Study design: prospective, randomized, multicenter clinical trial Settings and countries: ICU of 7 academic centres at USA and Canada. In USA: Wake Forest University, Winston‐Salem, North Carolina; University of Kentucky, Lexington, Kentucky; Emory University, Atlanta, Georgia; Medicine, University of Chicago, Hinsdale, Illinois; Pulmonary Medicine, Regions Hospital, St Paul, Minnesota; Vanderbilt University, Nashville, Tennessee. In Canada: Kingston Hospital, Kingston, Ontario. Funding: Nestlé Health Science |
| Participants | Inclusion criteria
Exclusion criteria
Sample size: calculated sample size of 100 participants per group, based in a reduction of “out‐of‐range” glycaemic events and their standard deviation (glucose variability). Sample size of each arm of the study not reported. “Ninety‐eight subjects were randomized into the study at the time of interim analysis. Of these subjects, 40 had at least 5 days of data collected. The remaining subjects withdrew primarily due to removal of the feeding tube” Age (years, mean ± SD): Group 1: hypocaloric: 60.7 ± 15.07; Group 2: 62.6 ± 12.09 Sex (% of women): Group 1: 42.9; Group 2: 55.1 Primary disease of the participants. Not reported Disease severity: APACHE II score (mean ± SD). Group 1: 25.1 ± 9.0; Group 2: 26.3 ± 9.24 Nutrition status: BMI (kg/m2; mean ± SD). Group 1: 33.7 ± 4.57; Group 2: 32.5 ± 5.65 Mechanical ventilation: not available Comorbidities: not available Level of inflammation: not available |
| Interventions | Group 1 hypocaloric (n = not available)
Group 2 (n = not available)
Co‐interventions In both study groups the quantity of the assigned formula was enough to provide 1.5 grams of protein/kg ideal body weight/day |
| Outcomes | Primary endpoint
Other endpoints
Outcomes and time points: not clearly defined Subgroups: not available |
| Starting date | Not available |
| Contact information | [email protected]. We contacted the study author and he replied that he would send us the study results. |
| Notes | An interim analysis was scheduled when 40 participants completed at least 5 days of data collection. All the current information comes from the abstract of a congress presentation (ASPEN, CNW, Orlando, Florida, 18 to 21 February, 2017) regarding the preliminary analysis of the intention‐to‐treat data. |
Abbreviations:
APACHE = Acute Physiology And Chronic Health Evaluation II; BMI = Body Mass Index; ICU = Intensive Care Unit; REE = resting energy expenditure; SD = standard deviation; μg/kg/min = micrograms/kilograms/minute
Data and analyses
| Outcome or subgroup title | No. of studies | No. of participants | Statistical method | Effect size |
| 1 Mortality in hospital Show forest plot | 9 | Risk Ratio (M‐H, Fixed, 95% CI) | Totals not selected | |
| Analysis 1.1  Comparison 1 Hypocaloric nutrition (intervention) vs. Control, Outcome 1 Mortality in hospital. | ||||
| 2 Mortality in ICU Show forest plot | 4 | Risk Ratio (M‐H, Fixed, 95% CI) | Totals not selected | |
| Analysis 1.2  Comparison 1 Hypocaloric nutrition (intervention) vs. Control, Outcome 2 Mortality in ICU. | ||||
| 3 Mortality at 30 days Show forest plot | 7 | Risk Ratio (M‐H, Fixed, 95% CI) | Totals not selected | |
| Analysis 1.3  Comparison 1 Hypocaloric nutrition (intervention) vs. Control, Outcome 3 Mortality at 30 days. | ||||
| 4 Length of Hospital stay (days) Show forest plot | 10 | Mean Difference (IV, Random, 95% CI) | Totals not selected | |
| Analysis 1.4  Comparison 1 Hypocaloric nutrition (intervention) vs. Control, Outcome 4 Length of Hospital stay (days). | ||||
| 5 Length of ICU stay (days) Show forest plot | 11 | Mean Difference (IV, Random, 95% CI) | Totals not selected | |
| Analysis 1.5  Comparison 1 Hypocaloric nutrition (intervention) vs. Control, Outcome 5 Length of ICU stay (days). | ||||
| 6 Infectious complications Show forest plot | 10 | Risk Ratio (M‐H, Random, 95% CI) | Totals not selected | |
| Analysis 1.6  Comparison 1 Hypocaloric nutrition (intervention) vs. Control, Outcome 6 Infectious complications. | ||||
| 7 Length of mechanical ventilation (days) Show forest plot | 12 | Mean Difference (IV, Random, 95% CI) | Totals not selected | |
| Analysis 1.7  Comparison 1 Hypocaloric nutrition (intervention) vs. Control, Outcome 7 Length of mechanical ventilation (days). | ||||
| 8 Non‐infectious complications (diarrhoea) Show forest plot | 3 | Risk Ratio (M‐H, Random, 95% CI) | Totals not selected | |
| Analysis 1.8  Comparison 1 Hypocaloric nutrition (intervention) vs. Control, Outcome 8 Non‐infectious complications (diarrhoea). | ||||
| 9 Hyperglycaemia Show forest plot | 6 | Risk Ratio (M‐H, Random, 95% CI) | Totals not selected | |
| Analysis 1.9  Comparison 1 Hypocaloric nutrition (intervention) vs. Control, Outcome 9 Hyperglycaemia. | ||||
| 10 Hypoglicaemia Show forest plot | 5 | Risk Ratio (M‐H, Fixed, 95% CI) | Totals not selected | |
| Analysis 1.10  Comparison 1 Hypocaloric nutrition (intervention) vs. Control, Outcome 10 Hypoglicaemia. | ||||
| 11 Nitrogen balance (g/day) Show forest plot | 3 | Mean Difference (IV, Random, 95% CI) | Totals not selected | |
| Analysis 1.11  Comparison 1 Hypocaloric nutrition (intervention) vs. Control, Outcome 11 Nitrogen balance (g/day). | ||||
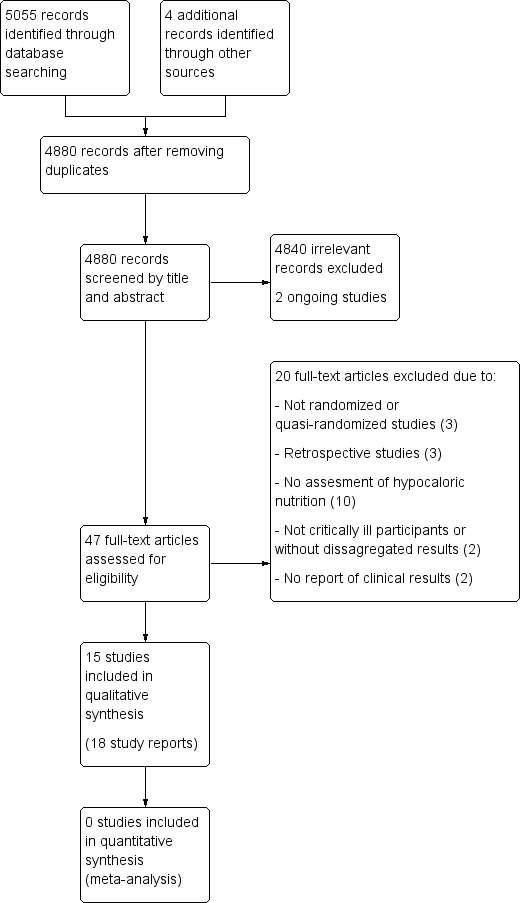
Updated study flow diagram, 20 June 2017
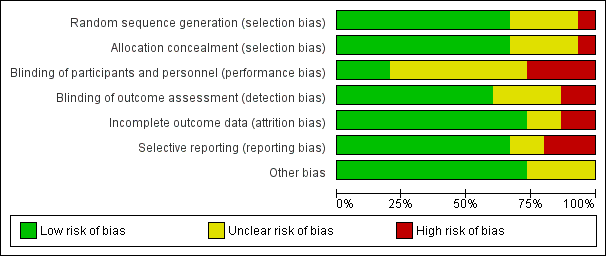
Risk of bias graph: review authors' judgements about each risk of bias domain presented as percentages across all included studies.

Risk of bias summary: review authors' judgements about each risk of bias domain for each included study. Red colour represents high risk of bias; green, low risk of bias; and yellow, unclear risk of bias.
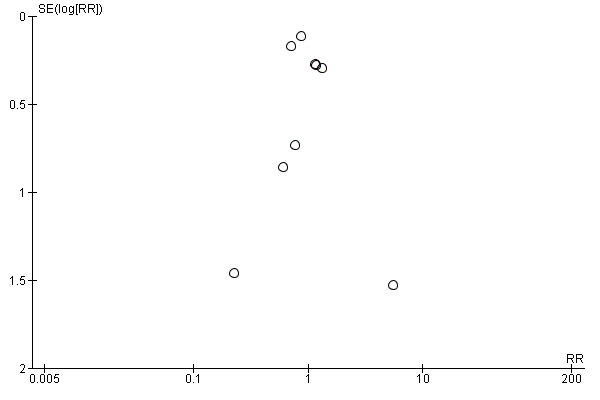
Funnel plot of comparison: 1 Hypocaloric nutrition (intervention) vs. Control, outcome: 1.1 Mortality in hospital.
Comparison 1 Hypocaloric nutrition (intervention) vs. Control, Outcome 1 Mortality in hospital.
Comparison 1 Hypocaloric nutrition (intervention) vs. Control, Outcome 2 Mortality in ICU.
Comparison 1 Hypocaloric nutrition (intervention) vs. Control, Outcome 3 Mortality at 30 days.
Comparison 1 Hypocaloric nutrition (intervention) vs. Control, Outcome 4 Length of Hospital stay (days).
Comparison 1 Hypocaloric nutrition (intervention) vs. Control, Outcome 5 Length of ICU stay (days).
Comparison 1 Hypocaloric nutrition (intervention) vs. Control, Outcome 6 Infectious complications.
Comparison 1 Hypocaloric nutrition (intervention) vs. Control, Outcome 7 Length of mechanical ventilation (days).
Comparison 1 Hypocaloric nutrition (intervention) vs. Control, Outcome 8 Non‐infectious complications (diarrhoea).
Comparison 1 Hypocaloric nutrition (intervention) vs. Control, Outcome 9 Hyperglycaemia.
Comparison 1 Hypocaloric nutrition (intervention) vs. Control, Outcome 10 Hypoglicaemia.
Comparison 1 Hypocaloric nutrition (intervention) vs. Control, Outcome 11 Nitrogen balance (g/day).
| Hypocaloric nutrition compared to control for critically‐ill adults | |||
| Patient or population: critically‐ill adults Comparison: control nutritional support with a higher caloric intake than the 'intervention' group | |||
| Outcomes | Effect estimate (range of results of individual studies) | N of Participants | Quality of the evidence |
| Mortality in hospital: death occurring during the hospital stay | Range of risk ratios from 0.23 to 5.54a | 1775 (9 studies) | ⊕⊕⊝⊝ |
| Mortality in ICU: death occurred during the ICU stay | Range of risk ratios from 0.81 to 5.54a | 1291 | ⊕⊕⊝⊝ |
| Mortality at 30 days: 28 to 30 days all‐cause mortality | Range of risk ratios from 0.79 to 3.00a | 2611 | ⊕⊕⊝⊝ |
| Length of hospital stay: days stayed in the hospital | Range of length of hospital stay from 15.70 days lower to 10.70 days highera | 1677 | ⊕⊝⊝⊝ |
| Length of ICU stay: days stayed in the ICU | Range of length of ICU stay from 11.00 days lower to 5.40 days highera | 2942 | ⊕⊝⊝⊝ |
| Infectious complications: events of any type of infectious complications occurred during the hospital stay, registered by the study authors according to their diagnostic criteria of infections. | Range of risk ratios from 0.54 to 2.54a | 2804 | ⊕⊝⊝⊝ |
| Length of mechanical ventilation: days on mechanical ventilation during ICU stay | Range of mean differences: 13.20 days lower to 8.36 days highera | 3000 (12 studies) | ⊕⊝⊝⊝ |
| GRADE Working Group grades of evidence | |||
| aResults were not combined due to clinical heterogeneity. | |||
| Study ID | Type of participants Primary outcomes | Arm | Number of ICU participants | APACHE II score mean ± SD | Route (enteral or parenteral) | Duration of PN or EN (days) | Mechanical ventilation (% of participants) | ICU mortality % | Hospital mortality % |
| Surgical participants with PN requirement Incidence/severity hyperglycaemia and insulin received by the participants | Hypoc. | 8 (other 12 non‐ICU) | 20 ± 9 | Parenteral | 6 (4 to 10) | 100 | Not reported | Not reported | |
| Control | 10 (other 10 non‐ICU) | 19 ± 11 | 7 (5 to 10) | 80 | |||||
| Medical (mainly) and surgical participants with EN. 2 x 2 factorial trial with Intensive Insuline therapy 28 days all‐cause mortality | Hypoc. | 120 | 25 ± 8 | Enteral | Not reported | 99 | 18 | 30 | |
| Control | 120 | 25 ± 8 | 99 | 22 | 43 | ||||
| Critically‐ill participants (75% medical) 90‐day all‐cause mortality | Hypoc. | 448 | 21 ± 7.9 | Enteral | 9.1 ± 4.6 | 97.3 | 16.1 | 24.2 | |
| Control | 446 | 21 ± 8.2 | 9.4 ± 4.4 | 96.2 | 19.1 | 27.6 | |||
| Trauma participants with PN requirement Length of hospital stay, length of stay in the ICU, number of days on mechanical ventilation and infectious complications. | Hypoc. | 27 | 22 ± 5 | Parenteral | 10 | Not reported | 7.4 | Not reported | |
| Control | 30 | 23 ± 6 | 10 | 0 | |||||
| Critically‐ill surgical participants Hospital‐acquired infection | Hypoc. | 41 | 16.6 ± 0.9 | Enteral & parenteral | 12.6 ± 2.8 | 68 | N/A | 7.3 | |
| Control | 42 | 17.3 ± 0.8 | 10.4 ± 1.1 | 57 | N/A | 9.5 | |||
| Obese participants with PN requirement. Predominantly surgical diseases Achievement of nitrogen balance | Hypoc. | 6 (other 10 non‐ICU) | 13 ± 5 | Parenteral | 10 ± 3 | Not reported | Not reported | 0 | |
| Control | 7 (other 7 non‐ICU) | 15 ± 5 | 11 ± 2 | 28.6 | |||||
| Medical ICU participants with EN Incidence of ventilator‐associated pneumonia | Hypoc. | 75 | 26 ± 8 | Enteral | 5 ± 6 | 100 | Not reported | 27 | |
| Control | 75 | 25 ± 8 | 10 ± 12 | 100 | 20 | ||||
| Participants with predominantly surgical diseases requiring PN Glycaemic control and Infections | Hypoc. | 21 | not reported | Parenteral | ≥ 5 | 50 | 10 | Not reported | |
| Control | 19 | not reported | ≥ 5 | 33 | 16 | ||||
| Acute lung injury predominantly due to medical diseases (61% and 63% of participants) with EN Ventilator‐free days at study day 28 | Hypoc. | 508 | APACHE III 92 ± 28 | Enteral | 6 | 100 | Not reported | 22.4 | |
| Control | 492 | APACHE III 90 ± 27 | Enteral | 6 | 100 | 19.6 | |||
| Critically‐ill head trauma participants 28 days of all‐cause mortality | Hypoc. | 30 | Not reported | Enteral | 7 | Not reported | Not reported | 10.7a | |
| Control | 30 | 7 | 3.8a | ||||||
| Medical ICU with EN and/or PN requirement Glycaemic control and mortality | Hypoc. | 46 | 31 ± 9 | Enteral & parenteral | 7 | not reported | 22 | 37 | |
| Control | 54 | 28 ± 8 | 7 | 22 | 31 | ||||
| Acute lung injury, predominantly due to medical diseases with EN Ventilator‐free days at study day 28 | Hypoc. | 98 | 27 ± 8 | Enteral | 6 ± 4 | 100 | Not reported | 22 | |
| Control | 102 | 27 ± 7 | 5 ± 3 | 100 | 20 | ||||
| Medical ICU participants with EN requirement Change in SOFA score at 48 hours | Hypoc. | 40 | 14 ± 5 | Enteral | 7 | Not reported | Not reported | Not reported | |
| Control | 40 | 15 ± 6 | |||||||
| Medical ICU participants with EN requirement Change in SOFA score at 48 hours | Hypoc. | 60 | 13.5 ± 6.4 | Enteral | 7 | Not reported | Not reported | 30a | |
| Control | 60 | 13.7 ± 6.8 | 27a | ||||||
| Septic, mechanically ventilated critically‐ill participants 28‐day mortality | Hypocal. | Total sample of 74 participants | Total sample 22 ± 4 | Enteral | Not reported | Not reported | Not reported | Not reported | |
| Control | |||||||||
| a28‐day mortality. EN = Enteral nutrition; ICU = Intensive Care Unit; N/A: not available; PN = Parenteral nutrition; SOFA = Sequential Organ Failure Assessment | |||||||||
| Studies | How data was reported | Hypocaloric (intervention) group | Control group | Calories received by the "hypocaloric" intervention group (kcal/kg/day) | Calories received by the "normocaloric" control group (kcal/kg/day) | Categories denominated by the calories really received in the intervention and the control groups a |
| Total calories/kg/day (median (IQ))b | 26.6 (26.2 to 27.5) | 37 (36.0 to 38.4) | 26.60 (median) | 37.00 (median) | Normocaloric vs hypercaloric | |
| Protein g/kg/day (mean± SD) | 1.61 ± 0.13 | 1.53 ± 0.26 | ||||
| Calories/day (mean ± SD) | 1066.6 ± 306.1 | 1251.7 ± 432.5 | 13.85 | 16.40 | Hypocaloric vs hypocaloric | |
| Protein g/day (mean ± SD) | 47.5 ± 21.2 | 43.6 ± 18.9 | ||||
| Calories/day (mean ± SD) | 835 ± 297 | 1299 ± 2470 | 10.56 | 16.04 | Hypocaloric vs hypocaloric | |
| Protein g/day (mean ± SD) | 57 ± 24 | 59 ± 25 | ||||
| Calories/kg ideal body weight/day (mean ± SD) | 27.4 ± 2 | 34.4 ± 2 | 27.4 (of ideal body weight) | 34.4 (of ideal body weight) | Normocaloric vs. normocaloric | |
| Protein g/kg ideal body weight/day (mean± SD) | 1.6 ± 0.1 | 1.6 ± 0.2 | ||||
| Calories/kg/day (mean ± SD) | 12.3 ± 0.7 | 17.1 ± 1.1 | 12 | 17 | Hypocaloric vs hypocaloric | |
| Protein g/kg/day (mean ± SD) | 1.1 ± 0.1 | 1.1 ± 0.1 | ||||
| Kcal/kg actual body weight/day (mean ± SD) Kcal/kg ideal body weight/day (mean ± SD) | 8.6 ± 2.39 13.88 ± 2.87 | 17.45 ± 4.06 27.99 ± 3.83 | 14.00 (of ideal body weight) | 28.00 (of ideal body weight) | Hypocaloric vs normocaloric | |
| Protein g/kg actual body weight/day (mean ± SD) Protein g/kg ideal body weight/day (mean ± SD) | 1.2 ± 0.2 2.0 ± 0.1 | 1.2 ± 1.2 2.0 ± 0.1 | ||||
| Calories/day (mean ± SD) | 126 ± 115 | 474 ± 400 | 1.53 | 5.81 | Very hypocaloric vs very hypocaloric | |
| Proteins g/day (mean) (mean ± SD) | 5.3 ± 5.3 | 18.7 ± 15.4 | ||||
| Calories/kg/day (mean ± SD) | 14 ± 3 | 18 ± 4 | 14.30 | 18.40 | Hypocaloric vs hypocaloric | |
| Proteins g/kg/day (mean ± SD) | 1.1 ± 0.2 | 1.3 ± 0.2 | ||||
| Calories/day (mean ± SD) | 399 ± 225 | 1365 ± 596 | 4.64 (estimated by kcal/day divided by weight from the baseline table) | 15.69 (estimated by kcal/day divided by weight from the baseline table) | Very hypocaloric vs hypocaloric | |
| Proteins: information not collected | ‐ | ‐ | ||||
| Calories/kg/day (mean ± SD) | Not reported | Not reported | N/A | N/A | N/A | |
| Protein g/kg/day (mean ± SD) | Not reported | Not reported | ||||
| Calories/kg/day (mean ± SD) | 11.3 ± 3.1 | 19.7 ± 5.7 | 11.30 | 19.70 | Hypocaloric vs hypocaloric | |
| Protein | Data not reported | Data not reported | ||||
| Calories/day (mean ± SD of study days 1 to 5) | 300 ± 149 | 1418 ± 686 | 3.60 | 17.31 | Very hypocaloric vs hypocaloric | |
| Proteins g/day (mean ± SD of study days 1 to 5) | 10.9 ± 6.8 | 54.4 ± 33.2 | ||||
| Calories/kg/day (mean ± SD) | 12 ± 3.9 | 14 ± 6.2 | 12.00 | 14.00 | Hypocaloric vs hypocaloric | |
| Protein g/kg/day (mean ± SD) | 1.4 ± 0.44 | 0.76 ± 0.32 | ||||
| Total calories/kg ideal body weight/day (mean ± SD) | 12.6 ± 3.4 | 20.5 ± 5.1 | 13 | 21 | Hypocaloric vs hypocaloric | |
| Protein g/kgIBW/day (mean ± SD) | 1.4 ± 0.4 | 1.4 ± 0.3 | ||||
| Calories/day (mean ± SD) | 962 ± 314 | 1308 ± 513 | Not reported Estimatedc 16.63 kcal/kg/day | Not reported Estimatedc 22.62 kcal/kg/day | Estimatedc Hypocaloric vs normocaloric | |
| Protein g/day (mean ± SD) | 57 ± 24 | 59 ± 25 | Not reported Estimatedc 0.99 g/kg/day | Not reported Estimatedc 1.02 g/kg/day | ||
| aCategories denominated by the amount of calories really received by both study groups, according to the following: very hypocaloric = < 10 kcal/kg/day; hypocaloric = ≥ 10 to < 25 kcal/kg/day; normocaloric = ≥ 25 to < 35 kcal/kg/day; hypercaloric = ≥ 35 kcal/kg/day. BMI = Body Mass Index; g = gram; ICU = Intensive Care Unit; kcal = kilocalories; N/A: not available; SD = standard deviation; vs = versus | ||||||
| Study | Difference in calories between groups (kcal/kg/day) | Hospital mortality (%) IG vs CG | ICU mortality (%) IG vs CG | Mortality at 30 days (%) IG vs CG | Infectious complications (%) IG vs CG | Length of hospital stay (days)a IG vs CG | ICU length of stay (days)a IG vs CG | Length of mechanical ventilation (days)a IG vs CG | Categories denominated by the calories really received in the intervention and the control groupsb |
| 2.00 | N/A | N/A | N/A | N/A | N/A | 9.5 vs 10.4 | 8.5 vs 9.7 | Hypocaloric vs hypocaloric | |
| 2.55 | 30% vs 42.5% | 17.5% vs 21.7% | 18.3% vs 23.3% | 44.2% vs 46.7% | 70.2 vs 67.2 | 11.7 vs 14.5 | 10.6 vs 13.2 | Hypocaloric vs hypocaloric | |
| 4.10 | 9.5% vs 15.8% | N/A | N/A | 28.6% vs 52.6% | 19 vs 17 | N/A | N/A | Hypocaloric vs hypocaloric | |
| 4.28 | 26.7% vs 20% | N/A | N/A | 30.7% vs 49.3% | 16.7 vs 22.9 | 9.8 vs 13.6 | 8.1 vs 12.9 | Very hypocaloric vs very hypocaloric | |
| 5.00 | 7.3% vs 9.5% | N/A | N/A | 56.1% vs 57.1% | 35.2 vs 31 | 16.7 vs 13.6 | 10.8 vs 8.3 | Hypocaloric vs hypocaloric | |
| 5.48 | 24.2% vs 27.6% | 16.1% vs 19.1% | 20.8% vs 21.8% | 35.9% vs 37.9% | 48.3 vs 54.4 | 15.8 vs 16.4 | 11.3 vs 13.5 | Hypocaloric vs hypocaloric | |
| 7.00 | 7.4% vs 0% | 7.4% vs 0% | N/A | 48.2% vs 73.3% | 27 vs 39 | 18 vs 29 | 15 vs 27 | Normocaloric vs normocaloric | |
| 7.90 | N/A | N/A | 30% vs 26.7% | N/A | N/A | 13.2 vs 13.5 | 10.8 vs 10.8 | Hypocaloric vs hypocaloric | |
| 8.40 | 37% vs 31.5% | 21.7% vs 22.2% | 39.1% vs 33.3% | 28.3% vs 11.1% | 38.1 vs 27.4 | 22.4 vs 17 | 20.7 vs 12.4 | Hypocaloric vs hypocaloric | |
| 10.40 | N/A | N/A | N/A | 25% vs 10% | 23.4 vs 27.8 | 16.8 vs 23 | 11.1 vs 20.3 | Normocaloric vs hypercaloric | |
| 11.05 | N/A | N/A | 19.5% vs 19.3% | 18.9% vs 16.1% | N/A | 11.5 vs 11 | 10.5 vs 10.2 | Very hypocaloric vs hypocaloric | |
| 13.71 | 22.4% vs 19.6% | N/A | 22.4% vs 19.6% | 30.6% vs 32.4% | N/A | 8.1 vs 7.6 | 5.7 vs 6.2 | Very hypocaloric vs hypocaloric | |
| 14.00 | 0% vs 29% | N/A | N/A | N/A | 48 vs 45 | N/A | N/A | Hypocaloric vs normocaloric | |
| N/A | N/A | N/A | 10% vs 3.3% | N/A | 19.9 vs 35.6 | N/A | 4.7 vs 17.9 | N/A | |
| N/A | N/A | N/A | 18.4% vs 28.9% | N/A | N/A | N/A | N/A | Hypocaloric vs normocaloric | |
| aLengths of hospital, ICU stays and of mechanical ventilation presented in mean days. IG = Intervention Group; CG = Control Group; N/A = Not available; vs = versus | |||||||||
| Subgroup | N participants (n studies) | Subgroup testing |
| 1. Nutrition status | ||
| 1.1. Length of hospital stay | ||
| Obese | 13 (1 RCT) | I2 = 0%, P = 0.76 |
| General | 1664 (9 RCTs) | |
| 2. Route of nutrition support | ||
| 2.1. Length of hospital stay | ||
| Parenteral | 150 (4 RCTs) | I2 = 0%, P = 0.72 |
| Enteral | 1725 (6 RCTs) | |
| 2.2. Length of ICU stay | ||
| Parenteral | 75 (2 RCTs) | I2 = 83.3%, P < 0.01 |
| Enteral | 2867 (9 RCTs) | |
| 2.3. Infectious complications | ||
| Parenteral | 137 (3 RCTs) | I2 = 0%, P = 0.35 |
| Enteral | 2667 (7 RCTs) | |
| 2.4. Length of mechanical ventilation | ||
| Parenteral | 73 (2 RCTs) | I2 = 85.4%, P < 0.01 |
| Enteral | 2927 (10 RCTs) | |
| 3. Type of participant | ||
| 3.1. Length of hospital stay | ||
| Surgical participants | 223 (5 RCTs) | I2 = 0%, P = 0.55 |
| Medical participants | 1354 (5 RCTs) | |
| 3.2. Length of ICU stay | ||
| Surgical participants | 158 (3 RCTs) | I2 = 0%, P = 0.52 |
| Medical participants | 2784 (8 RCTs) | |
| 3.3. Infectious complications | ||
| Surgical participants | 220 (4 RCTs) | I2 = 0%, P = 0.45 |
| Medical participants | 2584 (6 RCTs) | |
| 3.4. Length of mechanical ventilation | ||
| Surgical participants | 156 (3 RCTs) | I2 = 0%, P = 0.45 |
| Medical participants | 2854 (9 RCTs) | |
| 4. Amount of calories received by each study group | ||
| 4.1. Length of hospital stay | ||
| Normo‐hypercaloric | 97 (2 RCTs) | I2 = 84.1%, P < 0.01 |
| Hypocaloric | 1370 (6 RCT) | |
| Very hypocaloric | 150 ( RCT) | |
| 4.2. Length of ICU stay | ||
| Normo‐hypercaloric | 75 (2 RCTs) | I2 = 0%, P = 0.42 |
| Hypocaloric | 1517 (6 RCTs) | |
| Very hypocaloric | 1350 (3 RCTs) | |
| 4.3. Infectious complications | ||
| Normo‐hypercaloric | 97 (2 RCTs) | I2 = 0%, P = 0.94 |
| Hypocaloric | 1357 (5 RCTs) | |
| Very hypocaloric | 1350 (3 RCTs) | |
| 4.4. Length of mechanical ventilation | ||
| Normo‐hypercaloric | 73 (2 RCTs) | I2 = 73.1%, P = 0.02 |
| Hypocaloric | 1517 (6 RCTs) | |
| Very hypocaloric | 1350 (3 RCTs) | |
| RCT = randomized controlled trial; ICU = Intensive care unit | ||
| Outcome or subgroup title | No. of studies | No. of participants | Statistical method | Effect size |
| 1 Mortality in hospital Show forest plot | 9 | Risk Ratio (M‐H, Fixed, 95% CI) | Totals not selected | |
| 2 Mortality in ICU Show forest plot | 4 | Risk Ratio (M‐H, Fixed, 95% CI) | Totals not selected | |
| 3 Mortality at 30 days Show forest plot | 7 | Risk Ratio (M‐H, Fixed, 95% CI) | Totals not selected | |
| 4 Length of Hospital stay (days) Show forest plot | 10 | Mean Difference (IV, Random, 95% CI) | Totals not selected | |
| 5 Length of ICU stay (days) Show forest plot | 11 | Mean Difference (IV, Random, 95% CI) | Totals not selected | |
| 6 Infectious complications Show forest plot | 10 | Risk Ratio (M‐H, Random, 95% CI) | Totals not selected | |
| 7 Length of mechanical ventilation (days) Show forest plot | 12 | Mean Difference (IV, Random, 95% CI) | Totals not selected | |
| 8 Non‐infectious complications (diarrhoea) Show forest plot | 3 | Risk Ratio (M‐H, Random, 95% CI) | Totals not selected | |
| 9 Hyperglycaemia Show forest plot | 6 | Risk Ratio (M‐H, Random, 95% CI) | Totals not selected | |
| 10 Hypoglicaemia Show forest plot | 5 | Risk Ratio (M‐H, Fixed, 95% CI) | Totals not selected | |
| 11 Nitrogen balance (g/day) Show forest plot | 3 | Mean Difference (IV, Random, 95% CI) | Totals not selected | |