Entrenamiento en cinta rodante para pacientes con enfermedad de Parkinson
Referencias
Referencias de los estudios incluidos en esta revisión
Referencias de los estudios excluidos de esta revisión
Referencias de los estudios en espera de evaluación
Referencias de los estudios en curso
Referencias adicionales
Referencias de otras versiones publicadas de esta revisión
Characteristics of studies
Characteristics of included studies [ordered by study ID]
| Methods | Randomised controlled trial | |
| Participants | Country: Spain 58 to 59 years (control and treatment group respectively) Inclusion criteria: being able to walk for 10 min without stopping, walking aids or assistance (on medication) | |
| Interventions | 2 arms: | |
| Outcomes | Outcomes were recorded at baseline and at the end of intervention phase | |
| Notes | ||
| Risk of bias | ||
| Bias | Authors' judgement | Support for judgement |
| Random sequence generation (selection bias) | Unclear risk | method of sequence generation not described by the authors |
| Allocation concealment (selection bias) | Unclear risk | method not described by the authors |
| Blinding of outcome assessment (detection bias) | Unclear risk | blinding not described by the authors |
| Incomplete outcome data (attrition bias) | Unclear risk | no missing outcome data described |
| Methods | Randomised controlled trial | |
| Participants | Country: Turkey | |
| Interventions | 2 arms | |
| Outcomes | Outcomes were recorded at baseline and after 8 weeks of therapy and included
| |
| Notes | ||
| Risk of bias | ||
| Bias | Authors' judgement | Support for judgement |
| Random sequence generation (selection bias) | Unclear risk | method of sequence generation not described by the authors |
| Allocation concealment (selection bias) | Unclear risk | method not described by the authors |
| Blinding of outcome assessment (detection bias) | Low risk | described as blinded to group assignment seemingly |
| Incomplete outcome data (attrition bias) | Low risk | reasons for loss to follow‐up apparently not related to the intervention |
| Methods | Randomised controlled trial | |
| Participants | Country: Australia 61 to 63years (treatment and control group respectively) Inclusion criteria: Hoehn and Yahr stages 1 or 2, age between 30 and 80 years, <2 h of leisure activity per week, stable response to levodopa, subjective gait disturbance Exclusion criteria: disabling dyskinesias or motor fluctuations; freezing while ‘ON’ medication; or significant balance impairment, Mini‐Mental State Examination Score <24, history of falls or dizziness, other neurological/ musculoskeletal/cardiopulmonary or metabolic conditions that affected walking | |
| Interventions | 2 arms | |
| Outcomes | Outcomes were recorded at baseline, after 6 weeks of therapy and after 12 weeks after baseline and included Primary outcome measure:
Secondary outcome measures:
Feasibility outcomes:
| |
| Notes | This is the same study (now published as full text) as in our former review described as Canning 2008. The new reference is therefore Canning 2012 | |
| Risk of bias | ||
| Bias | Authors' judgement | Support for judgement |
| Random sequence generation (selection bias) | Low risk | Quote: “After baseline assessment, a staff member who was not involved in the trial randomly allocated participants to the treadmill training or control group using opaque envelopes pre‐prepared by one investigator” |
| Allocation concealment (selection bias) | Low risk | Quote: “After baseline assessment, a staff member who was not involved in the trial randomly allocated participants to the treadmill training or control group using opaque envelopes pre‐prepared by one investigator” |
| Blinding of outcome assessment (detection bias) | Low risk | Quote:”Efficacy outcome measures were made by an assessor blinded to group allocation” |
| Incomplete outcome data (attrition bias) | Low risk | Missing data was balanced between groups and an intention‐to‐treat analysis has been performed by the authors |
| Methods | Randomised controlled trial | |
| Participants | Country: Italy | |
| Interventions | 2 arms: | |
| Outcomes | Outcomes were recorded at baseline and at the end of intervention phase | |
| Notes | ||
| Risk of bias | ||
| Bias | Authors' judgement | Support for judgement |
| Random sequence generation (selection bias) | Low risk | A software‐generated randomisation list was used |
| Allocation concealment (selection bias) | Low risk | A researcher not involved in the experiment checked for correct patient allocation prior and after the study |
| Blinding of outcome assessment (detection bias) | Low risk | Quote: “A physical therapist who was not involved in the treatment of the enrolled patients and who was blinded to treatment allocation performed all outcome assessments.” |
| Incomplete outcome data (attrition bias) | Low risk | Missing data was balanced between groups and an intention‐to‐treat analysis has been performed by the authors |
| Methods | Randomised controlled trial | |
| Participants | Country: Thailand Aids, good vision and hearing | |
| Interventions | 3 arms: | |
| Outcomes | Outcomes were recorded at baseline and at the end of intervention phase | |
| Notes | ||
| Risk of bias | ||
| Bias | Authors' judgement | Support for judgement |
| Random sequence generation (selection bias) | Unclear risk | method of sequence generation not described by the authors |
| Allocation concealment (selection bias) | Unclear risk | method not described by the authors |
| Blinding of outcome assessment (detection bias) | Low risk | Quote: “All participants were assessed by two physicians and one research assistant, who were blinded to group assignment.” |
| Incomplete outcome data (attrition bias) | Low risk | no missing outcome data |
| Methods | Randomised controlled trial | |
| Participants | Country: USA Exclusion criteria: a score of less than 24 on the MMSE; physician‐determined major medical problems such as cardiac dysfunction; musculoskeletal impairments or excessive pain in any joint that could limit participation in an exercise program; and insufficient endurance and stamina to participate in exercise 3 times a week for a 1‐hour session | |
| Interventions | 3 arms (3) zero‐intensity (no‐exercise) group: six 1 hour education class over 8 weeks | |
| Outcomes | Outcomes were recorded at baseline, after 8 weeks of therapy and included
| |
| Notes | We analysed the high intensity group (1) with low‐intensity group (2) and zero‐intensity group (3) (we collapsed groups 2 and 3 to one pooled control group as in our former version of this review of Mehrholz 2009). | |
| Risk of bias | ||
| Bias | Authors' judgement | Support for judgement |
| Random sequence generation (selection bias) | Low risk | patients self selected a card with eyes closed |
| Allocation concealment (selection bias) | Low risk | Patients were allocated to groups by self selecting a card with eyes closed |
| Blinding of outcome assessment (detection bias) | Low risk | a blinded assessor was used |
| Incomplete outcome data (attrition bias) | Low risk | no missing outcome data |
| Methods | Randomised controlled trial | |
| Participants | Country: Italy | |
| Interventions | 2 arms: | |
| Outcomes | Outcomes were recorded at baseline and at the end of intervention phase 6‐min walk test (distance walked) | |
| Notes | ||
| Risk of bias | ||
| Bias | Authors' judgement | Support for judgement |
| Random sequence generation (selection bias) | Unclear risk | method of sequence generation not described by the authors |
| Allocation concealment (selection bias) | Unclear risk | Not described by the authors |
| Blinding of outcome assessment (detection bias) | High risk | all patients were assessed by same neurologist; no blinding described |
| Incomplete outcome data (attrition bias) | Low risk | no missing outcome data |
| Methods | Randomised controlled trial | |
| Participants | Country: USA Exclusion criteria: impaired cognitive functioning evidenced by a score of 20 or less on the Saint Louis Mental Status Examination, history of other neurologic or vestibular disorders, current orthopedic conditions that would affect the ability to walk, history of PD‐related deep brain stimulation, inability to speak and read English, and unstable medical status and inability to engage in moderate exercise | |
| Interventions | 2 arms | |
| Outcomes | Outcomes were recorded at baseline, after 6 weeks and after 3 months and included:
| |
| Notes | ||
| Risk of bias | ||
| Bias | Authors' judgement | Support for judgement |
| Random sequence generation (selection bias) | Unclear risk | not described |
| Allocation concealment (selection bias) | Unclear risk | not described |
| Blinding of outcome assessment (detection bias) | Low risk | described as blinded assessors |
| Incomplete outcome data (attrition bias) | High risk | not all included participants were analysed |
| Methods | Randomised controlled trial | |
| Participants | Country: Turkey Exclusion criteria: severe cognitive impairment; severe musculoskeletal cardiopulmonary or other systemic disorders | |
| Interventions | 2 arms | |
| Outcomes | Outcomes were recorded at baseline, after 7 weeks and included:
| |
| Notes | ||
| Risk of bias | ||
| Bias | Authors' judgement | Support for judgement |
| Random sequence generation (selection bias) | Low risk | Computer‐generated randomisation list (personal communication) |
| Allocation concealment (selection bias) | Low risk | generated list was used by an independent person to allocate participants (personal communication) |
| Blinding of outcome assessment (detection bias) | Low risk | assessed and tested during "on" phase by the authors who were blind to the randomization |
| Incomplete outcome data (attrition bias) | Low risk | Missing data was balanced between groups and an intention‐to‐treat analysis has been performed by the authors |
| Methods | Randomised cross‐over trial | |
| Participants | Country: Japan | |
| Interventions | 2 arms | |
| Outcomes | Outcomes were recorded at baseline, after 4 weeks and included
| |
| Notes | Raw data kindly provided by the authors were used for all analyses | |
| Risk of bias | ||
| Bias | Authors' judgement | Support for judgement |
| Random sequence generation (selection bias) | Unclear risk | method of sequence generation not described by the authors |
| Allocation concealment (selection bias) | Unclear risk | not described by the authors |
| Blinding of outcome assessment (detection bias) | High risk | no blinding |
| Incomplete outcome data (attrition bias) | Low risk | no missing outcome data |
| Methods | Randomised controlled trial | |
| Participants | Country: Japan Exclusion criteria: on‐off phenomenon | |
| Interventions | 2 arms | |
| Outcomes | Outcomes were recorded at baseline, after 1, 2, 3, 4, 5 and 6 months and included
| |
| Notes | Raw data kindly provided by the authors were used for all analyses Because the details of the studies of Miyai 2000 and Mixai 2002 looks similar at a first look, we contacted the lead Author Prof. Miyai. He clearly stated that these trials are dissimilar and involve different patients. | |
| Risk of bias | ||
| Bias | Authors' judgement | Support for judgement |
| Random sequence generation (selection bias) | Unclear risk | method of sequence generation not described by the authors |
| Allocation concealment (selection bias) | Unclear risk | not described by the authors |
| Blinding of outcome assessment (detection bias) | High risk | no blinding |
| Incomplete outcome data (attrition bias) | Low risk | reasons form missing outcome data unlikely to be related to true outcomes |
| Methods | Randomised controlled trial | |
| Participants | Country: Canada | |
| Interventions | 3 arms: | |
| Outcomes | Outcomes were recorded at baseline, at halving interval at 3 months and at the end of intervention phase at 6 months Parkinson’s Disease Questionnaire (PDQ) | |
| Notes | ||
| Risk of bias | ||
| Bias | Authors' judgement | Support for judgement |
| Random sequence generation (selection bias) | Low risk | Computer‐generated randomisation sequence |
| Allocation concealment (selection bias) | Low risk | Quote: “The allocation sequence was concealed from the project director who assigned participants to groups.” |
| Blinding of outcome assessment (detection bias) | Low risk | Quote: “Participants and research assistants performing the assessments were blind to group assignment” |
| Incomplete outcome data (attrition bias) | Unclear risk | missing outcome data imbalanced between groups but not directly attributable to the intervention; no intention‐to‐treat analysis performed |
| Methods | Randomised controlled trial | |
| Participants | Country: Italy Exclusion criteria: severe dyskinesias or “on‐off” fluctuations; change of PD medication during the study; deficits of somatic sensation involving | |
| Interventions | 3 arms: (3) Physical Therapy group, twelve, 45‐min sessions, three days a week for 4 consecutive weeks | |
| Outcomes | Outcomes were recorded at baseline and at the end of intervention phase 6‐min walk test (distance walked) Spatiotemporal gait parameters (e.g. Stride length, cadence) Unified Parkinson’s Disease Ranking Scale (UPDRS) Motor Score Parkinson's Fatigue Scale | |
| Notes | ||
| Risk of bias | ||
| Bias | Authors' judgement | Support for judgement |
| Random sequence generation (selection bias) | Low risk | randomisation list used |
| Allocation concealment (selection bias) | Low risk | allocation concealment by masked investigator |
| Blinding of outcome assessment (detection bias) | Low risk | blinded rater |
| Incomplete outcome data (attrition bias) | Low risk | no missing outcome data |
| Methods | Randomised cross‐over trial | |
| Participants | Country: Germany Exclusion criteria: paroxysmal motor fluctuations, such as on‐off and wearing‐off phenomena, class B, C, or D exercise | |
| Interventions | 4 arms (2) treadmill training group without increases of gait speed: 1 session treadmill training, 30 minutes (4) control group: resting in a chair for 30 minutes | |
| Outcomes | Outcomes were recorded at baseline, after 1 session of 30 minutes and included
| |
| Notes | Raw data of the authors used for all analyses, data of treadmill groups were collapsed in to one group (n=8) and data of physiotherapy and control group were also collapsed into one group (n=9) | |
| Risk of bias | ||
| Bias | Authors' judgement | Support for judgement |
| Random sequence generation (selection bias) | Low risk | computer generated list |
| Allocation concealment (selection bias) | Low risk | Sealed opaque envelopes were used for allocation procedure. They contained one of four sequences: 'A', 'B', 'C' and 'D' An assistant blinded to group assignment and not involved in patient recruitment allocated all participants by opening one sealed envelope. |
| Blinding of outcome assessment (detection bias) | Low risk | blinded assessor for gait speed and steps |
| Incomplete outcome data (attrition bias) | Low risk | no missing outcome data |
| Methods | Randomised cross‐over trial | |
| Participants | Country: USA Exclusion criteria: not used/not described | |
| Interventions | 2 arms (2) control group: no training | |
| Outcomes | Outcomes were recorded at baseline and after 8 weeks and included
| |
| Notes | ||
| Risk of bias | ||
| Bias | Authors' judgement | Support for judgement |
| Random sequence generation (selection bias) | Unclear risk | method of sequence generation not described by the authors |
| Allocation concealment (selection bias) | Unclear risk | not described by the authors |
| Blinding of outcome assessment (detection bias) | Low risk | Quote: "All testing except for the fall record was conducted by a physical therapist and a |
| Incomplete outcome data (attrition bias) | Low risk | no missing outcome data |
| Methods | Randomised controlled trial | |
| Participants | Country: Italy walk, unassisted or with little assistance, for 25 feet. | |
| Interventions | 2 arms: | |
| Outcomes | Outcomes were recorded at baseline and at the end of intervention phase | |
| Notes | ||
| Risk of bias | ||
| Bias | Authors' judgement | Support for judgement |
| Random sequence generation (selection bias) | Low risk | software based sequence generation |
| Allocation concealment (selection bias) | Low risk | allocation concealment done by blinded professionals as described by the authors |
| Blinding of outcome assessment (detection bias) | Low risk | blinded professionals as described by the authors |
| Incomplete outcome data (attrition bias) | Low risk | no missing outcome data |
| Methods | Randomised controlled trial | |
| Participants | Country: USA onset of at least 2 of 3 cardinal signs, Hoehn & Yahr stage 1 to 3, presence of gait or balance disturbances, Mini‐Mental State Examination >23 | |
| Interventions | 3 arms: | |
| Outcomes | Outcomes were recorded at baseline and at the end of intervention phase | |
| Notes | ||
| Risk of bias | ||
| Bias | Authors' judgement | Support for judgement |
| Random sequence generation (selection bias) | Unclear risk | method of sequence generation not described by the authors |
| Allocation concealment (selection bias) | Unclear risk | not described by the authors |
| Blinding of outcome assessment (detection bias) | Low risk | physicians and staff were blinded as described by the authors |
| Incomplete outcome data (attrition bias) | Low risk | missing outcome data balanced between groups with similar reasons for missing data across groups |
| Methods | Randomised controlled trial | |
| Participants | Country: Taiwan | |
| Interventions | 2 arms: | |
| Outcomes | Outcomes were recorded at baseline and at the end of intervention phase | |
| Notes | ||
| Risk of bias | ||
| Bias | Authors' judgement | Support for judgement |
| Random sequence generation (selection bias) | Low risk | sealed envelopes were drawn by an independent arbiter |
| Allocation concealment (selection bias) | Low risk | sealed envelopes were drawn by an independent arbiter |
| Blinding of outcome assessment (detection bias) | Unclear risk | no blinding was done |
| Incomplete outcome data (attrition bias) | Low risk | missing outcome data balanced between groups with similar reasons for missing data across groups |
Characteristics of excluded studies [ordered by study ID]
| Study | Reason for exclusion |
| Not a randomised controlled trial | |
| Not a randomised controlled trial (personal communication with the authors) | |
| Irrelevant outcome measures | |
| Irrelevant outcome measures | |
| Not a randomised controlled trial | |
| Experimental group received treadmill training together with training on a stationary bicycle or elliptical trainer |
Characteristics of studies awaiting assessment [ordered by study ID]
| Methods | Randomised controlled trial with parallel group assignment |
| Participants | Estimated enrollment: 40, aged between 50 and 80 years Inclusion criteria: Diagnosis of idiopathic Parkinson's Disease Exclusion criteria: Other neurological conditions, artificial joints |
| Interventions | 2 arms: (1) Treadmill training 4 times a week for 4 weeks with a physical therapist (2) Agility training 4 times a week for 4 weeks with a physical therapist |
| Outcomes | Primary Outcome Measures: Dynamic Posturography |
| Notes | This study has been completed. No study results yet posted. |
| Methods | Design: randomised controlled trial |
| Participants | Country: Italy |
| Interventions | 2 arms: |
| Outcomes | Outcomes were recorded at baseline, at the end of intervention phase and at 4‐week and at 12‐week follow‐up |
| Notes | Conference abstract |
Characteristics of ongoing studies [ordered by study ID]
| Trial name or title | Exercise and Parkinson's: Comparing Interventions and Exploring Neural Mechanisms |
| Methods | Randomised controlled trial with parallel group assignment |
| Participants | Estimated enrollment: 120, aged above 30 years Inclusion criteria: Diagnosis of Parkinson's Disease, at least grade 3/5 strength and normal joint ranges of motion in both legs, good vision, independent ambulation for 10 feet with or without assistive devices, normal gross somatosensory function in the feet Exclusion criteria: Other medical condition with exercise being a contraindication, abnormal brain imaging, evidence or history of other neurological or muscular conditions, failed to pass MRI procedure |
| Interventions | 3 arms: (1) Treadmill training 2 times a week (120 min per week) for 12 weeks (2) Tango dance training 2 times a week (120 min per week) for 12 weeks (3) Stretching 2 times a week (120 min per week) for 12 weeks |
| Outcomes | Primary Outcome Measures: Change in Walking Velocity from Baseline to 3 Months Secondary Outcome Measures: Change in Blood oxygen level dependent signal from baseline to 3 months, Change in Mini Balance Evaluation Systems Test (Mini‐BESTest) from baseline to 3 months, Change in PDQ‐39 from baseline to 3 months, Change in Movement Disorder Society Unified Parkinson Disease Rating Scale (UPDRS) Subscale III from baseline to 3 months, Change in Mini Balance Evaluation Systems Test (Mini‐BESTest) from 3 to 6 months, Change in UPDRS Subscale III from 3 months to 6 months, Change in PDQ‐39 from 3 months to 6 months, Change in walking velocity from 3 months to 6 months |
| Starting date | February 2013 |
| Contact information | Washington University School of Medicine St. Louis, Missouri, United States, 63108 Martha Hessler: [email protected] Gammon M Earhart, PhD, PT: [email protected] |
| Notes |
Data and analyses
| Outcome or subgroup title | No. of studies | No. of participants | Statistical method | Effect size |
| 1 Gait speed at the end of the study Show forest plot | 17 | 510 | Mean Difference (IV, Random, 95% CI) | 0.09 [0.03, 0.14] |
| Analysis 1.1  Comparison 1 Treadmill training versus no treadmill training or active control intervention or gait training, Outcome 1 Gait speed at the end of the study. | ||||
| 1.1 Active control group | 14 | 434 | Mean Difference (IV, Random, 95% CI) | 0.07 [0.03, 0.12] |
| 1.2 No intervention control group | 3 | 76 | Mean Difference (IV, Random, 95% CI) | 0.40 [‐0.06, 0.87] |
| 2 stride length (at the end of study; all studies) Show forest plot | 10 | 333 | Mean Difference (IV, Random, 95% CI) | 0.05 [0.01, 0.09] |
| Analysis 1.2  Comparison 1 Treadmill training versus no treadmill training or active control intervention or gait training, Outcome 2 stride length (at the end of study; all studies). | ||||
| 2.1 Active control group | 9 | 315 | Mean Difference (IV, Random, 95% CI) | 0.04 [0.00, 0.09] |
| 2.2 No intervention control group | 1 | 18 | Mean Difference (IV, Random, 95% CI) | 0.11 [‐0.02, 0.24] |
| 3 walking distance in m (at the end of study; all studies) Show forest plot | 10 | 416 | Mean Difference (IV, Random, 95% CI) | 48.91 [‐1.32, 99.14] |
| Analysis 1.3  Comparison 1 Treadmill training versus no treadmill training or active control intervention or gait training, Outcome 3 walking distance in m (at the end of study; all studies). | ||||
| 3.1 Active control group | 9 | 385 | Mean Difference (IV, Random, 95% CI) | 9.48 [‐0.47, 19.42] |
| 3.2 No intervention control group | 1 | 31 | Mean Difference (IV, Random, 95% CI) | 364.0 [294.45, 433.55] |
| 4 cadence (at the end of study; all studies) Show forest plot | 10 | 336 | Mean Difference (IV, Random, 95% CI) | 2.16 [‐0.13, 4.46] |
| Analysis 1.4 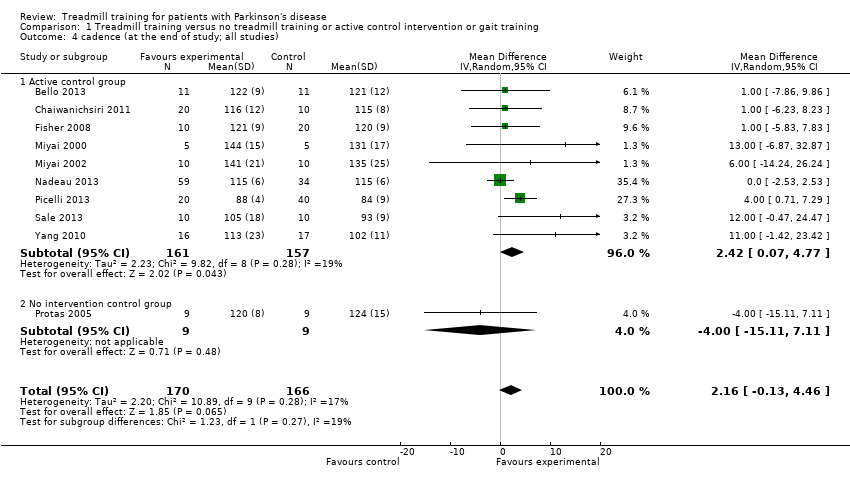 Comparison 1 Treadmill training versus no treadmill training or active control intervention or gait training, Outcome 4 cadence (at the end of study; all studies). | ||||
| 4.1 Active control group | 9 | 318 | Mean Difference (IV, Random, 95% CI) | 2.42 [0.07, 4.77] |
| 4.2 No intervention control group | 1 | 18 | Mean Difference (IV, Random, 95% CI) | ‐4.0 [‐15.11, 7.11] |
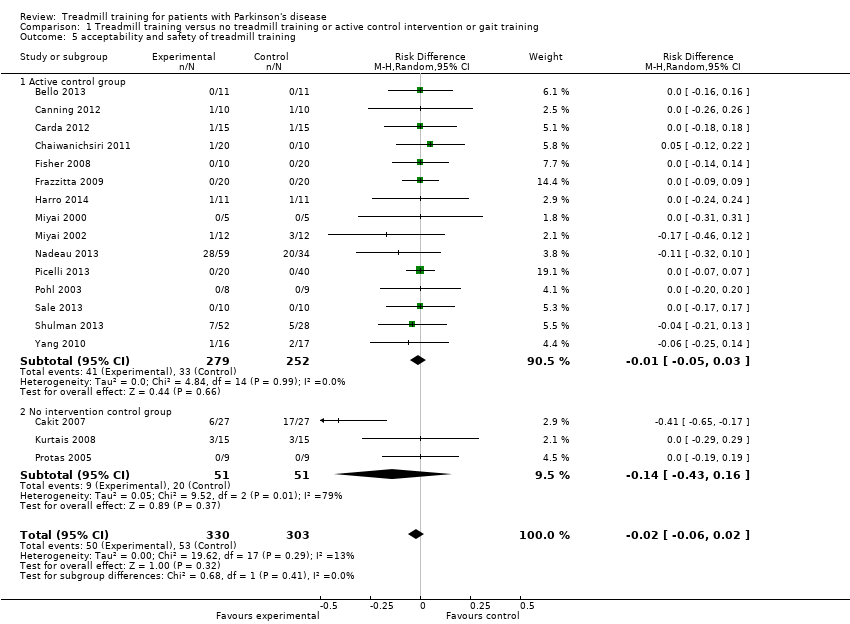
| 5 acceptability and safety of treadmill training Show forest plot | 18 | 633 | Risk Difference (M‐H, Random, 95% CI) | ‐0.02 [‐0.06, 0.02] |
| Analysis 1.5  Comparison 1 Treadmill training versus no treadmill training or active control intervention or gait training, Outcome 5 acceptability and safety of treadmill training. | ||||
| 5.1 Active control group | 15 | 531 | Risk Difference (M‐H, Random, 95% CI) | ‐0.01 [‐0.05, 0.03] |
| 5.2 No intervention control group | 3 | 102 | Risk Difference (M‐H, Random, 95% CI) | ‐0.14 [‐0.43, 0.16] |
| Outcome or subgroup title | No. of studies | No. of participants | Statistical method | Effect size |
| 1 Gait speed Show forest plot | 17 | Mean Difference (IV, Random, 95% CI) | Subtotals only | |
| Analysis 2.1  Comparison 2 Sensitivity analysis: Treadmill training versus no treadmill training, Outcome 1 Gait speed. | ||||
| 1.1 All studies | 16 | 488 | Mean Difference (IV, Random, 95% CI) | 0.10 [0.05, 0.15] |
| 1.2 All studies with random allocation | 8 | 237 | Mean Difference (IV, Random, 95% CI) | 0.08 [0.02, 0.13] |
| 1.3 all studies with concealed allocation | 8 | 237 | Mean Difference (IV, Random, 95% CI) | 0.08 [0.02, 0.13] |
| 1.4 All studies with blinded assessors | 12 | 375 | Mean Difference (IV, Random, 95% CI) | 0.07 [0.00, 0.13] |
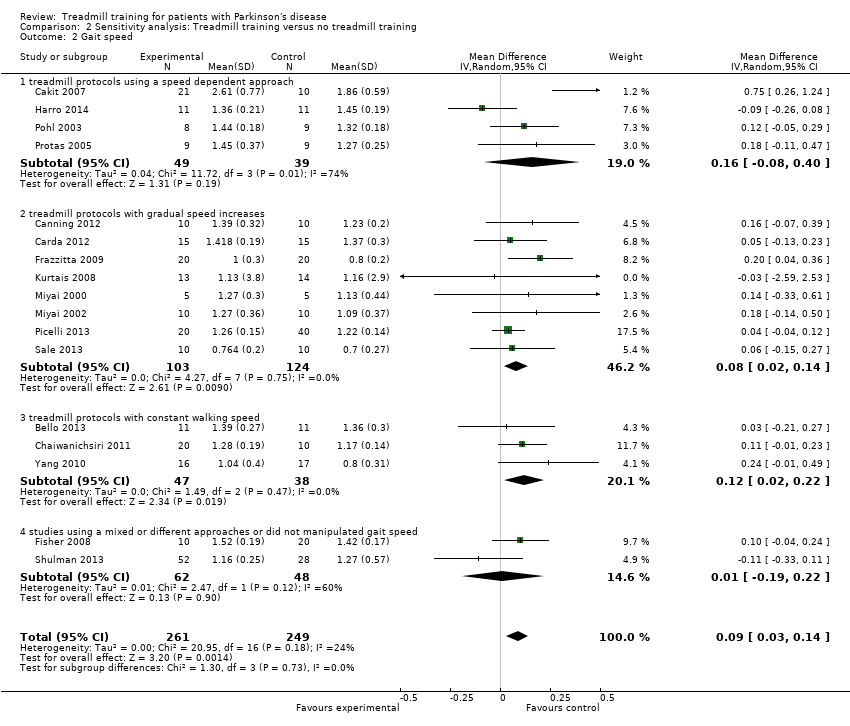
| 2 Gait speed Show forest plot | 17 | 510 | Mean Difference (IV, Random, 95% CI) | 0.09 [0.03, 0.14] |
| Analysis 2.2  Comparison 2 Sensitivity analysis: Treadmill training versus no treadmill training, Outcome 2 Gait speed. | ||||
| 2.1 treadmill protocols using a speed dependent approach | 4 | 88 | Mean Difference (IV, Random, 95% CI) | 0.16 [‐0.08, 0.40] |
| 2.2 treadmill protocols with gradual speed increases | 8 | 227 | Mean Difference (IV, Random, 95% CI) | 0.08 [0.02, 0.14] |
| 2.3 treadmill protocols with constant walking speed | 3 | 85 | Mean Difference (IV, Random, 95% CI) | 0.12 [0.02, 0.22] |
| 2.4 studies using a mixed or different approaches or did not manipulated gait speed | 2 | 110 | Mean Difference (IV, Random, 95% CI) | 0.01 [‐0.19, 0.22] |

Study flow diagram.

Risk of bias summary: review authors' judgements about each risk of bias item for each included study.
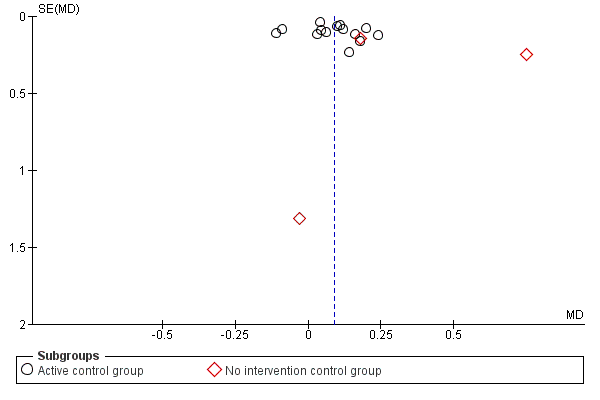
Funnel plot of comparison: 1 Treadmill training versus no treadmill training or active control intervention or gait training, outcome: 1.1 Gait speed at the end of the study.

Funnel plot of comparison: 1 Treadmill training versus no treadmill training or active control intervention or gait training, outcome: 1.2 stride length (at the end of study; all studies).

Comparison 1 Treadmill training versus no treadmill training or active control intervention or gait training, Outcome 1 Gait speed at the end of the study.

Comparison 1 Treadmill training versus no treadmill training or active control intervention or gait training, Outcome 2 stride length (at the end of study; all studies).

Comparison 1 Treadmill training versus no treadmill training or active control intervention or gait training, Outcome 3 walking distance in m (at the end of study; all studies).

Comparison 1 Treadmill training versus no treadmill training or active control intervention or gait training, Outcome 4 cadence (at the end of study; all studies).
Comparison 1 Treadmill training versus no treadmill training or active control intervention or gait training, Outcome 5 acceptability and safety of treadmill training.

Comparison 2 Sensitivity analysis: Treadmill training versus no treadmill training, Outcome 1 Gait speed.
Comparison 2 Sensitivity analysis: Treadmill training versus no treadmill training, Outcome 2 Gait speed.
| Treadmill training versus no treadmill training or active control intervention or gait training for patients with Parkinson's disease | ||||||
| Patient or population: patients with patients with Parkinson's disease | ||||||
| Outcomes | Illustrative comparative risks* (95% CI) | Relative effect | No of Participants | Quality of the evidence | Comments | |
| Assumed risk | Corresponding risk | |||||
| Control | Treadmill training versus no treadmill training or active control intervention or gait training | |||||
| Gait speed at the end of the study ‐ Active control group (co‐interventions were similar in both groups) | The mean gait speed at the end of the study ‐ active control group (co‐interventions were similar in both groups) in the control groups was | The mean gait speed at the end of the study ‐ active control group (co‐interventions were similar in both groups) in the intervention groups was | 434 | ⊕⊕⊕⊝ | ||
| Gait speed at the end of the study ‐ No interventioncontrol group (co‐interventions were not similar in both groups) | The mean gait speed at the end of the study ‐ no intervention control group (co‐interventions were not similar in both groups) in the control groups was | The mean gait speed at the end of the study ‐ no intervention control group (co‐interventions were not similar in both groups) in the intervention groups was | 76 | ⊕⊝⊝⊝ | ||
| walking distance in m (at the end of study; all studies) ‐ Active control group (co‐interventions were similar in both groups) | The mean walking distance in m (at the end of study; all studies) ‐ active control group (co‐interventions were similar in both groups) in the control groups was | The mean walking distance in m (at the end of study; all studies) ‐ active control group (co‐interventions were similar in both groups) in the intervention groups was | 385 | ⊕⊕⊝⊝ | ||
| walking distance in m (at the end of study; all studies) ‐ No intervention control group (co‐interventions were not similar in both groups) | The mean walking distance in m (at the end of study; all studies) ‐ no intervention control group (co‐interventions were not similar in both groups) in the control groups was | The mean walking distance in m (at the end of study; all studies) ‐ no intervention control group (co‐interventions were not similar in both groups) in the intervention groups was | 31 | See comment | ||
| acceptability and safety of treadmill training ‐ Active control group (co‐interventions were similar in both groups) | Study population | See comment | 531 | ⊕⊕⊕⊝ | Risks were calculated from pooled risk differences | |
| 131 per 1000 | 122 per 1000 | |||||
| Moderate | ||||||
| 0 per 1000 | 0 per 1000 | |||||
| acceptability and safety of treadmill training ‐ No intervention control group (co‐interventions were not similar in both groups) | Study population | See comment | 102 | ⊕⊕⊝⊝ | Risks were calculated from pooled risk differences | |
| 392 per 1000 | 255 per 1000 | |||||
| Moderate | ||||||
| 200 per 1000 | 130 per 1000 | |||||
| *The basis for the assumed risk (e.g. the median control group risk across studies) is provided in footnotes. The corresponding risk (and its 95% confidence interval) is based on the assumed risk in the comparison group and the relative effect of the intervention (and its 95% CI). | ||||||
| GRADE Working Group grades of evidence | ||||||
| 1 Final values reported | ||||||
| Study ID | Age, mean (SD) EXP | Age, mean (SD) CON | Hoehn & Yahr stages | mean Duration of disease EXP | mean Duration of disease CON | female/male EXP | female/male CON | Duration of therapy | frequency of training | intensity of training in terms of minutes per session | intensity of training in terms of treadmill speed paradigm |
| 60 (11) | 58 (9) | 1 to 3 | 5 years | 5 years | 4/7 | 5/6 | 5 weeks | 3 times a week | 16' with increments of 4 ' per week | constant and as individually preferred speed | |
| 72 (6)* | 1 to 2 | 6 years* | 15/16* | 8 weeks | not described | 30 | relatively similar to so called speed dependent treadmill approach (Pohl 2002) | ||||
| 61 (6) | 63 (10) | 1 to 2 | 6 years | 6 years | 5/5 | 4/6 | 6 weeks | 4 times a week | 20‐40 | gradually increased speed | |
| 61 (6) | 63 (10) | 1 to 2 | 6 years | 5 years | not described | 6 weeks | 4 times a week | 30 | high, (80% of max), gradually increased | ||
| 68 (5) | 69 (5) | 2 to 3 | 6 years | 4 years | 0/10 | 0/10 | 4 weeks | 3 times a week | 20 | slightly higher than preferred | |
| 64 (15) | 62 (10) | 1 to 2 | 1 year | 1 year | 4/6 | 13/7 | 8 weeks | 3 times a week | 45 | progression of speed in high intensity group/ and low to moderate progression of speed in low intensity group | |
| 71 (8) | 71 (7) | 3 | 13 years | 13 years | 12/8 | 11/9 | 4 weeks | 7 times a week | 20 | 60% of max speed at start, then gradually increased | |
| 65 (9) | 67 (11) | 1 to 3 | 4 years | 9 years | 5/5 | 2/8 | 6 weeks | 3 times a week | 30 | both groups received speed training relatively similar to so called speed dependent approach (Pohl 2002) | |
| 64 (11) | 66 (5) | mean 2.2 to 2.5 | 5 years | 5 years | 7/5 | 5/7 | 6 weeks | 3 times a week | 40 | gradually increased speed | |
| 67 (2)* | 2.5 to 3 | 4 years* | 5/5* | 4 weeks | 3 times a week | 36‐45 | gradually increased speed | ||||
| 70 (2) | 70 (2) | 2.5 to 3 | 4 years | 4.5 years | 6/5 | 4/5 | 4 weeks | 3 times a week | 45 | gradually increased speed | |
| 62 (7) | 64 (6) | 1 to 2 | Not reported | 2/9 | 5/18 | 24 weeks | 3 times a week | 60 | gradually increased speed | ||
| 69 (8) | 68 (9) | 3 | 7 years | 7 years | 14/6 | 23/17 | 4 weeks | 3 times a week | 30 | gradually increased speed | |
| 61 (9) | 61 (9) | 1 to 2.5 | 3 years | 3 years | 3/5 | 2/7 | 1 session | N.a. | 30 | similar to so called speed dependent treadmill approach (Pohl 2002) | |
| 71 (7) | 74 (9) | 2 to 3 | 7 years | 8 years | not described | 8 weeks | 3 times a week | 30 | relatively similar to so called speed dependent treadmill approach (Pohl 2002) | ||
| 68 (9) | 70 (10) | 2.5 to 3.5 | 9 years | 8 years | 5/5 | 6/4 | 4 weeks | 5 times a week | 45 | gradually increased speed | |
| 66 (10) | 65 (11) | 2 to 3 | 6 years | 6 years | 17/32 | 4/18 | 12 weeks | 3 times a week | 30‐50 | no clear speed increases but depending on maximal heart reserve speed was increased | |
| 68 (8) | 66 (11) | 1 to 3 | 5 years | 5 years | 6/9 | 8/7 | 4 weeks | 3 times a week | 30 | constant, comfortable speed | |
| * information not available by group | |||||||||||
| Study ID | active treatment | no interventions | gait training | control group |
| yes | yes | overground gait training, 3 times a week for 5 weeks (72 min a week) | ||
| yes | not described further | |||
| yes | usual care including advice to maintain usual physical activity levels | |||
| yes | yes | robotic gait training, 3 times a week for 4 weeks (120 min a week) | ||
| yes | yes | home walking program, 6 times a week for 4 weeks (180 min a week) | ||
| yes | 1 | (2) low‐intensity group: general or traditional physiotherapy, for 24 sessions in 8 weeks (3) zero‐intensity (no‐exercise) group: six 1 hour education class over 8 weeks | ||
| yes | 1 | traditional rehabilitation with visual and auditory cues, 7 times a week for 4 weeks (140 min a week) | ||
| yes | yes | 6 weeks rhythmic auditory‐cueing with incremental speed increases in small groups of five participants, 30 minutes a session, not described how often a week | ||
| yes | not further described by the authors | |||
| yes | 4 weeks conventional physiotherapy, 45 minutes a day, 3 days a week | |||
| yes | 4 weeks conventional physiotherapy, 45 minutes a day, 3 days a week, with a total of 12 sessions | |||
| yes | low exercise intensity training in seated position, 3 times a week for 24 weeks (180 min a week) | |||
| yes | yes | 3 arms:(1) robotic gait training group, twelve, 45‐min sessions, three days a week for 4 consecutive weeks (3) Physical Therapy group, twelve, 45‐min sessions, three days a week for 4 consecutive weeks | ||
| yes | yes | 4 arms(3) physiotherapy group: 1 session physiotherapy including gait training, 30 minutes (4) control group: resting in a chair for 30 minutes | ||
| yes | no training | |||
| yes | yes | robot‐assisted gait training (device: G‐EO), 5 times a week for 4 weeks (225 min a week) | ||
| yes | stretching and resistance training, 3 times a week for 12 weeks (duration of sessions not described) | |||
| yes | conventional therapy, 3 times a week for 4 weeks (90 min a week) |
| Study ID | U PDRS at baseline | UPDRS at study end | QoL at baseline | Follow‐Up |
| UPDRS motor score | UPDRS motor score | ‐ | no | |
| UPDRS motor score | ‐ | ‐ | no | |
| UPDRS motor score | UPDRS motor score | PDQ‐39 | after 6 weeks | |
| UPDRS motor score | UPDRS motor score | SF‐12 PCS and MCS | after 3, 6 months | |
| ‐ | ‐ | ‐ | after 1 months | |
| UPDRS (total and subscales) | UPDRS (total and subscales) | ‐ | no | |
| UPDRS motor score | ‐ | ‐ | no | |
| ‐ | ‐ | ‐ | 3mo | |
| ‐ | ‐ | ‐ | no | |
| UPDRS (total and subscales) | UPDRS (total and subscales) | ‐ | no | |
| UPDRS (total and subscales) | UPDRS (total and subscales) | ‐ | after 2,3,4,5 and 6 months | |
| UPDRS (total and subscales) | UPDRS (total and subscales) | PDQ‐39 | after 6 months | |
| UPDRS (total) | UPDRS (total) | ‐ | 3 months | |
| UPDRS (total and subscales) | ‐ | ‐ | no | |
| ‐ | ‐ | ‐ | no | |
| UPDRS (total and subscales) | ‐ | ‐ | no | |
| UPDRS (total and subscales) | ‐ | ‐ | no | |
| ‐ | ‐ | ‐ | after 1 months |
| Outcome or subgroup title | No. of studies | No. of participants | Statistical method | Effect size |
| 1 Gait speed at the end of the study Show forest plot | 17 | 510 | Mean Difference (IV, Random, 95% CI) | 0.09 [0.03, 0.14] |
| 1.1 Active control group | 14 | 434 | Mean Difference (IV, Random, 95% CI) | 0.07 [0.03, 0.12] |
| 1.2 No intervention control group | 3 | 76 | Mean Difference (IV, Random, 95% CI) | 0.40 [‐0.06, 0.87] |
| 2 stride length (at the end of study; all studies) Show forest plot | 10 | 333 | Mean Difference (IV, Random, 95% CI) | 0.05 [0.01, 0.09] |
| 2.1 Active control group | 9 | 315 | Mean Difference (IV, Random, 95% CI) | 0.04 [0.00, 0.09] |
| 2.2 No intervention control group | 1 | 18 | Mean Difference (IV, Random, 95% CI) | 0.11 [‐0.02, 0.24] |
| 3 walking distance in m (at the end of study; all studies) Show forest plot | 10 | 416 | Mean Difference (IV, Random, 95% CI) | 48.91 [‐1.32, 99.14] |
| 3.1 Active control group | 9 | 385 | Mean Difference (IV, Random, 95% CI) | 9.48 [‐0.47, 19.42] |
| 3.2 No intervention control group | 1 | 31 | Mean Difference (IV, Random, 95% CI) | 364.0 [294.45, 433.55] |
| 4 cadence (at the end of study; all studies) Show forest plot | 10 | 336 | Mean Difference (IV, Random, 95% CI) | 2.16 [‐0.13, 4.46] |
| 4.1 Active control group | 9 | 318 | Mean Difference (IV, Random, 95% CI) | 2.42 [0.07, 4.77] |
| 4.2 No intervention control group | 1 | 18 | Mean Difference (IV, Random, 95% CI) | ‐4.0 [‐15.11, 7.11] |
| 5 acceptability and safety of treadmill training Show forest plot | 18 | 633 | Risk Difference (M‐H, Random, 95% CI) | ‐0.02 [‐0.06, 0.02] |
| 5.1 Active control group | 15 | 531 | Risk Difference (M‐H, Random, 95% CI) | ‐0.01 [‐0.05, 0.03] |
| 5.2 No intervention control group | 3 | 102 | Risk Difference (M‐H, Random, 95% CI) | ‐0.14 [‐0.43, 0.16] |
| Outcome or subgroup title | No. of studies | No. of participants | Statistical method | Effect size |
| 1 Gait speed Show forest plot | 17 | Mean Difference (IV, Random, 95% CI) | Subtotals only | |
| 1.1 All studies | 16 | 488 | Mean Difference (IV, Random, 95% CI) | 0.10 [0.05, 0.15] |
| 1.2 All studies with random allocation | 8 | 237 | Mean Difference (IV, Random, 95% CI) | 0.08 [0.02, 0.13] |
| 1.3 all studies with concealed allocation | 8 | 237 | Mean Difference (IV, Random, 95% CI) | 0.08 [0.02, 0.13] |
| 1.4 All studies with blinded assessors | 12 | 375 | Mean Difference (IV, Random, 95% CI) | 0.07 [0.00, 0.13] |
| 2 Gait speed Show forest plot | 17 | 510 | Mean Difference (IV, Random, 95% CI) | 0.09 [0.03, 0.14] |
| 2.1 treadmill protocols using a speed dependent approach | 4 | 88 | Mean Difference (IV, Random, 95% CI) | 0.16 [‐0.08, 0.40] |
| 2.2 treadmill protocols with gradual speed increases | 8 | 227 | Mean Difference (IV, Random, 95% CI) | 0.08 [0.02, 0.14] |
| 2.3 treadmill protocols with constant walking speed | 3 | 85 | Mean Difference (IV, Random, 95% CI) | 0.12 [0.02, 0.22] |
| 2.4 studies using a mixed or different approaches or did not manipulated gait speed | 2 | 110 | Mean Difference (IV, Random, 95% CI) | 0.01 [‐0.19, 0.22] |